Notebookcheck Logo

Intel Core i7-3520M vs Intel Core i3-7100U vs Intel Core i7-3940XM

Intel Core i7-3520M

► remove from comparison Intel 3520M

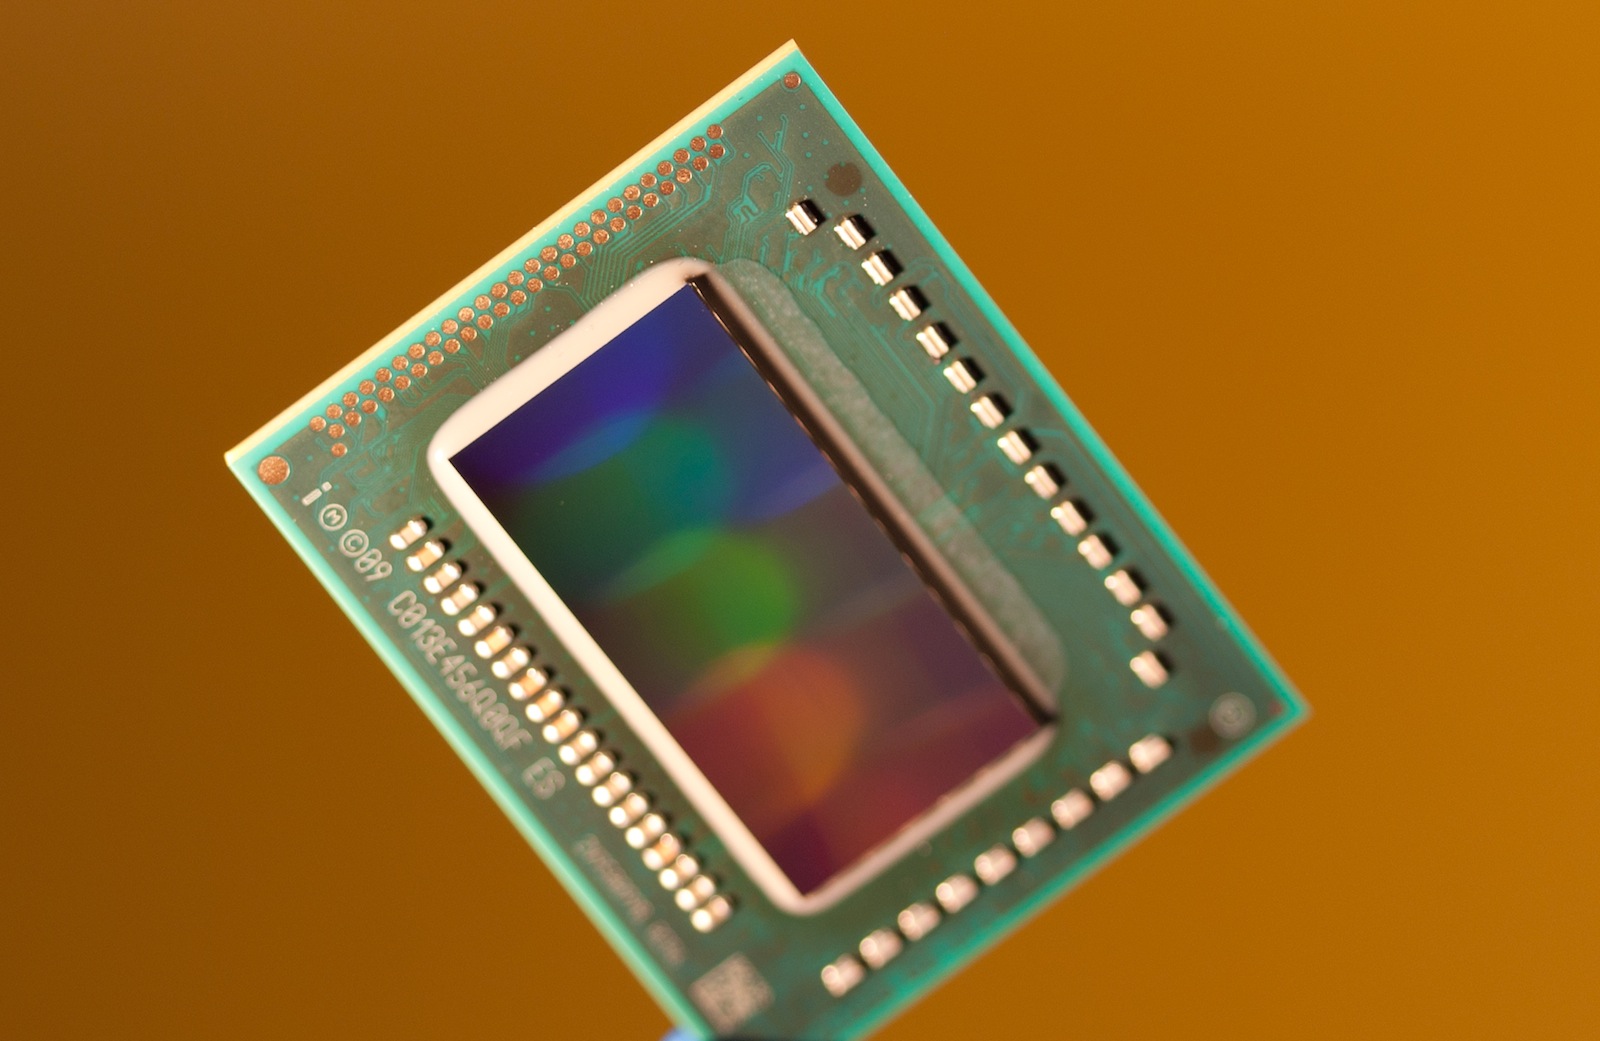
The Intel Core i7-3520M is the fastest dual-core processor for laptops based on the Ivy Bridge architecture at the time of introduction in Q2 2012. Due to Hyperthreading, the two cores can handle up to four threads in parallel leading to better utilization of the CPU. Each core offers a base speed of 2.9 GHz but can dynamically increase clock rates with Turbo Boost up to 3.4 GHz (for 2 active cores) and 3.6 GHz (for 1 active core). As its Sandy-Bridge-based predecessor Core i7-2640M, it offers a 4 MB L3-Cache.

Ivy Bridge is an enhanced die shrink of the Sandy Bridge architecture with improvements on both GPU and CPU performance. The CPUs are produced in 22nm (versus 32nm Sandy Bridge CPUs) and are the first to introduce 3D transistors for increased energy efficiency when compared to similarly clocked Sandy Bridge processors. Other new features are integrated PCI Express 3.0 and  DDR3(L)-1600 support.

The performance of the Core i7-3520M is slightly above a similarly clocked Sandy Bridge processor due to the architectural improvements. As a result, overall performance is about 5 - 10 % above the old i7-2640M (see benchmarks below).

The integrated Intel HD Graphics 4000 offers 16 Execution Units (EUs) clocked at 650 MHz up to 1250 MHz with Turbo Boost, making it one of the fastest variants.

Just like most other Ivy Bridge dual-cores, the i7-3520M is rated at a TDP of 35 W. Therefore, even smaller laptops can use the Core i7.

Intel Core i3-7100U

► remove from comparison Intel i3-7100U

The Intel Core i3-7100U is a dual-core processor of the Kaby Lake architecture. It offers two CPU cores clocked at 2.4 GHz (without Turbo Boost) and integrates HyperThreading to work with up to 4 threads at once. The architectural differences are rather small compared to the Skylake generation, therefore the performance per MHz should be very similar. The SoC includes a dual channel DDR4 memory controller and Intel HD Graphics 620 graphics card (clocked at 300 - 1000 MHz). It is manufactured in an improved 14nm FinFET process at Intel. Compare to the old Skylake Core i3-6100U, the i3-7100U offers a 100 MHz improved clock speed.

 Architecture

Intel basically uses the same micro architecture compared to Skylake, so the per-MHz performance does not differ. The manufacturer only reworked the Speed Shift technology for faster dynamic adjustments of voltages and clocks, and the improved 14nm process allows much higher frequencies combined with better efficiency than before.

Intel Core i7-3940XM

► remove from comparison Intel 3940XM

The Intel Core i7-3940XM is the fastest quad-core processor for laptops (at the time of introduction in September 2012) an successor of the i7-3920XM. Due to Hyperthreading, the four cores can handle up to eight threads in parallel leading to better utilization of the CPU. Each core offers a base speed of 3.0 GHz but can dynamically increase clock rates with Turbo Boost up to 3.7 GHz (for 4 active cores), 3.8 GHz (for 2 active cores) and 3.9 GHz (for 1 active core). Furthermore, the Extreme CPUs offer an unlocked multiplicator for easy overclocking.

Ivy Bridge is an enhanced die shrink of the Sandy Bridge architecture with improvements on both GPU and CPU performance. The CPUs are produced in 22nm (versus 32nm Sandy Bridge CPUs) and are the first to introduce 3D transistors for increased energy efficiency when compared to similarly clocked Sandy Bridge processors. Other new features are integrated PCI Express 3.0 and  DDR3(L)-1600 support.

The performance of the Core i7-3940XM should be slightly above a similarly clocked Sandy Bridge processor due to slight architectural improvements. Because of the higher clock speed, the former champion Core i7-3920XM should be outperformed by about 3%.

The integrated Intel HD Graphics 4000 offers 16 Execution Units (EUs) clocked at 650 MHz up to 1350 MHz with Turbo Boost, making it the fastest variant.

The XM CPUs are rated at a TDP of 55 Watts including graphics card and memory controller and therefore 10 Watt higher than the other quad-core models.  Therefore, the CPU is well-suited for laptops 17-inches or greater.

ModelIntel Core i7-3520MIntel Core i3-7100UIntel Core i7-3940XM
SeriesIntel Core i7Intel Kaby LakeIntel Core i7
CodenameIvy BridgeKaby LakeIvy Bridge
Series: Core i7 Ivy Bridge
Intel Core i7-3940XM3 - 3.9 GHz4 / 8 cores8 MB L3
Intel Core i7-3920XM2.9 - 3.8 GHz4 / 8 cores8 MB L3
Intel Core i7-3840QM2.8 - 3.8 GHz4 / 8 cores8 MB L3
Intel Core i7-3820QM2.7 - 3.7 GHz4 / 8 cores8 MB L3
Intel Core i7-3740QM2.7 - 3.7 GHz4 / 8 cores6 MB L3
Intel Core i7-3720QM2.6 - 3.6 GHz4 / 8 cores6 MB L3
Intel Core i7-3635QM2.4 - 3.4 GHz4 / 8 cores6 MB L3
Intel Core i7-3630QM2.4 - 3.4 GHz4 / 8 cores6 MB L3
Intel Core i7-3615QM2.3 - 3.3 GHz4 / 8 cores6 MB L3
Intel Core i7-3610QM2.3 - 3.3 GHz4 / 8 cores6 MB L3
Intel Core i7-3632QM2.2 - 3.2 GHz4 / 8 cores6 MB L3
Intel Core i7-3612QM2.1 - 3.1 GHz4 / 8 cores6 MB L3
Intel Core i7-3540M3 - 3.7 GHz2 / 4 cores4 MB L3
Intel Core i7-3520M « 2.9 - 3.6 GHz2 / 4 cores4 MB L3
Intel Core i7-3687U2.1 - 3.3 GHz2 / 4 cores4 MB L3
Intel Core i7-3667U2 - 3.2 GHz2 / 4 cores4 MB L3
Intel Core i7-3537U2 - 3.1 GHz2 / 4 cores4 MB L3
Intel Core i7-3517U1.9 - 3 GHz2 / 4 cores4 MB L3
Intel Core i7-3689Y1.5 - 2.6 GHz2 / 4 cores4 MB L3
Intel Core i7-7700K4.2 - 4.5 GHz4 / 8 cores8 MB L3
Intel Core i7-77003.6 - 4.2 GHz4 / 8 cores8 MB L3
Intel Xeon E3-1535M v63.1 - 4.2 GHz4 / 8 cores8 MB L3
Intel Core i7-7920HQ3.1 - 4.1 GHz4 / 8 cores8 MB L3
Intel Core i7-7700T2.9 - 3.8 GHz4 / 8 cores8 MB L3
Intel Core i5-7600K3.8 - 4.2 GHz4 / 4 cores8 MB L3
Intel Xeon E3-1505M v63 - 4 GHz4 / 8 cores8 MB L3
Intel Core i7-7820HQ2.9 - 3.9 GHz4 / 8 cores8 MB L3
Intel Core i7-7820HK2.9 - 3.9 GHz4 / 8 cores8 MB L3
Intel Core i7-7700HQ2.8 - 3.8 GHz4 / 8 cores6 MB L3
Intel Core i5-75003.4 - 3.8 GHz4 / 4 cores6 MB L3
Intel Core i5-7440HQ2.8 - 3.8 GHz4 / 4 cores6 MB L3
Intel Core i7-7567U3.5 - 4 GHz2 / 4 cores4 MB L3
Intel Core i7-7660U2.5 - 4 GHz2 / 4 cores4 MB L3
Intel Core i7-7600U2.8 - 3.9 GHz2 / 4 cores4 MB L3
Intel Core i5-7300HQ2.5 - 3.5 GHz4 / 4 cores6 MB L3
Intel Core i5-7500T2.7 - 3.3 GHz4 / 4 cores6 MB L3
Intel Core i5-7287U3.3 - 3.7 GHz2 / 4 cores4 MB L3
Intel Core i7-7560U2.4 - 3.8 GHz2 / 4 cores4 MB L3
Intel Core i5-7267U3.1 - 3.5 GHz2 / 4 cores4 MB L3
Intel Core i5-7360U2.3 - 3.6 GHz2 / 4 cores4 MB L3
Intel Core i7-7500U2.7 - 3.5 GHz2 / 4 cores4 MB L3
Intel Core i5-7300U2.6 - 3.5 GHz2 / 4 cores3 MB L3
Intel Core i5-7260U2.2 - 3.4 GHz2 / 4 cores4 MB L3
Intel Core i5-7200U2.5 - 3.1 GHz2 / 4 cores3 MB L3
Intel Core i3-7100H3 GHz2 / 4 cores3 MB L3
Intel Core i3-7167U2.8 GHz2 / 4 cores3 MB L3
Intel Core i7-7Y751.3 - 3.6 GHz2 / 4 cores4 MB L3
Intel Core i5-7Y571.2 - 3.3 GHz2 / 4 cores4 MB L3
Intel Core i5-7Y541.2 - 3.2 GHz2 / 4 cores4 MB L3
Intel Core i3-7100U « 2.4 GHz2 / 4 cores3 MB L3
Intel Core m3-7Y321 - 3 GHz2 / 4 cores4 MB L3
Intel Pentium Gold 4415U2.3 GHz2 / 4 cores2 MB L3
Intel Core m3-7Y301 - 2.6 GHz2 / 4 cores4 MB L3
Intel Celeron 3965U2.2 GHz2 / 2 cores2 MB L3
Intel Core i3-7020U2.3 GHz2 / 4 cores3 MB L3
Intel Celeron 3867U1.8 GHz2 / 2 cores2 MB L3
Intel Celeron 3865U1.8 GHz2 / 2 cores2 MB L3
Intel Pentium Gold 4425Y1.7 GHz2 / 4 cores2 MB L3
Intel Pentium Gold 4415Y1.6 GHz2 / 4 cores2 MB L3
Intel Pentium Gold 4410Y1.5 GHz2 / 4 cores2 MB L3
Intel Celeron 3965Y1.5 GHz2 / 2 cores2 MB L3
Intel Core i7-3940XM « 3 - 3.9 GHz4 / 8 cores8 MB L3
Intel Core i7-3920XM2.9 - 3.8 GHz4 / 8 cores8 MB L3
Intel Core i7-3840QM2.8 - 3.8 GHz4 / 8 cores8 MB L3
Intel Core i7-3820QM2.7 - 3.7 GHz4 / 8 cores8 MB L3
Intel Core i7-3740QM2.7 - 3.7 GHz4 / 8 cores6 MB L3
Intel Core i7-3720QM2.6 - 3.6 GHz4 / 8 cores6 MB L3
Intel Core i7-3635QM2.4 - 3.4 GHz4 / 8 cores6 MB L3
Intel Core i7-3630QM2.4 - 3.4 GHz4 / 8 cores6 MB L3
Intel Core i7-3615QM2.3 - 3.3 GHz4 / 8 cores6 MB L3
Intel Core i7-3610QM2.3 - 3.3 GHz4 / 8 cores6 MB L3
Intel Core i7-3632QM2.2 - 3.2 GHz4 / 8 cores6 MB L3
Intel Core i7-3612QM2.1 - 3.1 GHz4 / 8 cores6 MB L3
Intel Core i7-3540M3 - 3.7 GHz2 / 4 cores4 MB L3
Intel Core i7-3520M2.9 - 3.6 GHz2 / 4 cores4 MB L3
Intel Core i7-3687U2.1 - 3.3 GHz2 / 4 cores4 MB L3
Intel Core i7-3667U2 - 3.2 GHz2 / 4 cores4 MB L3
Intel Core i7-3537U2 - 3.1 GHz2 / 4 cores4 MB L3
Intel Core i7-3517U1.9 - 3 GHz2 / 4 cores4 MB L3
Intel Core i7-3689Y1.5 - 2.6 GHz2 / 4 cores4 MB L3
Clock2900 - 3600 MHz2400 MHz3000 - 3900 MHz
L1 Cache128 KB128 KB256 KB
L2 Cache512 KB512 KB1 MB
L3 Cache4 MB3 MB8 MB
Cores / Threads2 / 42 / 44 / 8
TDP35 Watt15 Watt55 Watt
Technology22 nm14 nm22 nm
max. Temp.105 °C100 °C105 °C
SocketBGA1023, PGA988BGA1356FCPGA988
FeaturesHD Graphics 4000, DDR3-1600 Memory Controller, HyperThreading, AVX, Quick Sync, VirtualizationDual-Channel DDR4 Memory Controller, HyperThreading, AVX, AVX2, Quick Sync, Virtualization, AES-NIHD Graphics 4000, DDR3(L)-1600 Memory Controller, HyperThreading, AVX, Quick Sync, Virtualization
iGPUIntel HD Graphics 4000 (650 - 1250 MHz)Intel HD Graphics 620 (300 - 1000 MHz)Intel HD Graphics 4000 (650 - 1350 MHz)
Architecturex86x86x86
$346 U.S.$281 U.S.$1096 U.S.
Announced
Manufacturerark.intel.comark.intel.com
Transistors1400 Million
Die Size160 mm2

Benchmarks

Cinebench R15 - Cinebench R15 CPU Multi 64 Bit
min: 256     avg: 257     median: 256.5 (2%)     max: 260 Points
Cinebench R15 - Cinebench R15 CPU Single 64 Bit
min: 86     avg: 94.3     median: 95 (29%)     max: 100 Points
Cinebench R11.5 - Cinebench R11.5 CPU Multi 64 Bit
min: 3     avg: 3.3     median: 3.4 (4%)     max: 3.44 Points
2.9 Points (4%)
min: 7.45     avg: 7.5     median: 7.5 (10%)     max: 7.46 Points
Cinebench R11.5 - Cinebench R11.5 CPU Single 64 Bit
min: 1.41     avg: 1.4     median: 1.5 (36%)     max: 1.47 Points
1 Points (26%)
min: 1.62     avg: 1.6     median: 1.6 (40%)     max: 1.63 Points
Cinebench R10 - Cinebench R10 Rend. Single (32bit)
min: 4408     avg: 4813     median: 4855 (29%)     max: 4903 Points
min: 3871     avg: 3874     median: 3874 (23%)     max: 3877 Points
min: 5246     avg: 5255     median: 5252 (32%)     max: 5267 Points
Cinebench R10 - Cinebench R10 Rend. Multi (32bit)
min: 9112     avg: 10167     median: 10467 (8%)     max: 10605 Points
min: 8718     avg: 8758     median: 8757.5 (6%)     max: 8797 Points
min: 20438     avg: 20582     median: 20564 (15%)     max: 20744 Points
Cinebench R10 - Cinebench R10 Rend. Multi (64bit)
100%
1 3520M +
min: 11581     avg: 12766     median: 12889.5 (9%)     max: 13151 Points
199%
1 3940XM +
min: 25475     avg: 25600     median: 25624 (18%)     max: 25700 Points
Cinebench R10 - Cinebench R10 Rend. Single (64bit)
100%
1 3520M +
min: 6029     avg: 6128     median: 6146.5 (7%)     max: 6203 Points
109%
1 3940XM +
min: 6506     avg: 6621     median: 6669 (8%)     max: 6687 Points
wPrime 2.10 - wPrime 2.0 1024m *
min: 456     avg: 493.2     median: 492.1 (6%)     max: 570 s
min: 635     avg: 640     median: 640 (8%)     max: 645 s
min: 208.8     avg: 219.2     median: 215.7 (3%)     max: 233 s
wPrime 2.10 - wPrime 2.0 32m *
min: 14.4     avg: 15.5     median: 15.4 (3%)     max: 17.1 s
min: 20.19     avg: 20.3     median: 20.2 (4%)     max: 20.3 s
min: 6.8     avg: 7     median: 7 (1%)     max: 7.169 s
WinRAR - WinRAR 4.0
100%
1 3520M +
min: 2661     avg: 2863     median: 2715 (4%)     max: 3527 Points
152%
1 3940XM +
min: 3467     avg: 4124     median: 4123.5 (7%)     max: 4780 Points
X264 HD Benchmark 4.0 - x264 Pass 2
100%
1 3520M +
min: 6.7     avg: 16.1     median: 18.9 (7%)     max: 19.44 fps
215%
1 3940XM +
40.6 fps (14%)
X264 HD Benchmark 4.0 - x264 Pass 1
100%
1 3520M +
min: 35.1     avg: 86.2     median: 98.6 (23%)     max: 101.8 fps
163%
1 3940XM +
161.1 fps (37%)
TrueCrypt - TrueCrypt Serpent
100%
1 3520M +
min: 0.164     avg: 0.2     median: 0.2 (0%)     max: 0.176 GB/s
218%
1 3940XM +
min: 0.373     avg: 0.4     median: 0.4 (0%)     max: 0.386 GB/s
TrueCrypt - TrueCrypt Twofish
100%
1 3520M +
min: 0.249     avg: 0.3     median: 0.3 (5%)     max: 0.302 GB/s
220%
1 3940XM +
min: 0.64     avg: 0.7     median: 0.7 (11%)     max: 0.66 GB/s
TrueCrypt - TrueCrypt AES
100%
1 3520M +
min: 1.2     avg: 1.6     median: 1.7 (4%)     max: 1.7 GB/s
218%
1 3940XM +
min: 3.5     avg: 3.6     median: 3.7 (10%)     max: 3.7 GB/s
3DMark 06 - CPU - 3DMark 06 - CPU
100%
1 3520M +
min: 3528     avg: 4086     median: 4134 (9%)     max: 4212 Points
174%
1 3940XM +
min: 7166     avg: 7182     median: 7176 (15%)     max: 7203 Points
Super Pi mod 1.5 XS 1M - Super Pi mod 1.5 XS 1M *
min: 10     avg: 10.3     median: 10 (2%)     max: 10.94 s
min: 14.06     avg: 14.9     median: 14.9 (3%)     max: 15.8 s
min: 9     avg: 9.2     median: 9 (2%)     max: 9.554 s
Super Pi mod 1.5 XS 2M - Super Pi mod 1.5 XS 2M *
min: 24     avg: 24.8     median: 25 (1%)     max: 25.87 s
min: 31.64     avg: 34     median: 34 (1%)     max: 36.3 s
min: 21     avg: 21.1     median: 21 (1%)     max: 21.26 s
Super Pi Mod 1.5 XS 32M - Super Pi mod 1.5 XS 32M *
min: 565     avg: 591     median: 594 (3%)     max: 612 s
min: 712     avg: 765     median: 765 (3%)     max: 818 s
min: 518     avg: 526     median: 525.5 (2%)     max: 533 s
SiSoft Sandra Dhrystone (MIPS) - SiSoft Sandra Dhrystone (MIPS)
100%
1 3520M +
min: 55800     avg: 63808     median: 67130 (32%)     max: 69140 MIPS
220%
1 3940XM +
min: 147240     avg: 147620     median: 147620 (70%)     max: 148000 MIPS
SiSoft Sandra Whetstone (MFLOPS) - SiSoft Sandra Whetstone (MFLOPS)
100%
1 3520M +
min: 41450     avg: 42502     median: 42450 (33%)     max: 44032 MFLOPS
211%
1 3940XM +
min: 89600     avg: 89630     median: 89630 (69%)     max: 89660 MFLOPS
Windows 7 Experience Index - Win7 CPU
100%
1 3520M +
7.2 Points (92%)
107%
1 3940XM +
7.7 Points (99%)
3DMark Vantage - 3DM Vant. Perf. CPU no Physx
100%
1 3520M +
min: 9277     avg: 11188     median: 11511 (10%)     max: 11788 Points
225%
1 3940XM +
min: 25344     avg: 25795     median: 25885 (23%)     max: 26157 Points
3DMark 11 - 3DM11 Performance Physics
min: 3582     avg: 4275     median: 4466 (12%)     max: 4774 Points
min: 3121     avg: 3357     median: 3428 (9%)     max: 3595 Points
min: 7611     avg: 8737     median: 9032 (24%)     max: 9568 Points
3DMark - 3DMark Ice Storm Physics
39221 Points (32%)
min: 19210     avg: 25168     median: 25167.5 (20%)     max: 31125 Points
48410 Points (39%)
3DMark - 3DMark Ice Storm Extreme Physics
19308 Points (16%)
3DMark - 3DMark Ice Storm Unlimited Physics
21164 Points (18%)
3DMark - 3DMark Cloud Gate Physics
3393 Points (9%)
min: 2366     avg: 2620     median: 2729 (7%)     max: 2765 Points
7208 Points (18%)
3DMark - 3DMark Fire Strike Standard Physics
4772 Points (9%)
min: 3845     avg: 3885     median: 3885 (7%)     max: 3925 Points
9863 Points (18%)
Geekbench 4.4 - Geekbench 4.1 - 4.4 64 Bit Single-Core
3016 Points (30%)
Geekbench 4.4 - Geekbench 4.1 - 4.4 64 Bit Multi-Core
5895 Points (6%)
Geekbench 4.0 - Geekbench 4.0 64 Bit Single-Core
2947 Points (40%)
Geekbench 4.0 - Geekbench 4.0 64 Bit Multi-Core
5636 Points (14%)
Geekbench 3 - Geekbench 3 32 Bit Multi-Core
5136 Points (9%)
Geekbench 3 - Geekbench 3 32 Bit Single-Core
2340 Points (46%)
Mozilla Kraken 1.1 - Kraken 1.1 Total Score *
1528 ms (2%)
Sunspider - Sunspider 1.0 Total Score *
341.3 ms (4%)
Octane V2 - Octane V2 Total Score
24098 Points (22%)

Average Benchmarks Intel Core i7-3520M → 100% n=13

Average Benchmarks Intel Core i3-7100U → 86% n=13

Average Benchmarks Intel Core i7-3940XM → 145% n=13

- Range of benchmark values for this graphics card
- Average benchmark values for this graphics card
* Smaller numbers mean a higher performance
1 This benchmark is not used for the average calculation

v1.27
log 16. 20:08:25

#0 checking url part for id 3065 +0s ... 0s

#1 checking url part for id 8153 +0s ... 0s

#2 checking url part for id 3345 +0s ... 0s

#3 not redirecting to Ajax server +0s ... 0s

#4 did not recreate cache, as it is less than 5 days old! Created at Sun, 16 Jun 2024 05:37:17 +0200 +0.001s ... 0.001s

#5 composed specs +0.039s ... 0.04s

#6 did output specs +0s ... 0.04s

#7 getting avg benchmarks for device 3065 +0.003s ... 0.043s

#8 got single benchmarks 3065 +0.032s ... 0.075s

#9 getting avg benchmarks for device 8153 +0.004s ... 0.079s

#10 got single benchmarks 8153 +0.054s ... 0.133s

#11 getting avg benchmarks for device 3345 +0.003s ... 0.136s

#12 got single benchmarks 3345 +0.012s ... 0.148s

#13 got avg benchmarks for devices +0s ... 0.148s

#14 min, max, avg, median took s +0.301s ... 0.449s

#15 return log +0s ... 0.449s

Please share our article, every link counts!
> Expert Reviews and News on Laptops, Smartphones and Tech Innovations > Benchmarks / Tech > Processor Comparison - Head 2 Head
Redaktion, 2017-09- 8 (Update: 2023-07- 1)