Micron 2450 512GB MTFDKBA512TFK vs Micron 2450 512GB MTFDKCD512TFK
Micron 2450 512GB MTFDKBA512TFK
► remove from comparison
The Micron 2450 512GB (MTFDKBA512TFK) is a fast M.2 SSD using the NVMe 1.3 protocol. The Micron 2450 SSD is built with Micron 176-layer NAND and rated at 3mW sleep power state and less than 400mW in active idle power state.
Micron 2450 512GB MTFDKCD512TFK
► remove from comparison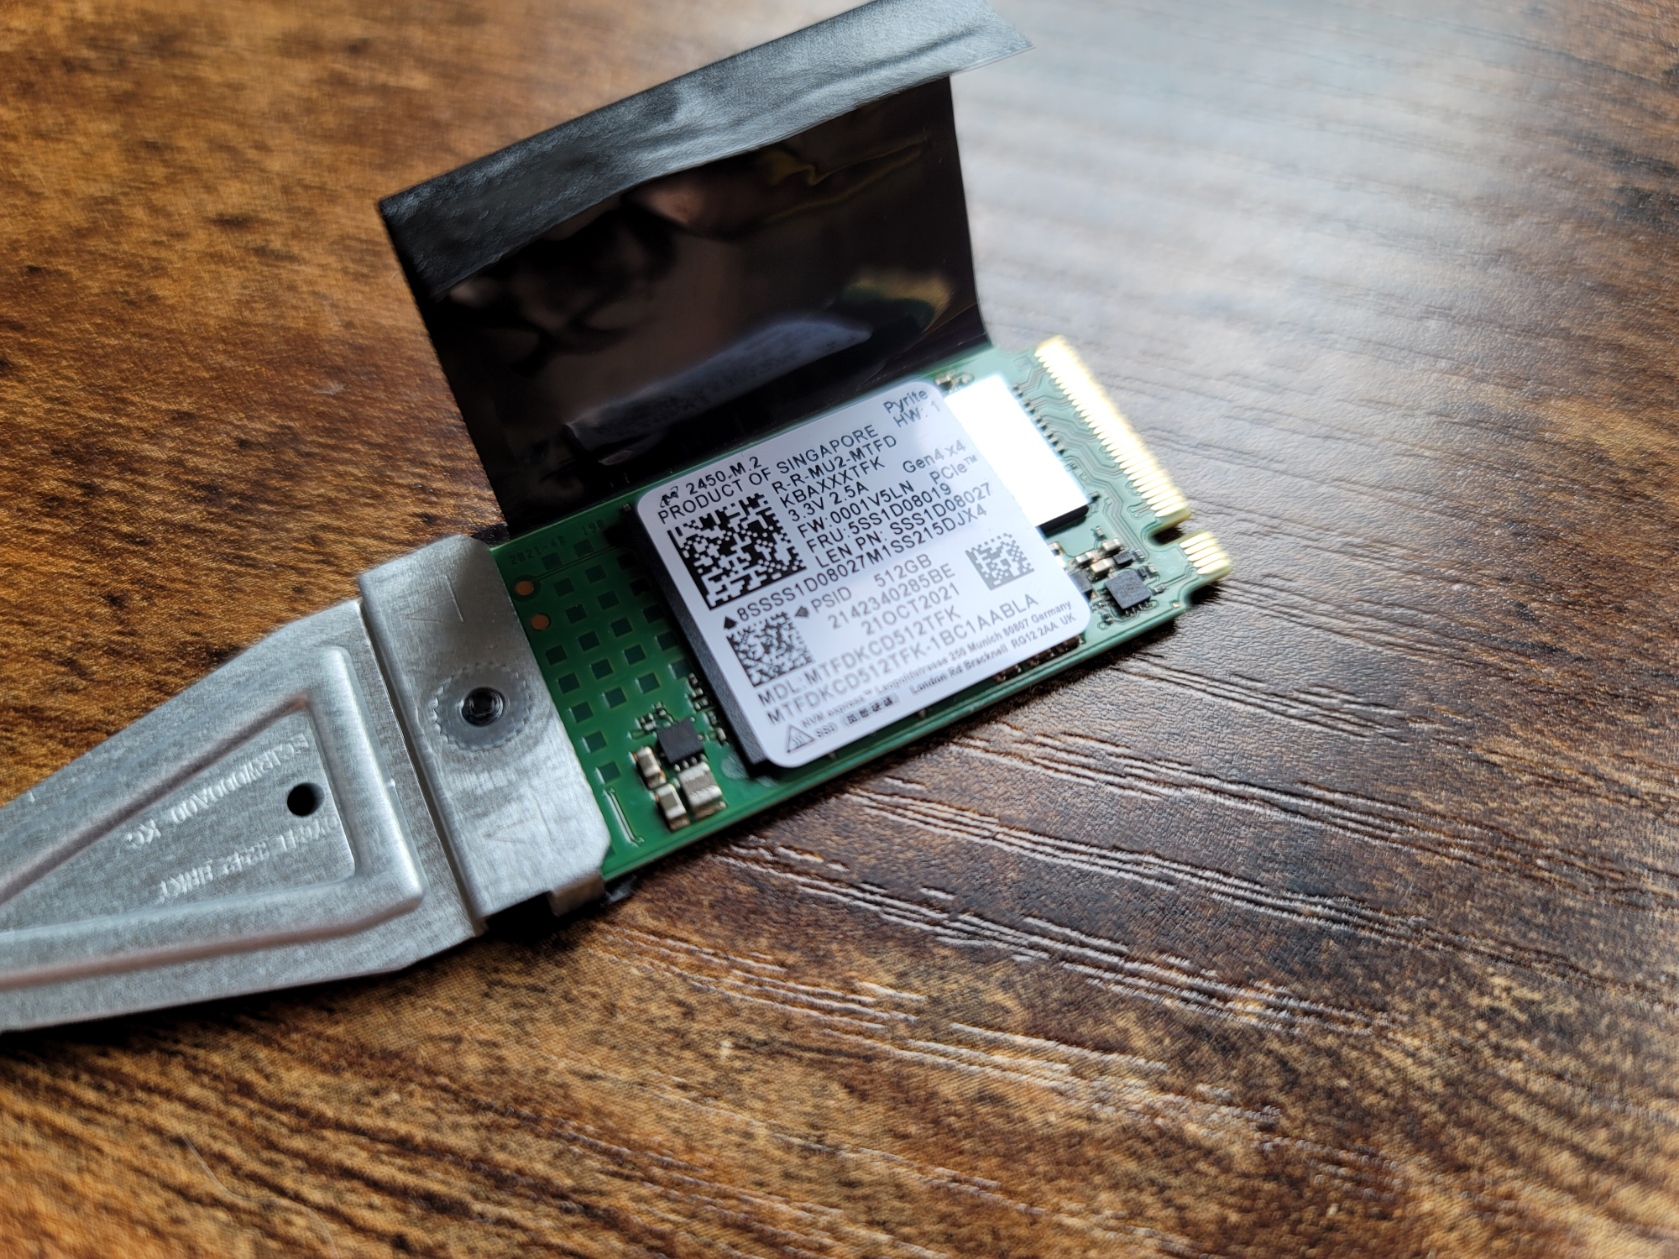
The Micron 2450 512GB MTFDKCD512TFK is a mid range PCIe Gen4 SSD in the small M.2 2242 form factor. It uses Micron 176-layer NAND memory. Micron advertises the 2450 series with a very low power consumption and specifies the maximum read performance at 3,600 MB/s.
| Micron 2450 512GB MTFDKBA512TFK | Micron 2450 512GB MTFDKCD512TFK | |
| Type | SSD | SSD |
| Size | M.2 2280 | M.2 2242 |
| Capacity | 512 GB | 512 GB |
| Interface | M.2 | NVMe |
| Announced | 24.02.2022 | 03.08.2022 |
Benchmarks
Performance Rating - DiskSpd - 2450 512GB
28.2 pt (32%)
Seagate ST1000LM014 Solid State Hybrid Drive
...
Kingston OM8TAP41024K1-A00
Micron 2450 512GB MTFDKBA512TFK
Micron 3500 1TB MTFDKBA1T0TGD
Kioxia BG6 KBG6AZNV1T02
Netac NS1T0BSSD610
...
Kingston Fury Renegade G5 4TB
0%
100%
Performance Rating - DiskSpd - MTFDKCD512TFK
22.7 pt (26%)
Seagate ST1000LM014 Solid State Hybrid Drive
...
Micron 2450 512GB MTFDKCD512TFK
Samsung MZ9L4512HBLU-00BMV
Faspeed P8-1TB-LB1
Toshiba KBG40ZNV512G
Transcend M.2 SSD 2200S TS512GMTE220S
Netac NS512GSSD530
2x Intel SSD 660p SSDPEKNW512G8 (RAID 0)
Lexar NM620 512GB
...
Kingston Fury Renegade G5 4TB
0%
100%

85%
MTFDKCD512TFK +min: 342.01 avg: 750 median: 806.4 (13%) max: 1044.07 MB/s
95%
MTFDKCD512TFK +min: 333.18 avg: 391.3 median: 385.7 (14%) max: 460.67 MB/s
131%
MTFDKCD512TFK +min: 993.21 avg: 1319 median: 1171.5 (4%) max: 1941 MB/s
98%
MTFDKCD512TFK +min: 2319 avg: 3686 median: 3981 (24%) max: 4307 Points
109%
MTFDKCD512TFK +min: 1064 avg: 1919 median: 2209 (31%) max: 2609 Points
68%
MTFDKCD512TFK +min: 882 avg: 1201 median: 1161 (19%) max: 1688 Points
98%
MTFDKCD512TFK +min: 0.022 avg: 0.4 median: 0.2 (0%) max: 1.028 ms
90%
MTFDKCD512TFK +min: 0.063 avg: 0.1 median: 0.1 (0%) max: 0.109 ms
119%
MTFDKCD512TFK +min: 788.8 avg: 1580 median: 1822.4 (31%) max: 2212.19 MB/s
57%
MTFDKCD512TFK +min: 597.83 avg: 866 median: 758.8 (15%) max: 1346.13 MB/s
104%
MTFDKCD512TFK +min: 126 avg: 174.1 median: 178.6 (35%) max: 215.46 MB/s
75%
MTFDKCD512TFK +min: 38.16 avg: 50.6 median: 52.2 (17%) max: 63.49 MB/s
AS SSD - Sequential Write
100%
2450 512GB +min: 1359.49 avg: 2269 median: 2849.5 (25%) max: 3008.29 MB/s
60%
MTFDKCD512TFK +min: 721.73 avg: 1647 median: 1708.7 (15%) max: 2179.7 MB/s
93%
MTFDKCD512TFK +min: 2460.42 avg: 2848 median: 2730.3 (21%) max: 3563.57 MB/s
CrystalDiskMark 5.2 / 6 - CDM 5/6 Write 4K
100%
2450 512GB +min: 76.18 avg: 220.3 median: 209.7 (19%) max: 349.4 MB/s
74%
MTFDKCD512TFK +min: 141.4 avg: 152.9 median: 154.4 (14%) max: 161.5 MB/s
CrystalDiskMark 5.2 / 6 - CDM 5/6 Read 4K
100%
2450 512GB +min: 39.27 avg: 63.6 median: 64.9 (2%) max: 74.8 MB/s
87%
MTFDKCD512TFK +min: 38.15 avg: 53.2 median: 56.6 (2%) max: 61.58 MB/s
CrystalDiskMark 5.2 / 6 - CDM 5 Write Seq
100%
2450 512GB +min: 1699 avg: 2777 median: 2975.5 (16%) max: 3336 MB/s
86%
MTFDKCD512TFK +min: 2222 avg: 2613 median: 2571.5 (14%) max: 3087 MB/s
CrystalDiskMark 5.2 / 6 - CDM 5 Read Seq
100%
2450 512GB +min: 1742 avg: 2105 median: 2161.5 (23%) max: 2280 MB/s
96%
MTFDKCD512TFK +min: 1949 avg: 2076 median: 2066 (22%) max: 2221 MB/s
CrystalDiskMark 5.2 / 6 - CDM 5/6 Write 4K Q32T1
100%
2450 512GB +min: 308.6 avg: 508 median: 485.2 (10%) max: 745.4 MB/s
85%
MTFDKCD512TFK +min: 380.1 avg: 424.4 median: 412.6 (9%) max: 492.4 MB/s
CrystalDiskMark 5.2 / 6 - CDM 5/6 Read 4K Q32T1
100%
2450 512GB +min: 388.1 avg: 610 median: 604.9 (9%) max: 887 MB/s
68%
MTFDKCD512TFK +min: 402.3 avg: 434.7 median: 412.9 (6%) max: 510.5 MB/s
CrystalDiskMark 5.2 / 6 - CDM 5/6 Write Seq Q32T1
100%
2450 512GB +min: 315.4 avg: 2877 median: 3333 (22%) max: 3356 MB/s
92%
MTFDKCD512TFK +min: 2690 avg: 3205 median: 3061.5 (20%) max: 4008 MB/s
CrystalDiskMark 5.2 / 6 - CDM 5/6 Read Seq Q32T1
100%
2450 512GB +min: 453.8 avg: 3173 median: 3700 (20%) max: 3716 MB/s
87%
MTFDKCD512TFK +min: 3083 avg: 3640 median: 3236 (17%) max: 5003 MB/s
CrystalDiskMark 5.2 / 6 - CDM 6 Write 4K Q8T8
100%
1 2450 512GB +min: 1498.6 avg: 1909 median: 1909.3 (38%) max: 2320 MB/s
CrystalDiskMark 5.2 / 6 - CDM 6 Read 4K Q8T8
100%
1 2450 512GB +min: 977.3 avg: 1021 median: 1021.2 (15%) max: 1065 MB/s
DiskSpd - DiskSpd 4k_q1t1_write
100%
2450 512GB +min: 66.6 avg: 229.1 median: 205 (47%) max: 421 MB/s
81%
MTFDKCD512TFK +min: 126.7 avg: 155.4 median: 166.4 (38%) max: 169.5 MB/s
95%
MTFDKCD512TFK +min: 38.8 avg: 50.9 median: 55.8 (16%) max: 60.2 MB/s
DiskSpd - DiskSpd 4k_q32t16_write
100%
2450 512GB +min: 365 avg: 1507 median: 1325 (20%) max: 3249 MB/s
31%
MTFDKCD512TFK +min: 343 avg: 929 median: 414 (6%) max: 2213 MB/s
DiskSpd - DiskSpd 4k_q32t16_read
100%
2450 512GB +min: 416 avg: 1131 median: 1386 (17%) max: 1577 MB/s
56%
MTFDKCD512TFK +min: 705 avg: 914 median: 771 (9%) max: 1511 MB/s
96%
MTFDKCD512TFK +min: 2118 avg: 2500 median: 2439 (24%) max: 3127 MB/s
97%
MTFDKCD512TFK +min: 1773 avg: 2026 median: 1987 (21%) max: 2315 MB/s
DiskSpd - DiskSpd seq_q8t1_write
100%
2450 512GB +min: 934 avg: 2806 median: 3233 (22%) max: 3351 MB/s
91%
MTFDKCD512TFK +min: 2266 avg: 2927 median: 2940 (20%) max: 3917 MB/s
DiskSpd - DiskSpd seq_q8t1_read
100%
2450 512GB +min: 1023 avg: 3022 median: 3457 (21%) max: 3634 MB/s
87%
MTFDKCD512TFK +min: 2594 avg: 3327 median: 2996 (19%) max: 4921 MB/s
DiskSpd - DiskSpd Loop seq_q8t1_read
100%
2450 512GB +min: 1029 avg: 2861 median: 3172 (19%) max: 3598 MB/s
95%
MTFDKCD512TFK +min: 2598 avg: 3318 median: 3021 (19%) max: 4970 MB/s
- Range of benchmark values for this graphics card
 - Average benchmark values for this graphics card
* Smaller numbers mean a higher performance
* Smaller numbers mean a higher performance
Average Benchmarks
Micron 2450 512GB MTFDKBA512TFK → 100% n=31
Micron 2450 512GB MTFDKCD512TFK → 87% n=31
Average of the median scores above. 1 ... This benchmark is not used for the average calculation
- $59.99Micron 2300 Series MTFDHBA512TDV-1AZ12ABYY 512GB Solid State Drive
- $412.00Crucial Micron Technology - MTFDKBA1T0TGD-1BK1AABYYR - Micron 3500 1 TB Solid State Drive - M.2 2280 Internal - PCI Express NVMe
- $689.90Crucial Micron Technology - MTFDKBA2T0TGD-1BK1AABYYR - Micron 3500 2 TB Solid State Drive - M.2 Internal - 1
- Micron Technology - MTFDKBA512TGD-1BK1AABYYR 3500 512 GB Solid State Drive - M.2 Internal
v1.35