

The Aorus Gaming Box GeForce RTX 2080 Ti Turned Our Tiny Intel NUC into a 4K Powerhouse
")
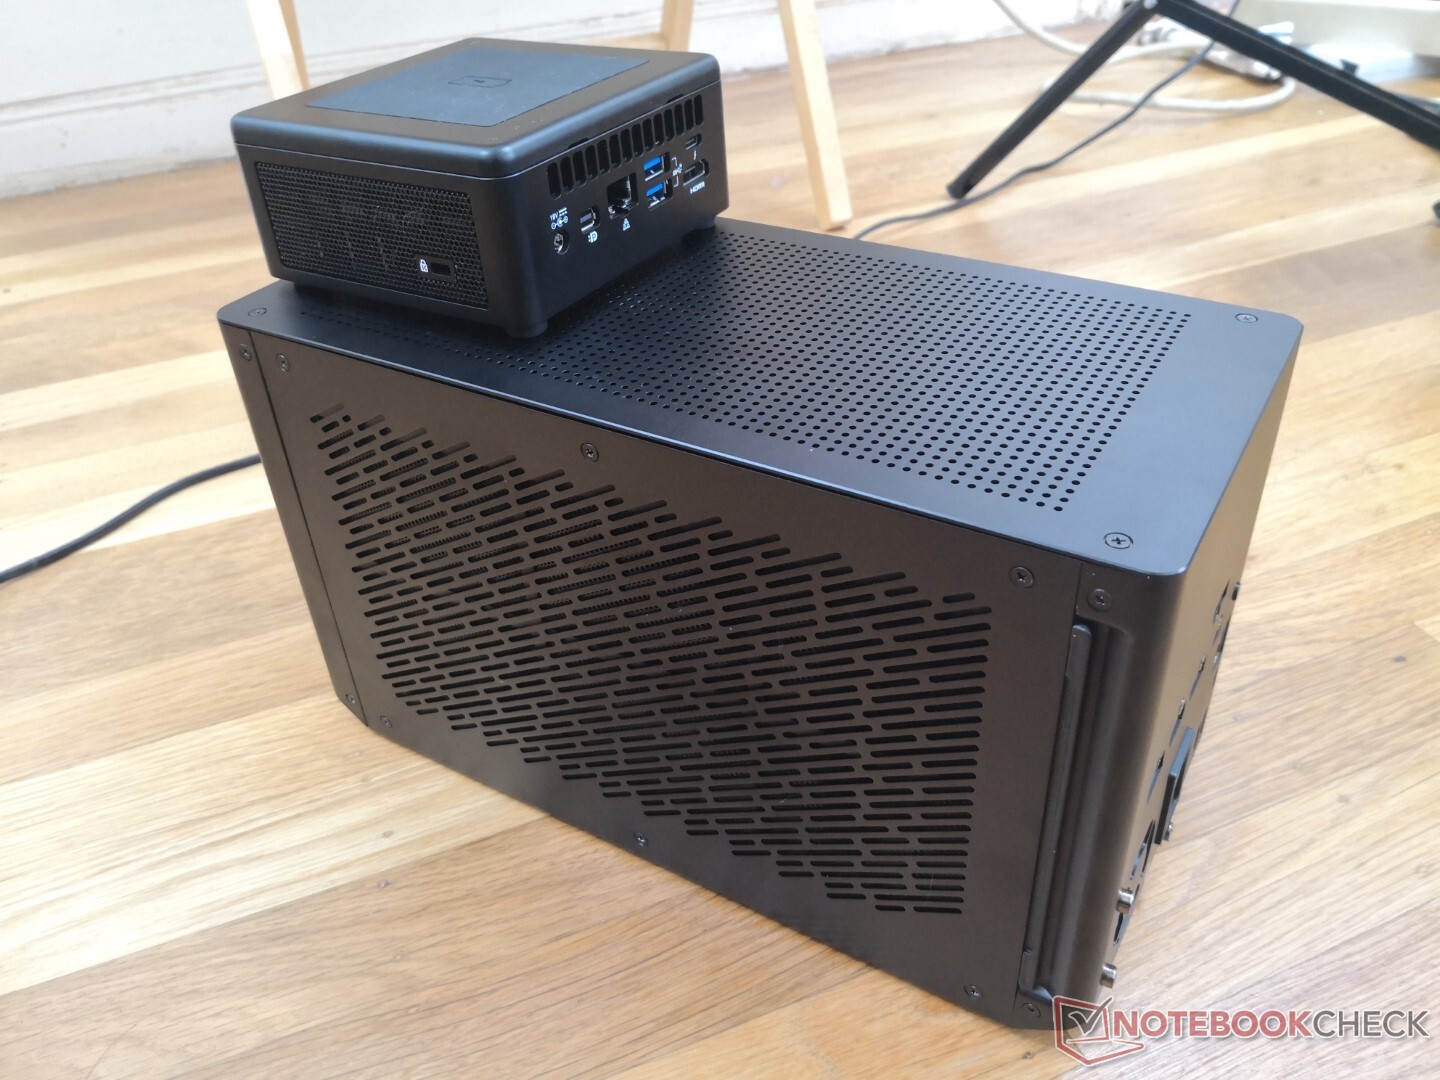
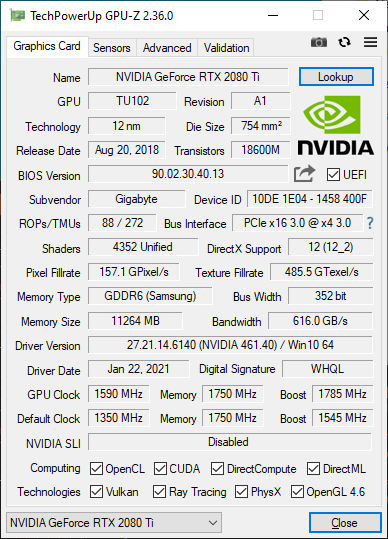
The Gigabyte Aorus GeForce RTX 2080 Ti Gaming Box is one of the fastest external GPUs (eGPUs) available alongside the recent Asus ROG XG docking station. Unlike the Asus solution, however, the liquid-cooled Gaming Box series does not use proprietary connectors to be compatible with any Windows PC or laptop so long as they have a Thunderbolt 3 port. The Gaming Box is even available with GeForce RTX 3090 options albeit in limited quantities.
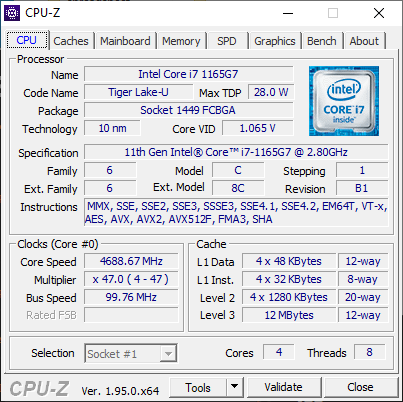
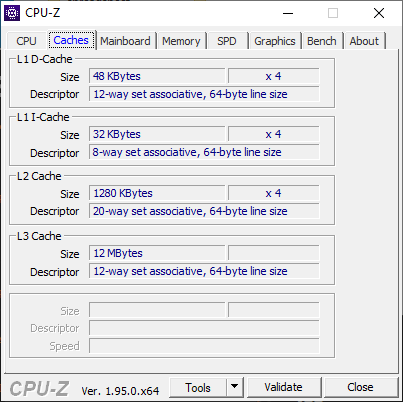
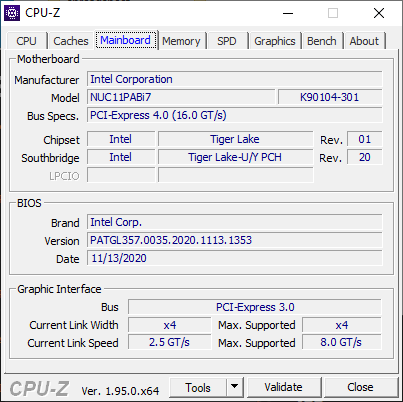
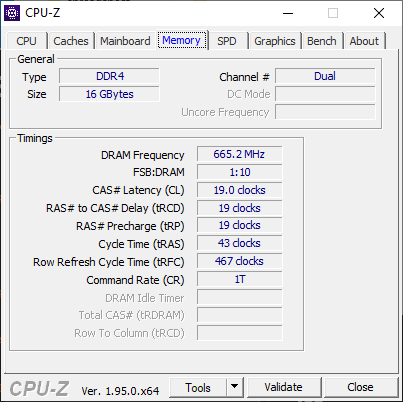
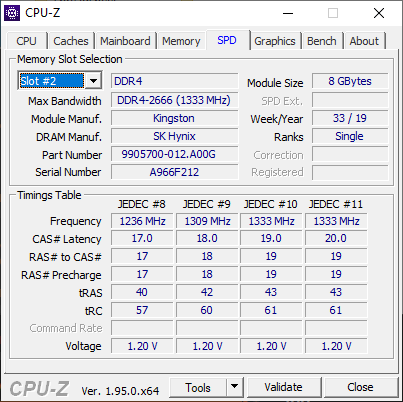
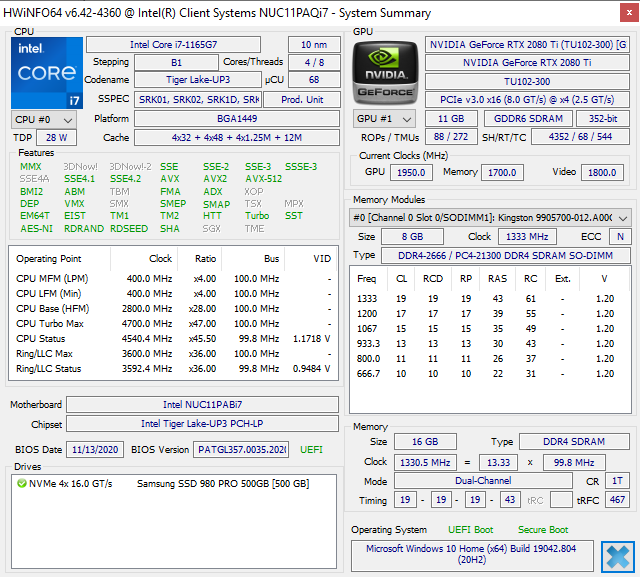
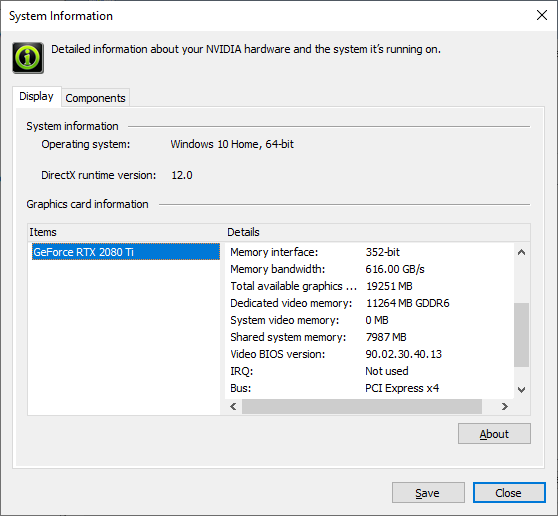
For our host PC of choice, we paired the Gigabyte Gaming Box with the Intel NUC 11 Panther Canyon as reviewed here. We had also upgraded the main memory of the NUC to dual-channel 16 GB from single-channel 16 GB. The NUC 11 is notable for carrying the latest 11th gen Core i7-1165G7 Tiger Lake CPU and supporting Thunderbolt 4 devices at up to 40 Gbps which make it a perfect test subject for an eGPU. it also just happens to be one of the fastest Tiger Lake-U systems money can buy at the moment. All tests below were completed with a 4K monitor connected directly to the Gaming Box instead of the NUC to prevent video data from bottlenecking performance.
See the product page here for the official specifications.
More Gigabyte reviews:
Setup
The setup phase is relatively smooth but not without any hiccups. According to the booklet, owners should first connect the Gaming Box to a power outlet before connecting to a laptop PC with the included 500 millimeter Thunderbolt cable. Then, Windows should automatically detect the eGPU and notify the user to approve the Thunderbolt device. In our case, the NUC couldn't detect the Gaming Box at all until after we had updated its Thunderbolt drivers. Only then can users download and install the latest Nvidia drivers via the GeForce Experience software. Note that the video-out ports on the Gaming Box will not work until after this final step is done.
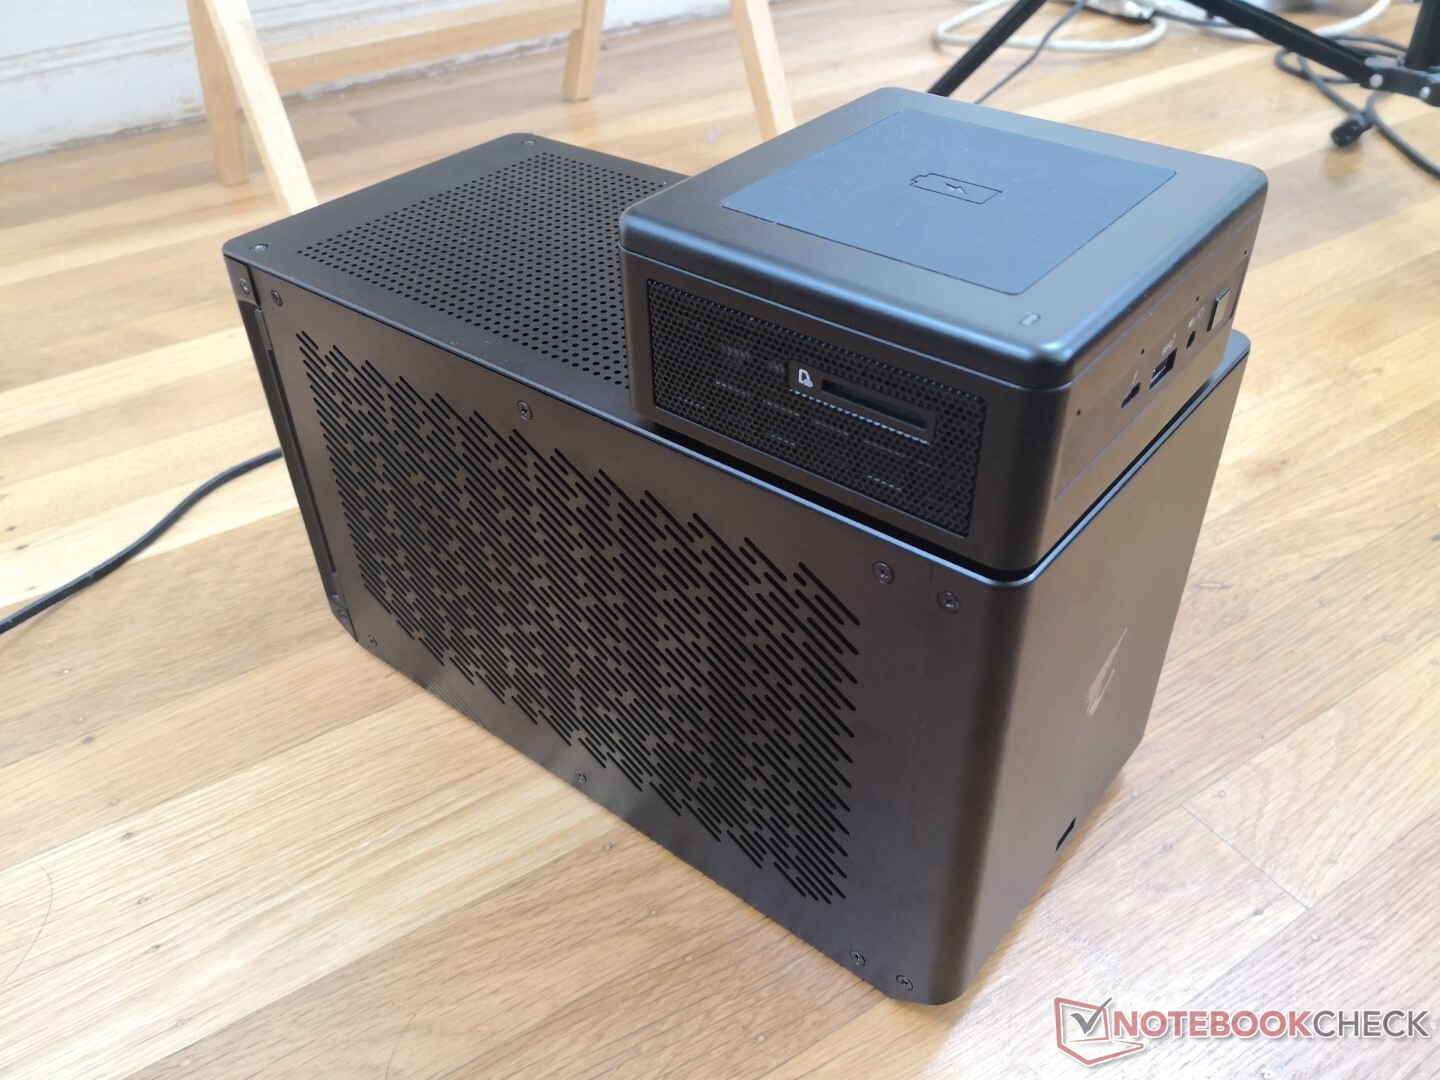
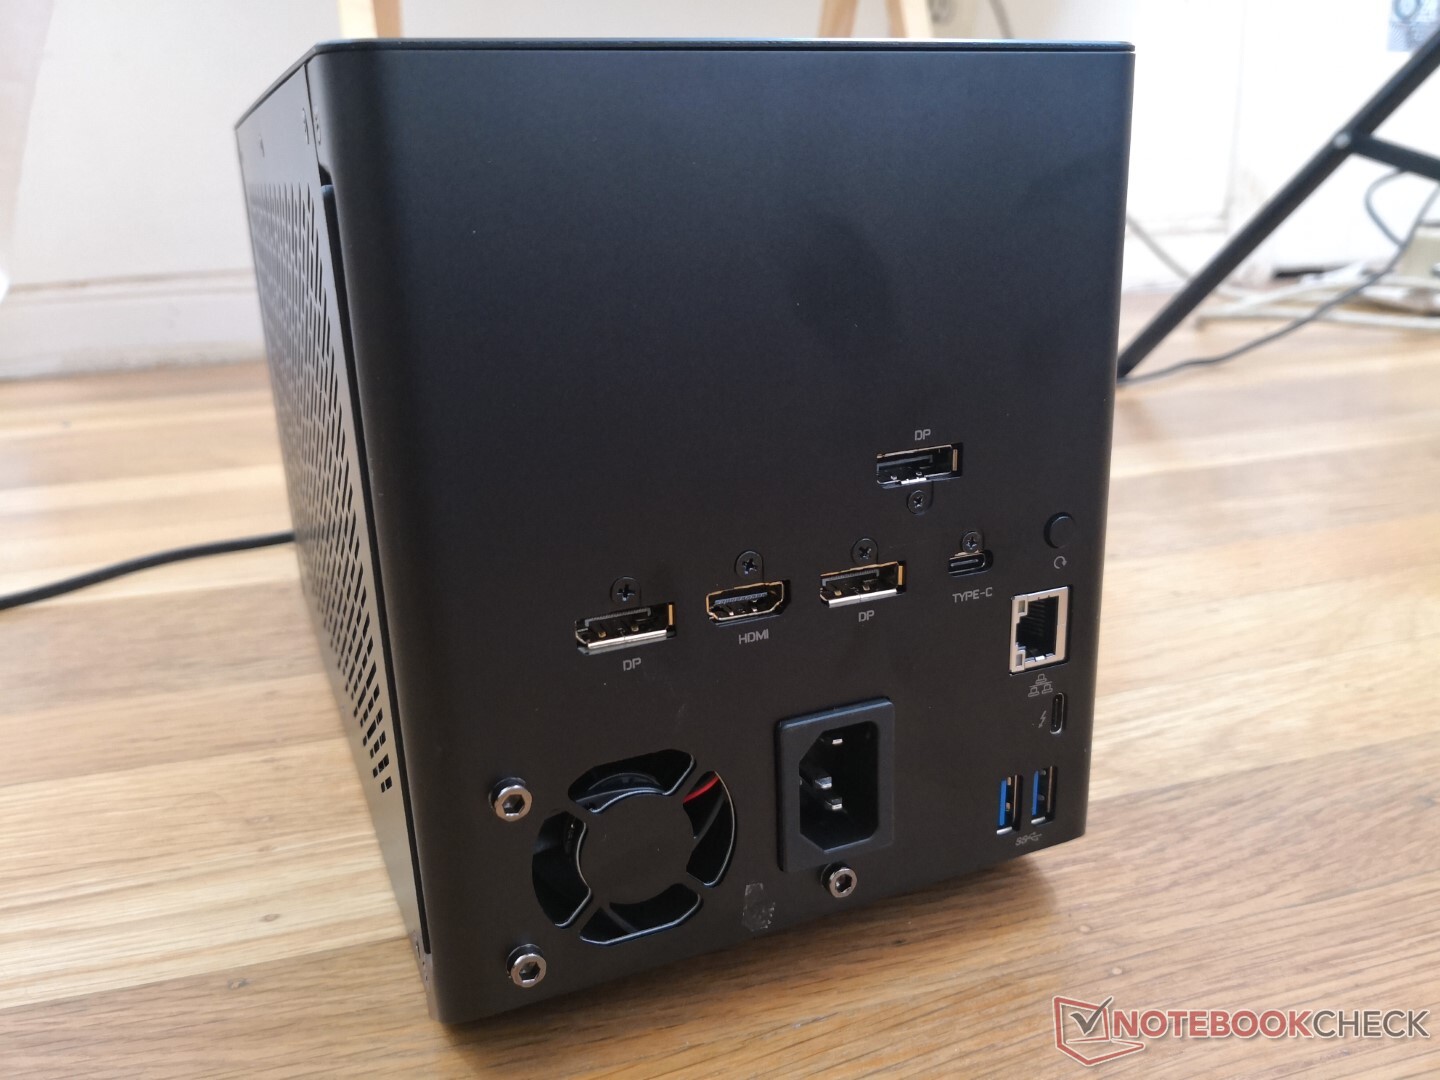
Connectivity
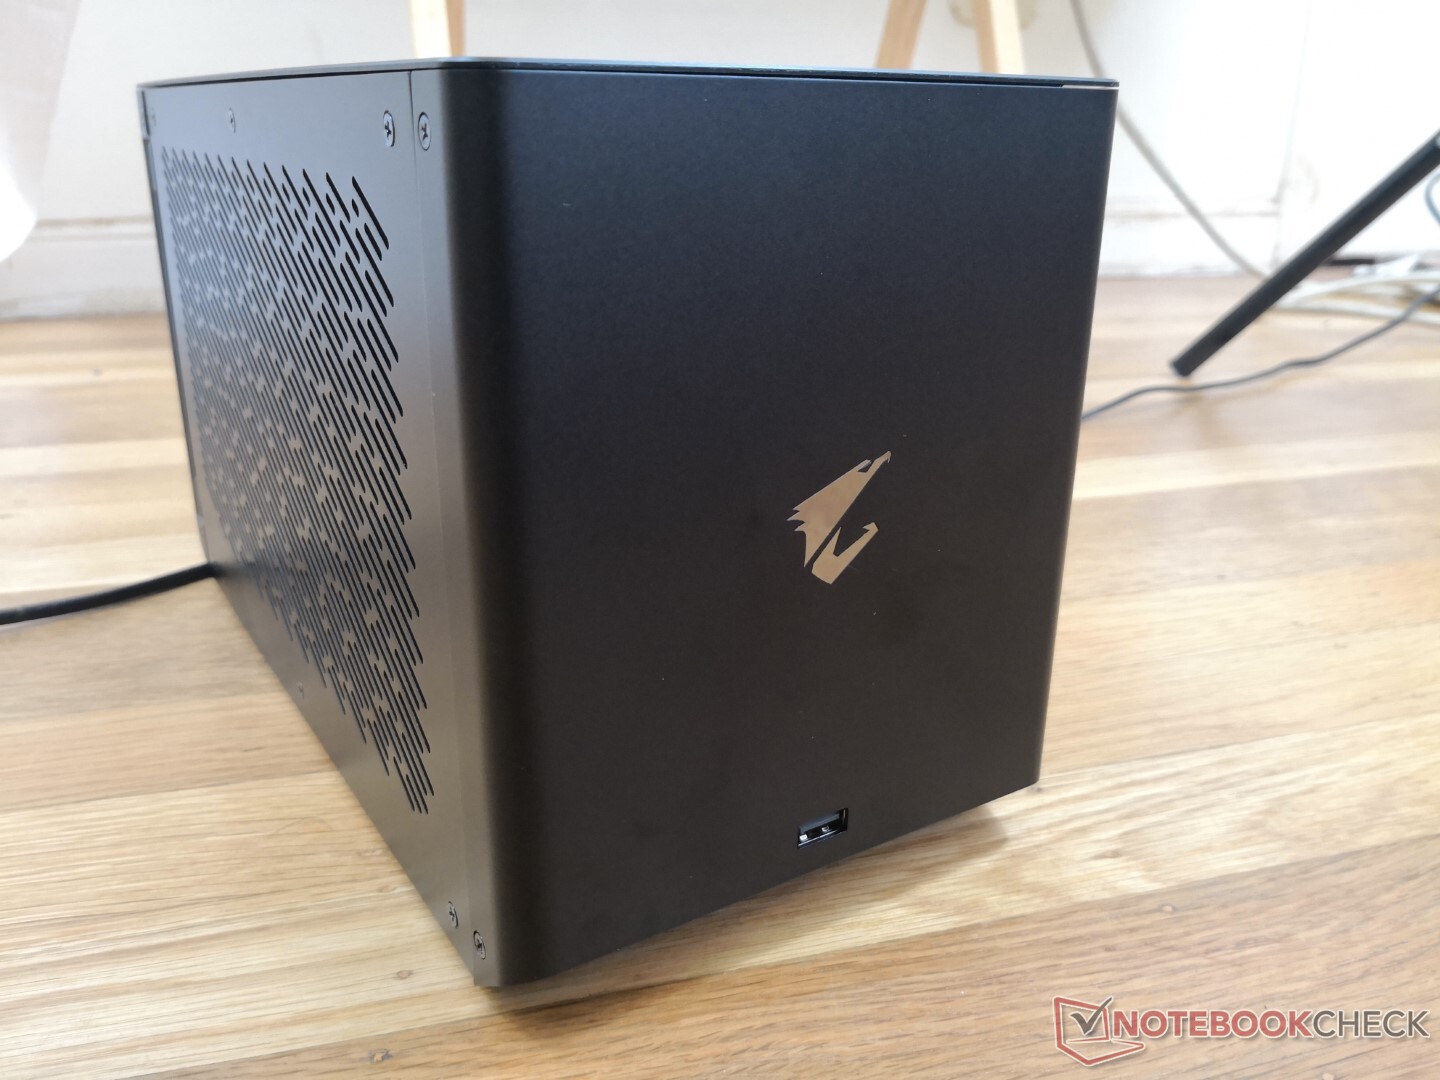
Most ports are along the rear with just one USB-A port on the front. There is no power button and so the eGPU is always "on" even if the main PC is powered off. Power consumption is concerningly high as a result as detailed in our Power Consumption section below.
A "reset" button on the back emulates re-plugging the AC power cord. However, an actual power button would have been better.
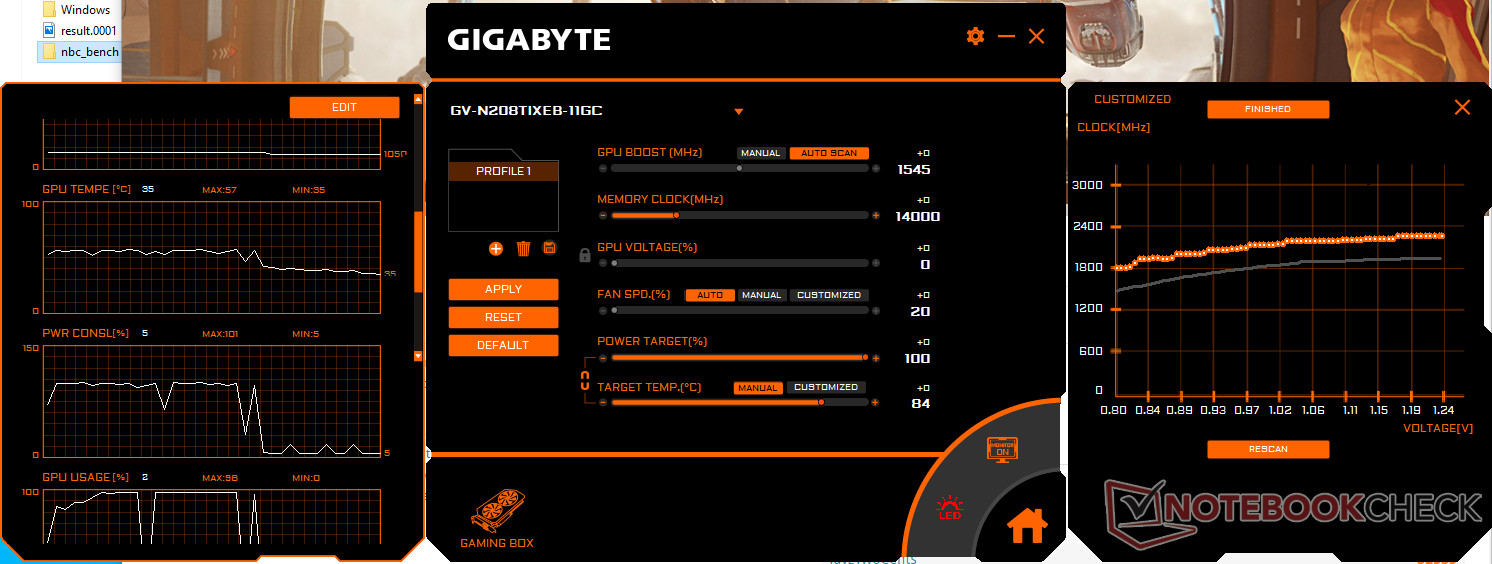
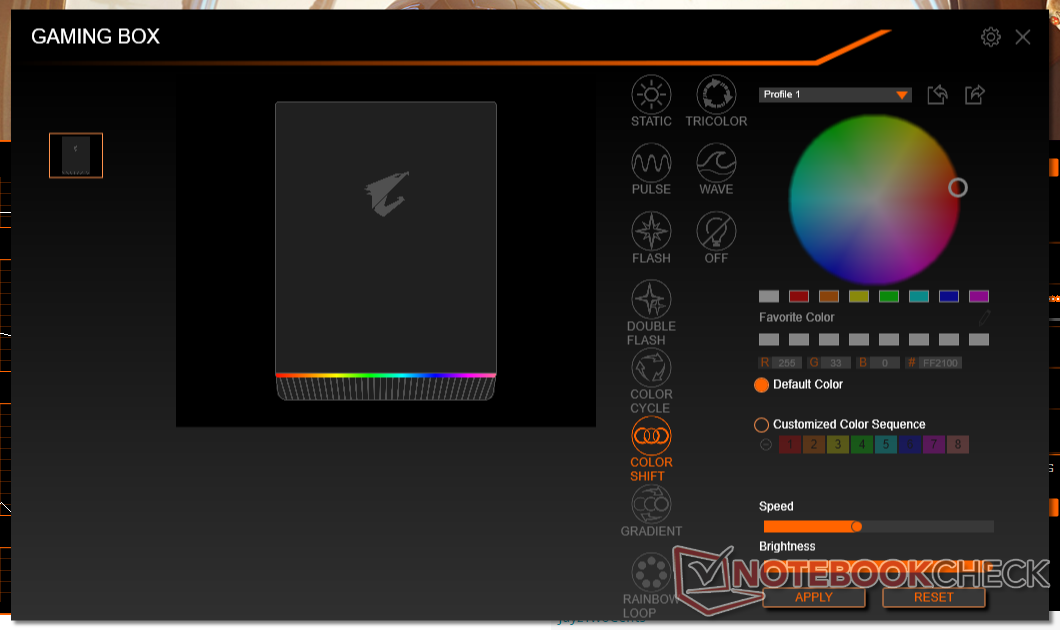
Software
The Gaming Box software UI is poor. Its window is fixed and so it cannot be maximized while its buttons and graphs are also very small. The automatic overclocking 'Auto Scan GPU Boost' feature also crashed the software on our first try and it appeared to have no impact on the performance of the Gaming Box at all. The horrid interface is a shame because its features and data recording are otherwise quite useful for enthusiasts.
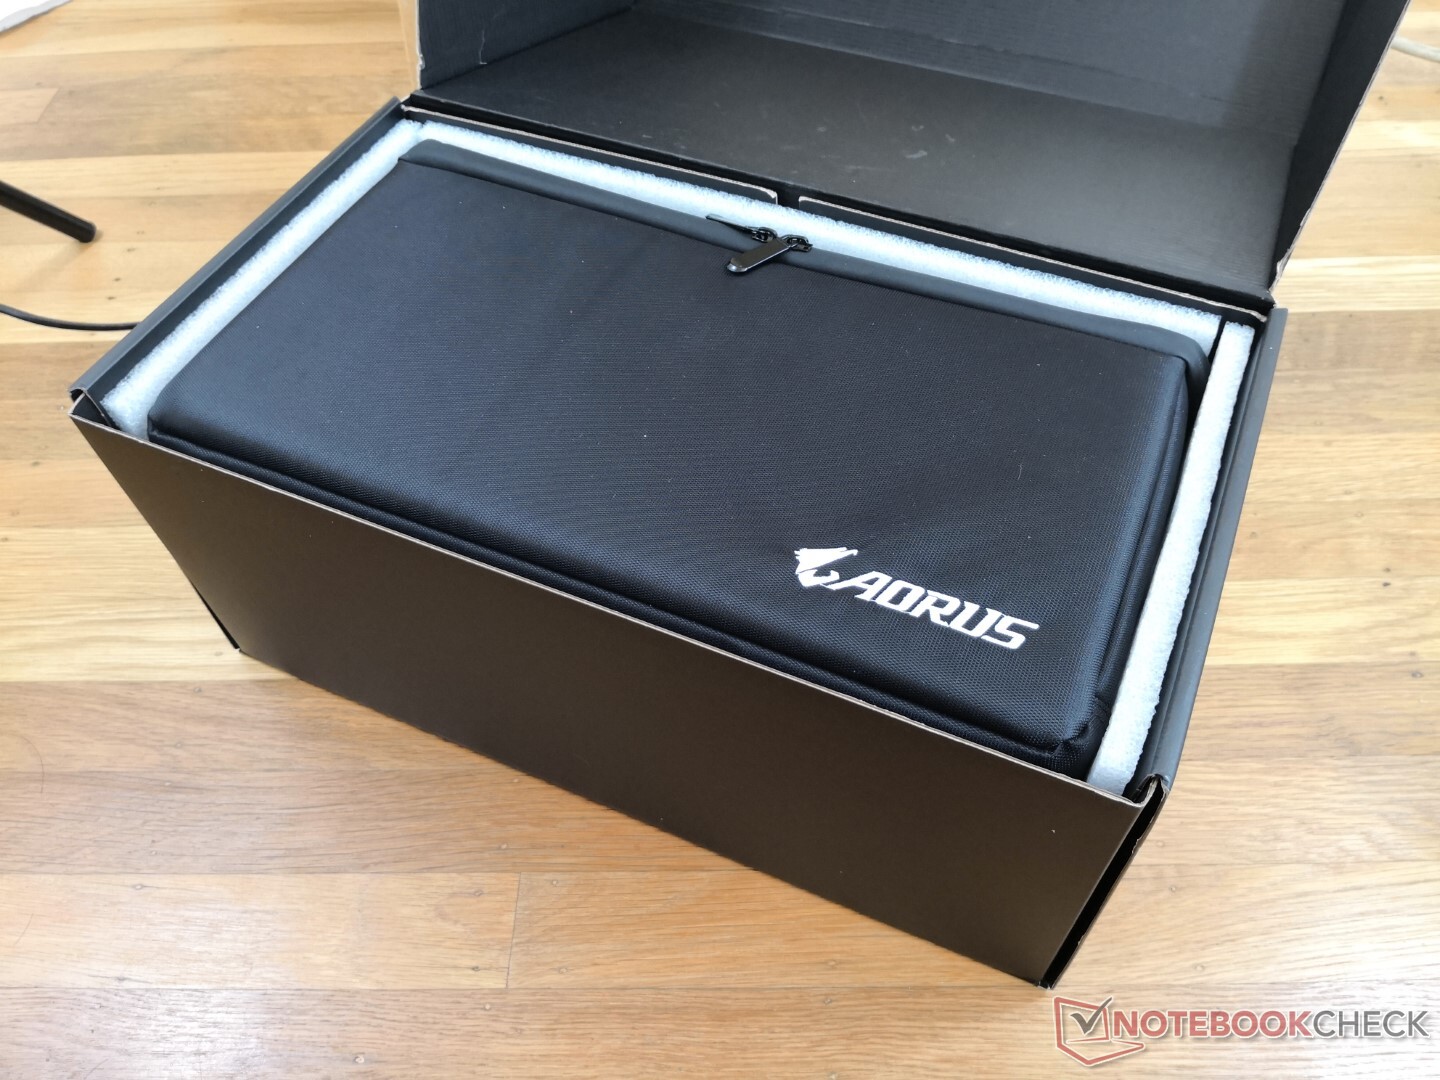
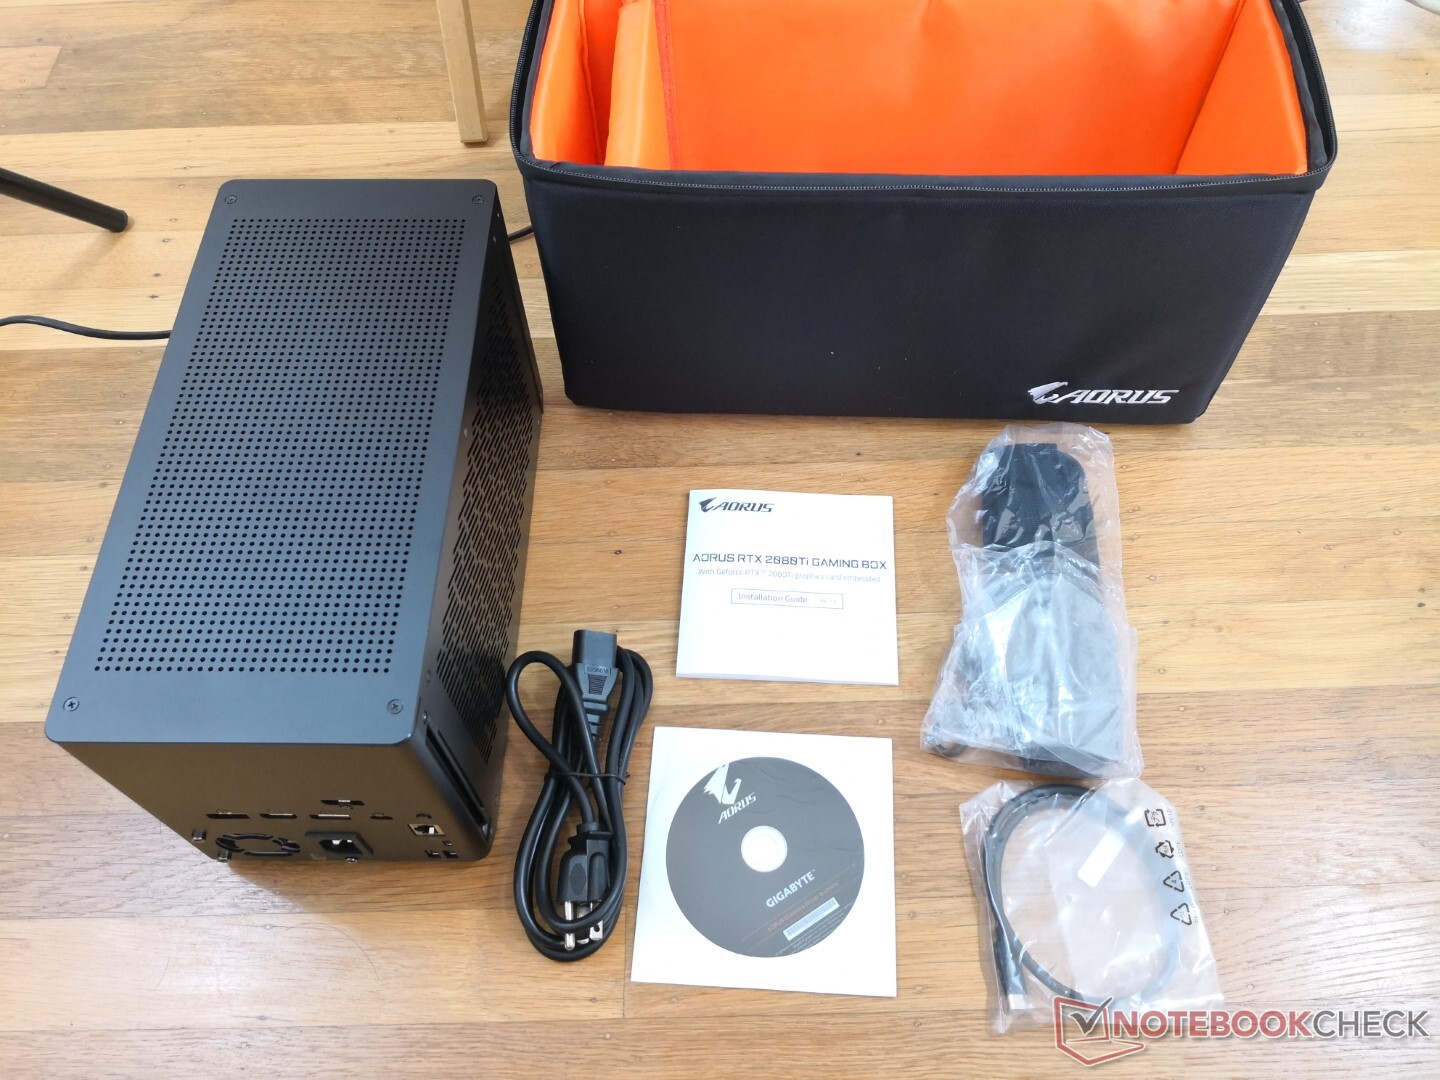
Accessories
Maintenance
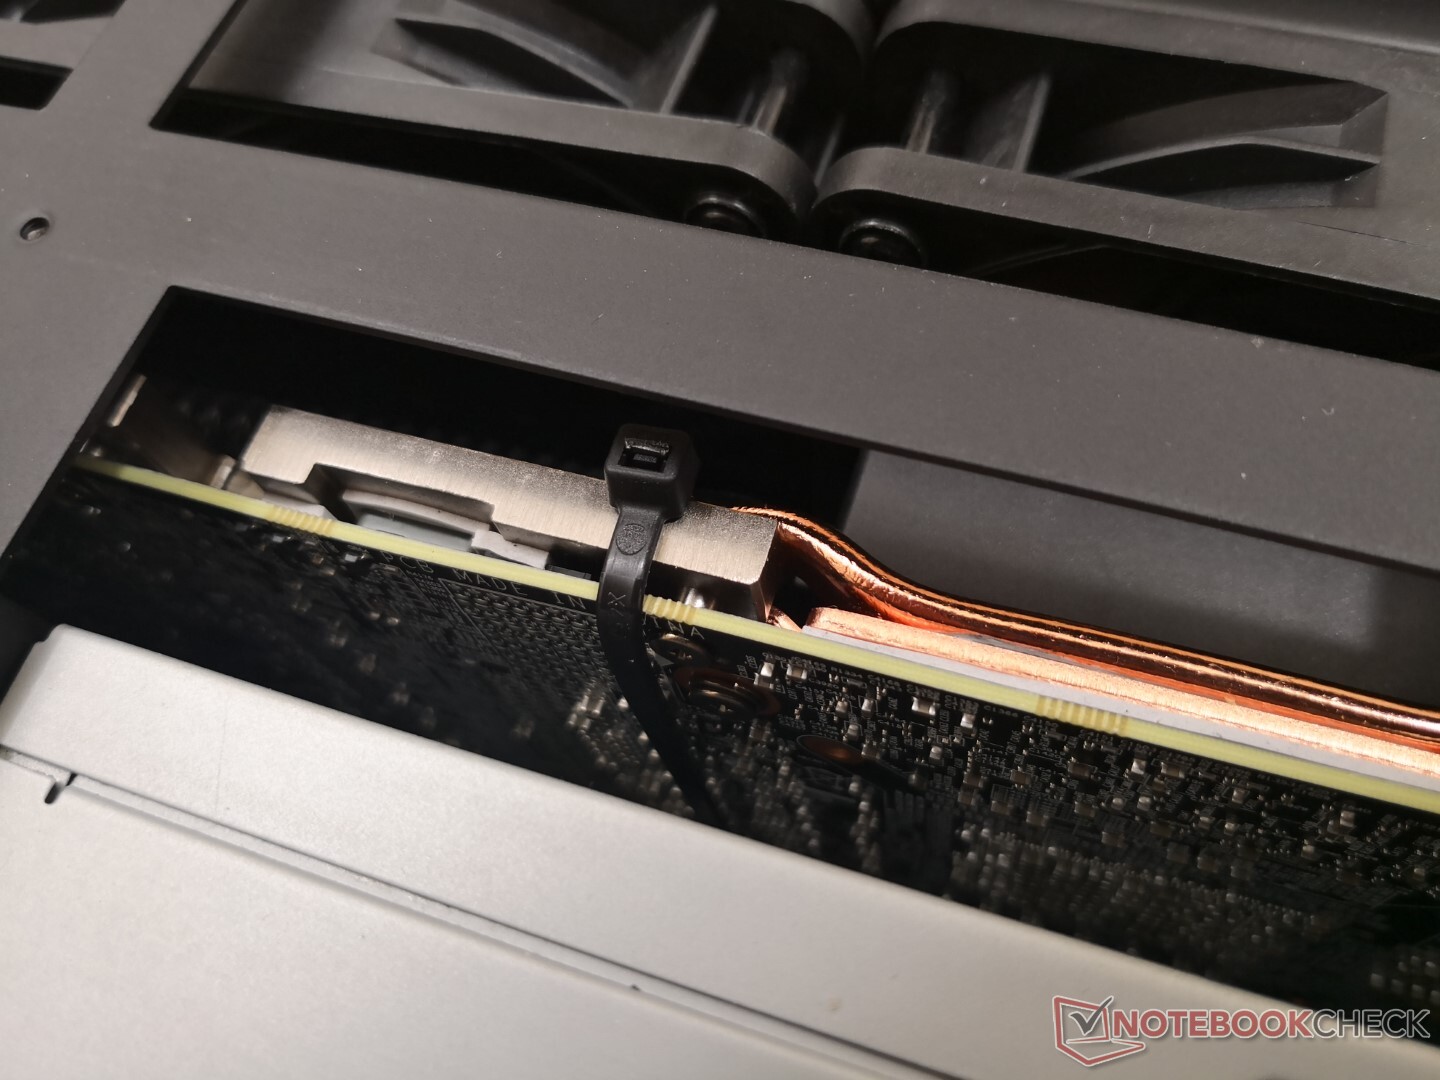
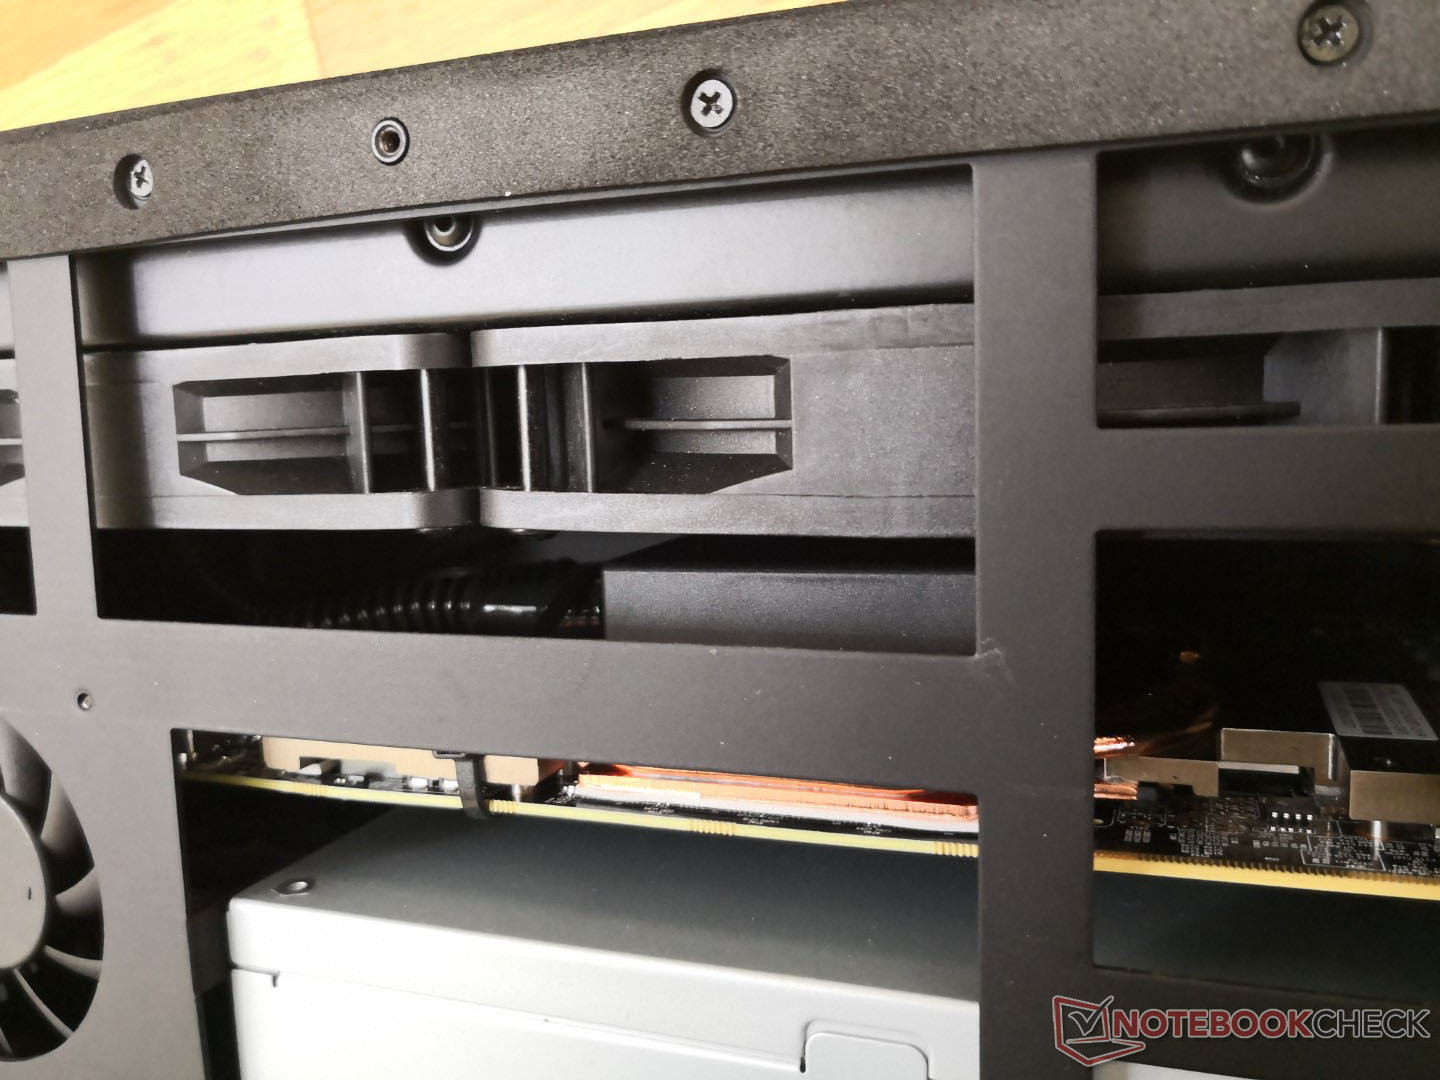
The first question most gamers will ask is if the GPU in the Gaming Box can be removed or replaced. The short answer is yes, but the long answer is more complicated. Gigabyte did not design its Gaming Box to be easily upgradeable unlike on the fatter Razer Core X or Alienware eGPU. Furthermore, the liquid-cooling apparatus was designed specifically for the Gaming Box chassis meaning owners will need to either modify their PC towers to accommodate the liquid cooler or install their own cooling solutions if transferring the RTX 2080 Ti onto their desktops. If GPU switching is your primary intention, then the aforementioned Razer or Alienware would be better options as their designs more actively encourage it.

Warranty
Gigabyte offers 2-year and 3-year base warranties for its peripherals and graphics cards, respectively. However, we're unsure if the Gaming Box is classified as a peripheral or graphics card and we've contacted Gigabyte for clarification.
Performance
Before we jump to the data, it's worth mentioning that we experienced a couple of strange problems with our unit including a few crashes when running GTA V and Far Cry New Dawn. Coil while or electronic noise was very apparent during the first couple of hours of use. This would eventually decrease in intensity over time, but it would never completely go away. We also noticed faint but periodic clicking from the internal PSU followed by noticeable micro-stuttering when gaming. A cold reboot fortunately fixed the issue. Nonetheless, we highly recommend that new owners check for these abnormalities immediately after purchasing.
System Performance
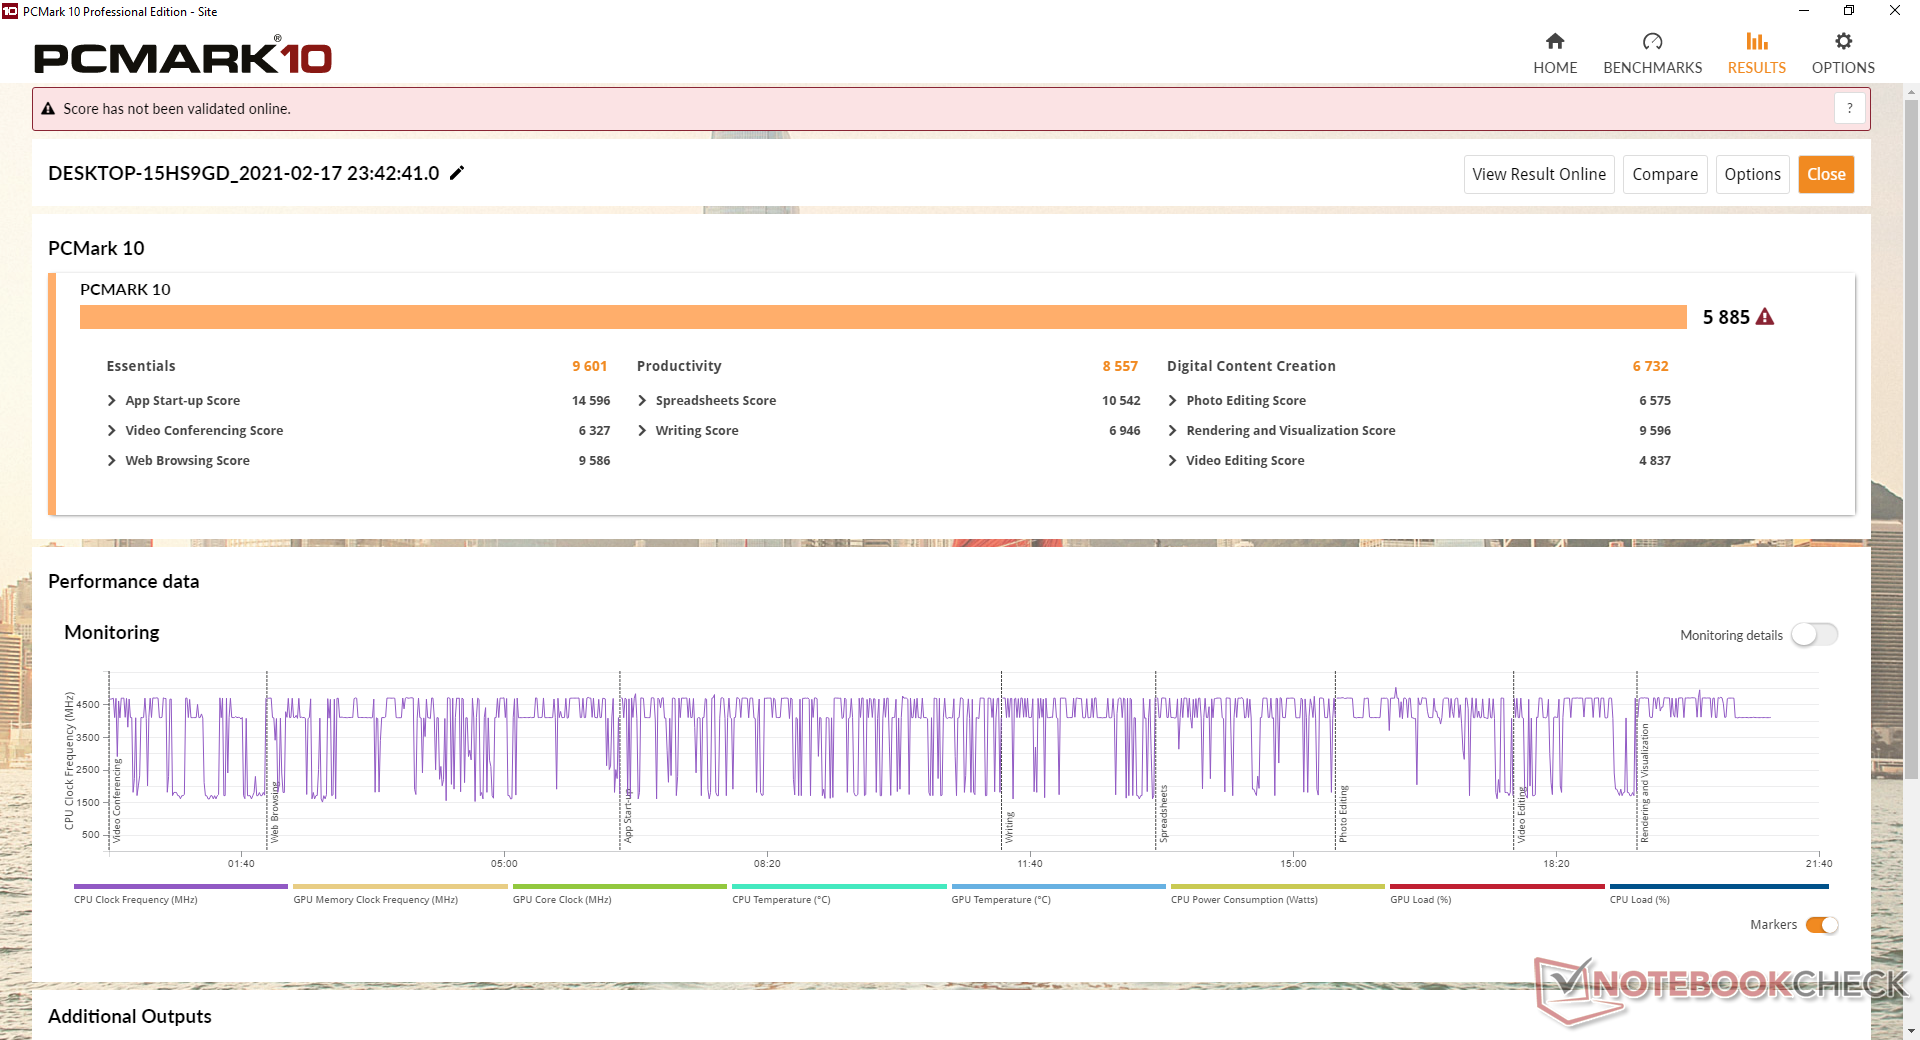
| PCMark 10 Score | 5885 points | |
Help | ||
GPU Performance
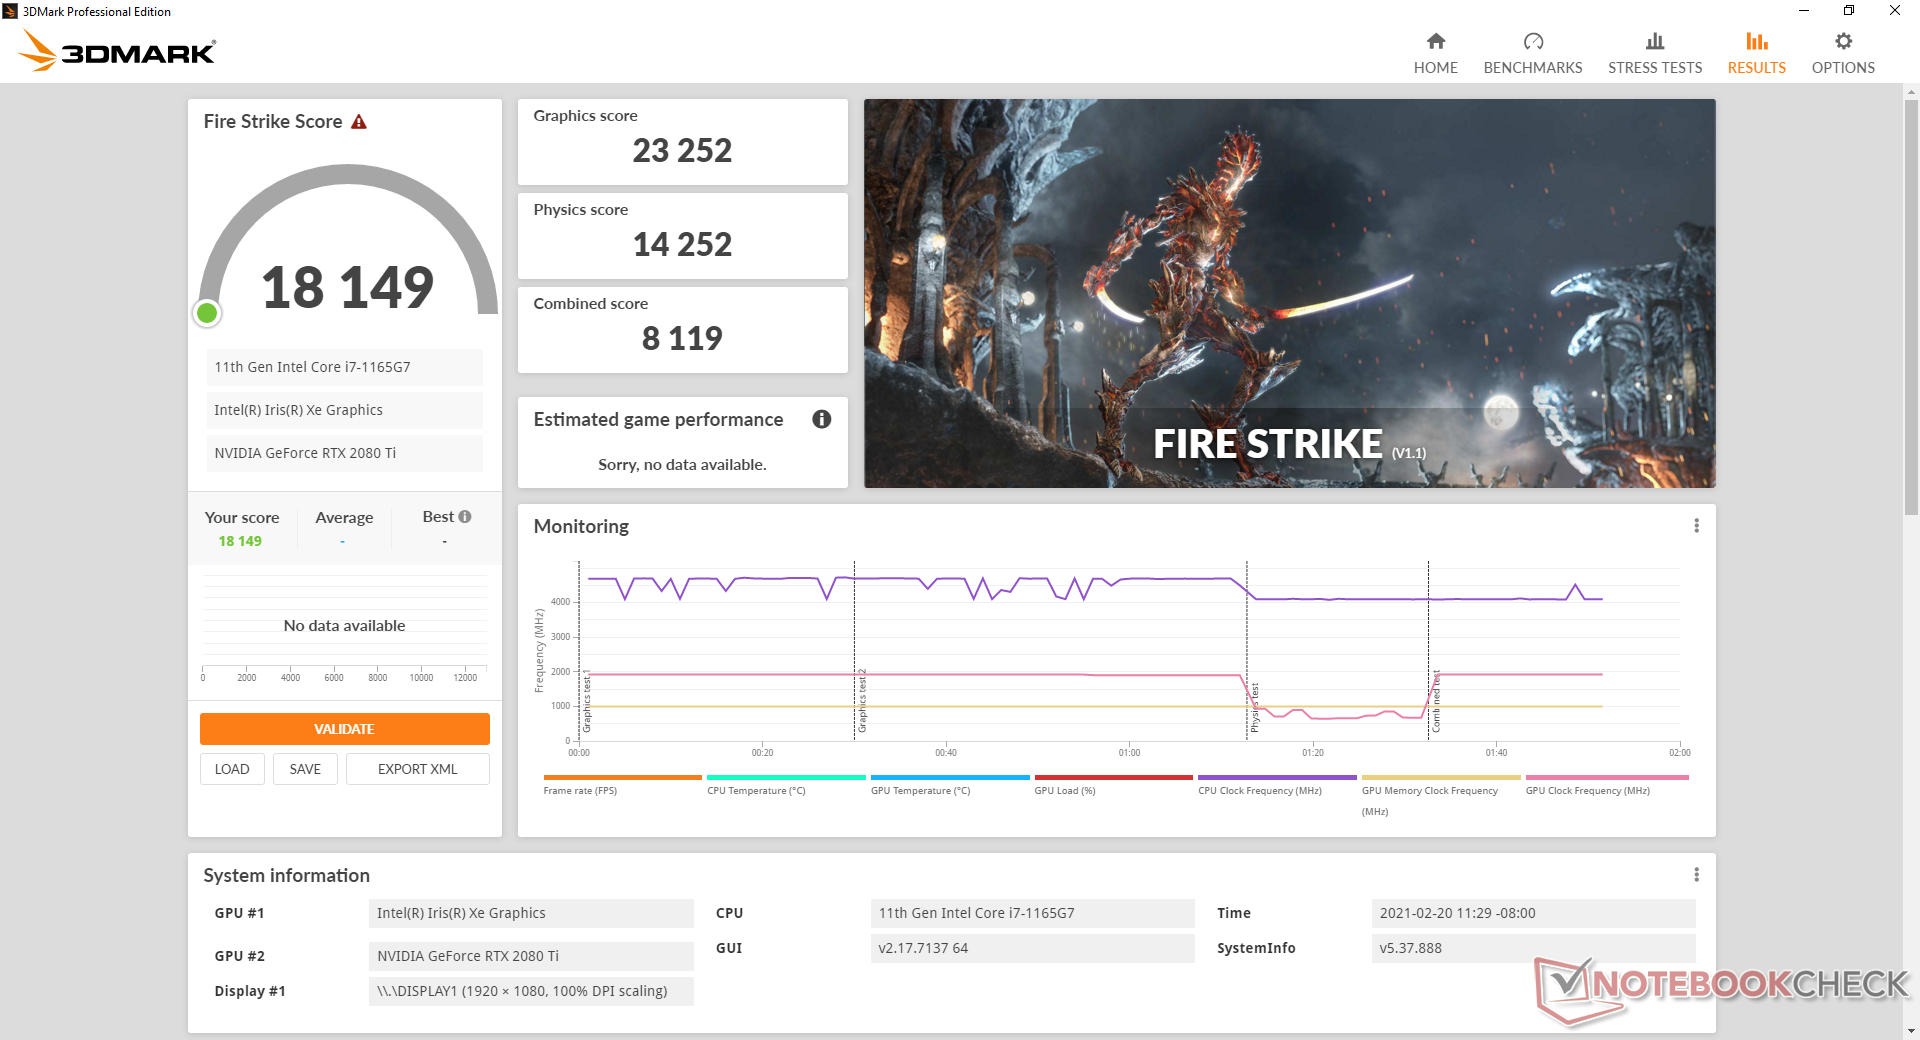
3DMark results are strikingly close to a desktop PC with a "proper" GeForce RTX 2080 Ti. Fire Strike 4K is just 7 percent behind our desktop PC reference while Fire Strike at FHD is 21 percent behind to suggest that the performance deficit against a desktop RTX 2080 Ti will be narrower when gaming in 4K resolutions. These results are consistent with what we observed on the Gaming Box RTX 2070 two years ago. Raw graphics potential can range anywhere between 8 to 30 percent faster than a flagship gaming laptop with the non-Max-Q GeForce RTX 2080.
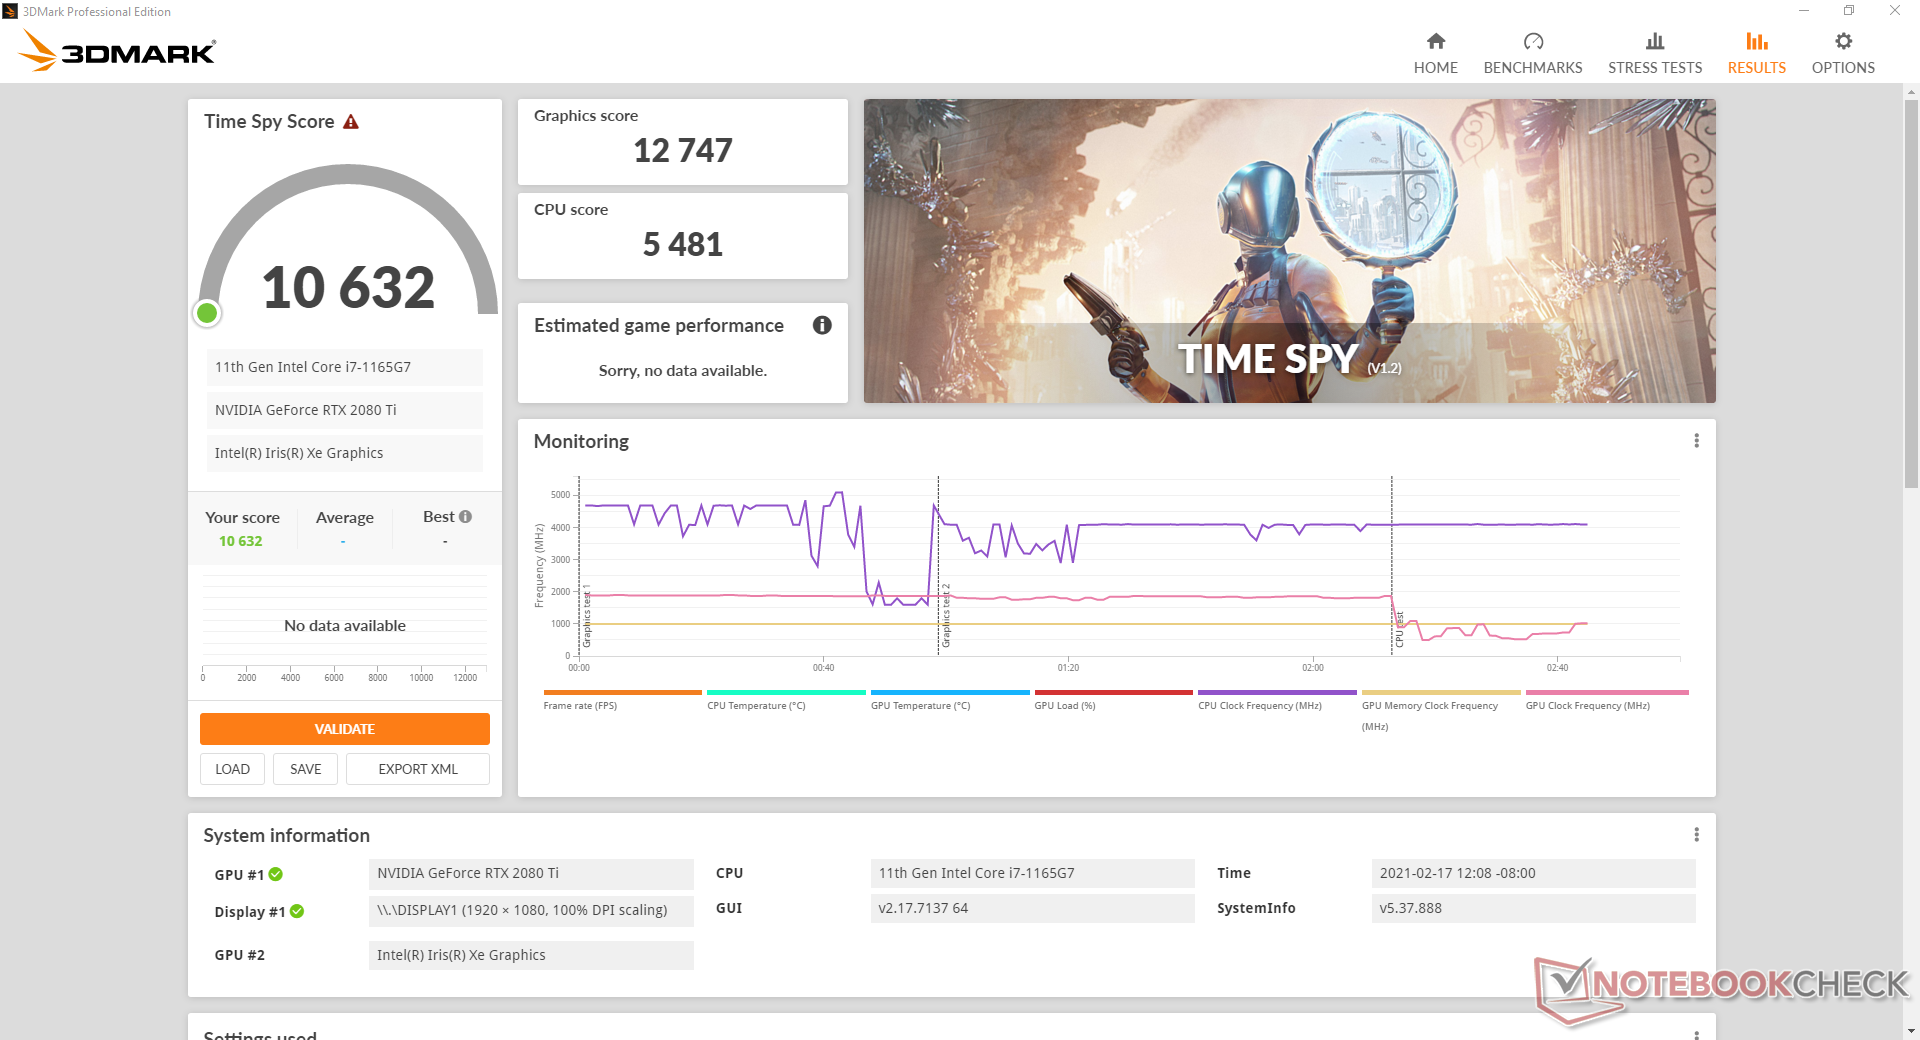
Graphics performance is further reduced if the monitor is connected directly to the NUC instead of the eGPU. The performance loss is again greater at lower resolutions as shown by our table below.


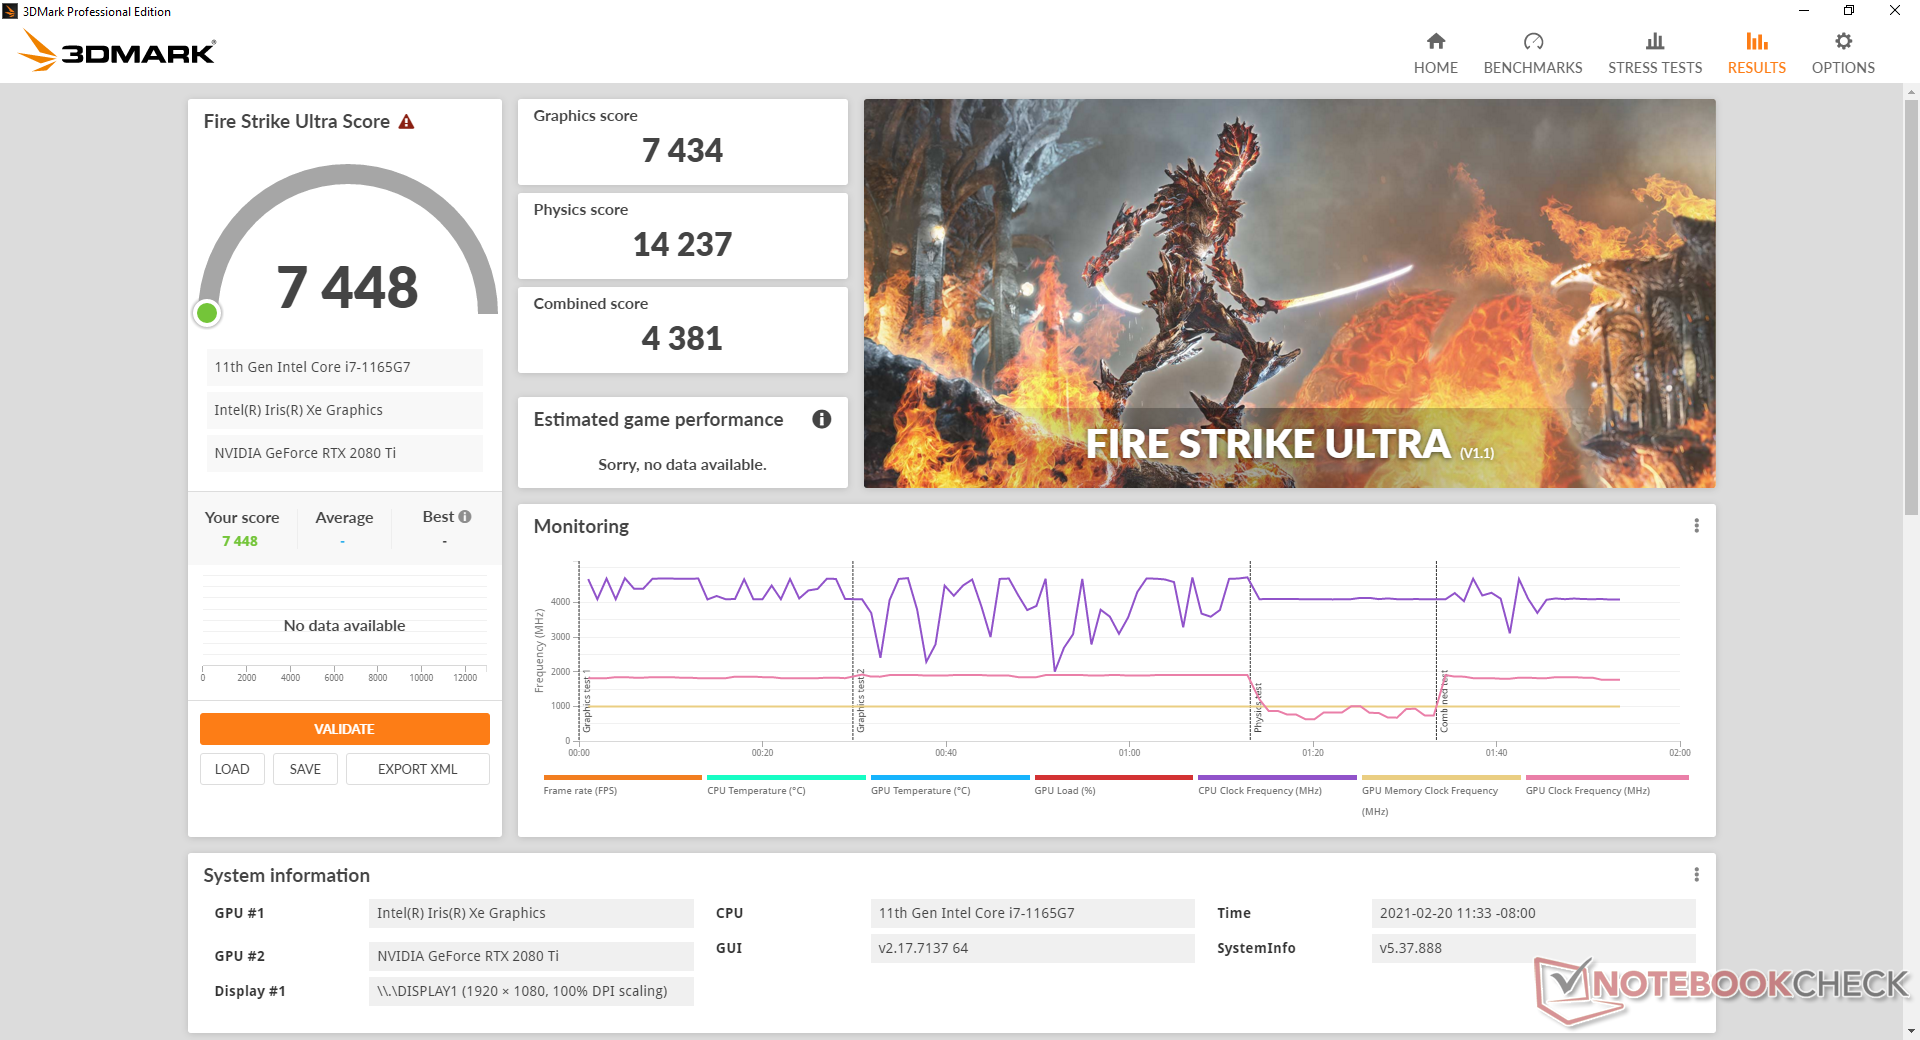
| Benchmark | Desktop PC GeForce RTX 2080 Ti Reference | Aorus Gaming Box GeForce RTX 2080 Ti w/ monitor connected to eGPU | Aorus Gaming Box GeForce RTX 2080 Ti w/ Monitor connected to NUC |
| Fire Strike Graphics Score | 34141 | 26814 (-21%) | 23252 (-32%) |
| Fire Strike Ultra Graphics Score | 8226 | 7632 (-7%) | 7434 (-10%) |
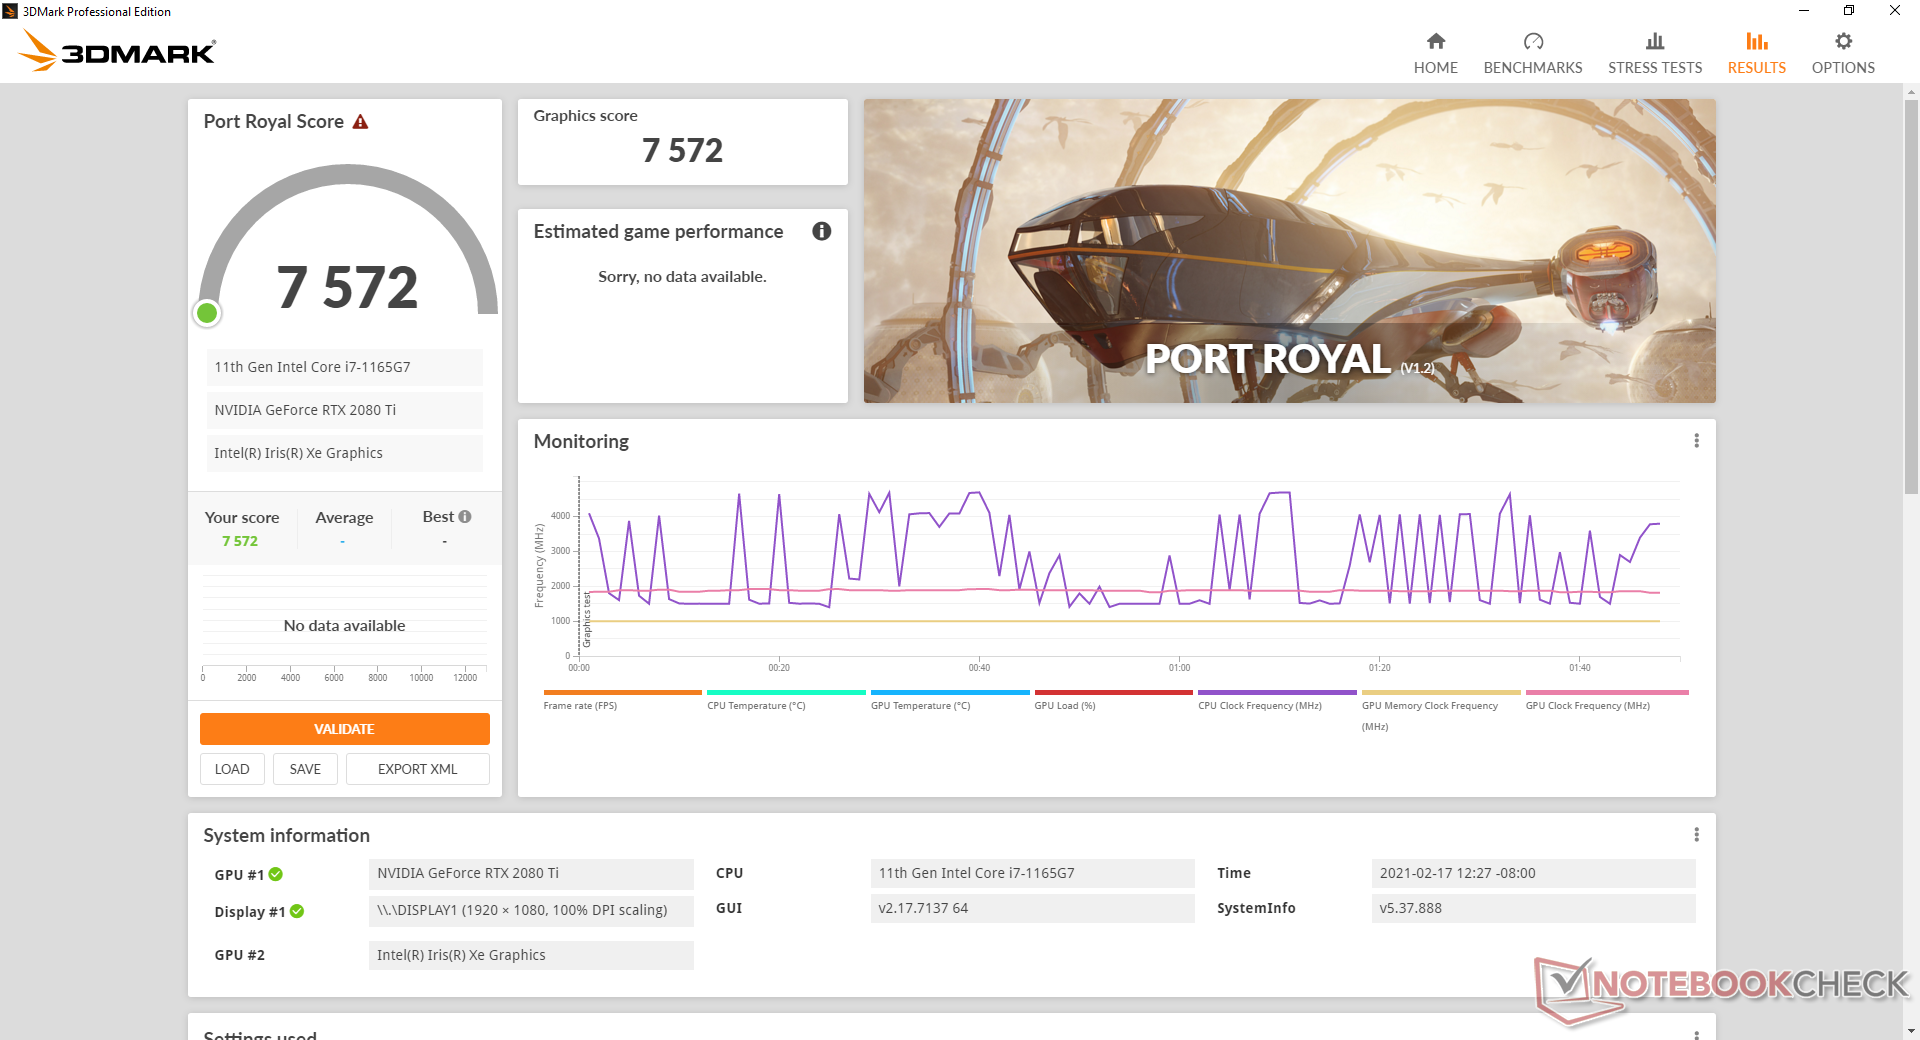
| Time Spy Graphics Score | 14283 | 12747 (-11%) | 11803 (-17%) |
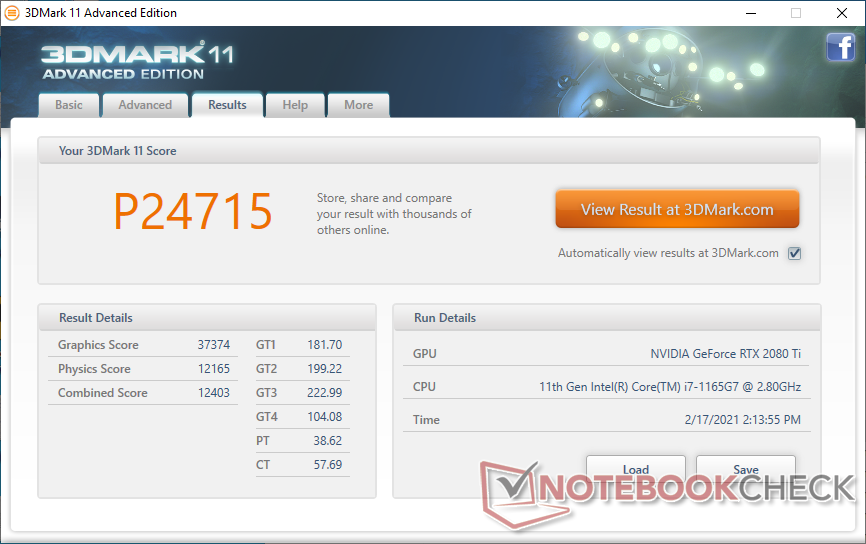
| 3DMark 11 Performance | 24715 points | |
| 3DMark Cloud Gate Standard Score | 33660 points | |
| 3DMark Fire Strike Score | 19990 points | |
| 3DMark Time Spy Score | 10632 points | |
Help | ||
Gaming Performance
Performance in real-world games is similar to what the 3DMark results suggest — average frame rates will be much closer to a desktop RTX 2080 Ti if running at 4K than if running at 1080p. The difference will depend highly on the game, however, with CPU-heavy titles like Total War: Three Kingdoms running up to 30 percent slower on our Gaming Box setup compared to just 7 percent when running Final Fantasy XV. Even so, most modern titles can maintain a locked 4K 60 FPS on Medium settings which is mighty impressive for a Core U-series Intel NUC.
| low | med. | high | ultra | QHD | 4K | |
|---|---|---|---|---|---|---|
| GTA V (2015) | 173 | 167 | 146 | 81 | 105 | |
| The Witcher 3 (2015) | 292.2 | 196.6 | 145.1 | 80.1 | 83.1 | |
| Dota 2 Reborn (2015) | 126 | 127 | 122 | 118 | 114 | |
| Final Fantasy XV Benchmark (2018) | 152 | 131 | 101 | 83.2 | 53.5 | |
| X-Plane 11.11 (2018) | 95.7 | 88.7 | 73.8 | 74.1 | ||
| Strange Brigade (2018) | 196 | 155 | 152 | 151 | 133 | 90.8 |
| Shadow of the Tomb Raider (2018) | 107 | 94 | 93 | 91 | 85 | 60 |
| Far Cry New Dawn (2019) | 113 | 97 | 93 | 84 | 81 | 65 |
| Total War: Three Kingdoms (2019) | 246.4 | 143.7 | 99.4 | 76.9 | 56.7 | 32.1 |
| F1 2020 (2020) | 188 | 157 | 147 | 116 | 103 | 74 |
Emissions
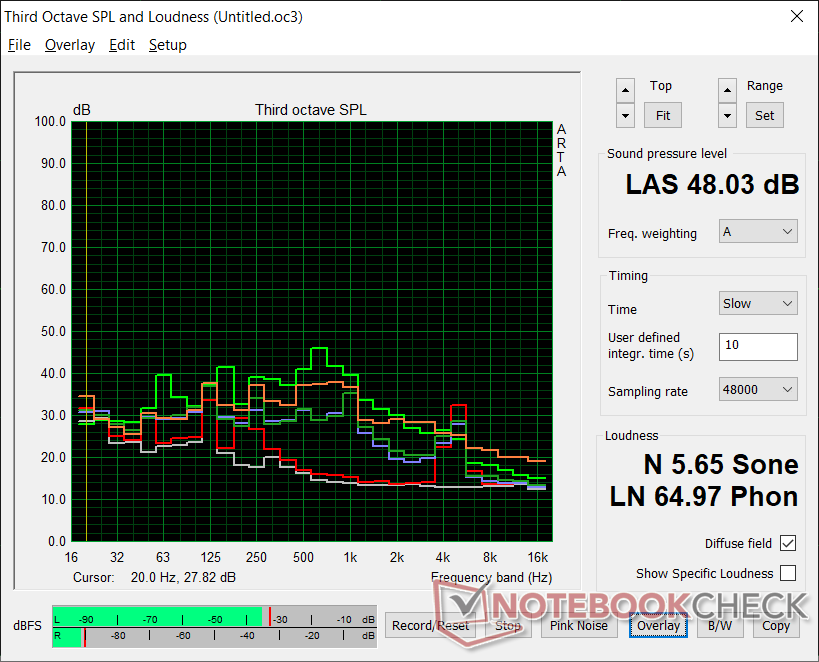
System Noise
Our test unit exhibits heavy high-pitched coil whine of about 5K Hz so long as it remains connected to an AC outlet. It's very noticeable at 34.7 dB(A) against a silent background of 26.5 dB(A). Fan noise would increase to 44 dB(A) when gaming or 48 dB(A) when under 100 percent utilization. Coil whine, however, would annoyingly remain. The fans in gaming laptops are generally more noticeable because they are smaller and therefore higher-pitched, but it's hard to ignore the coil whine issue on our Gaming Box.
| Aorus Gaming Box GeForce RTX 2080 Ti , i7-1165G7 | MSI GT76 Titan DT 10SGS GeForce RTX 2080 Super Mobile, i9-10900K, 2x WDC PC SN730 SDBPNTY-1T00 (RAID 0) | Alienware m17 R3 P45E GeForce RTX 2080 Super Mobile, i9-10980HK, 2x Micron 2200S 512 GB (RAID 0) | Asus ROG Zephyrus Duo 15 SE GX551QS GeForce RTX 3080 Laptop GPU, R9 5900HX, 2x Samsung PM981a MZVLB1T0HBLR (RAID 0) | Asus ROG Strix G15 G513QR GeForce RTX 3070 Laptop GPU, R9 5900HX, SK Hynix HFM001TD3JX013N | Intel NUC11PAQi7 Iris Xe G7 96EUs, i7-1165G7, Samsung SSD 980 Pro 500GB MZ-V8P500BW | |
|---|---|---|---|---|---|---|
| Noise | 3% | 1% | 13% | 7% | 18% | |
| off / environment * (dB) | 26.5 | 26.4 -0% | 26.5 -0% | 27 -2% | 24 9% | 25.6 3% |
| Idle Minimum * (dB) | 34.7 | 27.5 21% | 27.8 20% | 27 22% | 25 28% | 25.6 26% |
| Idle Average * (dB) | 39.1 | 27.5 30% | 27.8 29% | 27 31% | 31 21% | 25.6 35% |
| Idle Maximum * (dB) | 39.1 | 29.8 24% | 27.8 29% | 27 31% | 33 16% | 25.6 35% |
| Load Average * (dB) | 39.5 | 30.9 22% | 52.1 -32% | 31.2 21% | 45 -14% | 33.6 15% |
| Witcher 3 ultra * (dB) | 43.7 | 60.7 -39% | 51.8 -19% | 44.5 -2% | 48 -10% | 33.6 23% |
| Load Maximum * (dB) | 48 | 66.6 -39% | 59.1 -23% | 53.5 -11% | 50 -4% | 54.5 -14% |
* ... smaller is better
Noise level
| Idle |
| 34.7 / 39.1 / 39.1 dB(A) |
| Load |
| 39.5 / 48 dB(A) |
 | ||
30 dB silent 40 dB(A) audible 50 dB(A) loud |
||
min: | ||
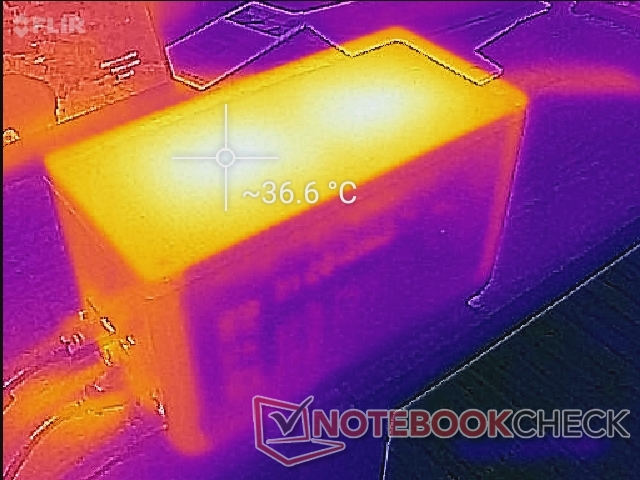
Temperature
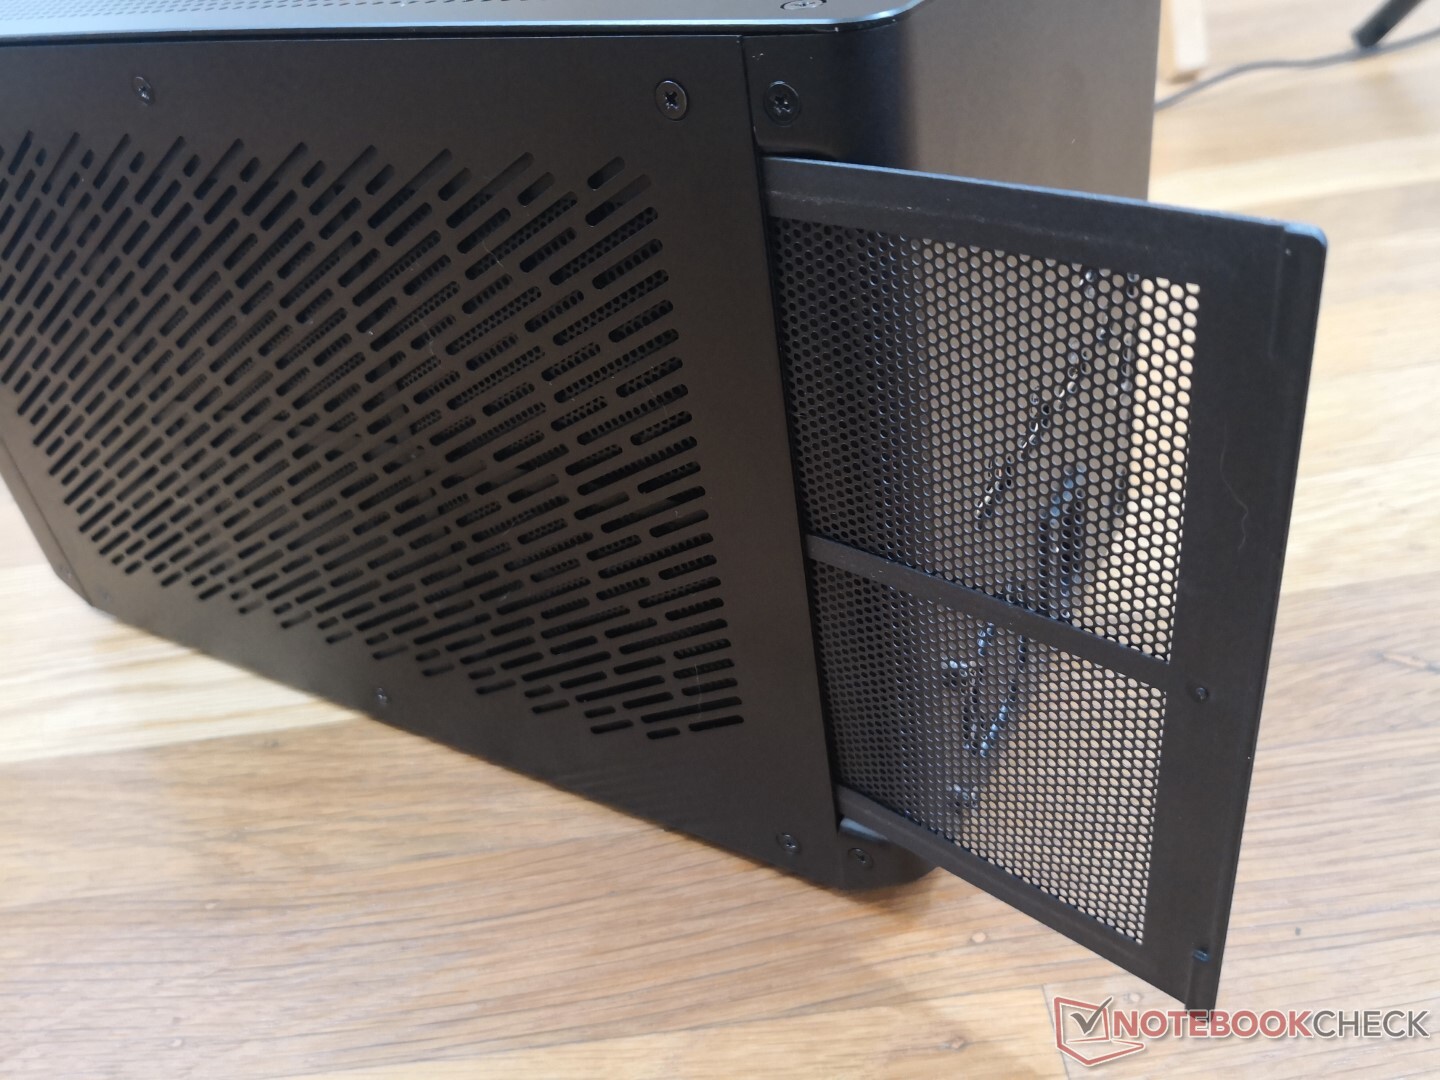
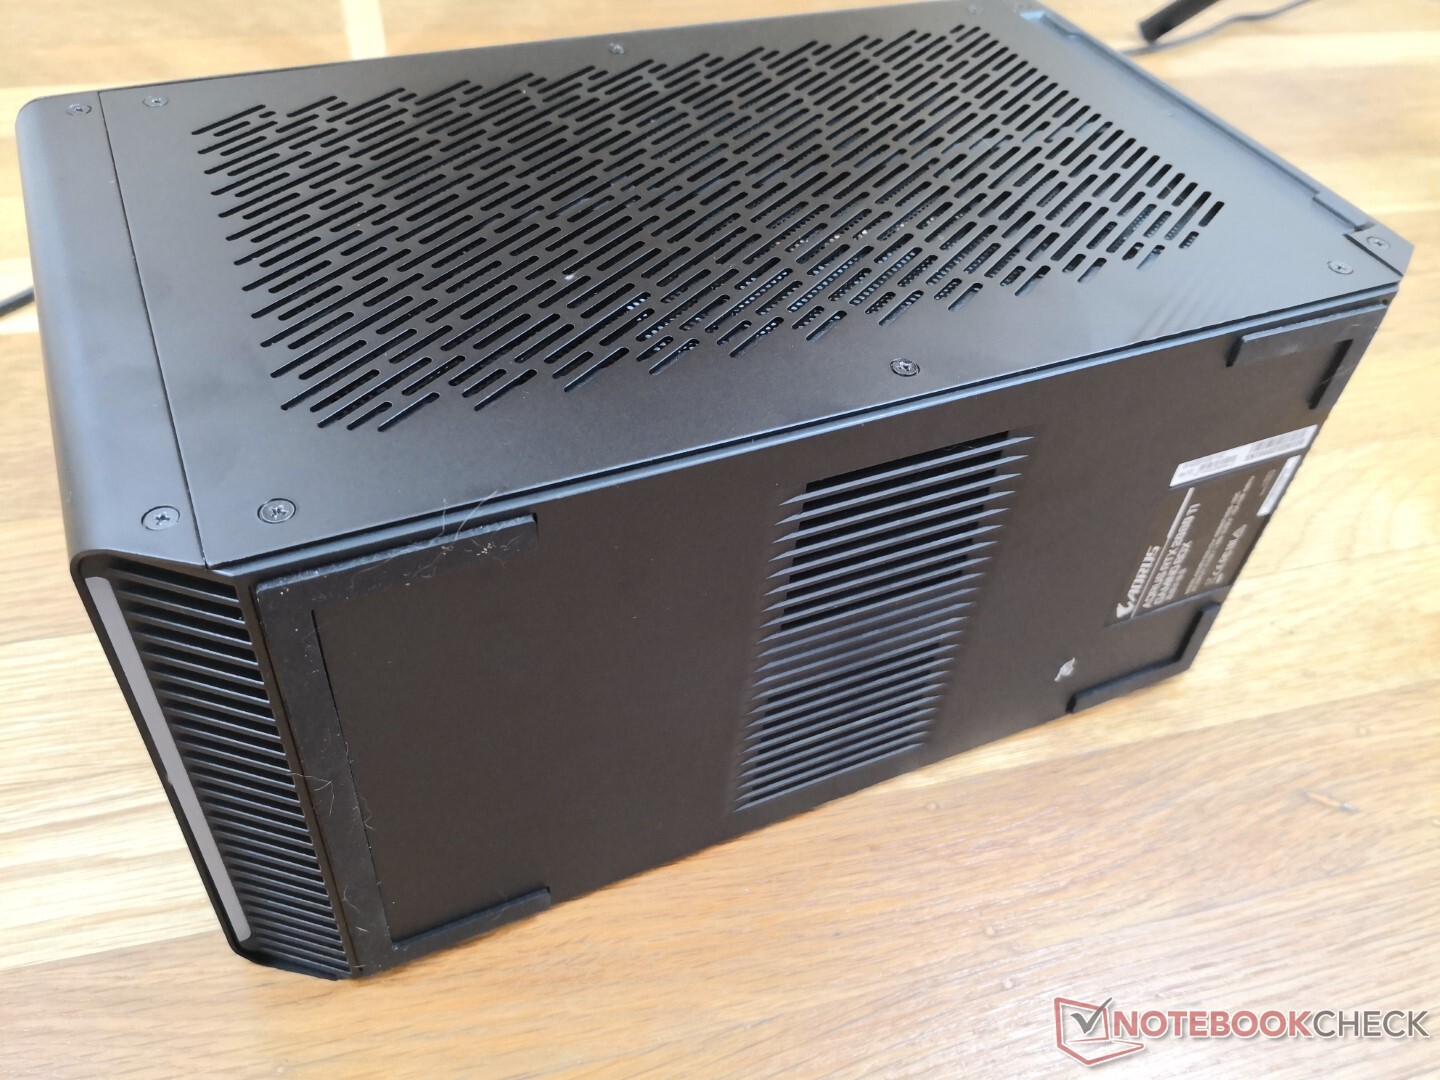
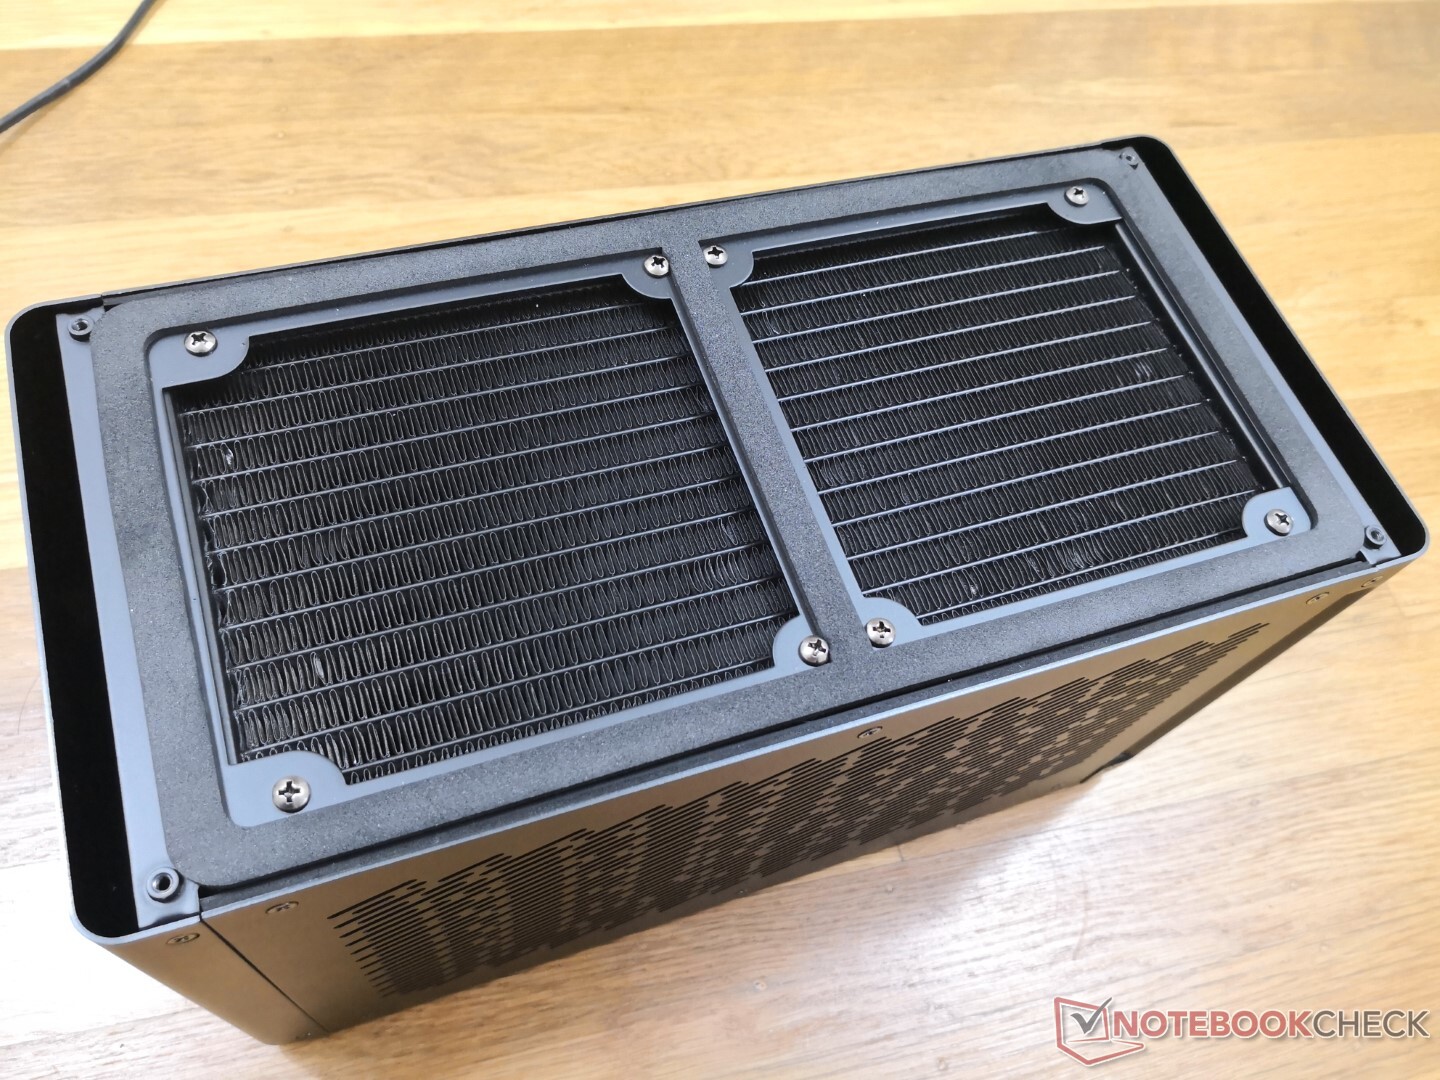
Cool air enters from three sides while the grilles on top serve as exhaust. Thus, it's not recommended to place any items on top of the Gaming Box or orient it on its sides or else cooling will be hindered.


Stress Test
Running Witcher 3 results in a stable GPU clock and temperature of 1875 MHz and 52 C, respectively. Core temperature would max out at just under 60 C even when under 100 percent utilization on FurMark.
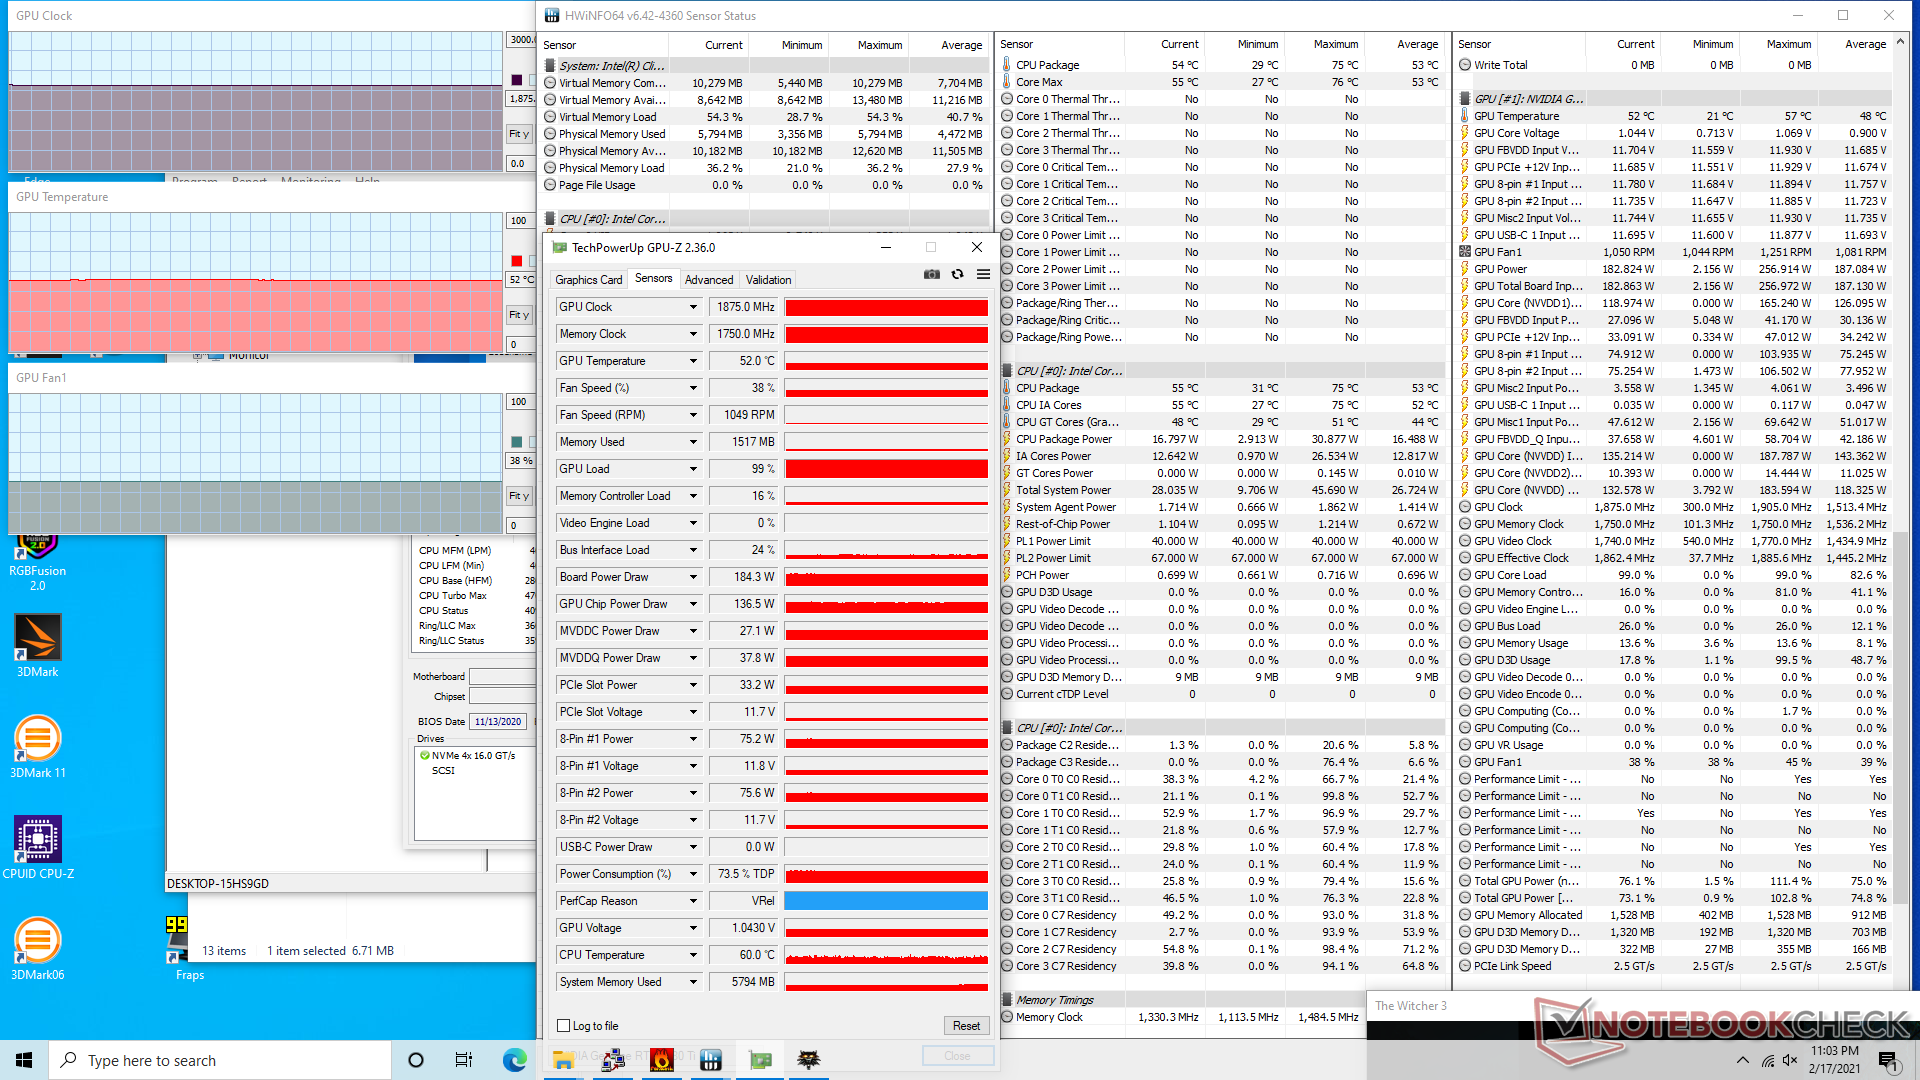
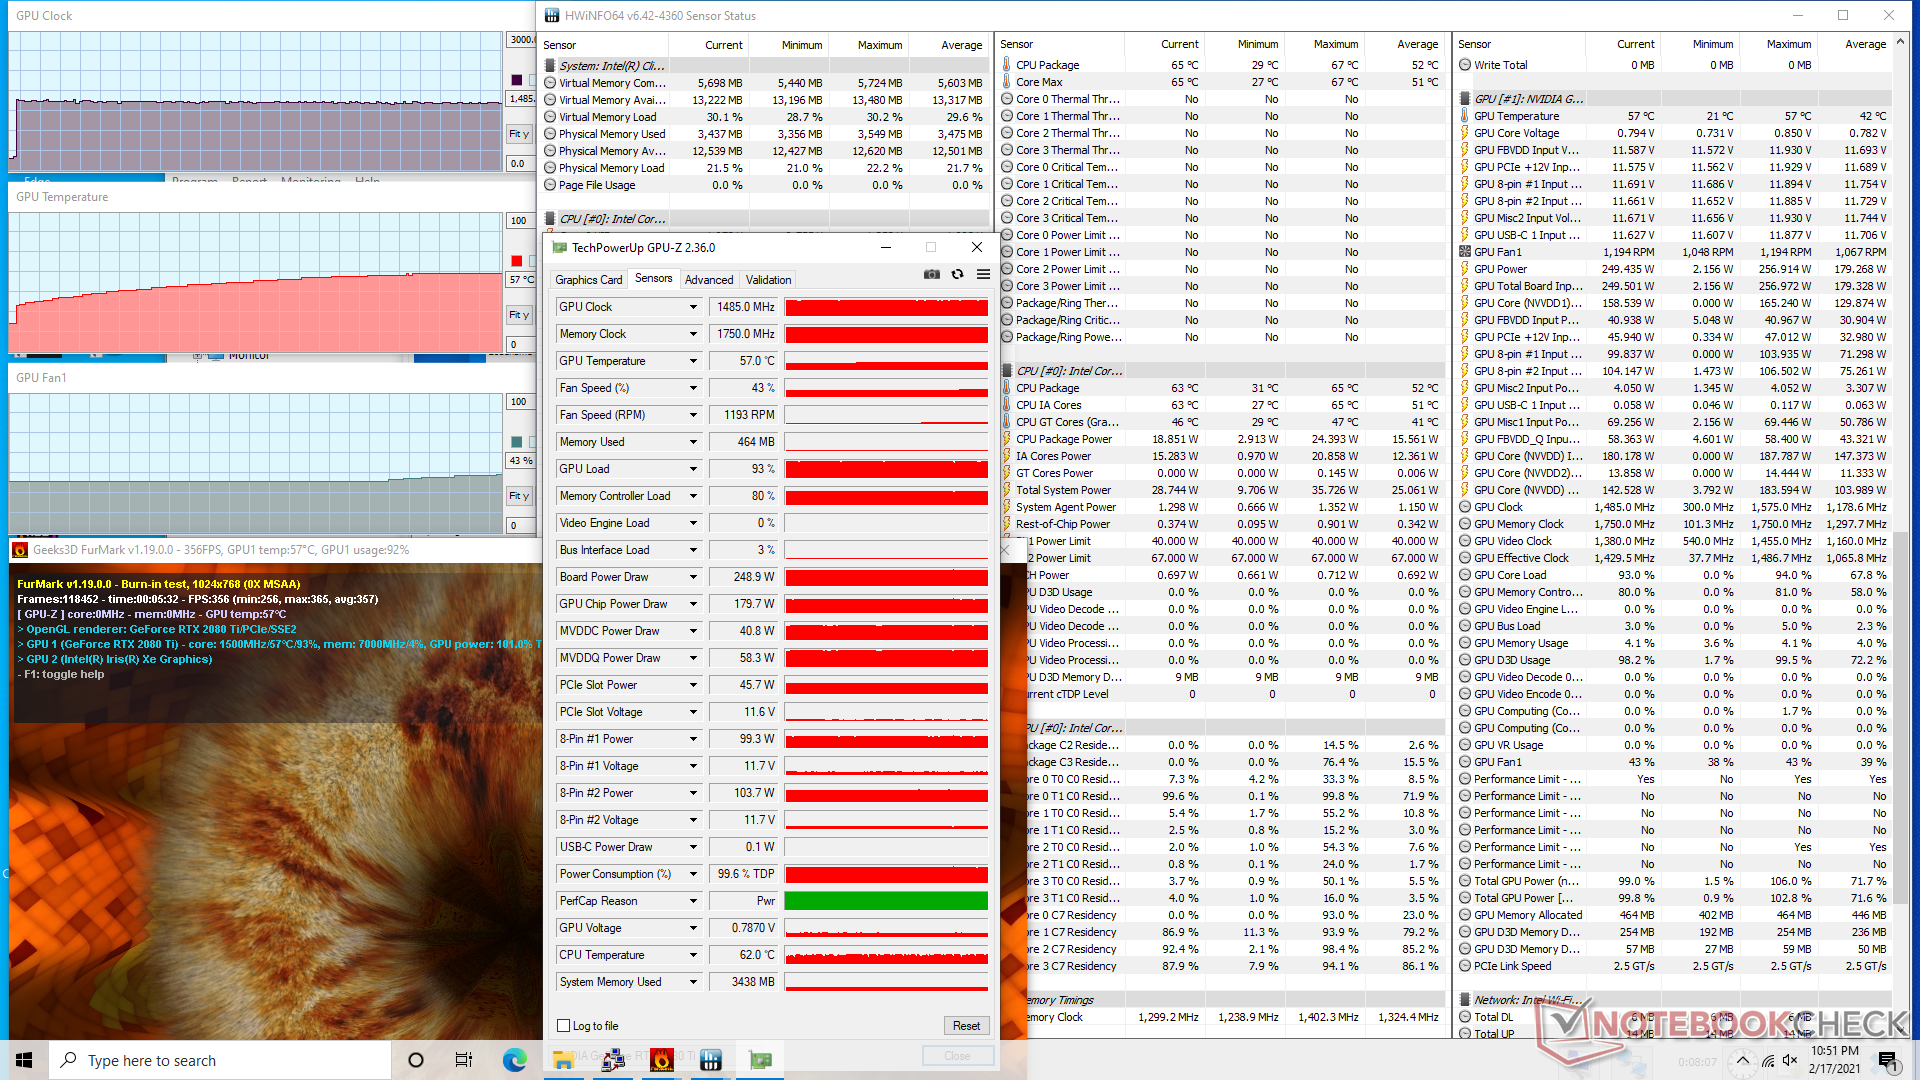
| CPU Clock (GHz) | GPU Clock (MHz) | Average CPU Temperature (°C) | Average GPU Temperature (°C) | |
| System Idle | -- | -- | 34 | 21 |
| FurMark Stress | -- | 1485 | 62 | 57 |
| Witcher 3 Stress | -- | 1875 | 60 | 52 |
Energy Management
Power Consumption
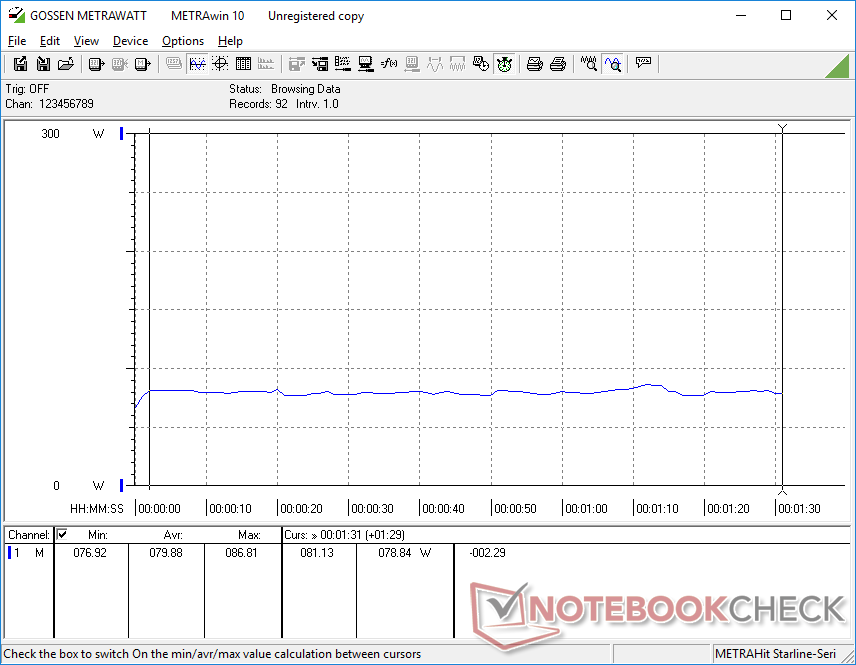
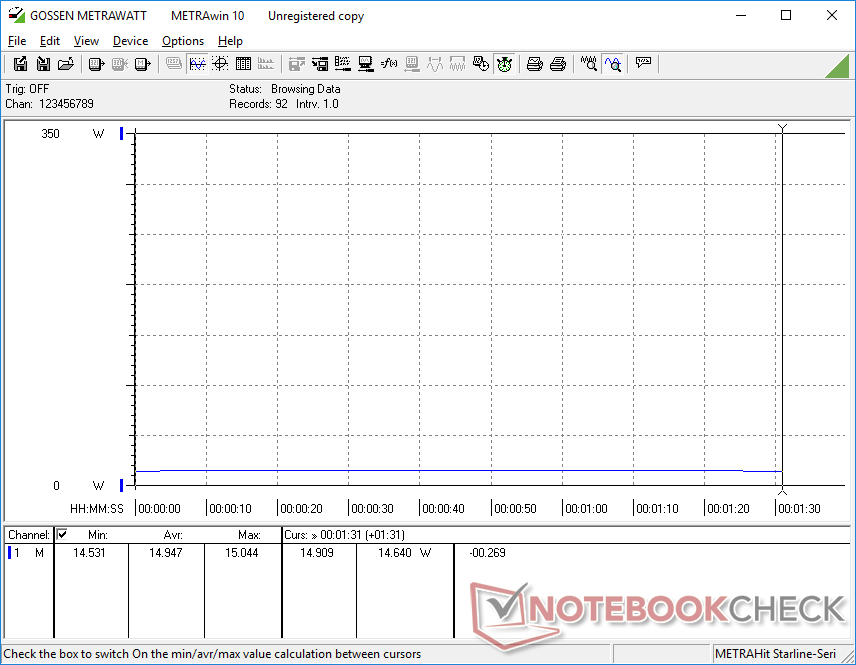
The Gaming Box consumes 29.6 W when idling on desktop. if the PC is asleep or powered off, the eGPU will continue to consume 27 W and 14.9 W, respectively. The fact that there is no "power off" button on the Gaming Box is very frustrating especially since the coil whine remains audible even when the main PC is off.
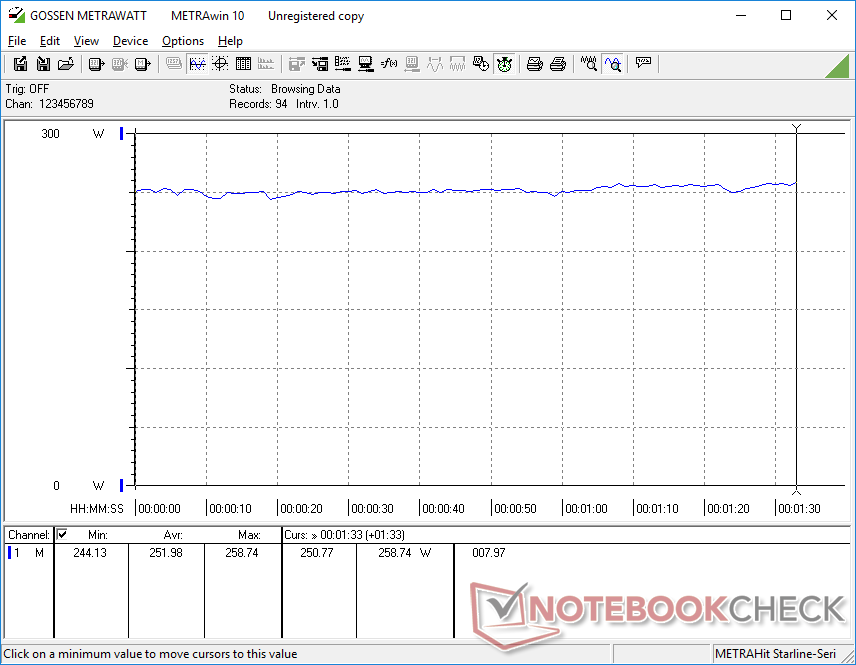
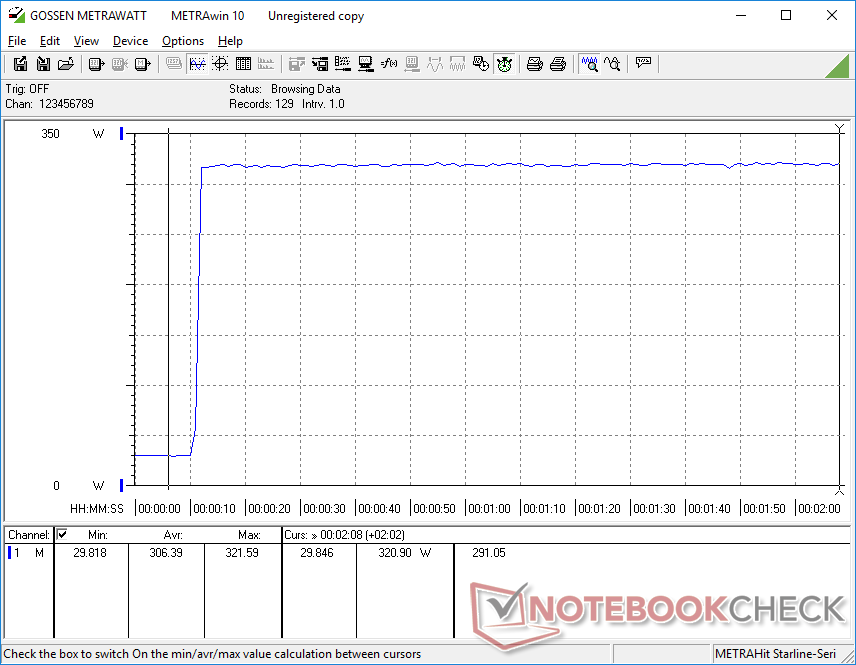
Running Witcher 3 consumes significantly more power than most GeForce RTX 20 or RTX 30 gaming laptops. The Gaming Box alone would draw 252 W plus approximately 30 W from the NUC for a total of ~282 W compared to just 181 W on the dual-screen Asus ROG Zephyrus Duo SE with the RTX 3080.
| Off / Standby | |
| Idle | |
| Load |
|
Key:
min: | |
| Aorus Gaming Box GeForce RTX 2080 Ti i7-1165G7, , , , x, | MSI GT76 Titan DT 10SGS i9-10900K, GeForce RTX 2080 Super Mobile, 2x WDC PC SN730 SDBPNTY-1T00 (RAID 0), IPS, 3840x2160, 17.3" | Alienware m17 R3 P45E i9-10980HK, GeForce RTX 2080 Super Mobile, 2x Micron 2200S 512 GB (RAID 0), IPS, 1920x1080, 17.3" | Asus ROG Zephyrus Duo 15 SE GX551QS R9 5900HX, GeForce RTX 3080 Laptop GPU, 2x Samsung PM981a MZVLB1T0HBLR (RAID 0), IPS, 3840x2160, 15.6" | Asus ROG Strix G15 G513QR R9 5900HX, GeForce RTX 3070 Laptop GPU, SK Hynix HFM001TD3JX013N, IPS, 1920x1080, 15.6" | Intel NUC11PAQi7 i7-1165G7, Iris Xe G7 96EUs, Samsung SSD 980 Pro 500GB MZ-V8P500BW, , x, | |
|---|---|---|---|---|---|---|
| Power Consumption | -37% | -38% | 9% | 22% | 77% | |
| Idle Minimum * (Watt) | 29.6 | 25.9 12% | 33.6 -14% | 16.3 45% | 4 86% | 5.6 81% |
| Idle Average * (Watt) | 29.6 | 38 -28% | 43.9 -48% | 22.5 24% | 9 70% | 5.6 81% |
| Idle Maximum * (Watt) | 29.6 | 53.2 -80% | 59 -99% | 39.9 -35% | 36 -22% | 6 80% |
| Load Average * (Watt) | 79.9 | 123.8 -55% | 134.9 -69% | 116.1 -45% | 130 -63% | 31.4 61% |
| Witcher 3 ultra * (Watt) | 252 | 312.5 -24% | 242 4% | 181.2 28% | 174 31% | 39 85% |
| Load Maximum * (Watt) | 319.8 | 459.8 -44% | 320 -0% | 196.7 38% | 227 29% | 80.5 75% |
* ... smaller is better
Pros
Cons
Verdict
The data speaks for itself. Performance is remarkably close to a desktop PC powered by the same GeForce RTX 2080 Ti. The gap widens if gaming at 1080p where the higher frame rates are bottlenecked by the narrow PCIe x4 Thunderbolt 3 lanes and weaker Core U-series CPU. Owners are encouraged to game at 4K resolution to get the most out of the Gaming Box.
Performance is extraordinary to the point where it can best even the latest GeForce RTX 2080 or 3080 gaming laptops. However, owners should watch out for some software bugs and coil whine peculiarities along the way.
The portability and small size of the Gaming Box are worth mentioning especially when compared to the larger Razer or Alienware alternatives. However, the price to pay is a GPU that is more difficult to remove or upgrade. The software could also use a facelift as its UI feels like an unfinished product.
We can't ignore the prominent coil whine or electronic noise from our test unit that new owners should absolutely check for. There is definitely room for improvement in regard to power consumption when the Gaming Box is idling with no PC activity.
Price and availability
The Gigabyte Aorus Gaming Box is now available on Newegg for over $2300 USD at the time of writing. Supplies are low, however, meaning availability and prices will continue to fluctuate in the months ahead.
Price comparison
