Deutsch
 English
 Español
 Français
 Italiano
 Nederlands
 Polski
 Português
 Русский
 Türkçe
 Svenska
 Chinese
 Magyar
Review Clevo P170SM-A (One K73-4N) Barebones Notebook
For the original German review, see here.
While we are still waiting for the next product generation from Asus, Alienware and MSI, the technology expert One has already provided us with a laptop that sports Nvidia's brand new GeForce GTX 870M.
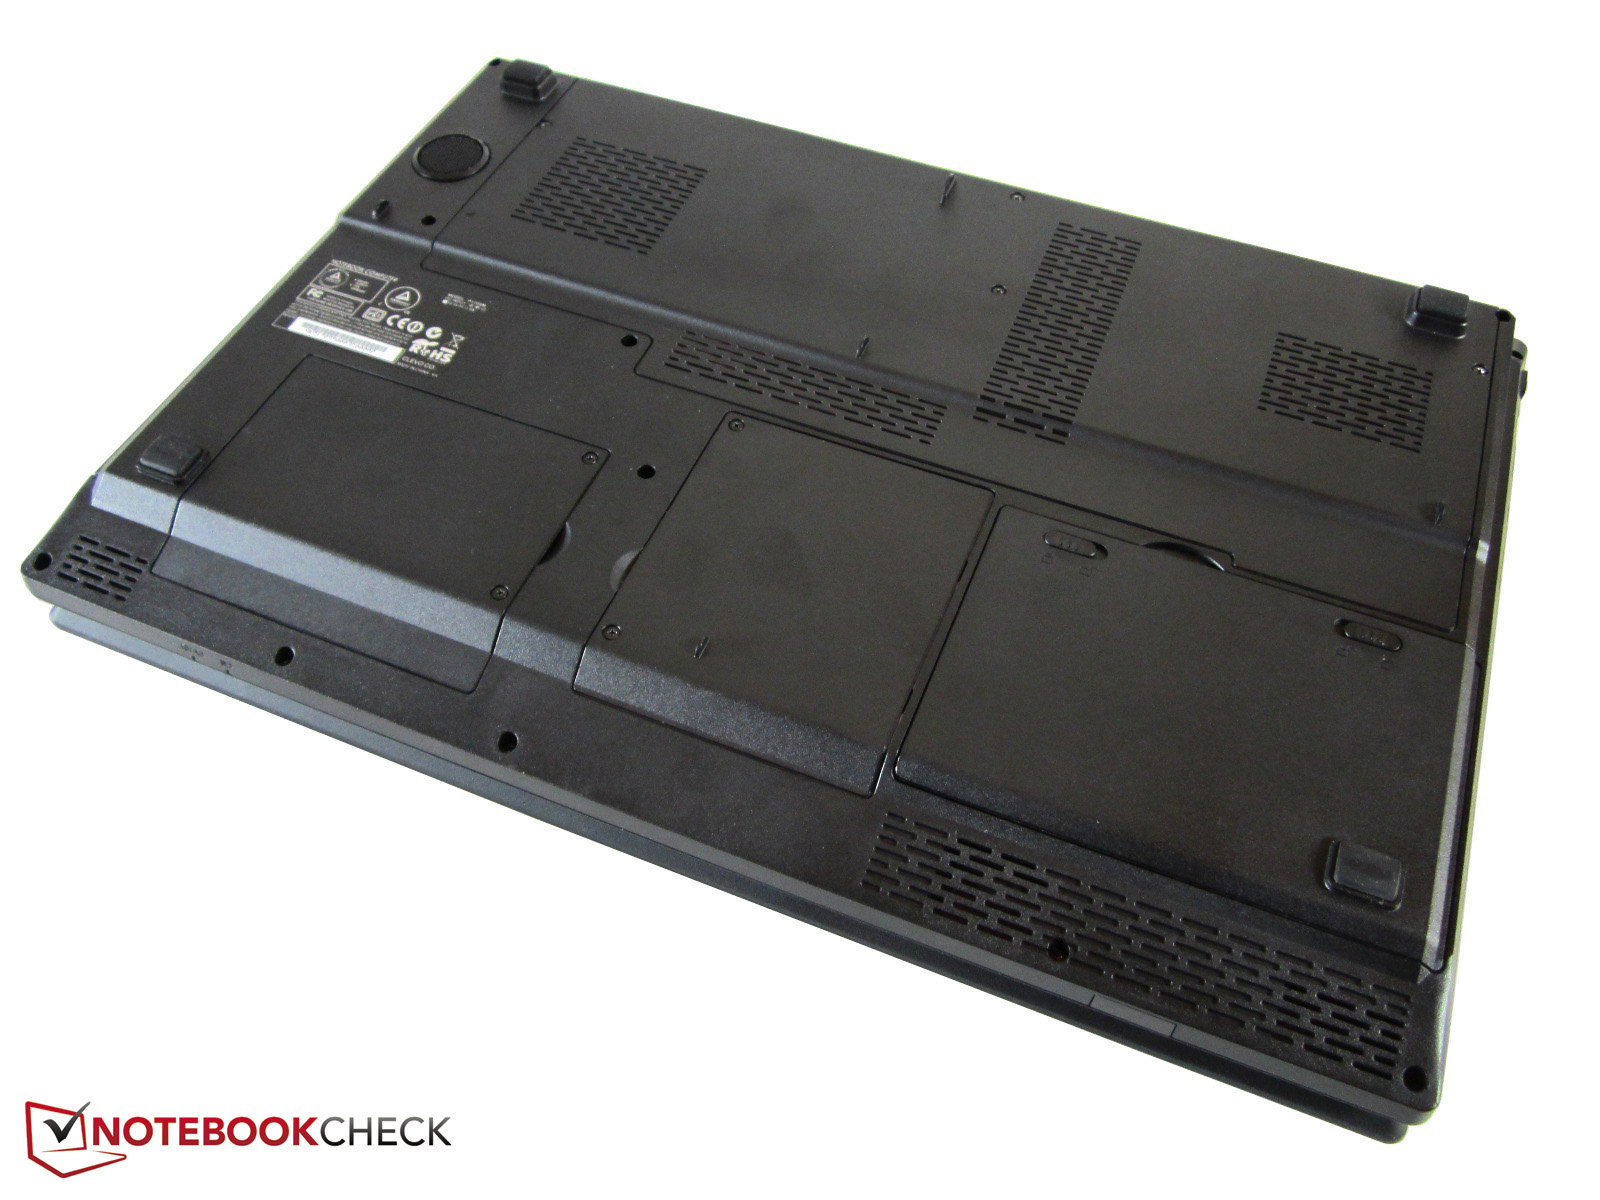
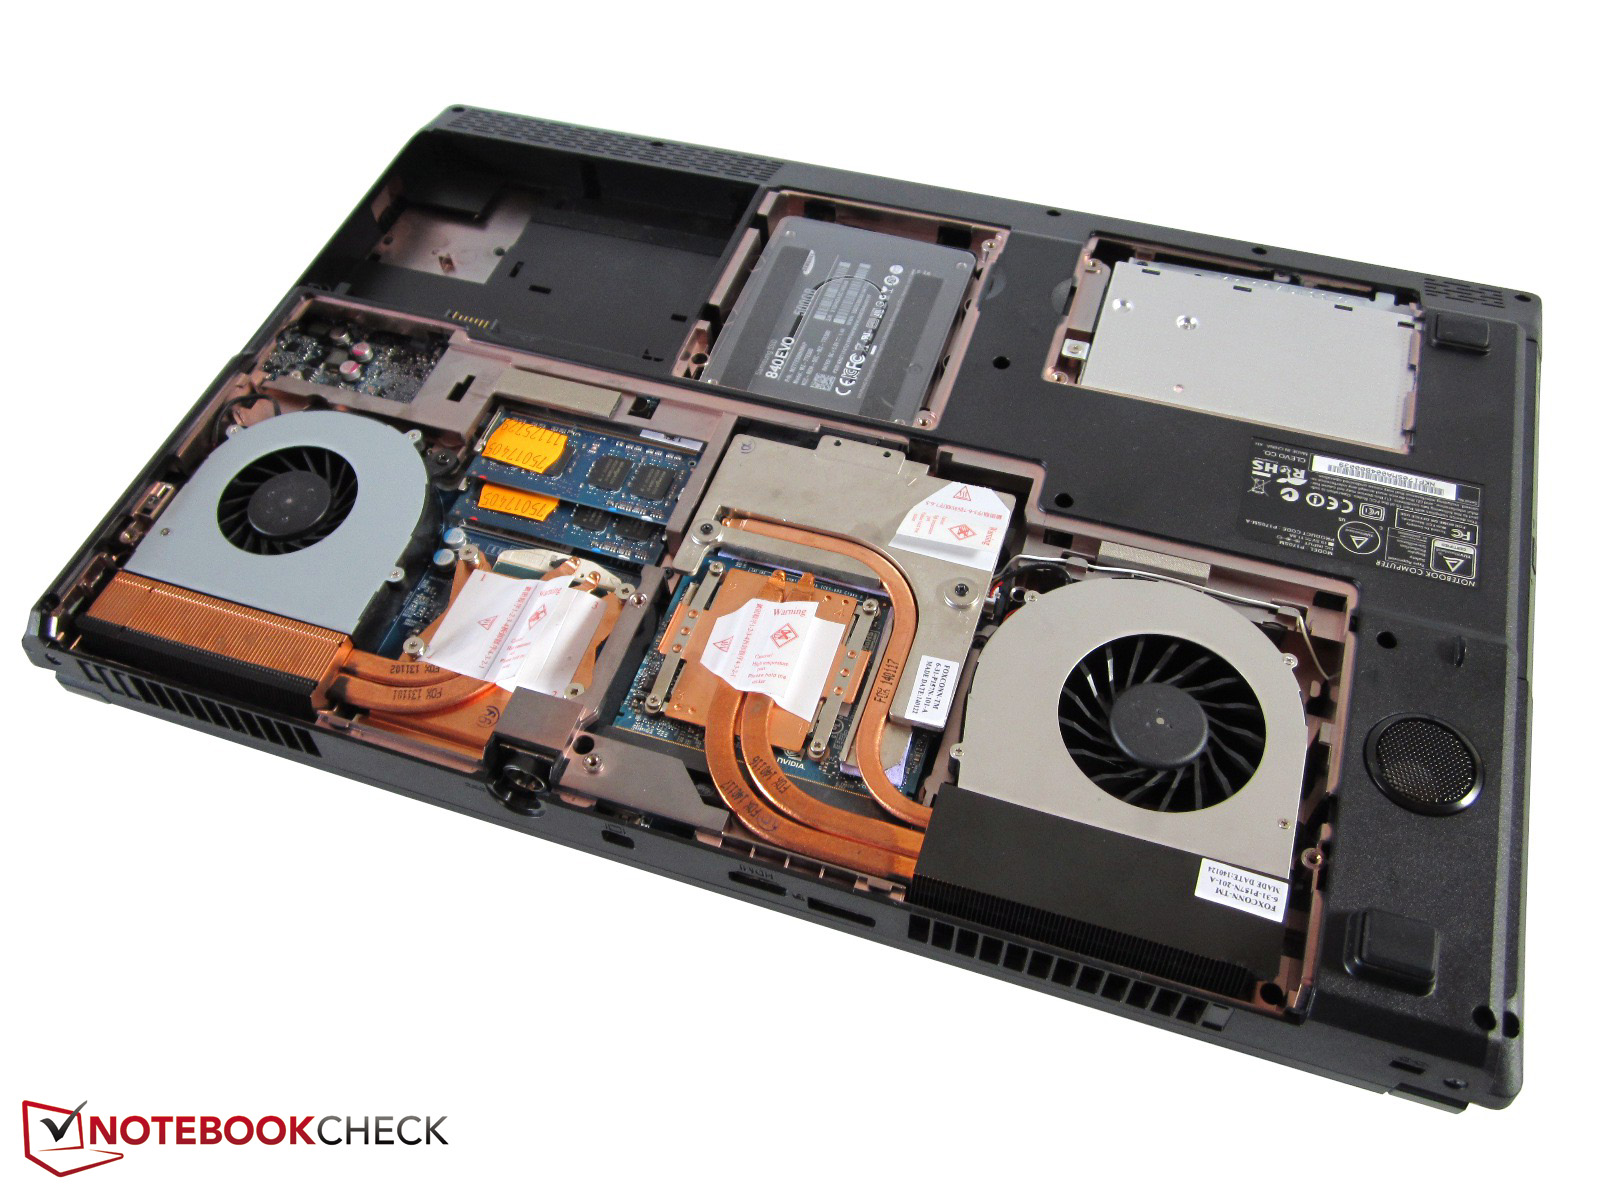
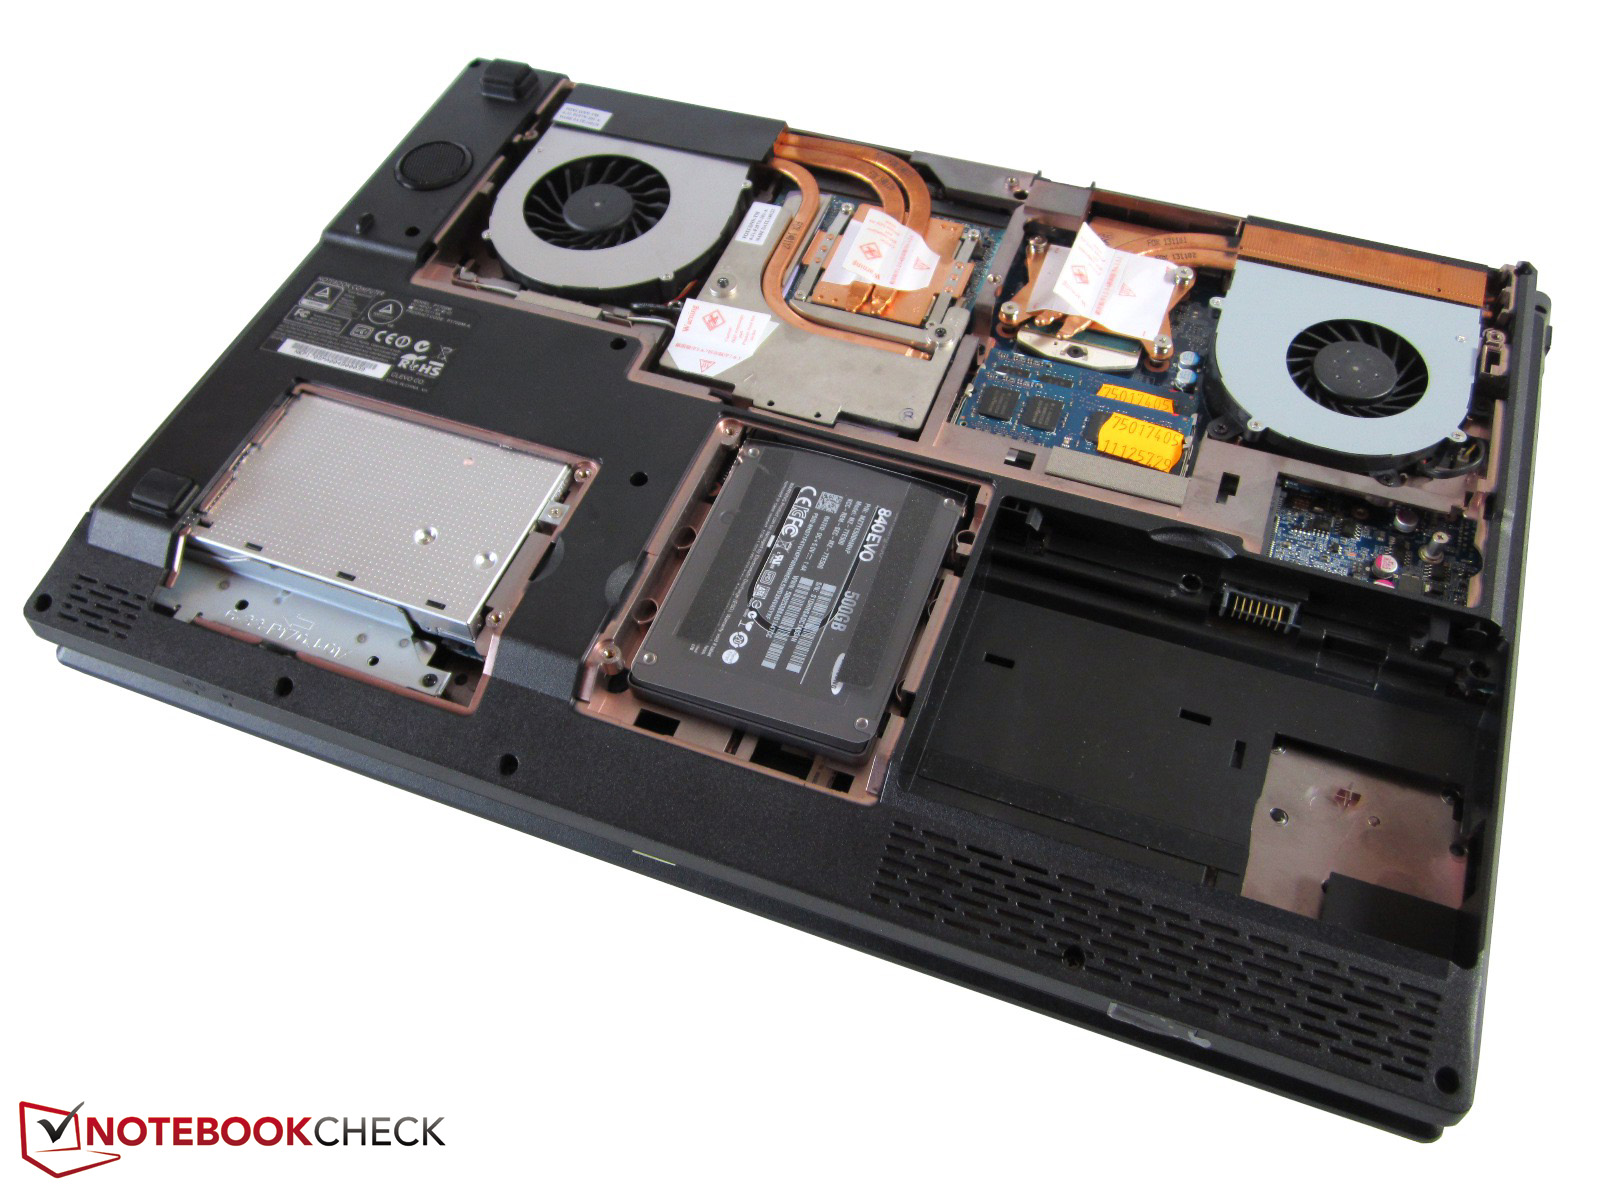
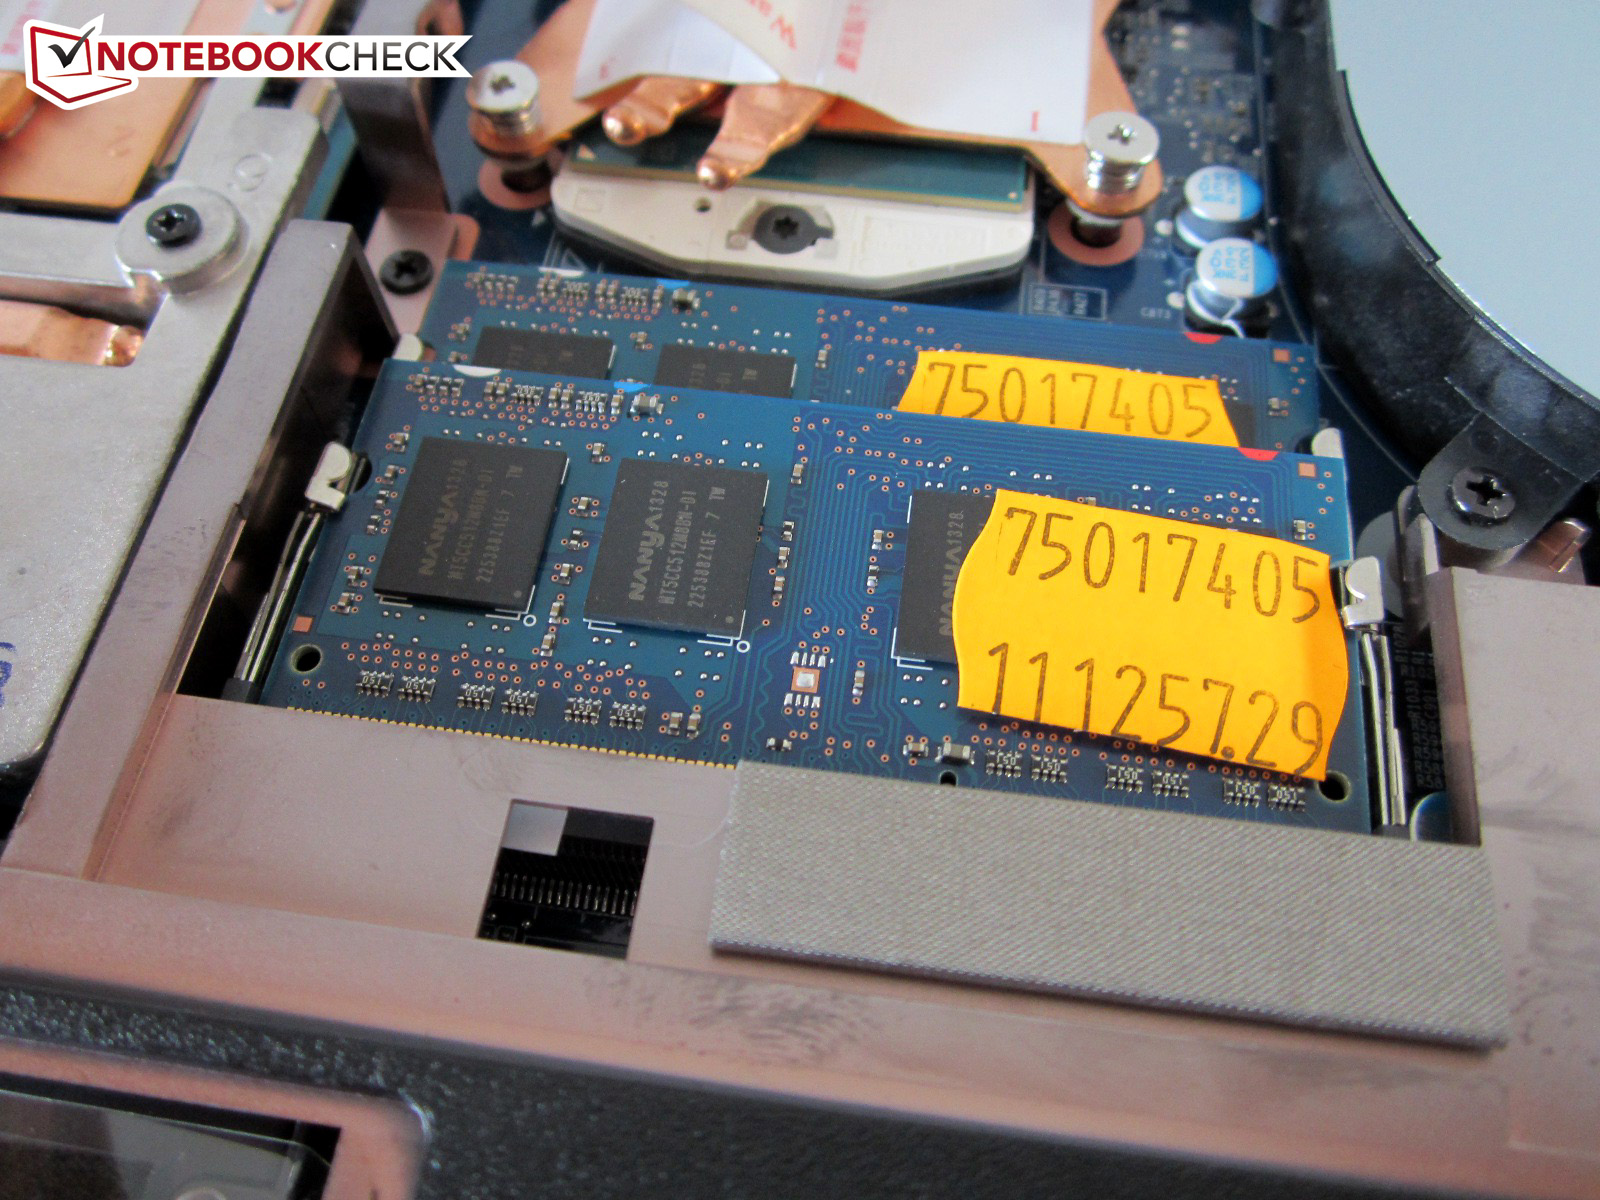
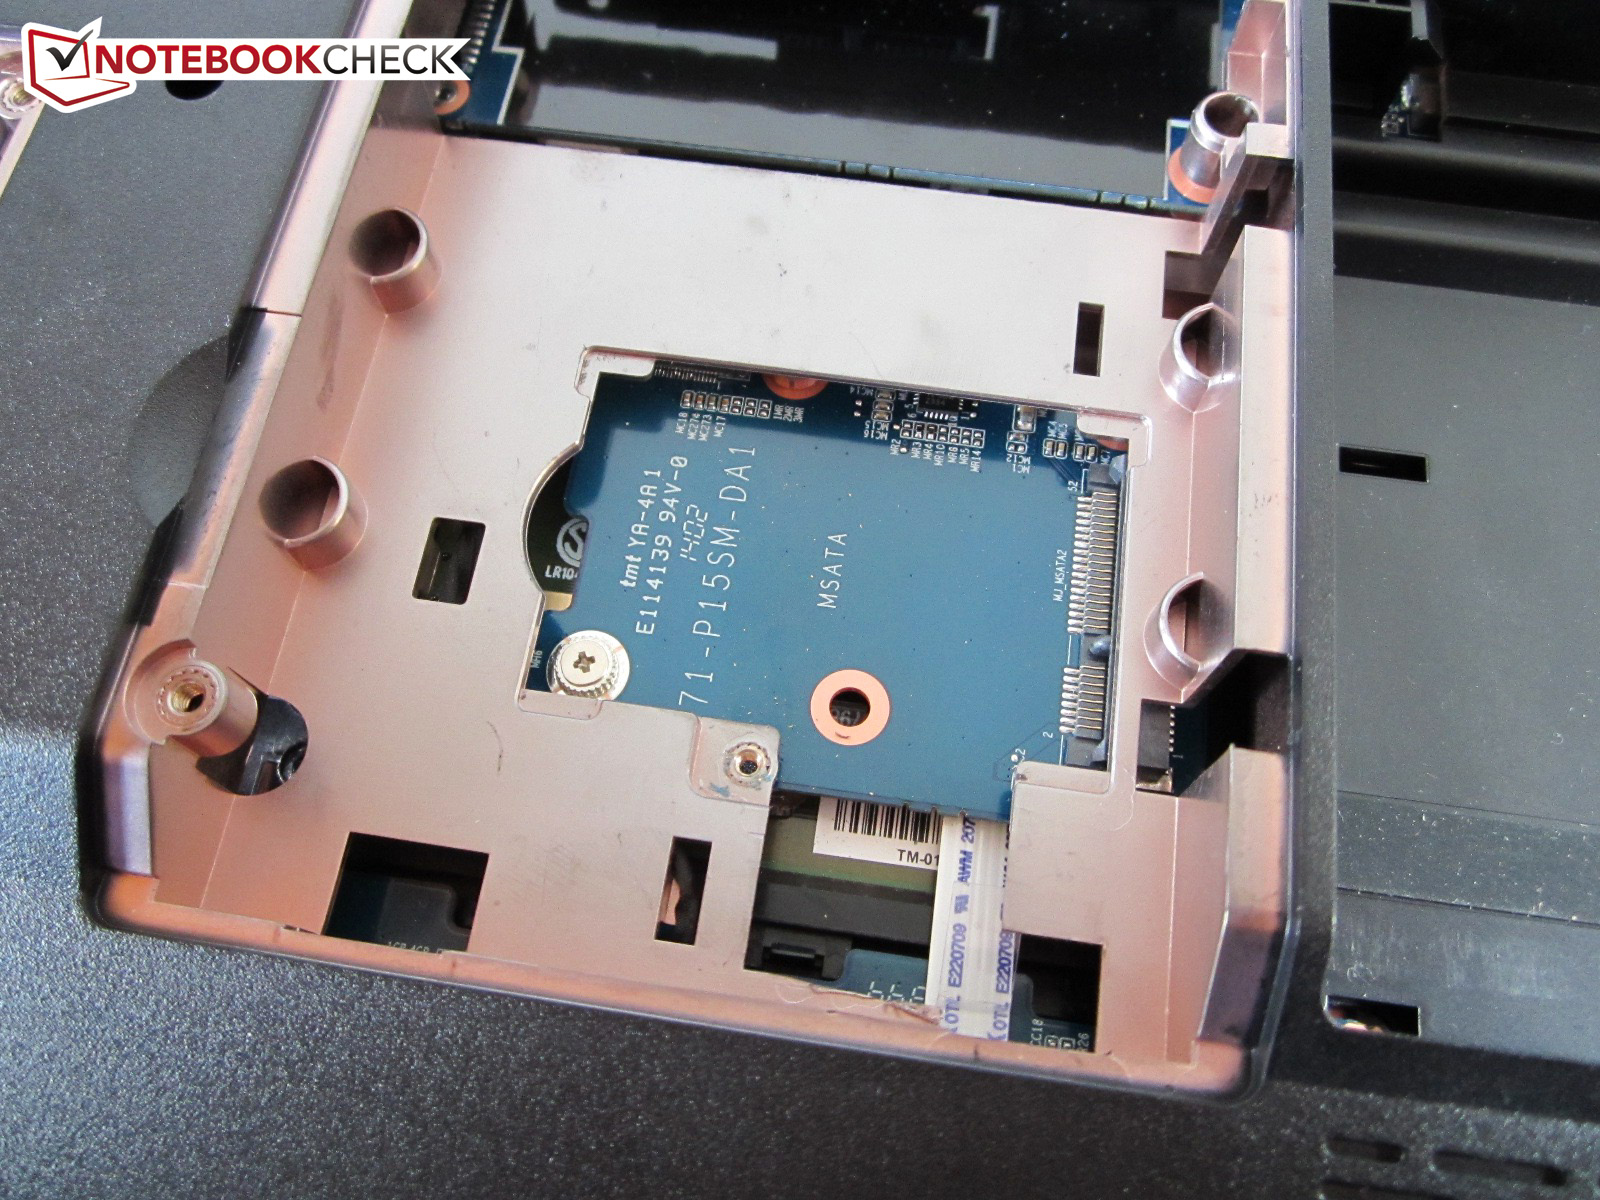
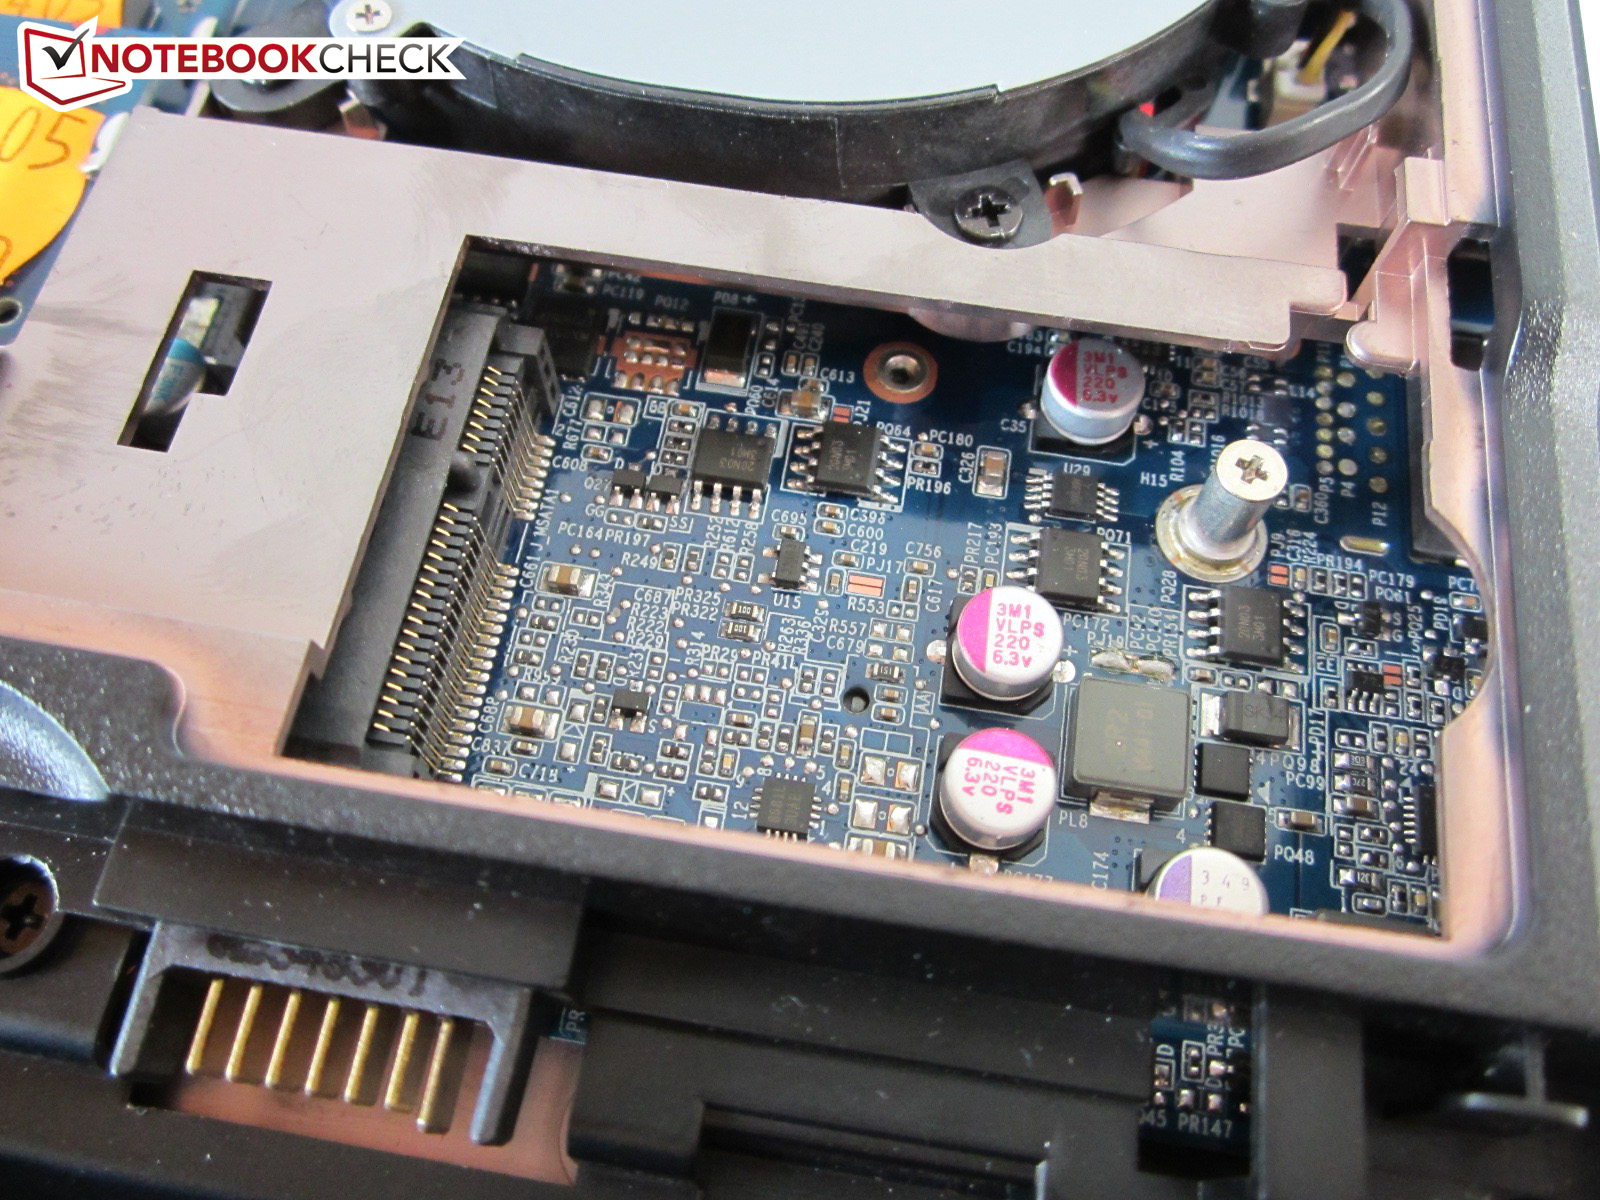
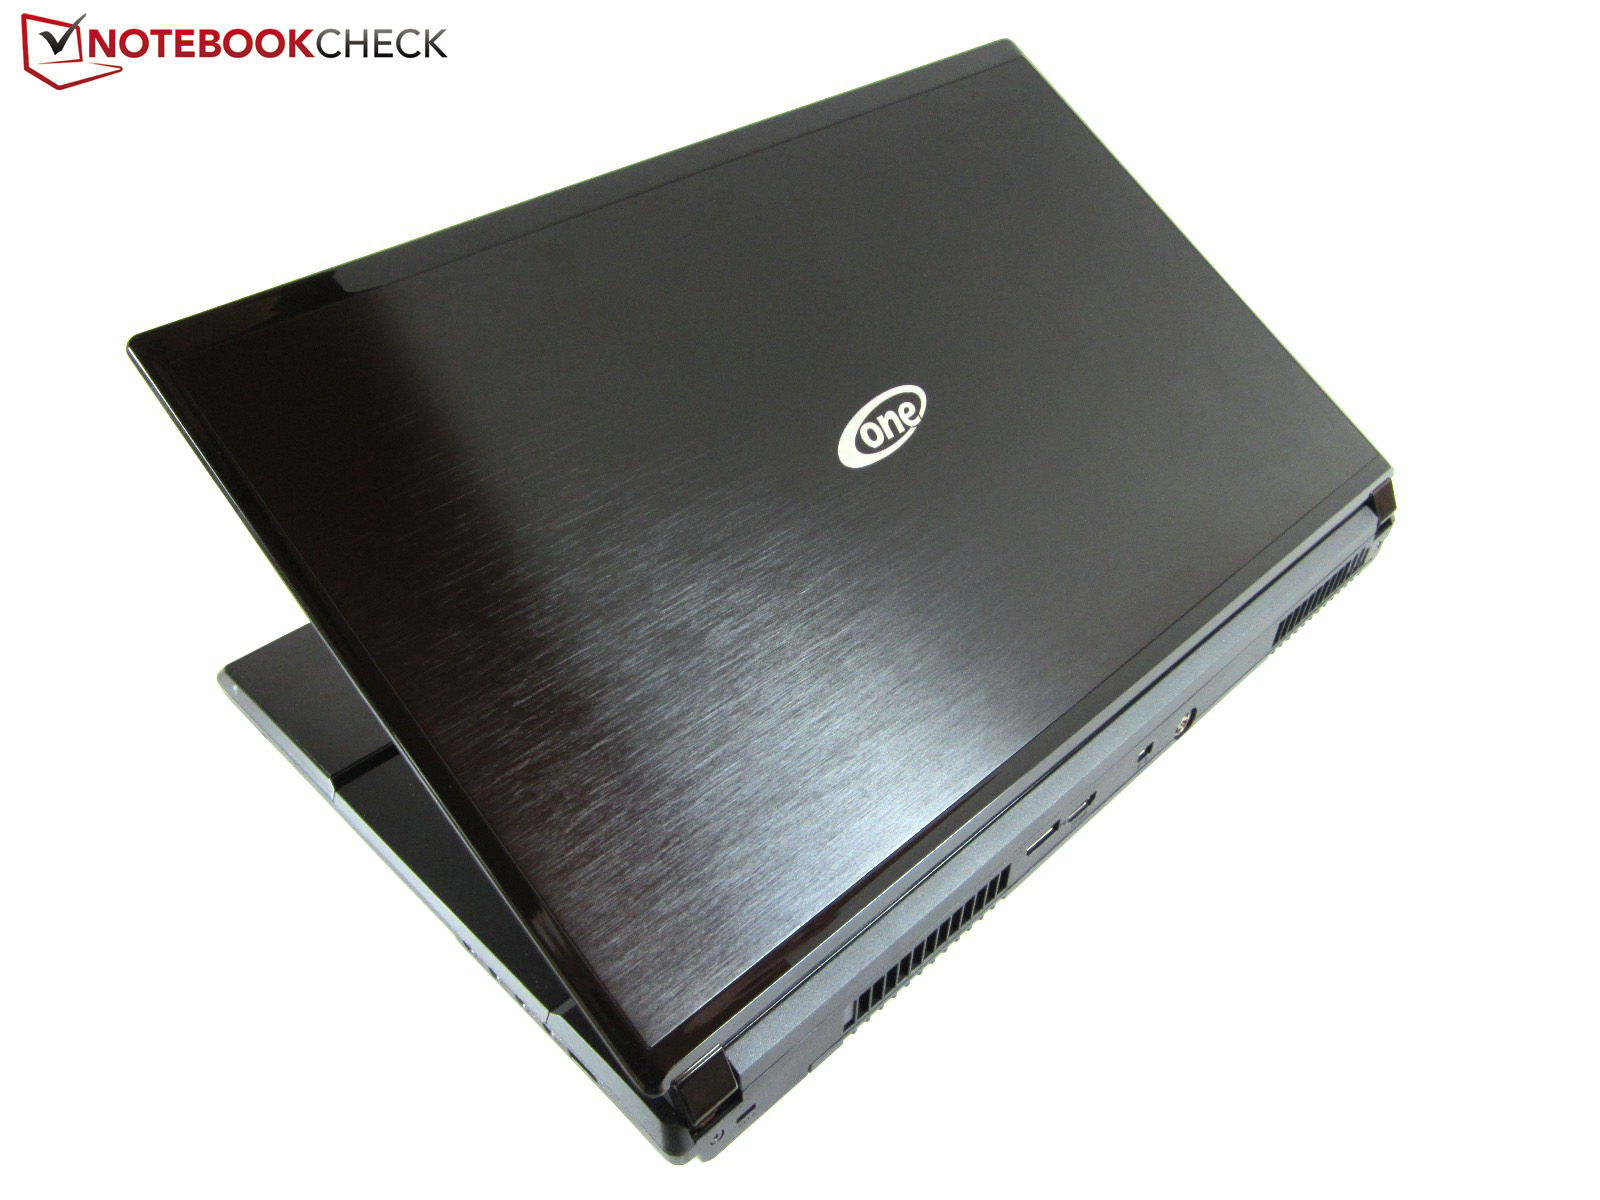
The One K73-4N is a 17-inch gaming behemoth that takes on the legacy of the K73-3N. The configuration options discovered on the homepage look a lot like those of the recently tested K56-4N. The main difference is the deviating hard drive equipment. Not three, but four storage devices are possible in the K73-4N (2x mSATA & 2x 2.5-inch).
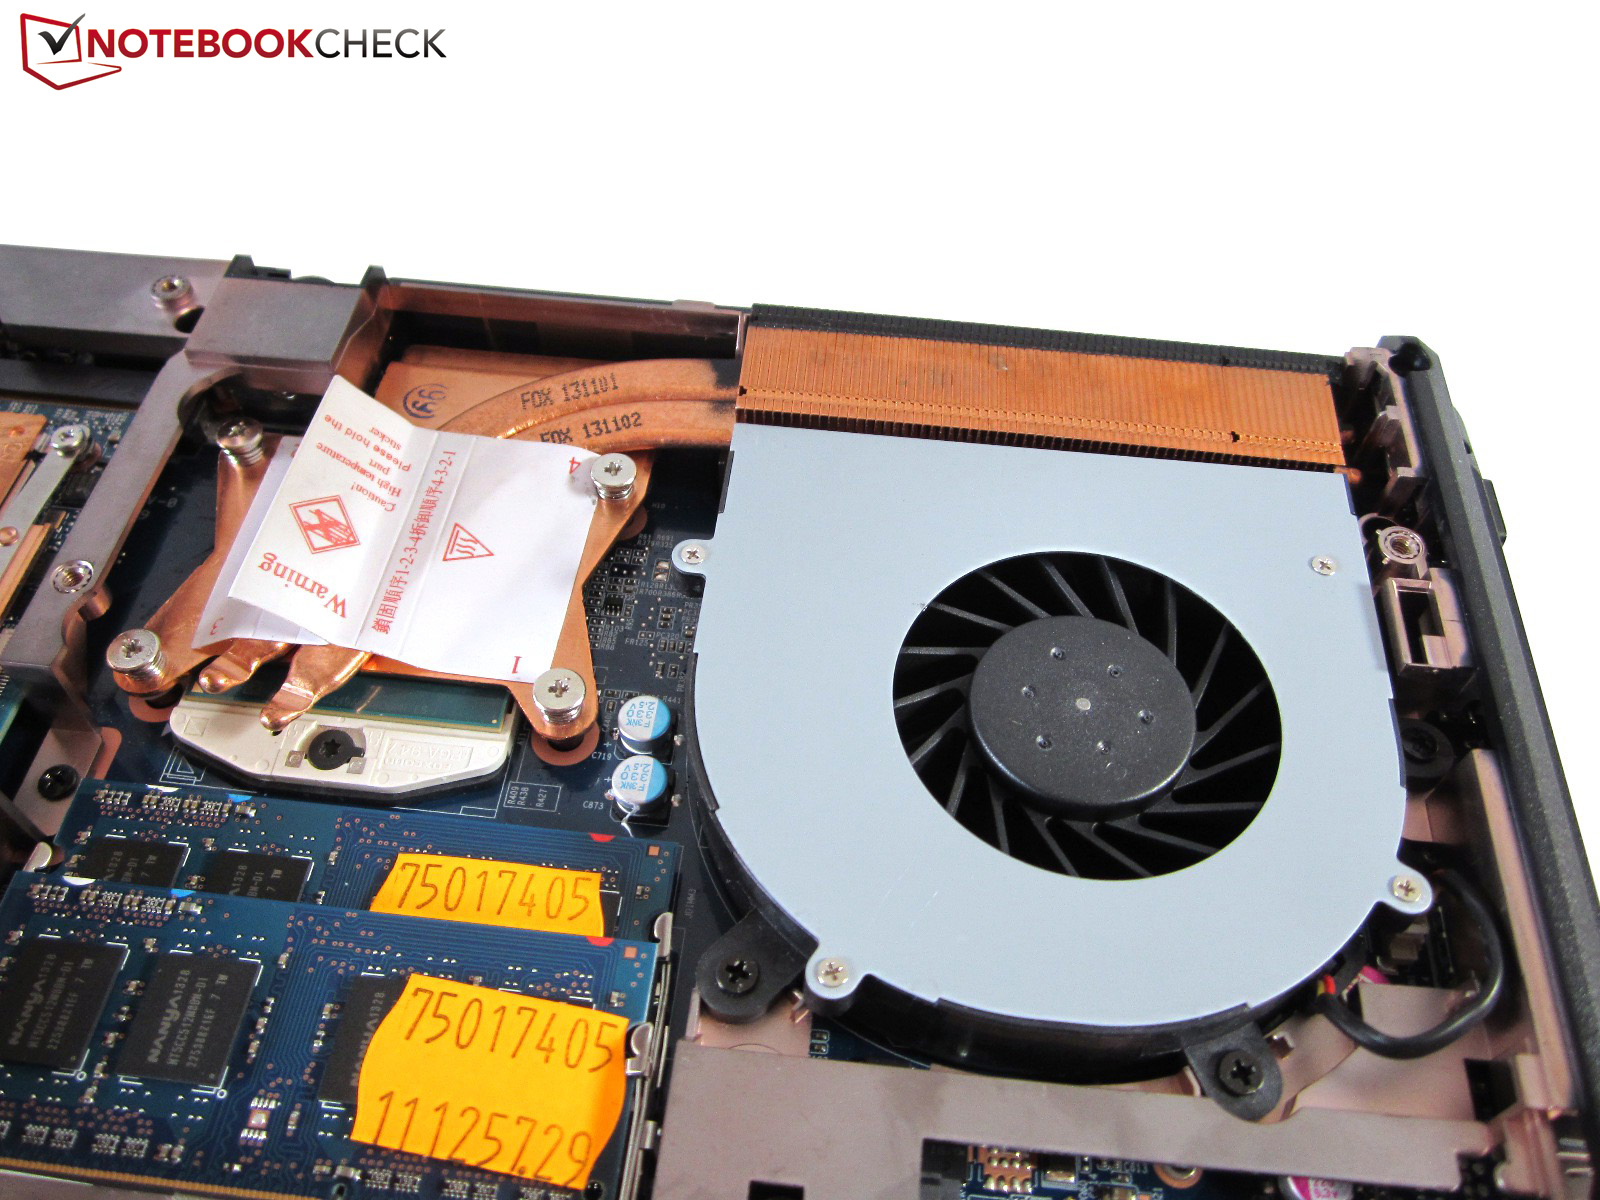
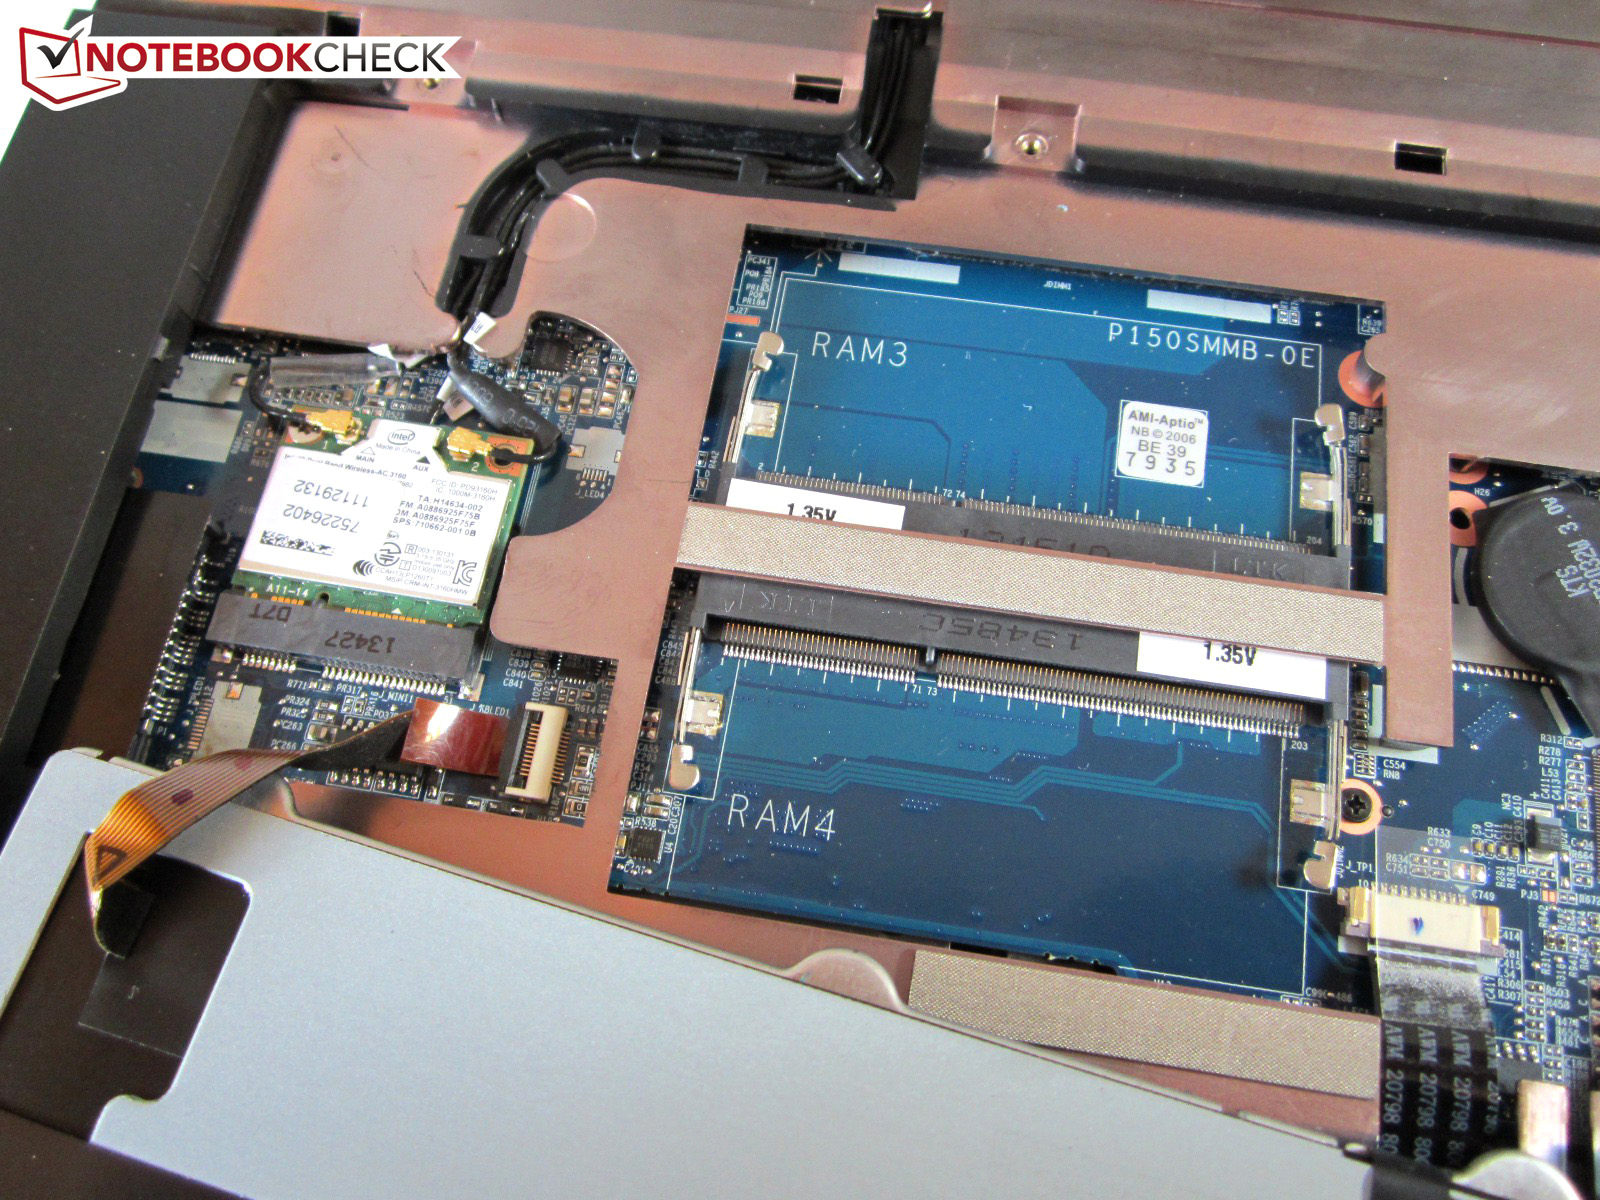
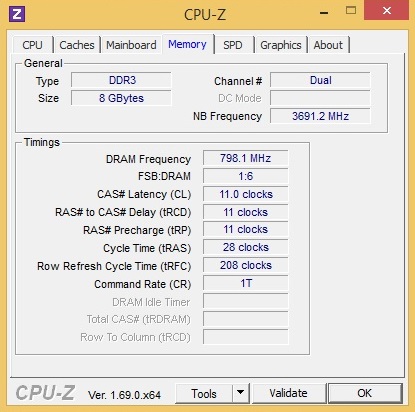
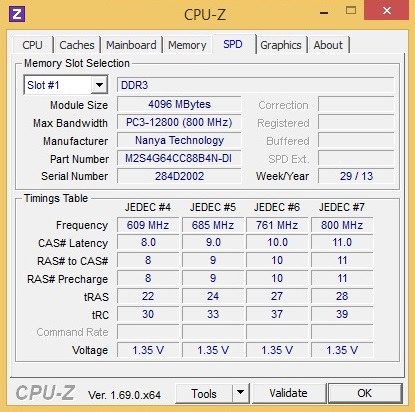
The other areas are also generous. A maximum of 32 GB DDR3 working memory, and quad-core processors up to the Core i7-4930MX let gaming hearts beat faster. Some buyers will also be pleased that the optical drive and Wi-Fi adapter can be replaced. Both Windows 8.1 and Windows 7 are available as the operating system.
Naturally, the most influential factor is selecting the right graphics card. It is possible to opt for the GTX 870M or GTX 880M instead of the Radeon R9 M290X. We will examine whether the extra charge of 40 or 280 Euros (~$55 or $386) is worthwhile further below.
Since One only integrates four GB of RAM, a 500 GB HDD, and a weak Intel Core i3-4000M in its base configuration, it is recommendable to upgrade. Our review sample that featured eight GB of DDR3 RAM, a 500 GB SSD, Core i7-4800MQ, and Windows 8.1 64-bit would currently add up to approximately 1600 Euros (~$2207).
Display
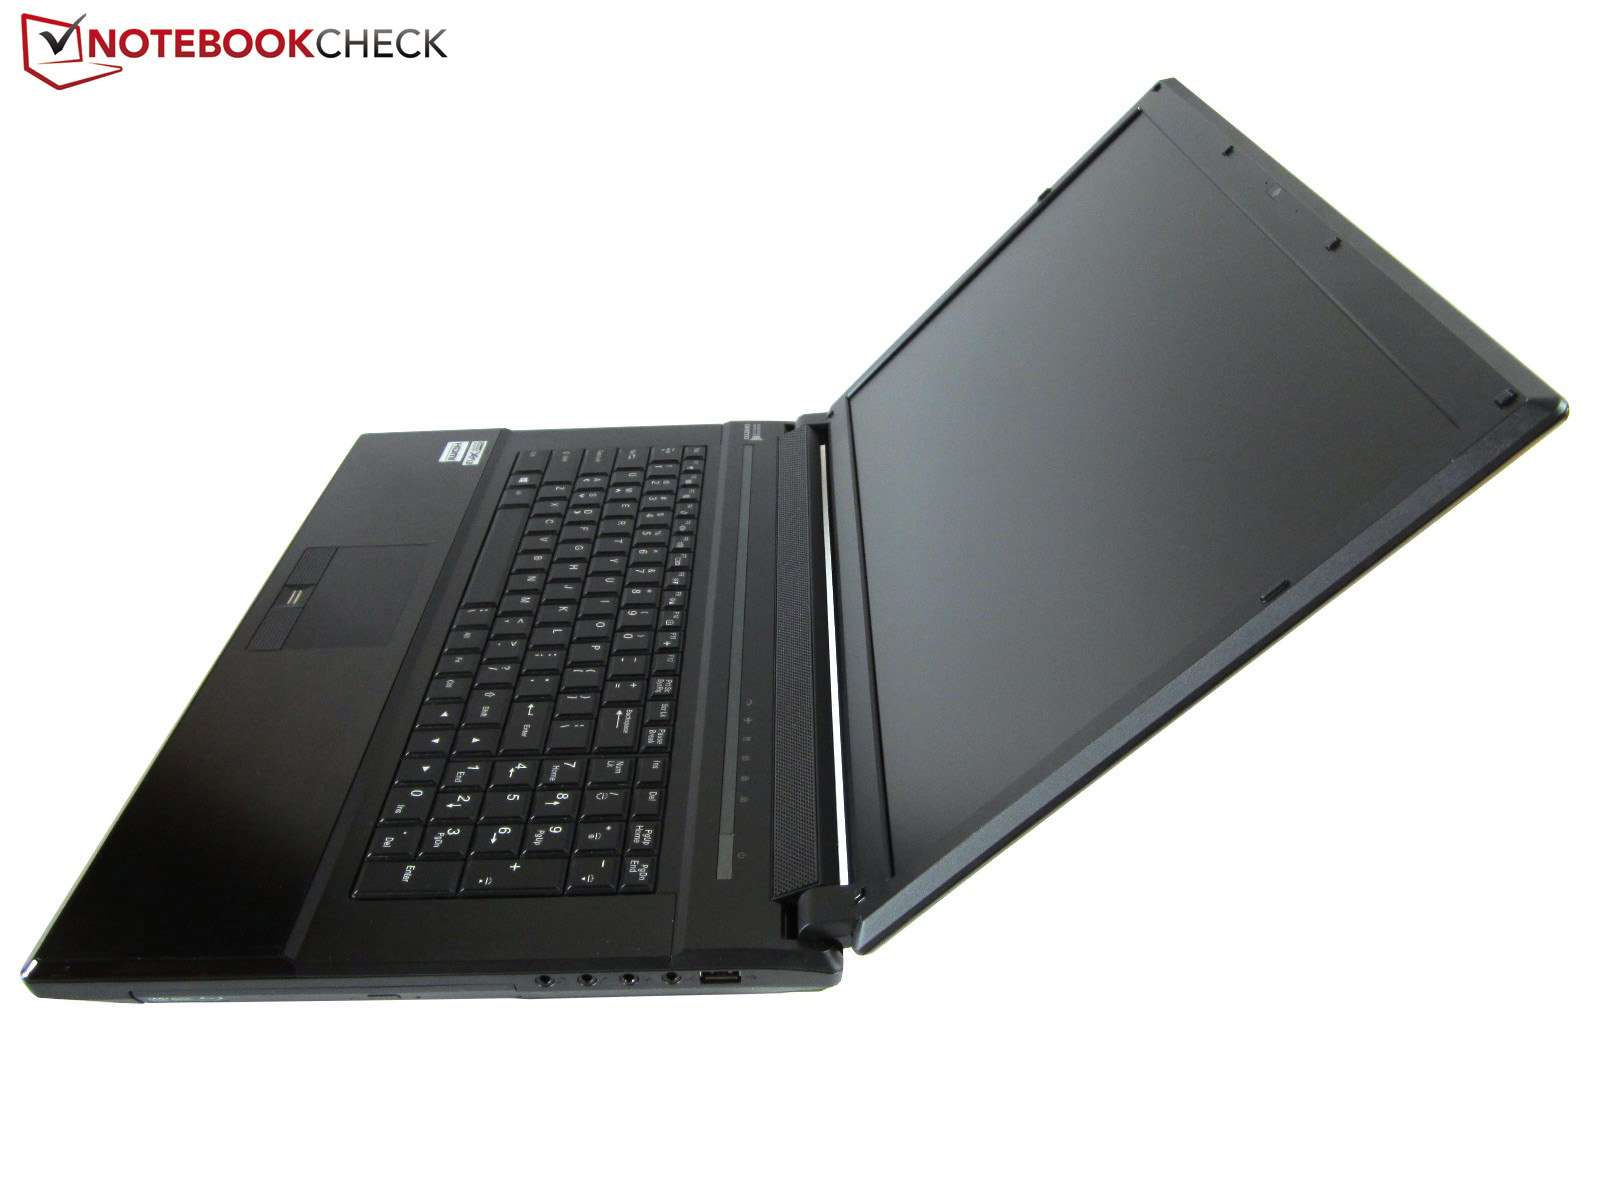
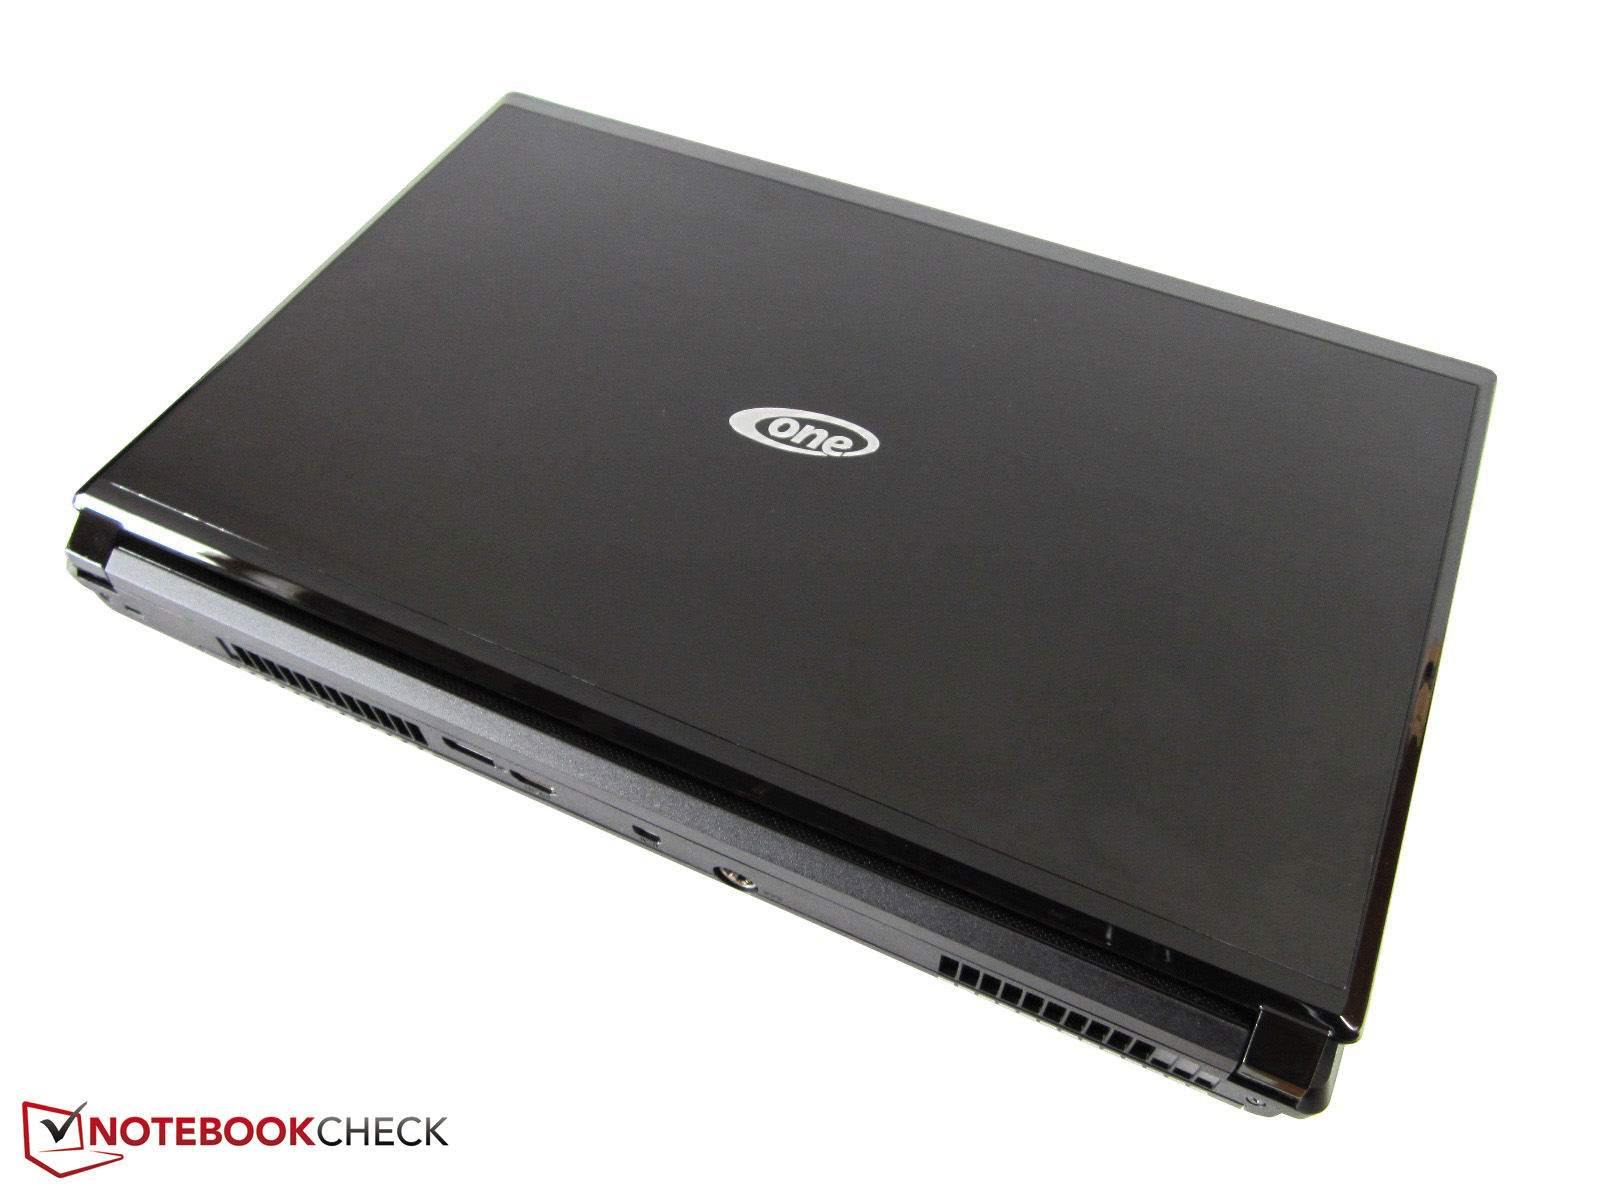
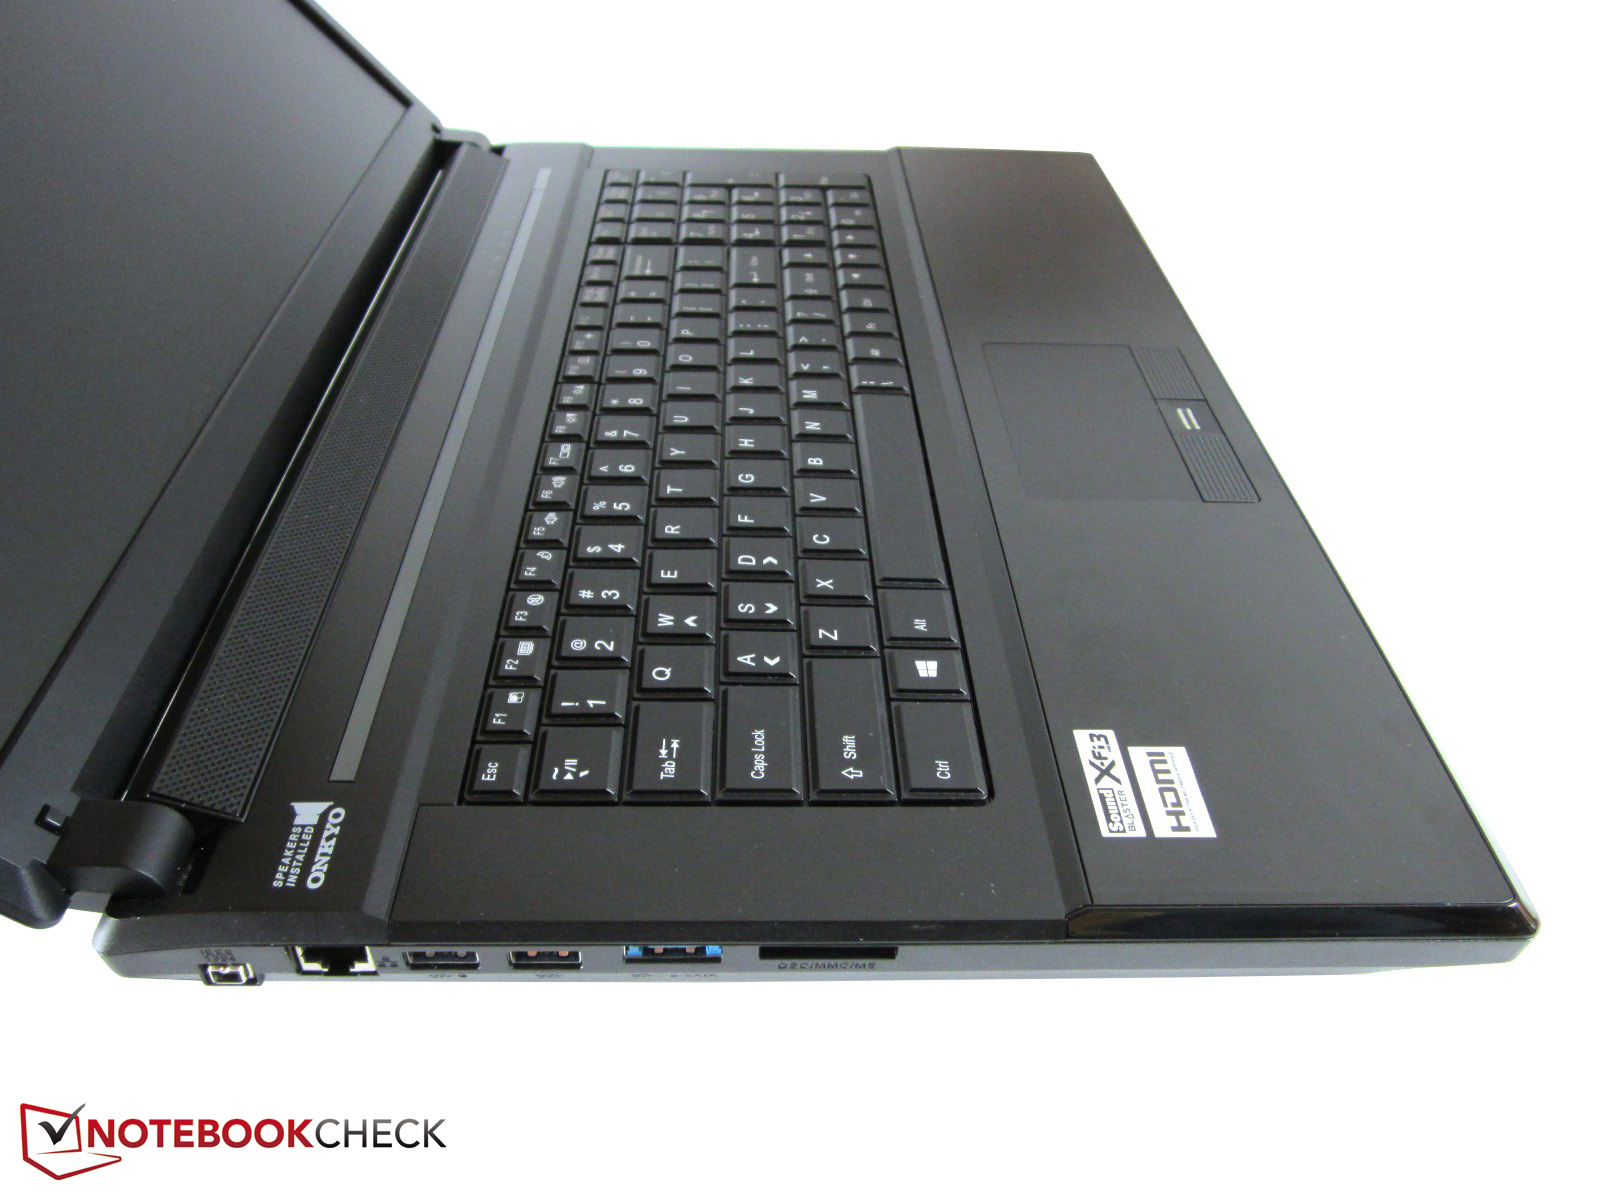
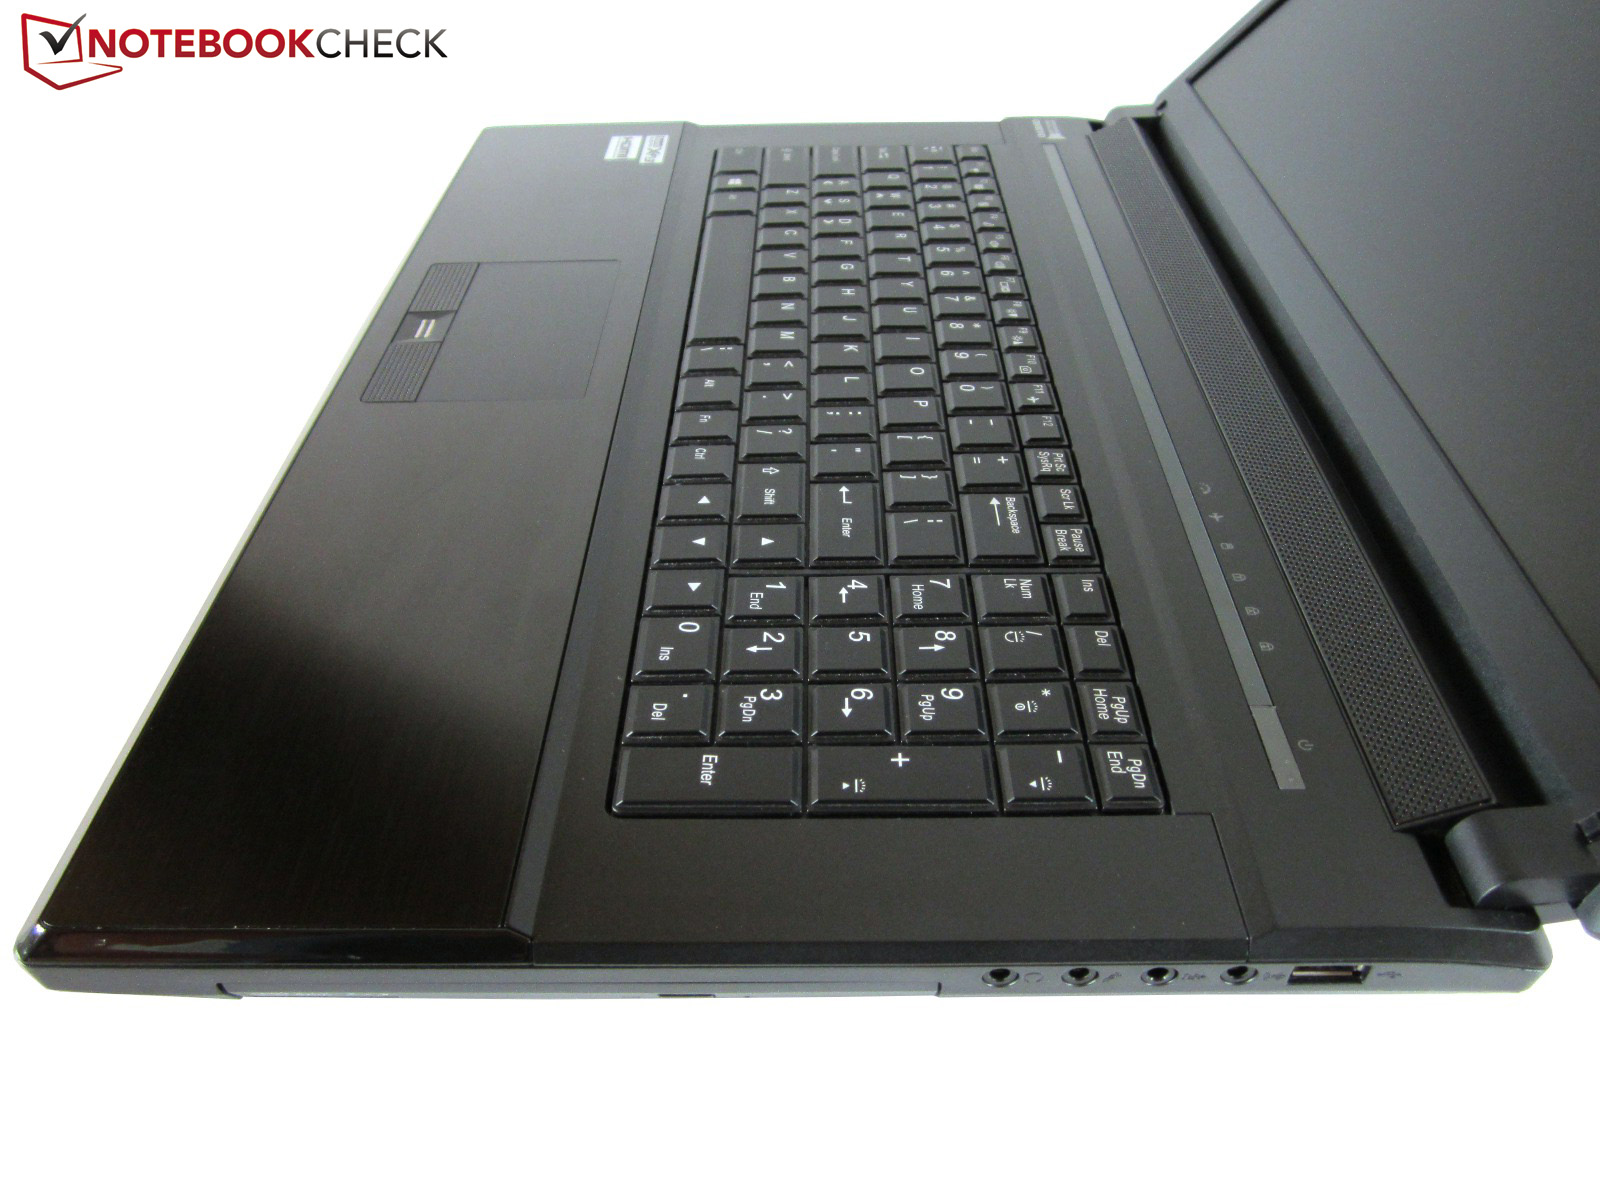
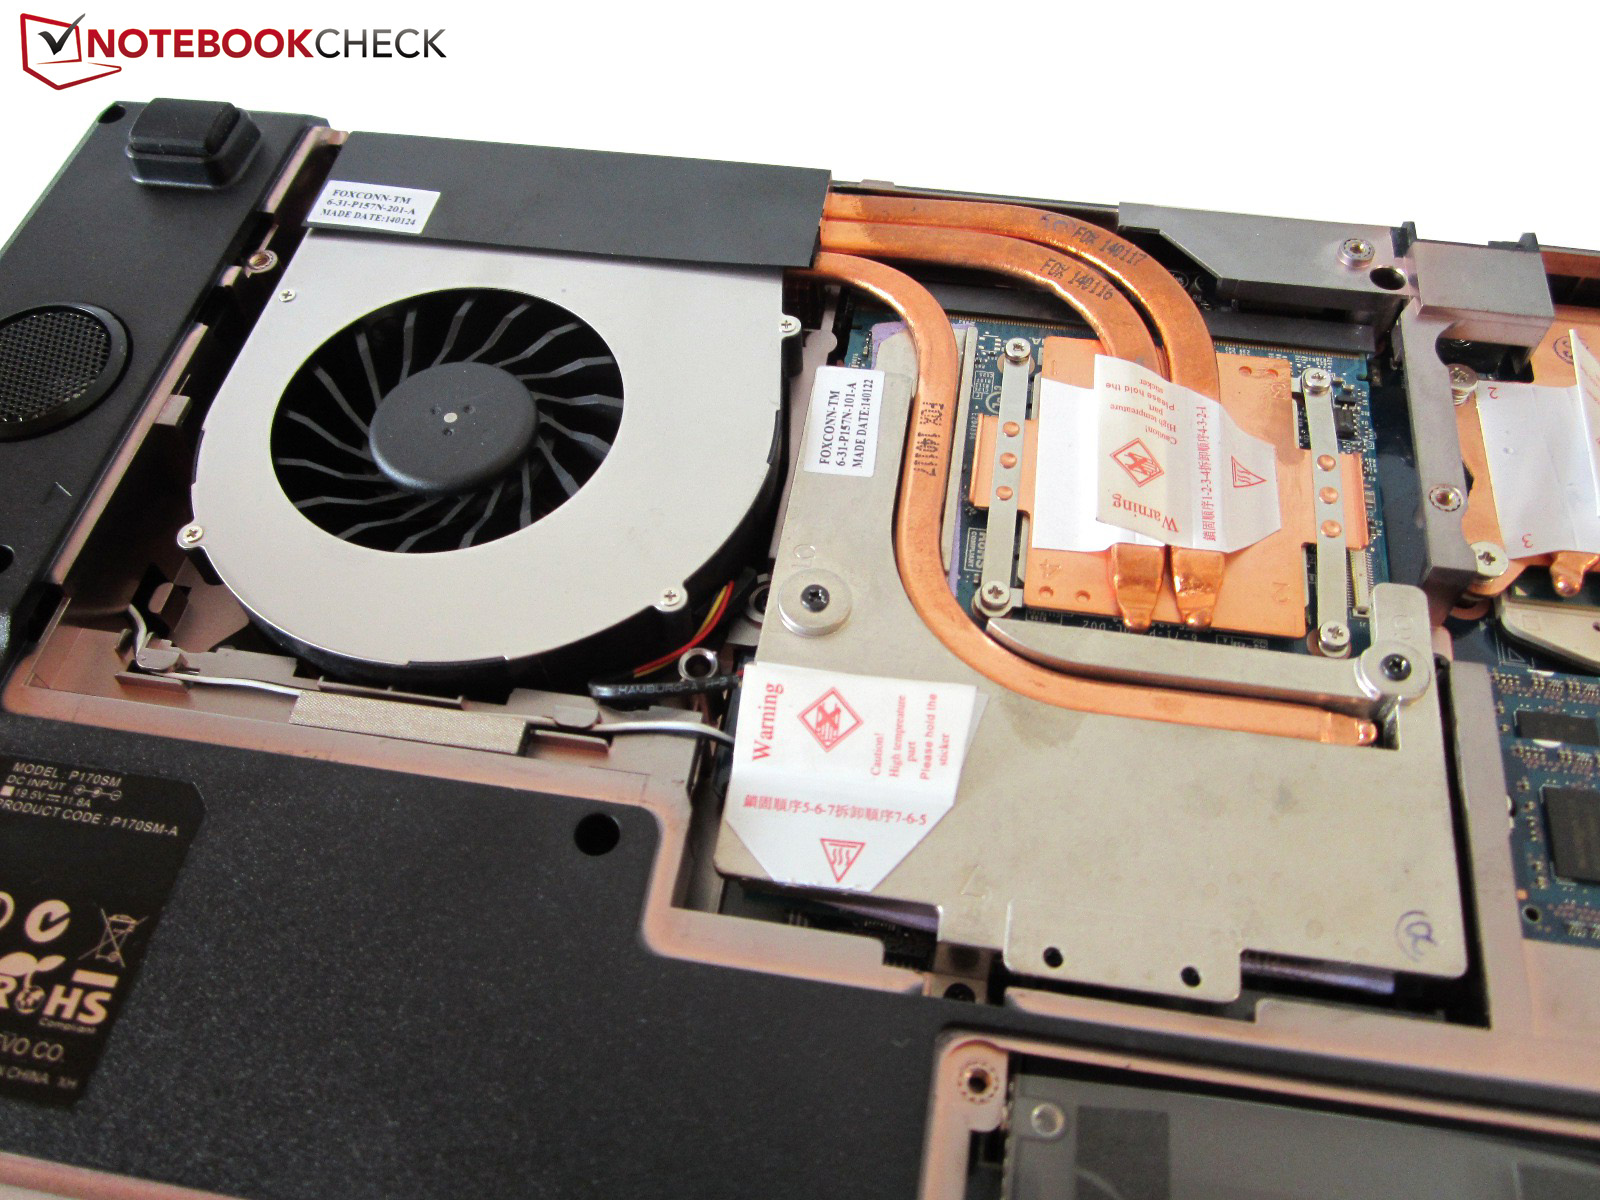
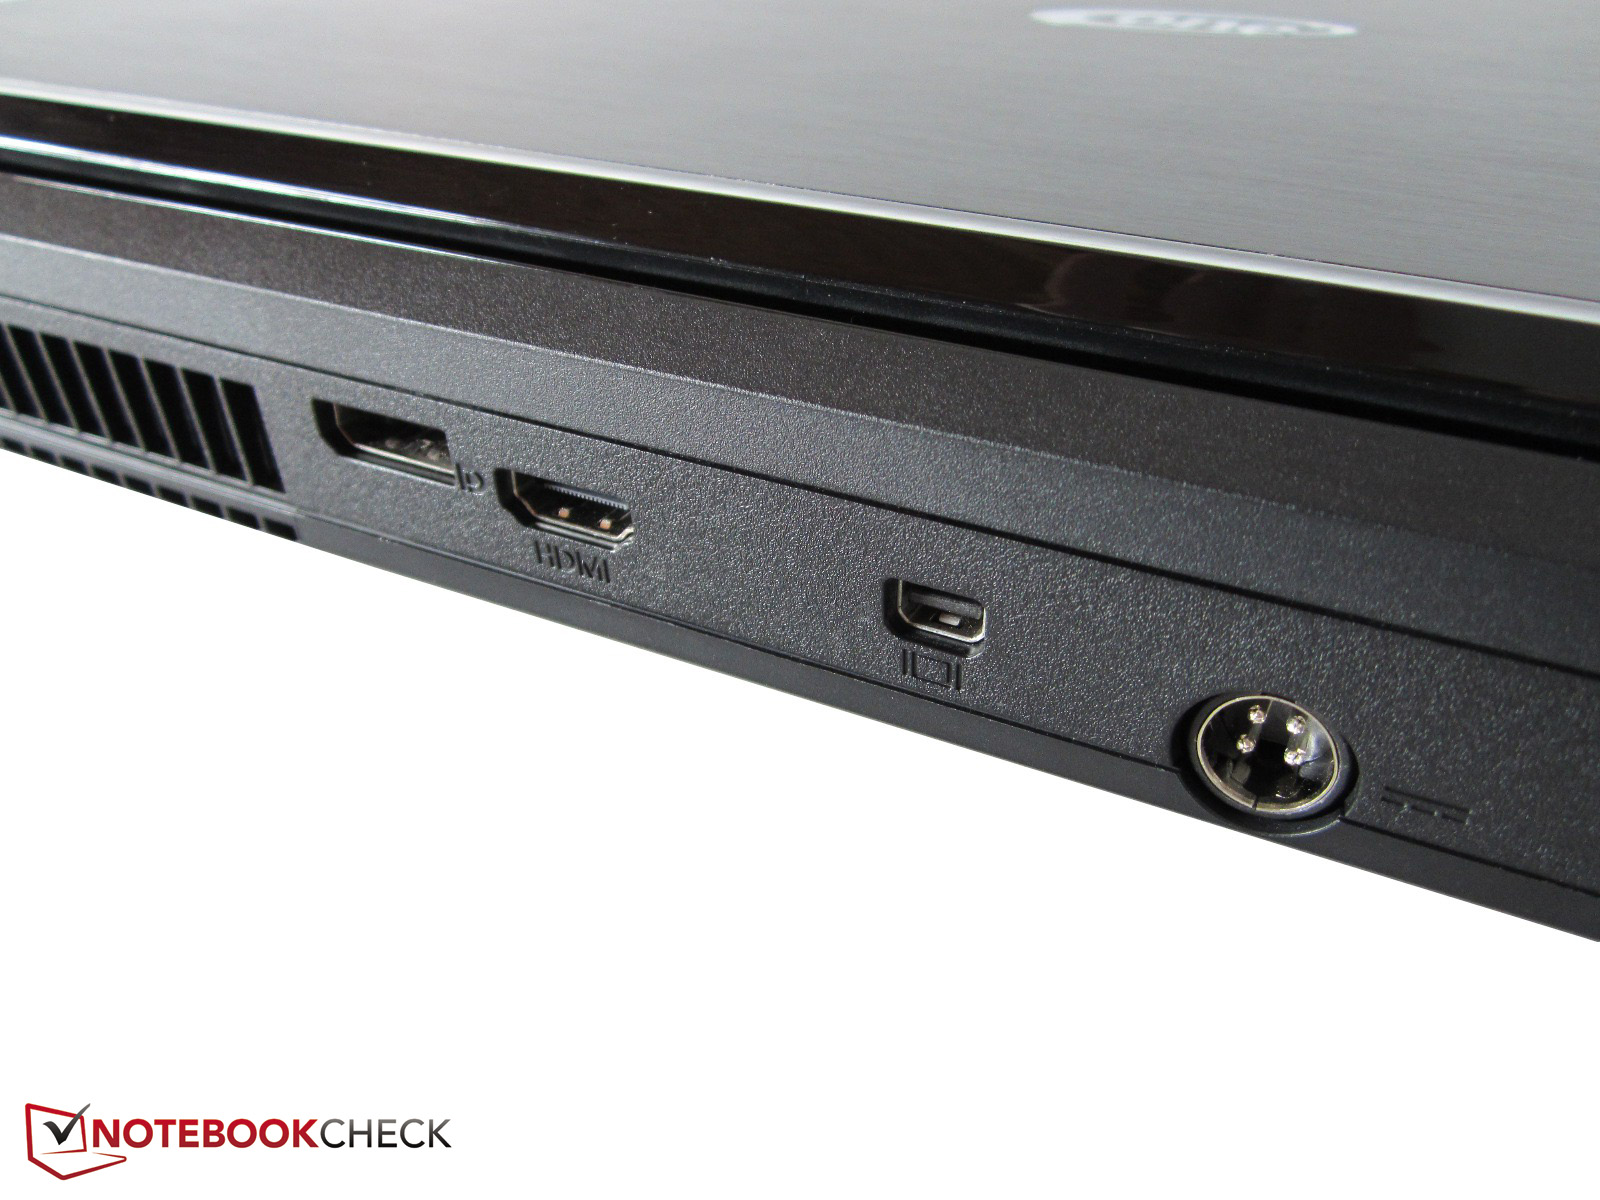
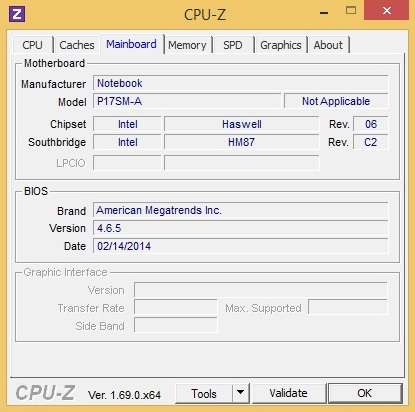
We have omitted the parts about casing, connectivity, keyboard, and touchpad because the chassis is identical to that of its precursor, with the exception of a few details that barely affect the overall impression. One again uses the P170SM(-A) barebones from the Taiwanese company Clevo.
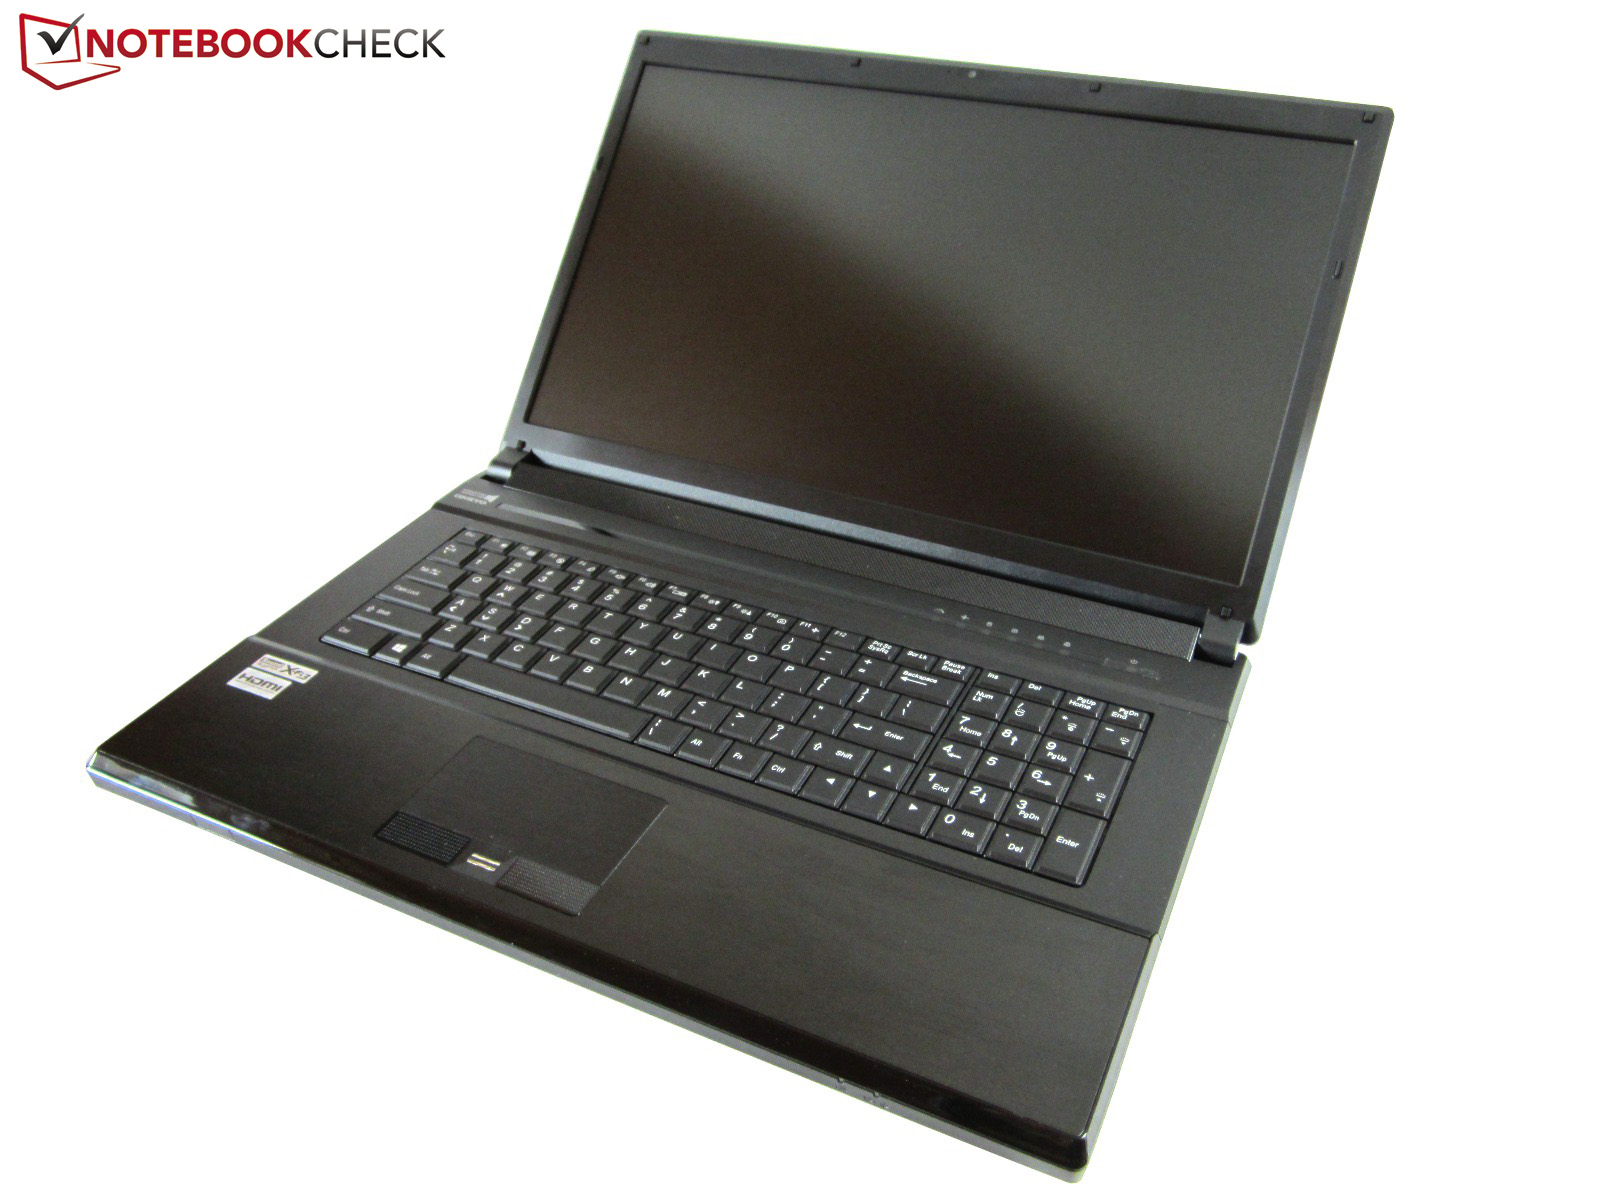
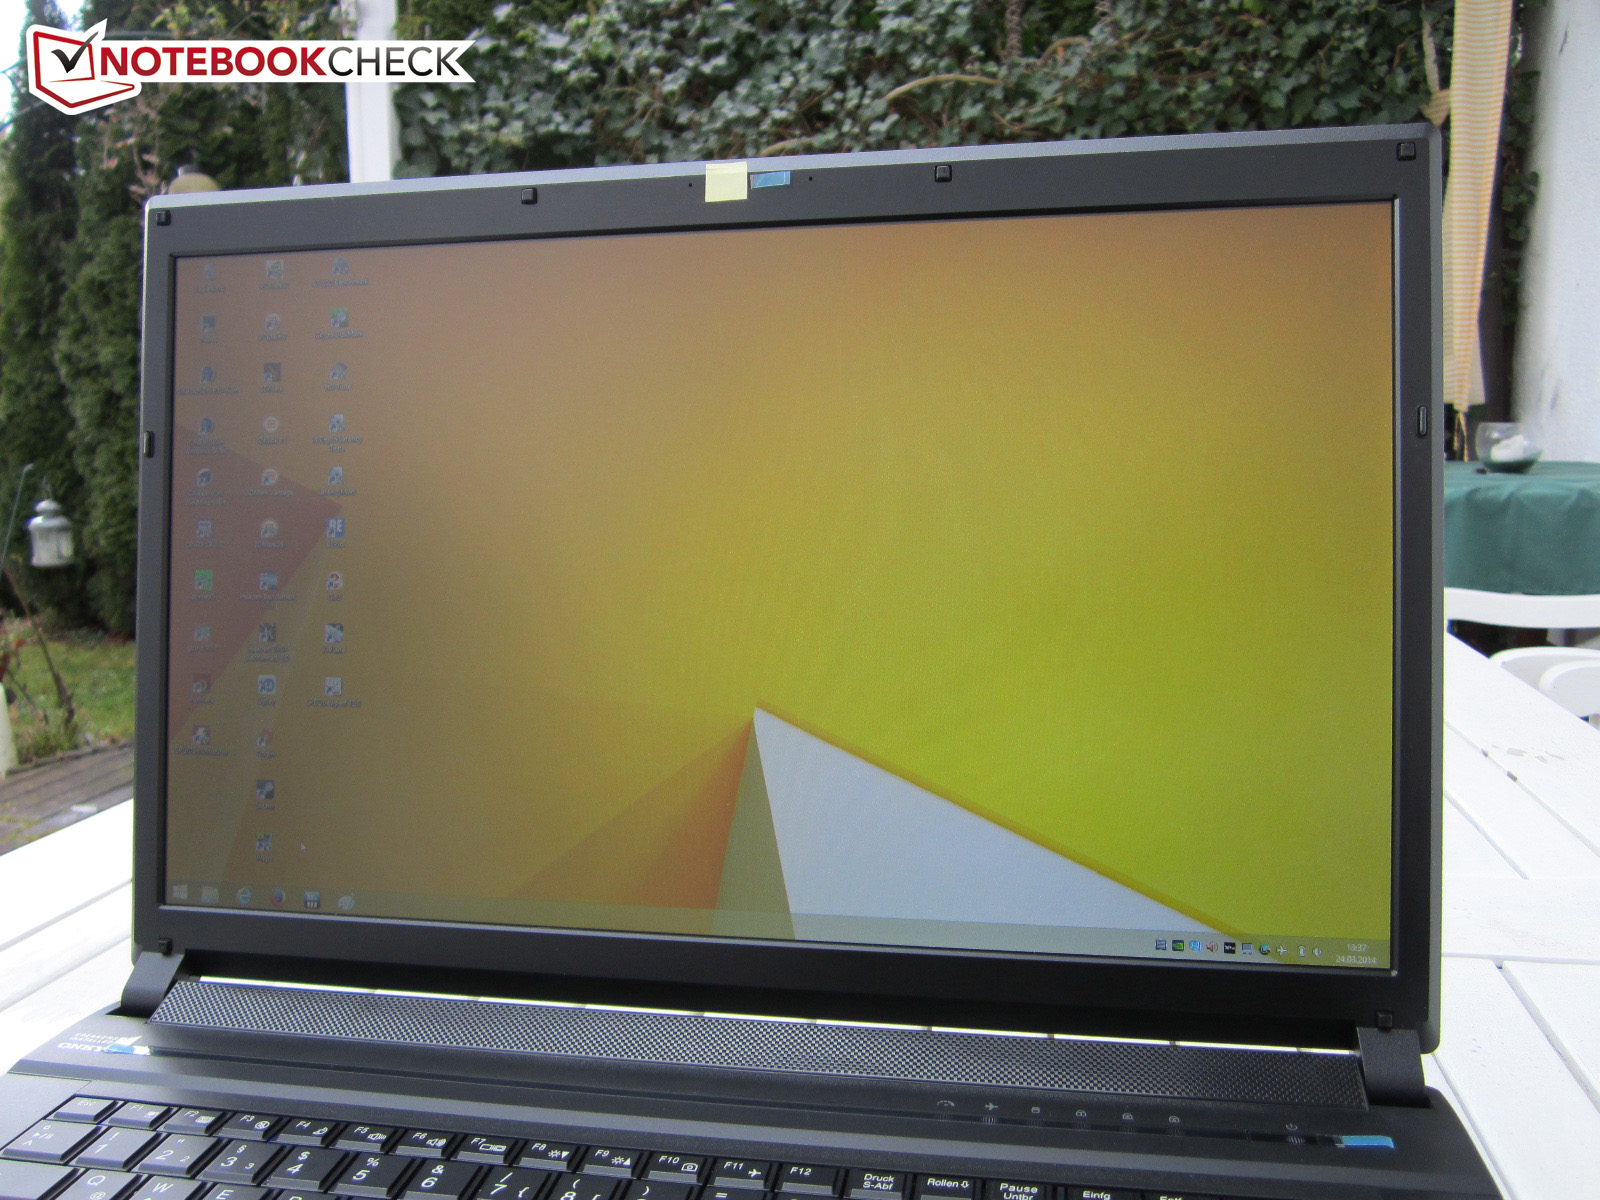
As expected, the laptop is delivered with the matte, Full HD screen Chi Mei N173HGE that is also installed in dozens of competitors (Asus G750JH, Notebookguru Earth V, MSI GT70, etc.).
| |||||||||||||||||||||||||
Brightness Distribution: 85 %
Center on Battery: 337 cd/m²
Contrast: 963:1 (Black: 0.35 cd/m²)
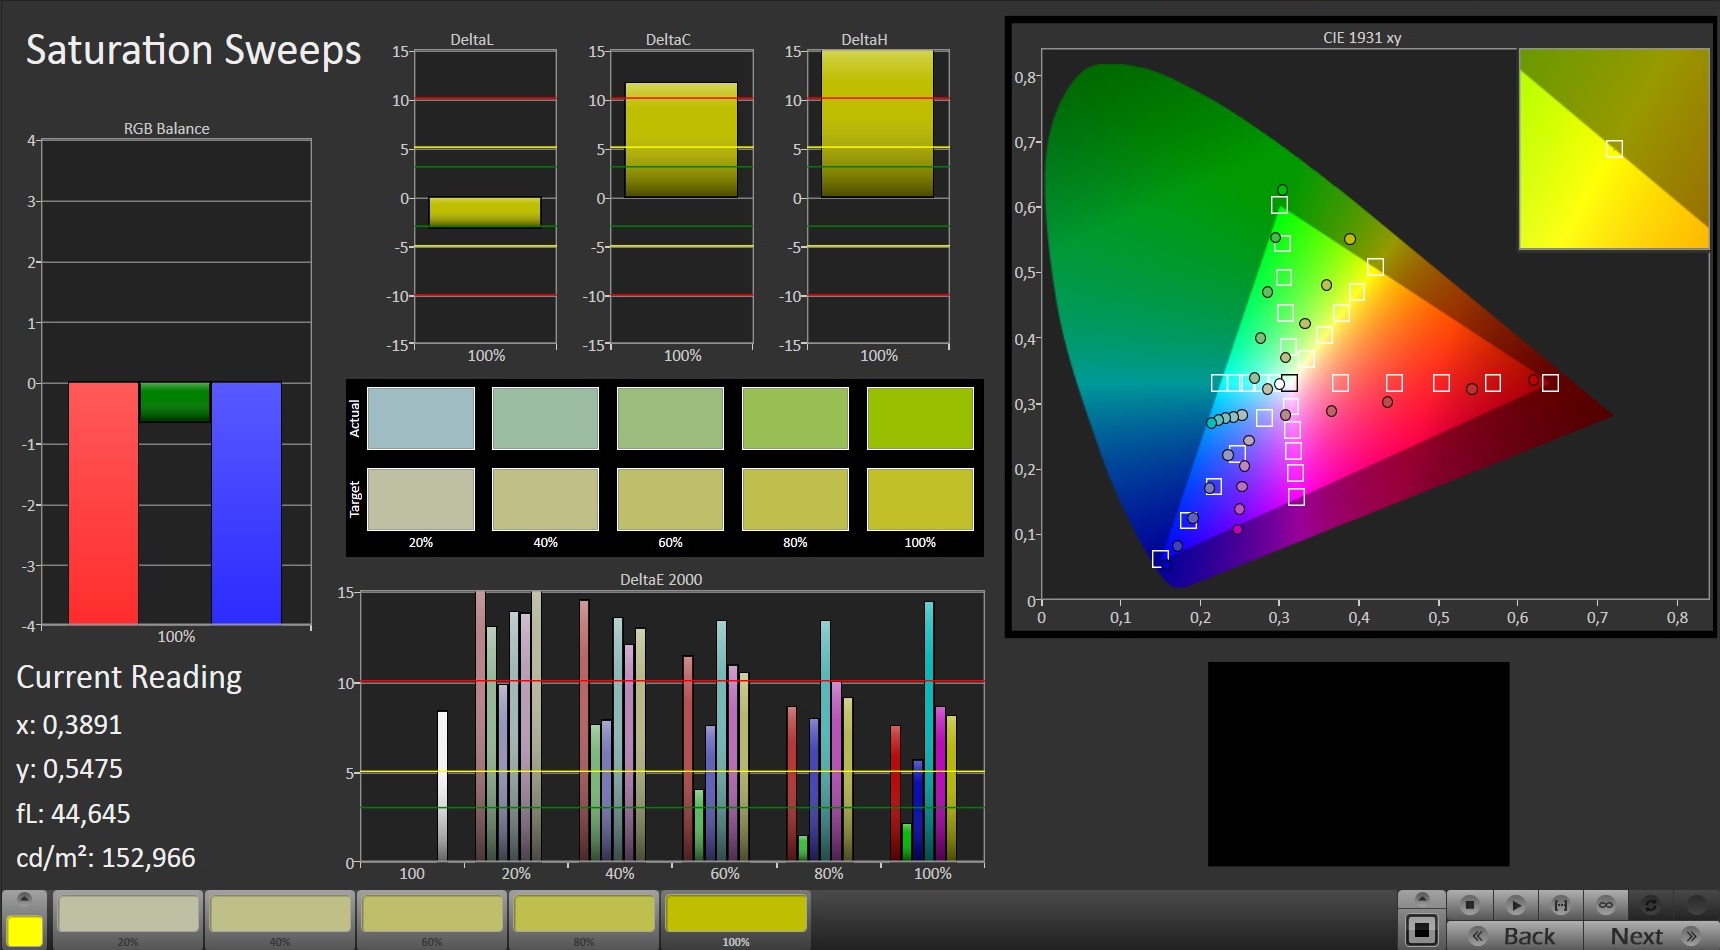
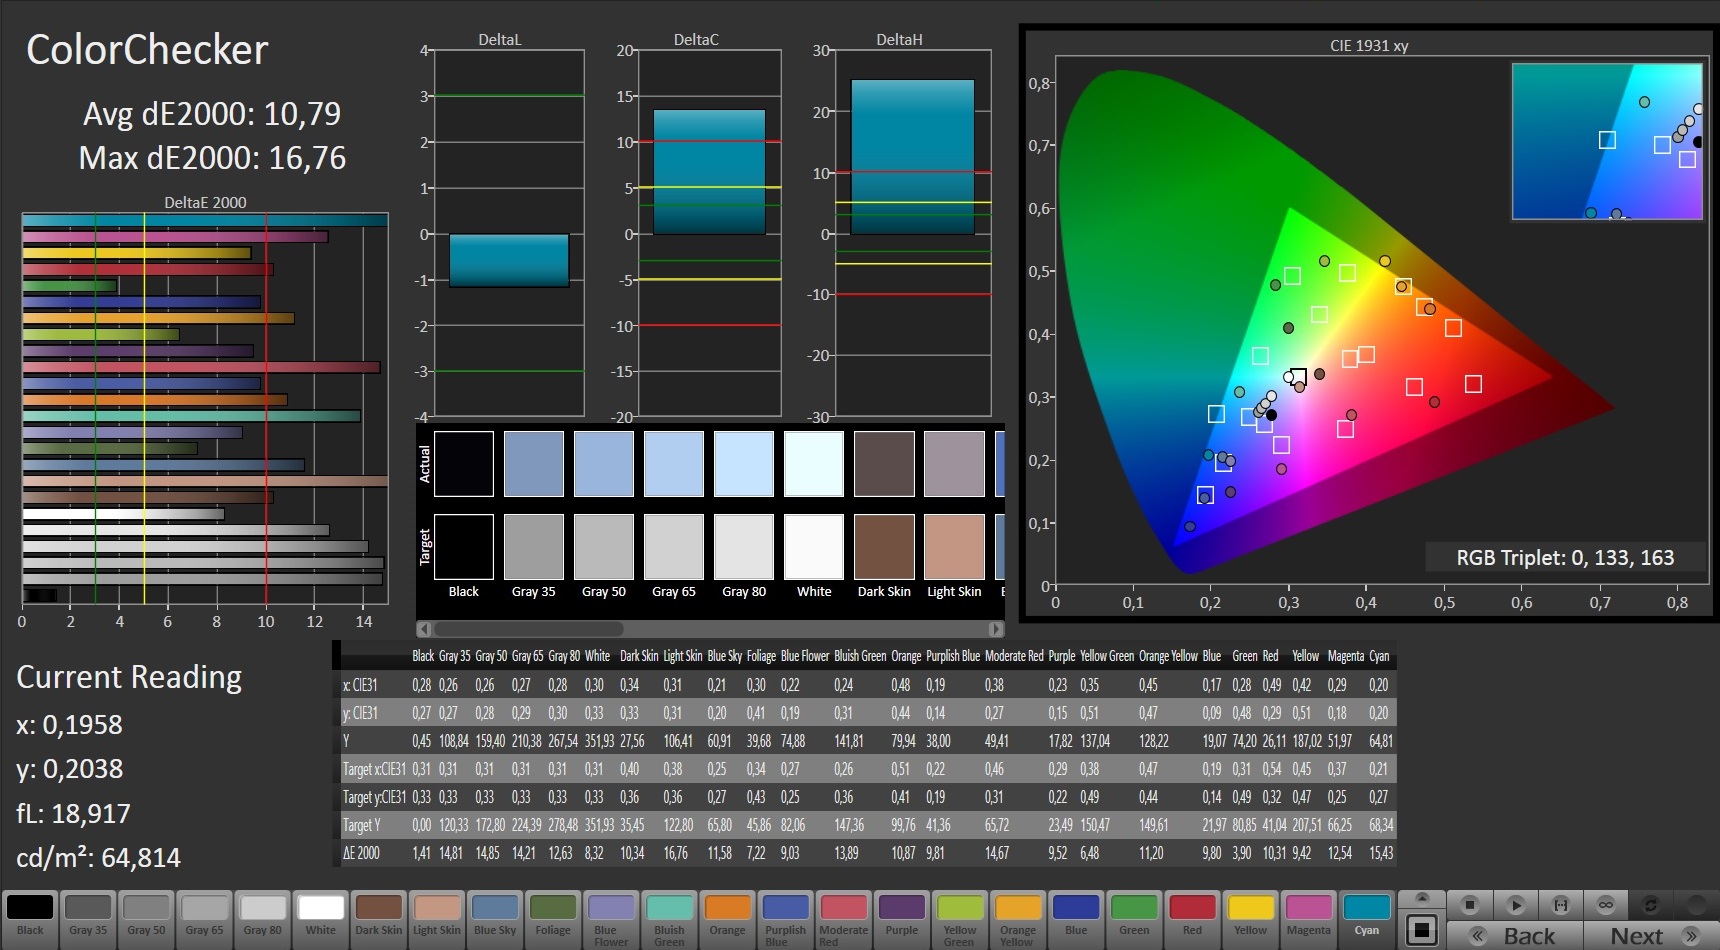
ΔE Color 10.79 | 0.5-29.43 Ø5
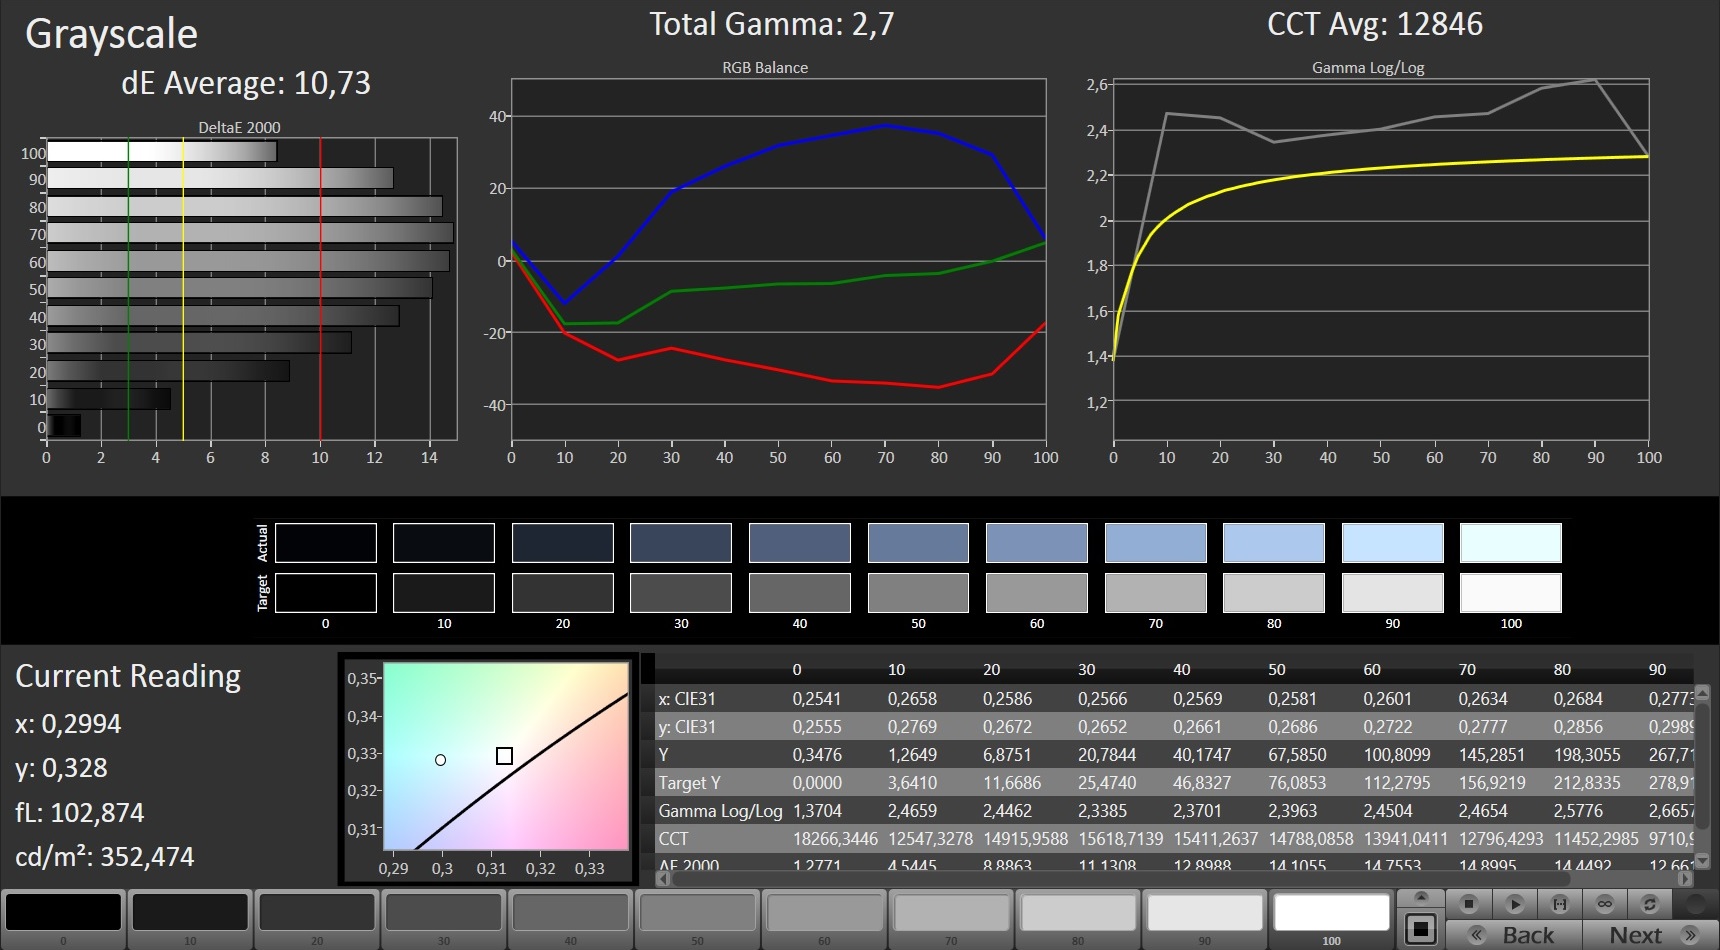
ΔE Greyscale 10.73 | 0.57-98 Ø5.3
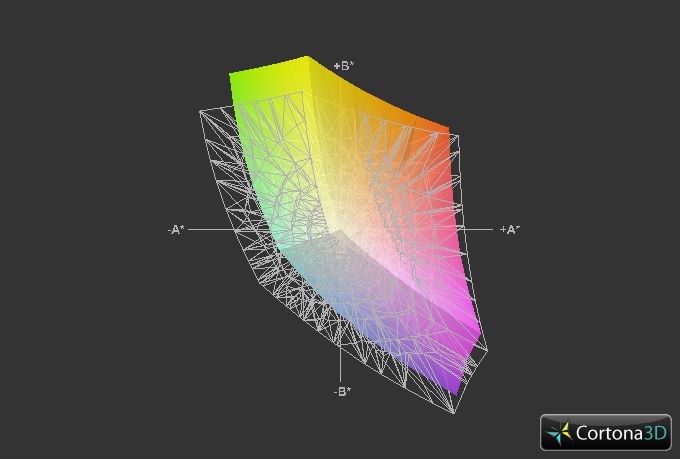
58% AdobeRGB 1998 (Argyll 1.6.3 3D)
61.9% AdobeRGB 1998 (Argyll 2.2.0 3D)
84.5% sRGB (Argyll 2.2.0 3D)
61.8% Display P3 (Argyll 2.2.0 3D)
Gamma: 2.7
A brightness of 308 cd/m² is just as above average as a contrast of 936:1. The latter results from the decent black level. Although 0.35 cd/m² will not excite photo enthusiasts, the black reproduction is good from the "average" gamers’ point of view. A higher result would cause dark game and movie scenes to clearly drift into the gray range. This is supplemented by an acceptable color space coverage. 84% of sRGB and 58% of AdobeRGB are not a matter of course in the laptop sector.
The Chi Mei N173HGE has to accept criticism in color balance and accuracy. As can be seen in our CalMAN screenshots, many parts strongly deviate from the ideal. Other panels score better here.


The outdoor suitability proves to be good. The high brightness and matte surface allow use on even sunnier days - providing the laptop is not placed in a very unfavorable position.
The viewing angles correspond to the level of a good TN screen. While the horizontal plane has more room, distortions turn up quite soon vertically, depending on the content. Clevo would have to switch to IPS technology to really score in Display.

Performance

Processor
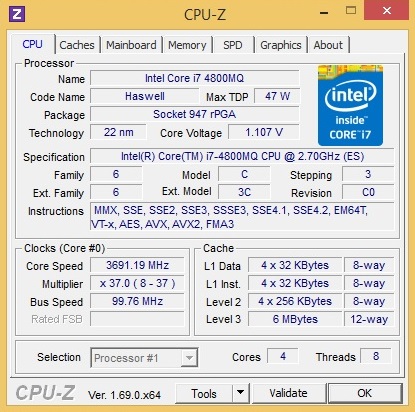
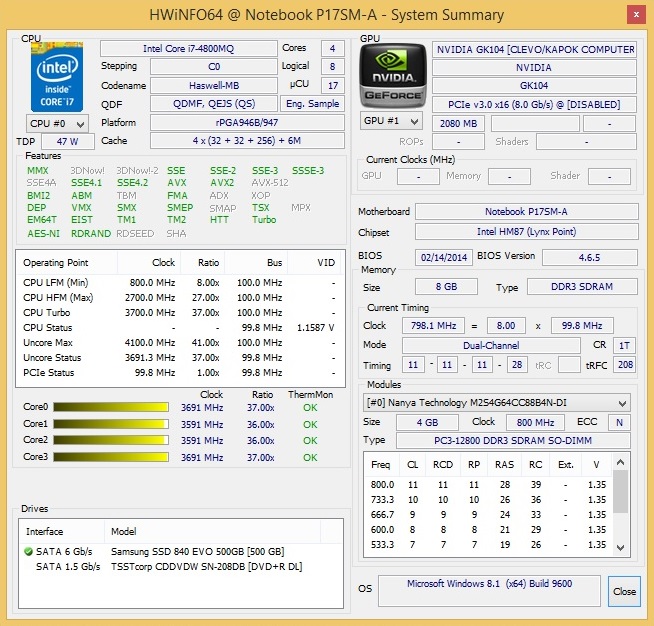
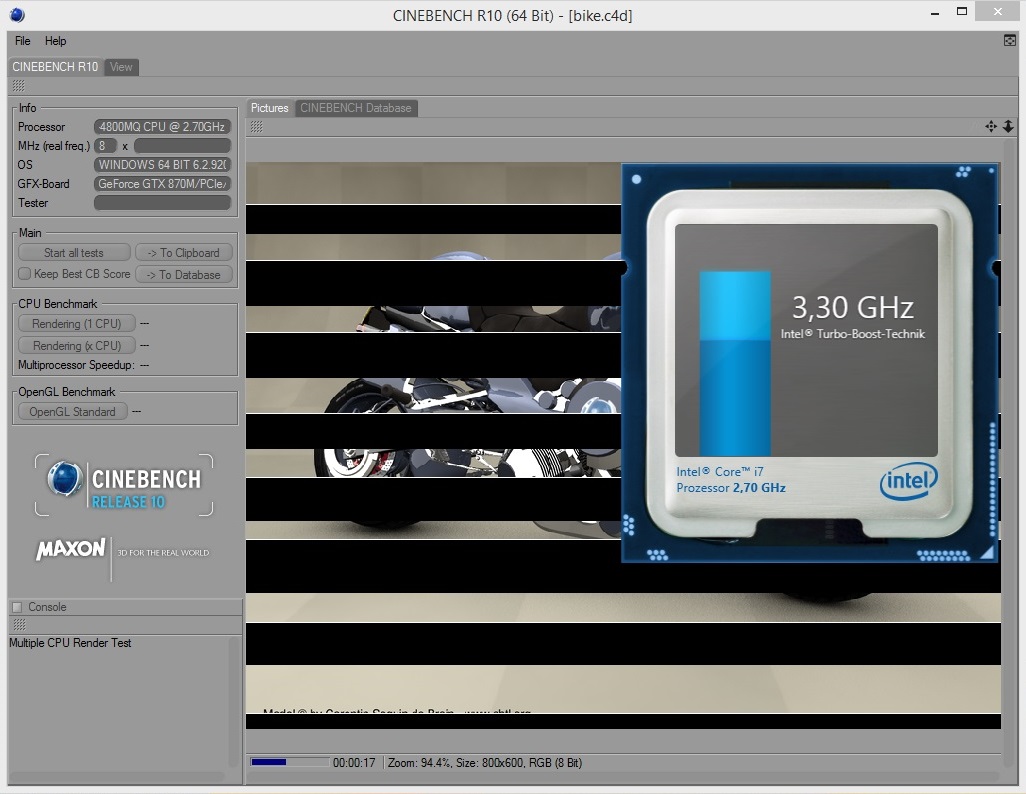
We again ordered the Core i7-4800MQ processor that is positioned between the i7-4700MQ (2.4 - 3.4 GHz) and the i7-4900MQ (2.8 - 3.8 GHz) with a clock of 2.7 - 3.7 GHz.
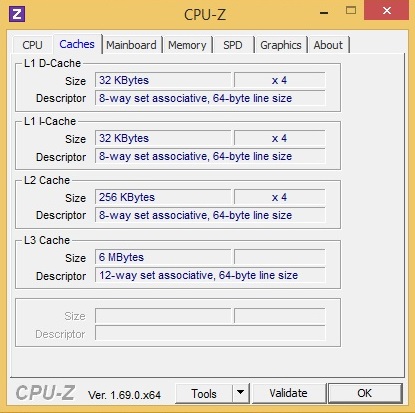
A TDP of 47 Watts and six MB of L3 cache are typical for an Intel quad-core. All models available in the Configurator are based on the Haswell architecture, and are built in the 22 nm process. Similarities are also found on the feature list. For example, all CPUs can increase the amount of simultaneous threads via Hyperthreading.
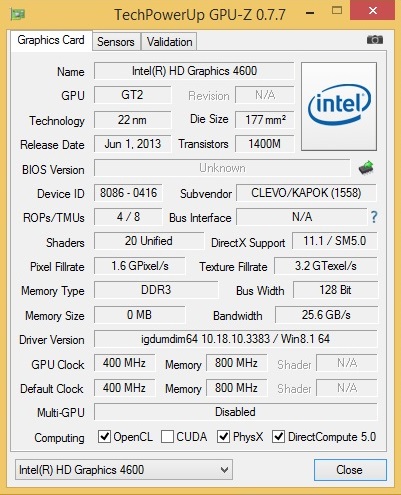
The installed HD Graphics 4600 DirectX 11 chip should also be mentioned. Since the P170SM(-A) barebones supports both the Optimus and Enduro technology, the dedicated graphics accelerator is only enabled during computing intensive programs. The HD Graphics 4600 directly processes basic tasks in the Office, Web or video sector.
Note: The Core i7-4800MQ was replaced by the 100 MHz faster Core i7-4810MQ shortly after the test.
Turbo Boost
We were not quite as pleased with the Turbo's behavior. Instead of the theoretically possible 3.7 GHz (single-core load) and 3.5 GHz (multi-core load), much lower rates were measured in the test. The high-end model "only" managed 3.3 - 3.6 GHz (short drops to 3.0 GHz) in the single-core scenario, and the multi-core load resulted in 3.3 GHz (including temporary drops to 2.7 GHz).
The less than ideal clock is noticed in the scores of some benchmarks. The consequences when gaming are minor or not even measurable. This is no surprise since the graphics card is the limiting factor here.
GPU factor or not: When one of the expensive processors is bought, it should also provide the maximum performance. We will have to wait and see whether Clevo makes improvements in this regard.

CPU Performance
Cinebench R15 recorded very good performance from the Core i7-4800 MQ despite the limited performance. With 143 points, it surpassed the Core i7-4700MQ (135 points @ Medion Erazer X7825) by 6%, and the attractively priced Core i5-4200M (122 points @ Lenovo Z710 with only two cores) by 17%.
In certain cases, the gaps are much bigger in the multi-core test. In one case, comparing 663 to 301 points, the Core i7-4800MQ calculates twice as fast as the i5-4200M Haswell. Yet the Core i7-4700MQ (643 points) is only 4% slower by comparison.
We would generally recommend the i7-4700MQ in view of the price. The top models are rarely worthwhile for most users.
| Cinebench R11.5 | |
| CPU Single 64Bit (sort by value) | |
| Core i7-4800MQ | |
| Core i5-4300M | |
| Core i7-4700MQ | |
| Core i7-4900MQ | |
| CPU Multi 64Bit (sort by value) | |
| Core i7-4800MQ | |
| Core i5-4300M | |
| Core i7-4700MQ | |
| Core i7-4900MQ | |
Graphics Card
Nvidia has caused some confusion with its new graphics card generation. The GTX 850M and GTX 860M (almost always) rely on the very promising Maxwell architecture, while only the clock rates have been increased, and a few new features added to the GTX 880M (Kepler).
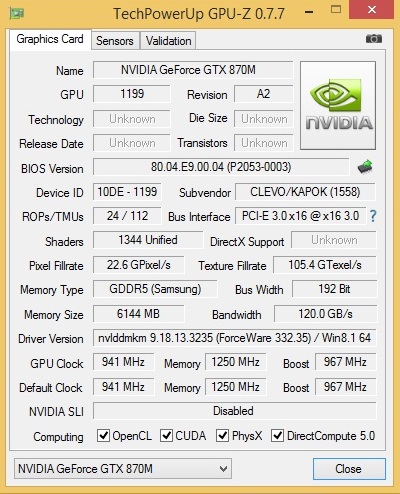
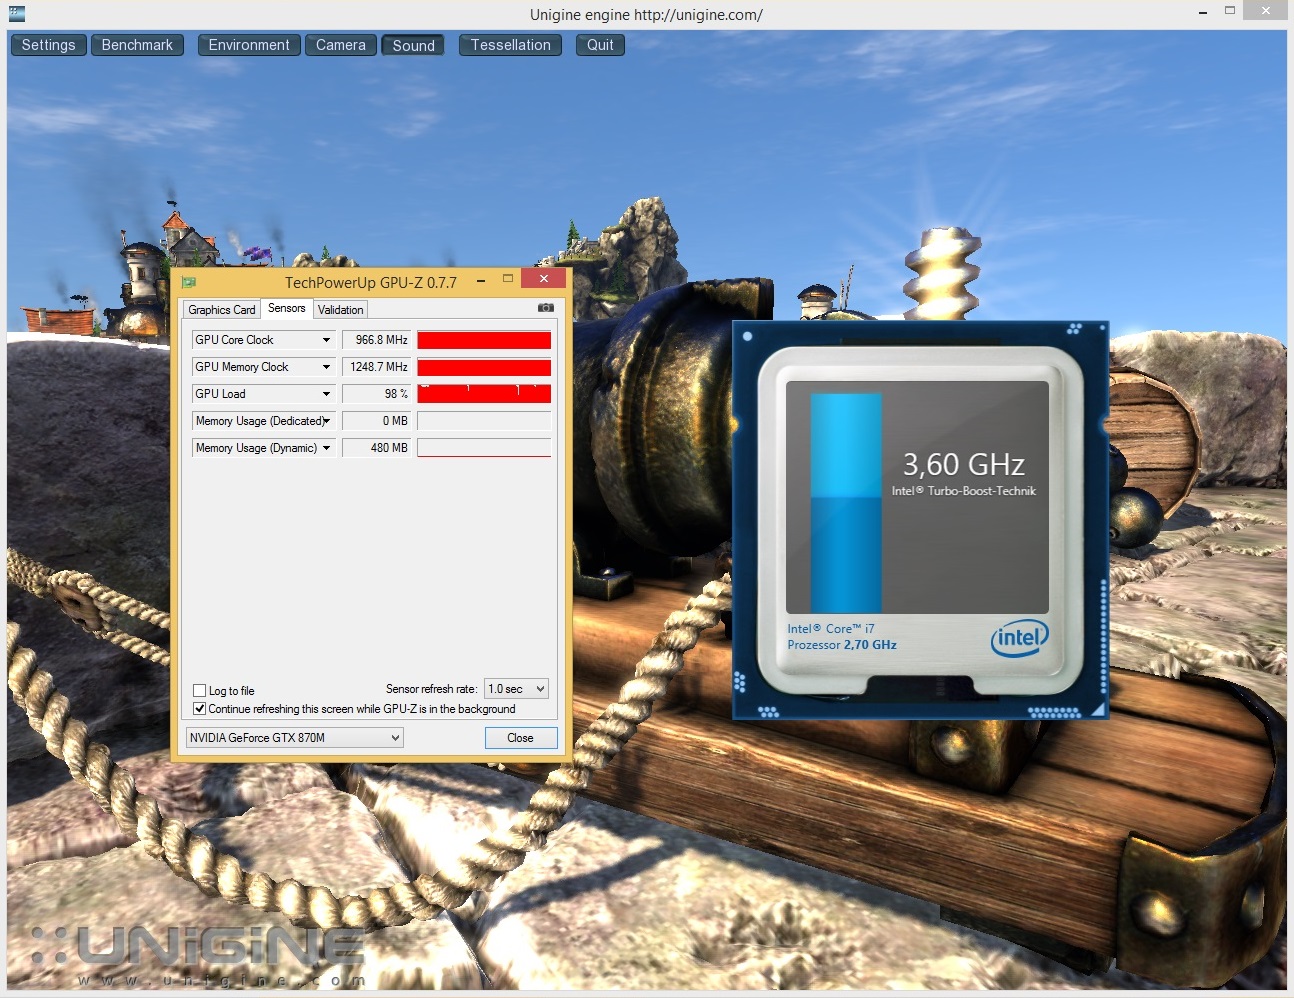
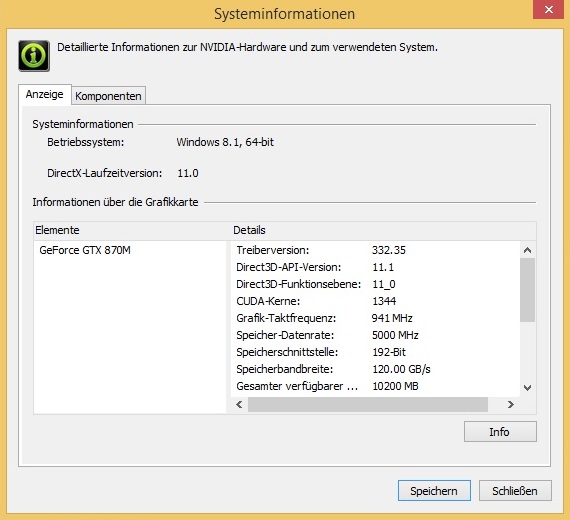
It is a bit better with the GTX 870M. Compared with the GTX 770M, not only does it have a higher clock (941/2500 vs. 811/2000 MHz), it also has a higher shader unit count. The GTX 870M offers 1344 arithmetic units rather than 960 CUDA cores, which corresponds to the level of the GTX 680M. Other modifications are found in the memory. It is possible to argue about how much sense six GB of GDDR5 RAM makes. We believe three GB, like in the GTX 770M, would have easily sufficed, especially since the memory interface (192-bit) has not been increased.
Nvidia uses the so-called GPU Boost as the counterpart to Intel's Turbo Boost. The GTX 870M's core is accelerated up to 967 MHz during load. The current GeForce GTX 880M top model (1536 CUDA cores, 8 GB of GDDR5 VRAM @256-bit) clocks with a maximum of 993 MHz. The Maxwell version of the GTX 860M even surpasses the magical 1 GHz limit. However, no matter whether Maxwell or Kepler: They are both build in the 28 nm process.
All following benchmarks were performed based on the ForceWare 332.35.
GPU Performance
As can be seen in our graphic tests, the GeForce GTX 870M has earned its name. The Unigine Heaven 3.0 benchmark, among others, proves that Nvidia has made a big step forward. The K73-4N performed the test with a velvety 65 fps using 1920 x 1080 pixels and high tessellation. This frame rate places the DirectX 11 chip exactly between the GTX 770M (49.5 fps @ One K73-3N) or GTX 860M (49.5 fps @ Schenker XMG A504), and GTX 880M (81.2 fps @ Schenker XMG P704). AMD's main competitor, the Radeon R9 M290X, performs in the same regions (62.0 fps @ One K56-4N).
The GTX 870M also did a good job in the Fire Strike scenario of 3DMark. Neither the GTX 860M (3940 points @ Schenker XMG P304) nor the GTX 770M (3569 points @ Gigabyte P25W) can compete with a GPU score of 4664 points. A lead of 18 or 31% is impressive. However, the Radeon R9 M290X (~5300 points) or GeForce GTX 880M (~6000 points) would be even faster. The "real-life", i.e. the ranking ascertained based on games, can be found further below.
| 3DMark 11 - 1280x720 Performance GPU (sort by value) | |
| GeForce GTX 870M (332.35) | |
| GeForce GTX 860M (332.60) | |
| GeForce GTX 770M (311.27) | |
| Radeon R9 M290X (13.151.0.0) | |
| GeForce GTX 780M (311.27) | |
| GeForce GTX 880M (332.35) | |
| 3DMark Vantage - 1280x1024 P GPU no PhysX (sort by value) | |
| GeForce GTX 870M (332.35) | |
| GeForce GTX 860M (332.60) | |
| GeForce GTX 770M (311.27) | |
| Radeon R9 M290X (13.151.0.0) | |
| GeForce GTX 780M (311.27) | |
| GeForce GTX 880M (332.35) | |
| 3DMark Vantage P Result | 24035 points | |
| 3DMark 11 Performance | 7151 points | |
| 3DMark Ice Storm Standard Score | 108072 points | |
| 3DMark Cloud Gate Standard Score | 17139 points | |
| 3DMark Fire Strike Score | 4261 points | |
Help | ||
Storage Devices
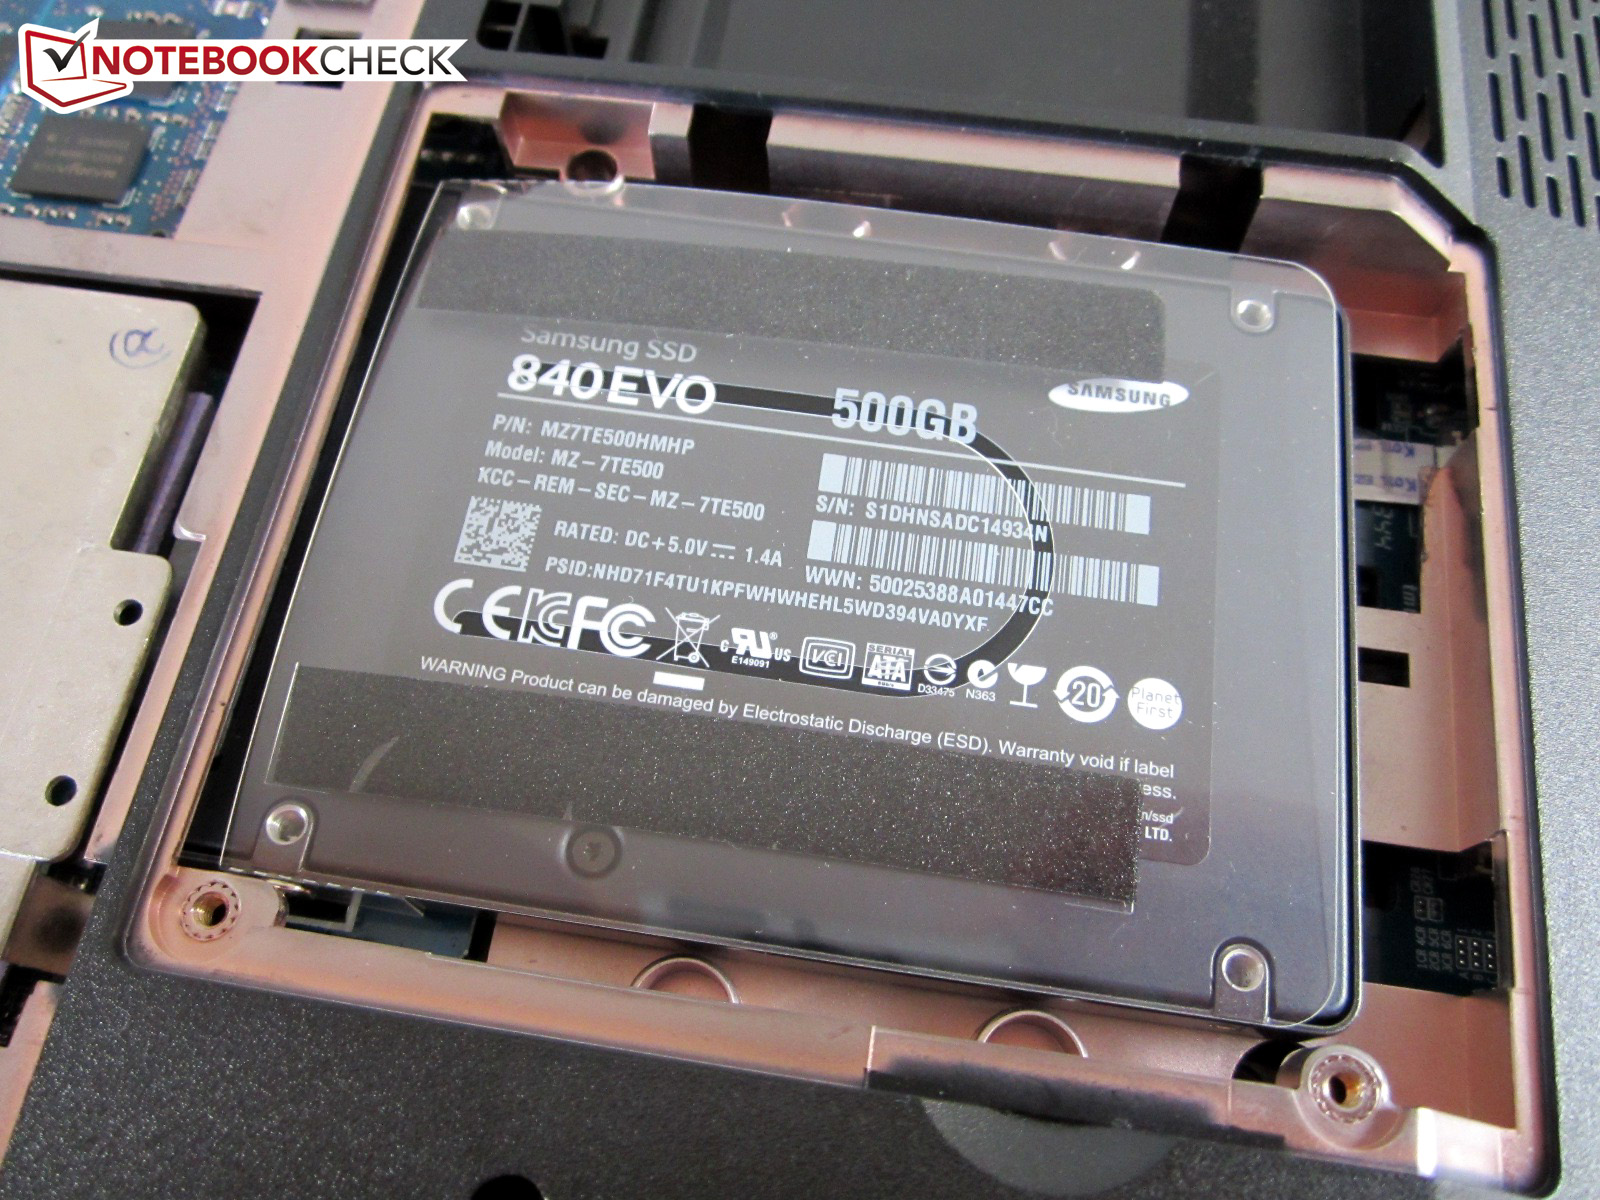
A solid-state drive with a storage capacity of 500 GB is not exactly cheap, but it offers enough space for the user's personal game collection and other programs.
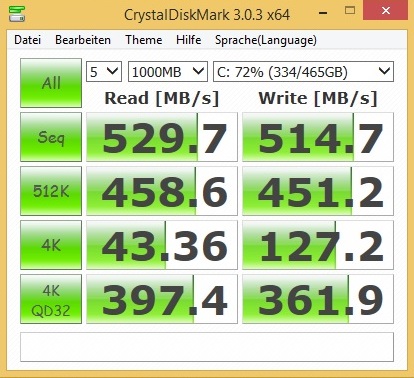
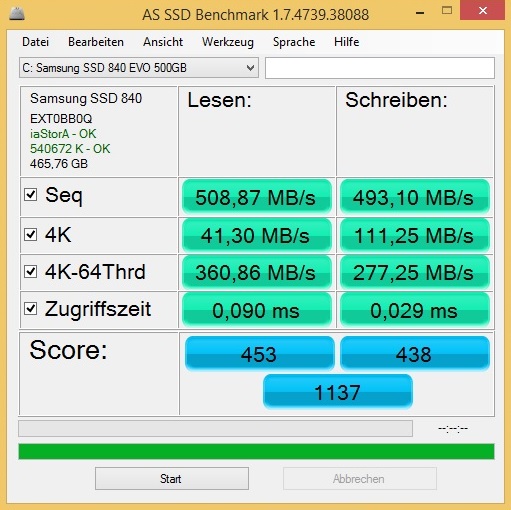
Our review sample could boast with the Samsung 840 EVO. That the 2.5-inch model belongs to the fastest of its kind is not least proved by the AS SSD benchmark. Its speed has increased considerably compared with the 840 Basic that was installed in the One K73-3N about a year ago.
Particularly big differences are revealed in sequential write. The 500 GB version of the 840 EVO achieved almost 490 rather than 320 MB/s, which equals a plus of 53%. The Crucial M500 mSATA model (Schenker XMG P704) does not achieve over 400 MB/s either. The 840 EVO also copes better with compact files than most contenders.
Buyers who want to save a bit of money, but not storage capacity, should combine a small solid-state drive with a high-capacity HDD.

System Performance
The system's performance definitely fulfills the high-end claim. With a PCMark 7 score of 6017 points, the One K73-4N is marginally above the small gaming laptops Gigabyte P34G and Schenker XMG P304, which achieve a similar score despite a weaker GPU (the hard drive has a great impact on PCMark). MSI's GS70 Stealth even has a slight lead on the One laptop owing to SSD RAID.
| PCMark 7 Score | 6017 points | |
| PCMark 8 Home Score Accelerated v2 | 3507 points | |
| PCMark 8 Creative Score Accelerated v2 | 5071 points | |
| PCMark 8 Work Score Accelerated v2 | 4401 points | |
Help | ||
Gaming Performance
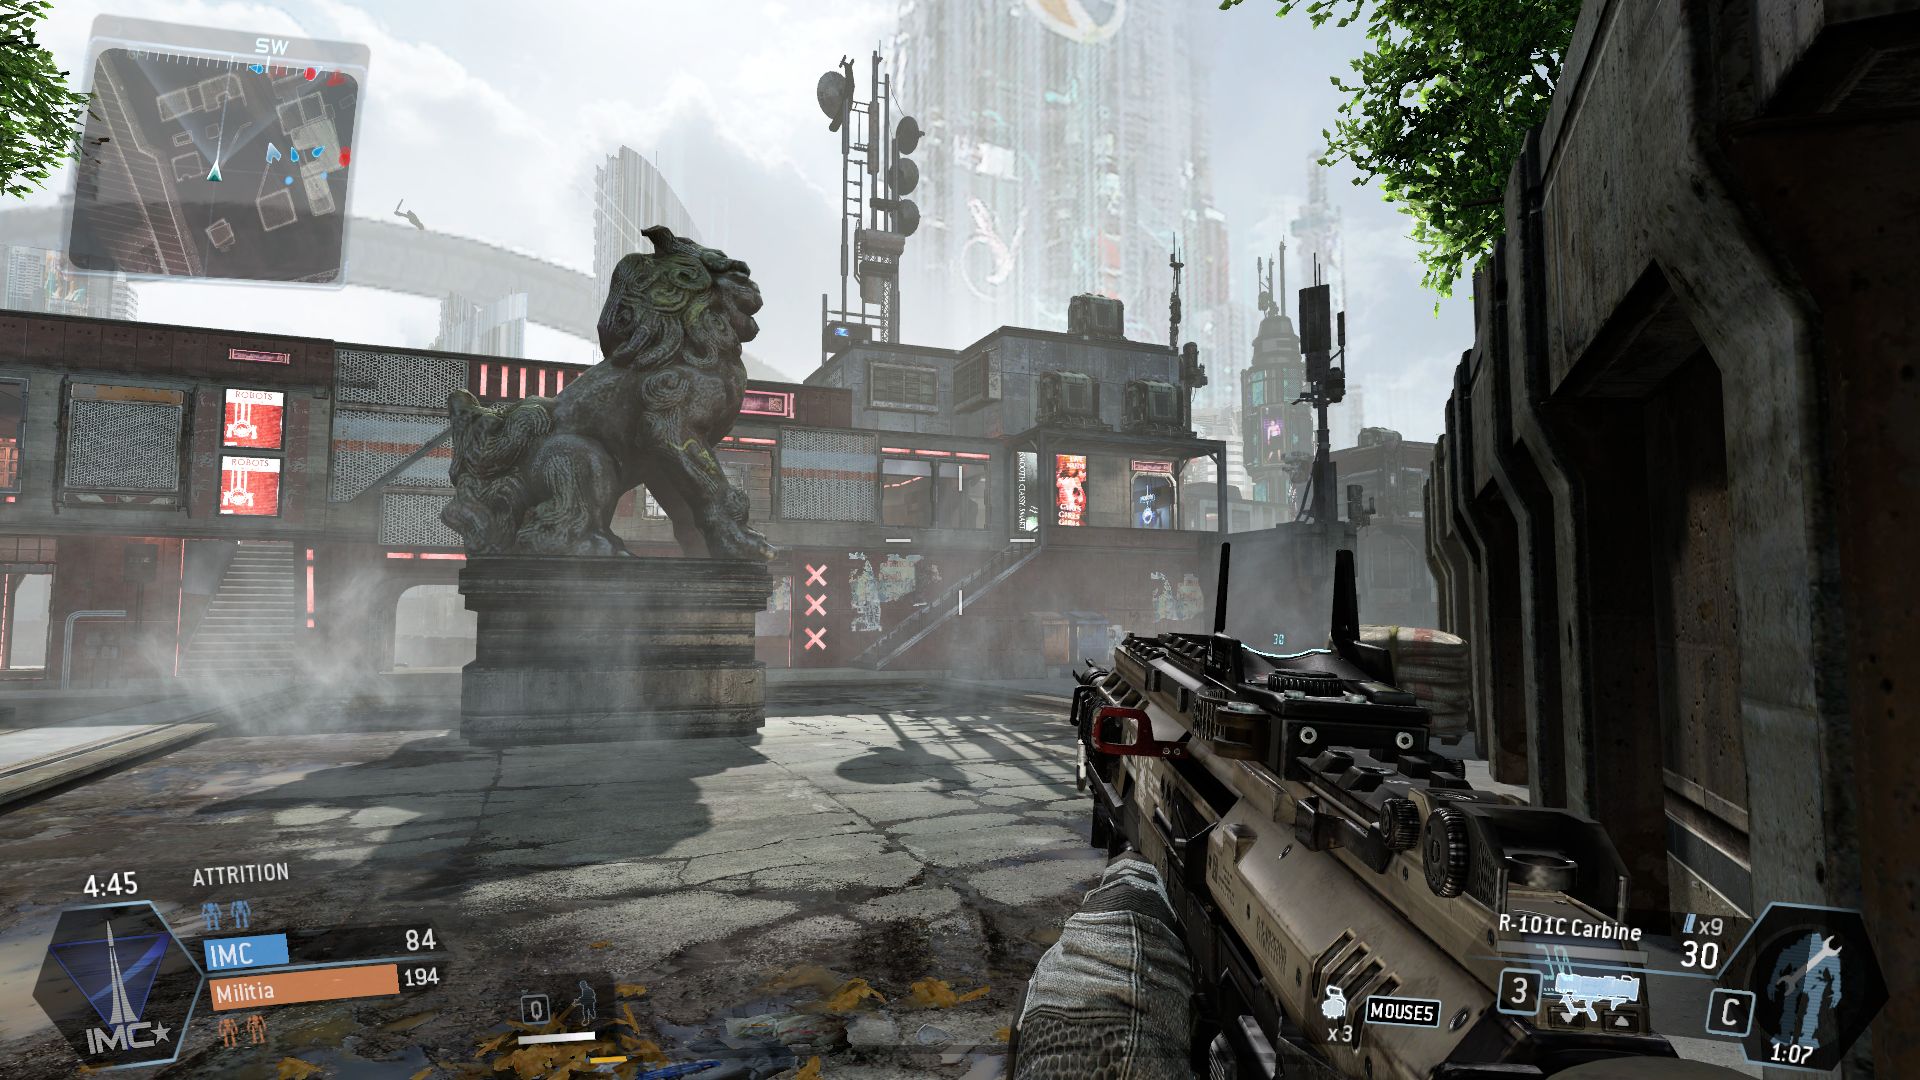
Gamers are dead right with the K73-4N. Excluding extremely hardware-hungry games, such as Crysis 3, Far Cry 3, and Hitman Absolution, the GeForce GTX 870M even copes with very high details and multiple anti-aliasing without complaint. For example, Battlefield 4 ran with just under 36 fps even in ultra presets (at least in our test sequence). Other triple-A productions like Call of Duty: Ghosts, Tomb Raider, and GRID 2 can also be played in their full graphic splendor.
| low | med. | high | ultra | |
| Guild Wars 2 (2012) | 106.4 | 58.8 | 34.6 | |
| Hitman: Absolution (2012) | 60.6 | 56.8 | 49.2 | 27.9 |
| Far Cry 3 (2012) | 106.2 | 94.3 | 70.7 | 28.4 |
| Crysis 3 (2013) | 122.2 | 94.2 | 66.1 | 26.7 |
| Tomb Raider (2013) | 293.3 | 211.3 | 129.3 | 59.8 |
| BioShock Infinite (2013) | 190.8 | 147.9 | 131.7 | 52.2 |
| Metro: Last Light (2013) | 94.8 | 85.9 | 61.4 | 34.4 |
| GRID 2 (2013) | 148.5 | 111.2 | 101.4 | 64.1 |
| Dota 2 (2013) | 119 | 113.4 | 99.6 | |
| Saints Row IV (2013) | 72 | 60.5 | 53.9 | 43.4 |
| F1 2013 (2013) | 118 | 111 | 105 | 87 |
| Battlefield 4 (2013) | 145.1 | 124.3 | 90.8 | 36.2 |
| Call of Duty: Ghosts (2013) | 87.3 | 83.4 | 57.9 | 37.3 |
| X-Plane 10.25 (2013) | 100.4 | 49 | 27.4 | 20.5 |
| Thief (2014) | 58.2 | 54.1 | 51.5 | 31.9 |
| Titanfall (2014) | 60 | 60 | 60 | 57.8 |
The eternal battle between the GPU giants turns in favor of Nvidia this time. While AMD could score with a better price-performance ratio in the last generation (HD 8970M vs. GTX 770M), the "red manufacturer" does not have much to speak for it now. Although the GTX 870M is slightly more expensive than the Radeon R9 M290X, the customer gets an equal performance, a better developed driver, and a better designed graphics switching. Even the GTX 780M has a hard time competing depending on the game.
| Graphics Card | Total Performance @ Ultra Settings |
|---|---|
| GeForce GTX 880M | +20% |
| GeForce GTX 780M | +8% |
| GeForce GTX 870M | Basis |
| Radeon R9 M290X | -2% |
| GeForce GTX 860M | -19% |
| GeForce GTX 770M | -23% |
The distance to the GTX 770M is approximately 30%, which confirms Nvidia's specifications. However, we have to note that the predecessor was tested using much older drivers, and thus is at a disadvantage in some games (among others: Dota 2 & BioShock Infinite). Statements that are more precise can be made about the 800 range because identical drivers were installed in each case. The GTX 870M calculates roughly 23% faster than the GTX 860M, and 17% slower than the GTX 880M. Does that justify the surcharge of 300 Euros (~$414)? We think - to a certain degree.
It would however be great if Nvidia would roll out new high-end chips based on Maxwell in the next few months, mainly because of their improved energy-efficiency.
| Titanfall - 1920x1080 (Very) High AA:4xMS AF:16x (sort by value) | |
| GeForce GTX 870M (332.35) | |
| GeForce GTX 860M (332.35) | |
| GeForce GTX 770M (mixed driver) | |
| Radeon R9 M290X (13.151.0.0) | |
| GeForce GTX 780M (mixed driver) | |
| GeForce GTX 880M (332.35) | |
| Thief - 1920x1080 Very High Preset AA:FXAA & High SS AF:8x (sort by value) | |
| GeForce GTX 870M (332.35) | |
| GeForce GTX 860M (332.35) | |
| GeForce GTX 770M (mixed driver) | |
| Radeon R9 M290X (13.151.0.0) | |
| GeForce GTX 780M (mixed driver) | |
| GeForce GTX 880M (332.35) | |
| X-Plane 10.25 - 1920x1080 ultra (fps_test=4) test_flight_c4 (sort by value) | |
| GeForce GTX 870M (332.35) | |
| GeForce GTX 860M (332.35) | |
| GeForce GTX 770M (mixed driver) | |
| Radeon R9 M290X (13.151.0.0) | |
| GeForce GTX 780M (mixed driver) | |
| GeForce GTX 880M (332.35) | |
| Call of Duty: Ghosts - 1920x1080 Extra / High / HBAO+ / No dynamic fur AA:4x MS (sort by value) | |
| GeForce GTX 870M (332.35) | |
| GeForce GTX 860M (332.35) | |
| GeForce GTX 770M (mixed driver) | |
| Radeon R9 M290X (13.151.0.0) | |
| GeForce GTX 780M (mixed driver) | |
| GeForce GTX 880M (332.35) | |
| Battlefield 4 - 1920x1080 Ultra Preset AA:4x MS (sort by value) | |
| GeForce GTX 870M (332.35) | |
| GeForce GTX 860M (332.35) | |
| GeForce GTX 770M (mixed driver) | |
| Radeon R9 M290X (13.151.0.0) | |
| GeForce GTX 780M (mixed driver) | |
| GeForce GTX 880M (332.35) | |
| F1 2013 - 1920x1080 Ultra Preset AA:4x MS (sort by value) | |
| GeForce GTX 870M (332.35) | |
| GeForce GTX 860M (332.35) | |
| GeForce GTX 770M (mixed driver) | |
| GeForce GTX 780M (mixed driver) | |
| GeForce GTX 880M (332.35) | |
| Saints Row IV - 1920x1080 Ultra Preset AA:8x MS AF:16x (sort by value) | |
| GeForce GTX 870M (332.35) | |
| GeForce GTX 860M (332.35) | |
| GeForce GTX 770M (mixed driver) | |
| Radeon R9 M290X (13.151.0.0) | |
| GeForce GTX 780M (mixed driver) | |
| GeForce GTX 880M (332.35) | |
| Dota 2 - 1920x1080 High / On, Render Quality: 100 % (sort by value) | |
| GeForce GTX 870M (332.35) | |
| GeForce GTX 860M (332.35) | |
| GeForce GTX 770M (mixed driver) | |
| Radeon R9 M290X (13.151.0.0) | |
| GeForce GTX 780M (mixed driver) | |
| GeForce GTX 880M (332.35) | |
| GRID 2 - 1920x1080 Ultra Preset AA:4xMS (sort by value) | |
| GeForce GTX 870M (332.35) | |
| GeForce GTX 860M (332.35) | |
| Radeon R9 M290X (13.151.0.0) | |
| GeForce GTX 880M (332.35) | |
| Metro: Last Light - 1920x1080 Very High (DX11) AF:16x (sort by value) | |
| GeForce GTX 870M (332.35) | |
| GeForce GTX 860M (332.35) | |
| Radeon R9 M290X (13.151.0.0) | |
| GeForce GTX 880M (332.35) | |
| BioShock Infinite - 1920x1080 Ultra Preset, DX11 (DDOF) (sort by value) | |
| GeForce GTX 870M (332.35) | |
| GeForce GTX 860M (332.35) | |
| GeForce GTX 770M (311.27) | |
| Radeon R9 M290X (13.151.0.0) | |
| GeForce GTX 780M (311.27) | |
| GeForce GTX 880M (332.35) | |
| Tomb Raider - 1920x1080 Ultra Preset AA:FX AF:16x (sort by value) | |
| GeForce GTX 870M (332.35) | |
| GeForce GTX 860M (332.35) | |
| GeForce GTX 770M (311.27) | |
| Radeon R9 M290X (13.151.0.0) | |
| GeForce GTX 780M (311.27) | |
| GeForce GTX 880M (332.35) | |
| Crysis 3 - 1920x1080 Very High Preset AA:2xSM AF:16x (sort by value) | |
| GeForce GTX 870M (332.35) | |
| GeForce GTX 860M (332.35) | |
| GeForce GTX 770M (311.27) | |
| Radeon R9 M290X (13.151.0.0) | |
| GeForce GTX 780M (311.27) | |
| GeForce GTX 880M (332.35) | |
| Far Cry 3 - 1920x1080 DX11 Ultra Preset (HDAO, Enhanced Alpha To Coverage) AA:4x MS (sort by value) | |
| GeForce GTX 870M (332.35) | |
| GeForce GTX 860M (332.35) | |
| GeForce GTX 770M (311.27) | |
| Radeon R9 M290X (13.151.0.0) | |
| GeForce GTX 780M (311.27) | |
| GeForce GTX 880M (332.35) | |
| Hitman: Absolution - 1920x1080 Ultra Preset AA:4xMS AF:16x (sort by value) | |
| GeForce GTX 870M (332.35) | |
| GeForce GTX 860M (332.35) | |
| GeForce GTX 770M (311.27) | |
| Radeon R9 M290X (13.151.0.0) | |
| GeForce GTX 780M (311.27) | |
| GeForce GTX 880M (332.35) | |
| Guild Wars 2 - 1920x1080 All Maximum / On AA:FX (sort by value) | |
| GeForce GTX 870M (332.35) | |
| GeForce GTX 860M (332.35) | |
| GeForce GTX 770M (311.27) | |
| GeForce GTX 780M (311.27) | |
| GeForce GTX 880M (332.35) | |
Emissions
System Noise
Loud, louder, Clevo. This motto has been true for the barebones giant for years. Although the fan management is not yet compelling, a few optimizations can be ascertained in some places. In contrast to a rate of 35.7 dB(A) from the K73-3N, the successor now operates with an acceptable 33.5 db(A). The laptop could even be silent when an SSD is installed - providing a longer idle period precedes. However, the fan's noise tends to increase unnecessarily to approximately 38 dB(A), which is a long-known problem.
The K73-4N is extremely audible during load. Up to 49 dB(A) in 3DMark 06, and a maximum of 52 dB(A) in the stress test are steep even for a gaming laptop. Other Clevo barebones, such as the W230SS, P150SM or P177SM(-A), do an equally poor job in these situations. There is no comparison with the Asus G750JH, which does not get unpleasantly loud even under extreme load. Connecting a headset or listening to music on the side is recommendable depending on the computer game genre.
Noise Level
| Idle |
| 29.2 / 33.5 / 37.8 dB(A) |
| DVD |
| 38.4 / dB(A) |
| Load |
| 49 / 52.3 dB(A) |
 | ||
30 dB silent 40 dB(A) audible 50 dB(A) loud |
||
min: | ||
Temperature

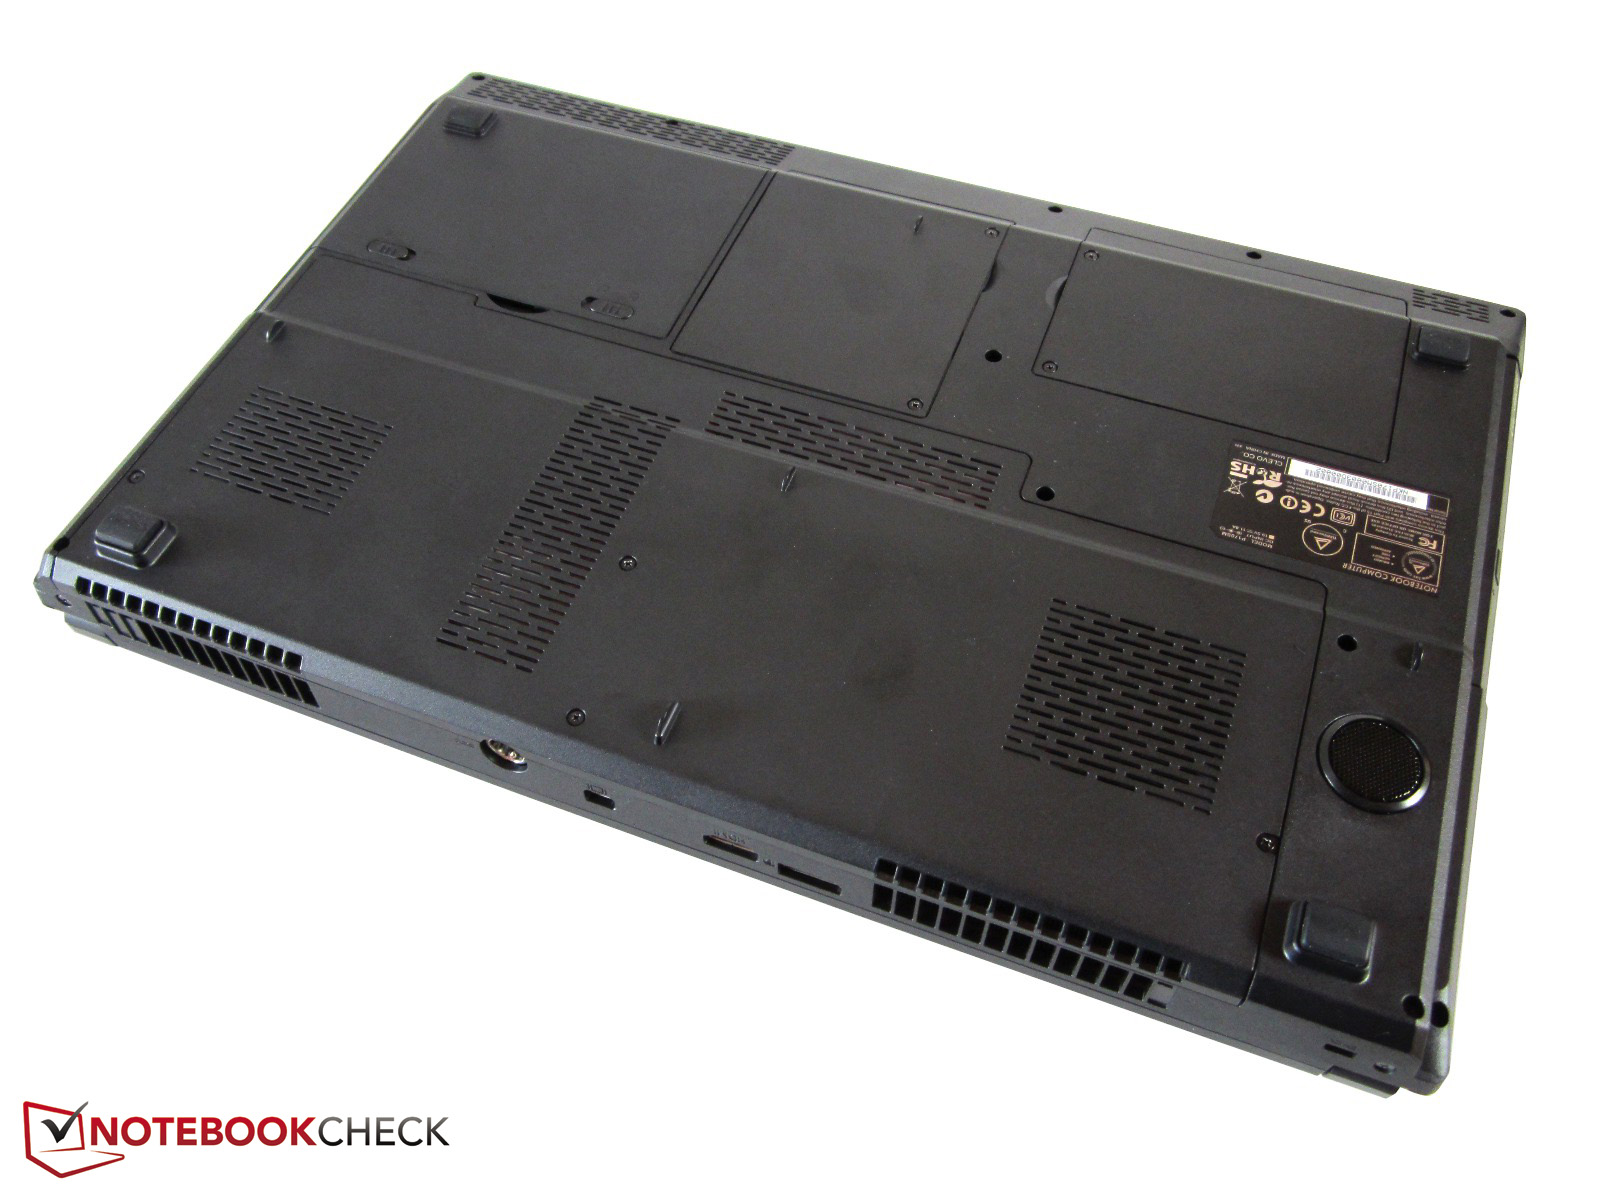
The temperatures on the casing's surfaces are quite low. An average of 27 °C (80.6 °F) in idle mode, and 34 °C (93.2 °F) during full load are more than acceptable. The K73-4N presents an agreeable temperature even in the fan area that gets very hot in some laptops. The wrist rest does not even surpass 30 °C (86 °F).
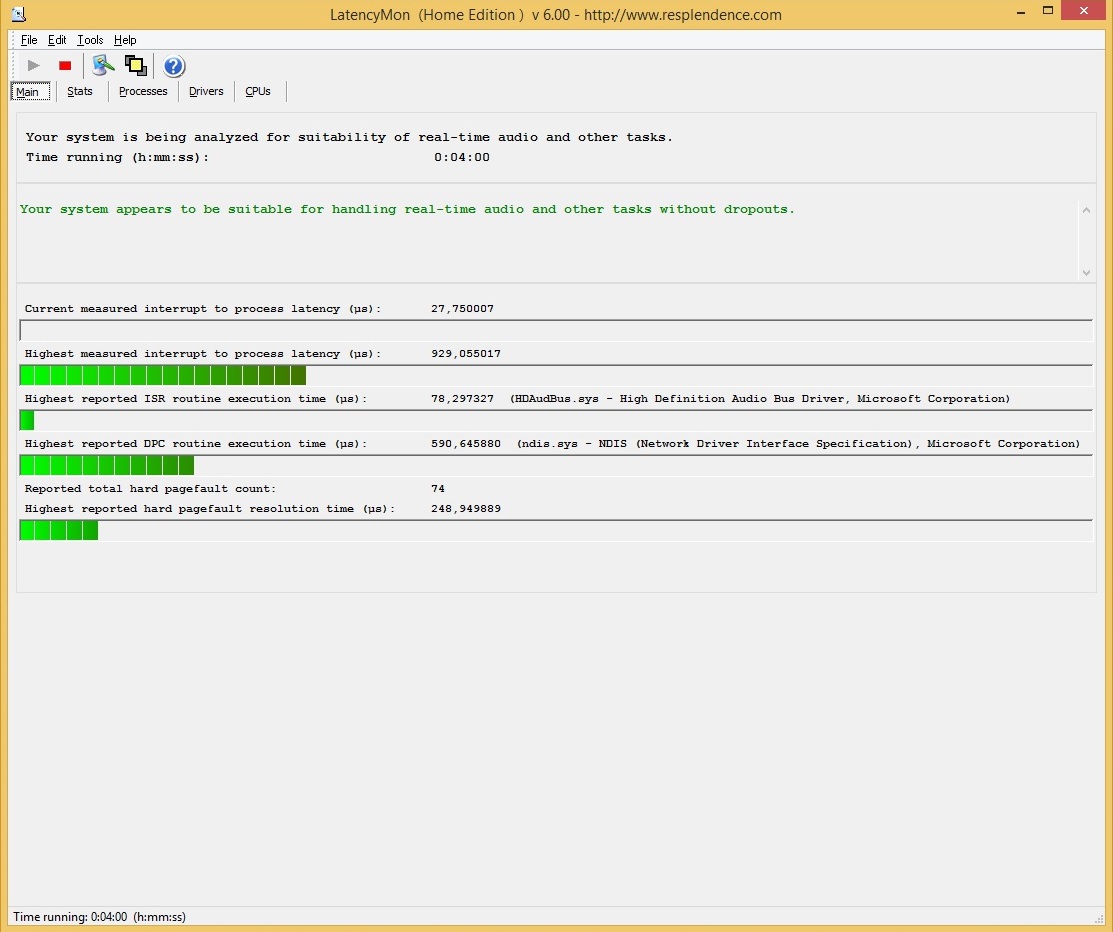
Now a look at the components, which have to cope with higher temperatures, as usual. A longer stress test using the tools FurMark and Prime95 pushed both the processor and the GPU to a temperature of approximately 90 °C (194 °F). As soon as this rate was achieved, the fan sped up to its maximum and the hardware cooled down a bit. The Core i7-4800MQ and GeForce GTX 870M settled to 80 - 85 °C (176 - 185 °F) after almost an hour. CPU throttling did not occur during the stress test.
(±) The maximum temperature on the upper side is 42.3 °C / 108 F, compared to the average of 40.4 °C / 105 F, ranging from 21.2 to 68.8 °C for the class Gaming.
(±) The bottom heats up to a maximum of 42.9 °C / 109 F, compared to the average of 43.2 °C / 110 F
(+) In idle usage, the average temperature for the upper side is 27 °C / 81 F, compared to the device average of 33.8 °C / 93 F.
(+) The palmrests and touchpad are cooler than skin temperature with a maximum of 27.4 °C / 81.3 F and are therefore cool to the touch.
(±) The average temperature of the palmrest area of similar devices was 28.9 °C / 84 F (+1.5 °C / 2.7 F).
Speakers
We would refer to the predecessor for more information about this category.
Energy Management
Power Consumption
The test configuration corresponds with the K73-3N when idling. 16 to 29 Watts could not be so easily achieved without graphics switching.
The stronger graphics chip is noticed as soon as the laptop is loaded. The K73-4N consumes 121 Watts in contrast to 106 Watts in 3DMark 06 (+14%), which is acceptable in view of the higher performance. The situation looks similar during full load with 176 vs. 196 Watts. A look at the One K56-4N shows that the energy management of the Radeon R9 M290X is on par.
| Off / Standby | |
| Idle | |
| Load |
|
Battery Runtime

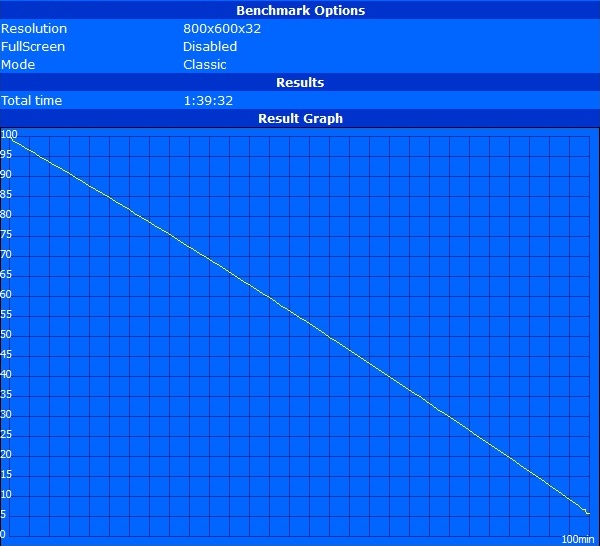
Since Clevo installs an 8-cell battery with 77 Wh in the high-end chassis, the runtimes of the P-series do not vary greatly, regardless whether it is the P150SM or P177SM-A.
A maximum of 4 - 5 hours is possible at 0% brightness and when idling. If gaming, users can expect 1 - 2 hours of 3D operation with 100% brightness. The laptop lasts for roughly 3 - 4 hours without its power supply when browsing the Internet via Wi-Fi (medium brightness).
Verdict
Although we find it a bit too bad that the barebones manufacturer Clevo barely modified the casing, the One K73-4N is impressive.
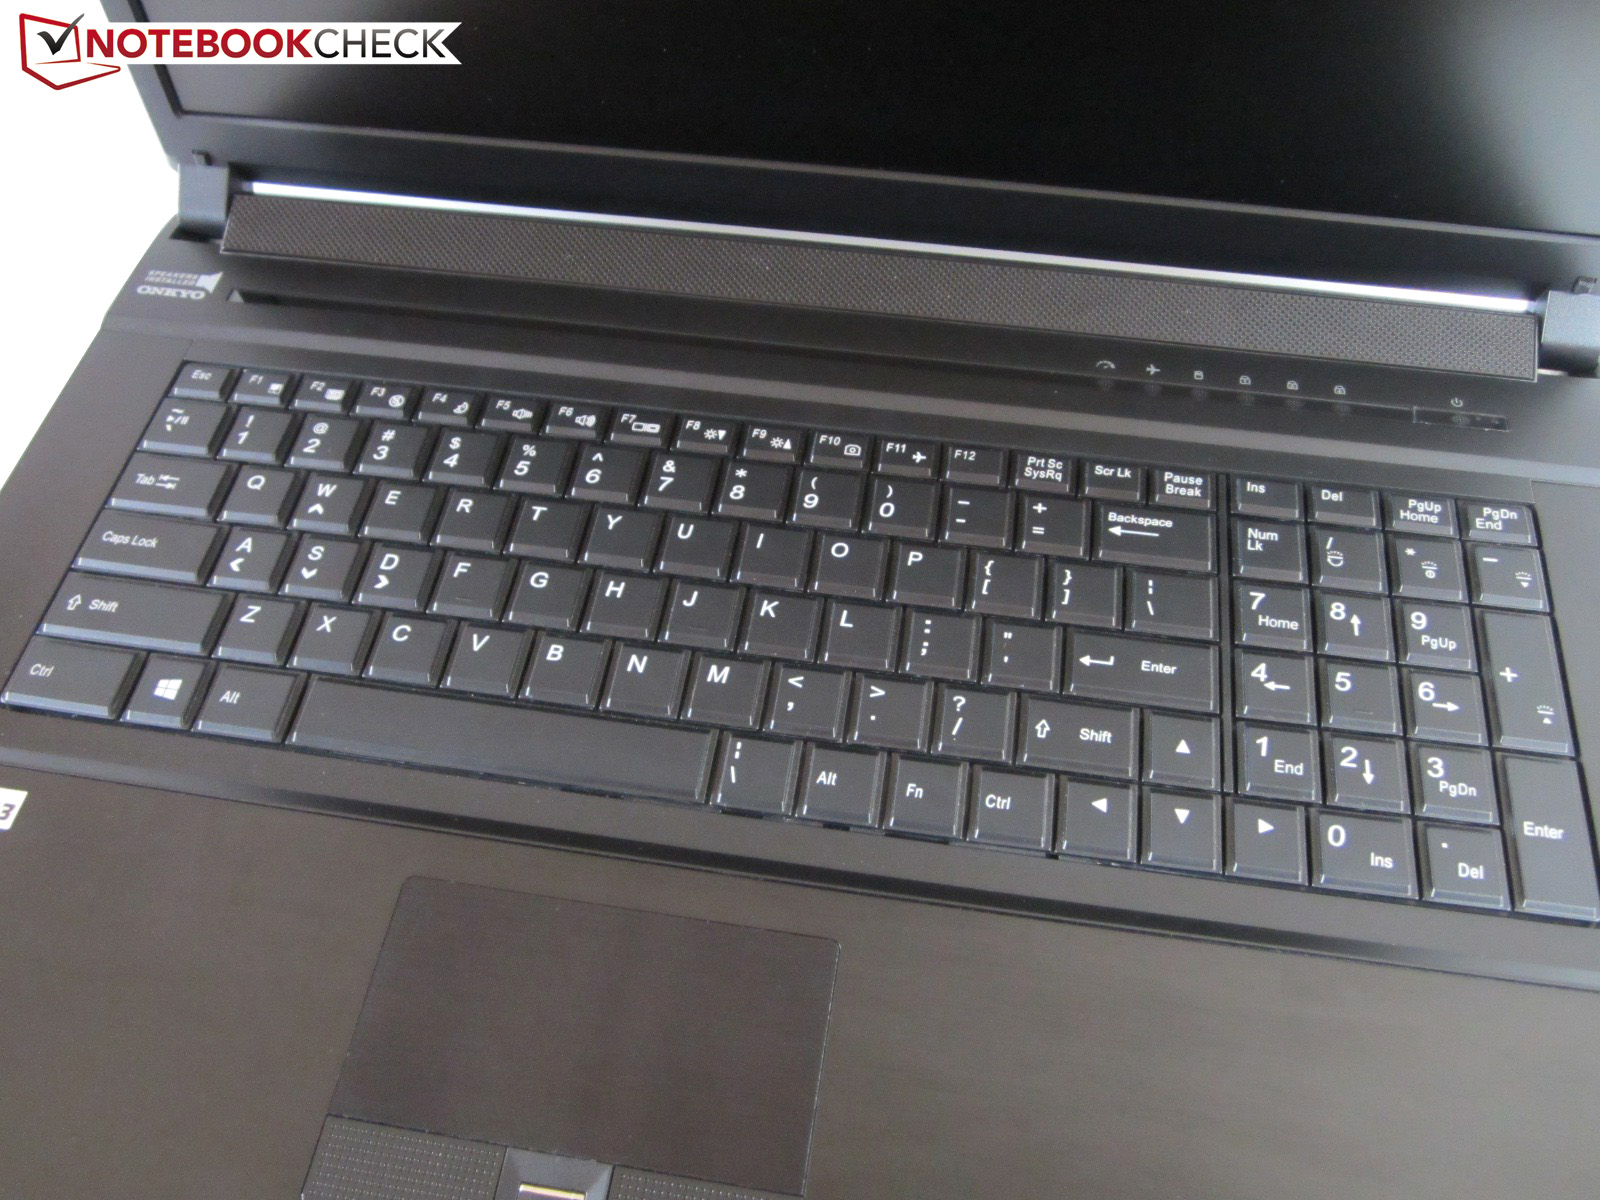
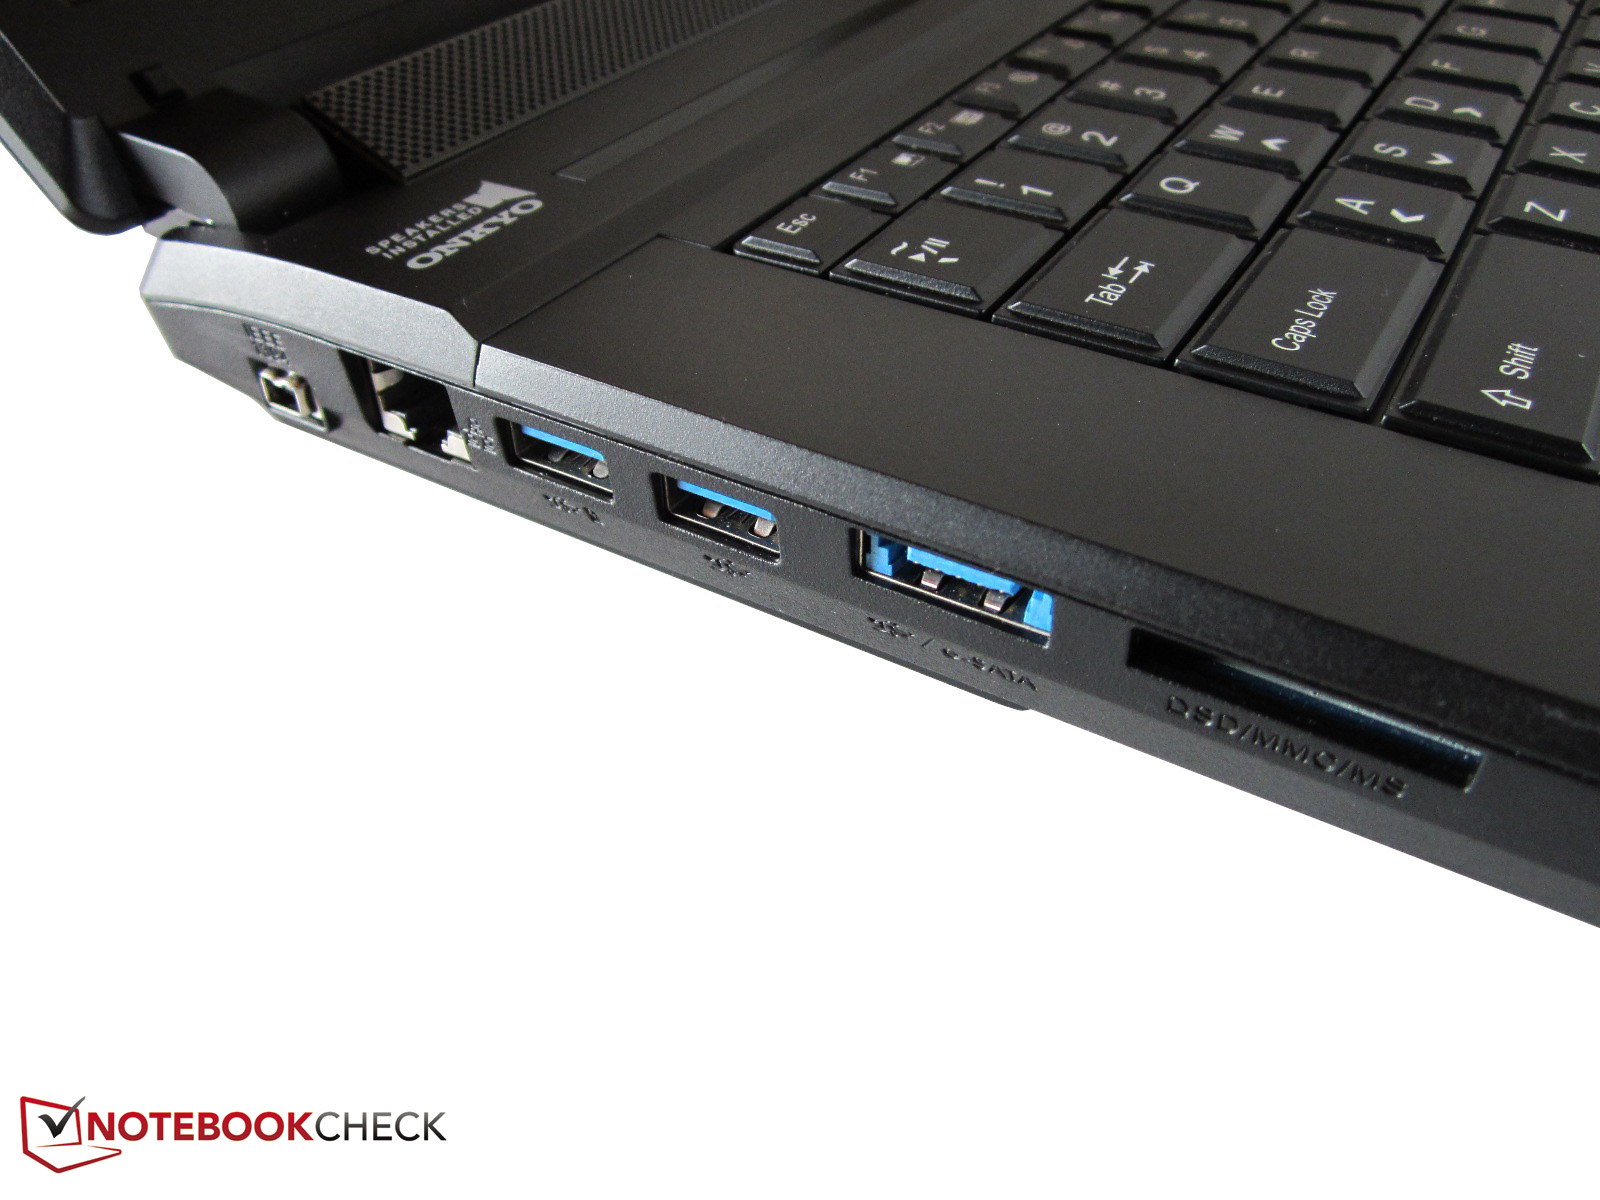
Besides the video and audio quality, which is not worthy of reference yet mostly satisfactory, we particularly like the backlit keyboard and moderate temperatures; not to mention the easy maintenance. Not every contender provides the option of using up to four storage devices. Two DisplayPorts, three USB 3.0 ports, and four audio jacks also give the 17-inch laptop the charm of a desktop replacement.
The GeForce GTX 870M proves to be the perfect and still fairly attractively priced gaming companion. How fast would the graphics card be if it were based on Maxwell?
Regardless of that, the P170SM-A barebones struggles with a few old drawbacks. The heavy power supply, thick build, second-rate touchpad - there is definitely still room for improvement. Our main point of criticism is, however, the noise. Clevo just does not manage to keep its laptops quiet during load. Of course, a "whisper-quiet" fan should not be expected from such a strong system. Nevertheless, approximately 50 dB(A) in gaming operation is a bit too much.
Users who can live with these shortcomings can eagerly jump into the configuration list.