 Deutsch
 English
 Español
 Français
 Italiano
 Nederlands
 Polski
 Português
 Русский
 Türkçe
 Svenska
 Chinese
 Magyar
MSI Aegis 3 8RD (Core i7-8700, GTX 1070, 16 GB) Desktop PC Review
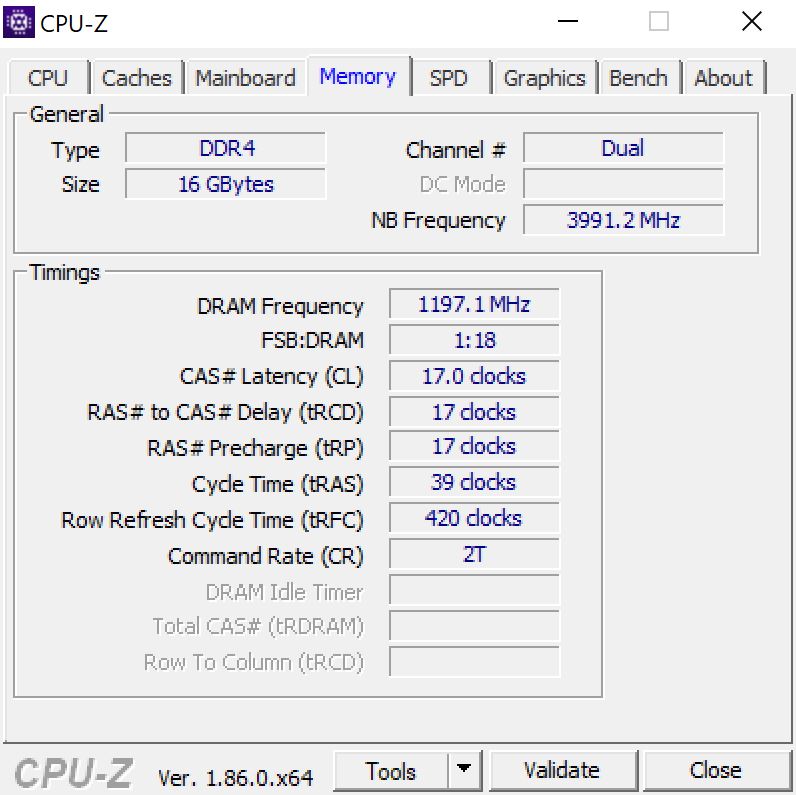
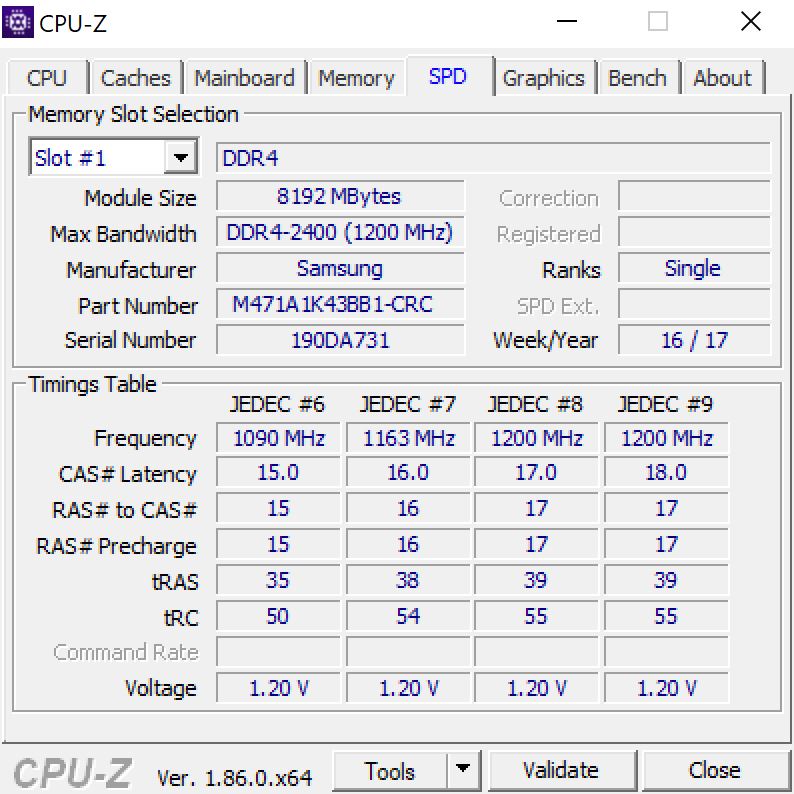
The MSI Aegis 3 8RD is a ready-made PC for gamers who do not want to spend time sourcing and assembling components. MSI offers the optimal solution with the compact computer. The Aegis 3 8RD has well-matched hardware, while MSI has included a special heat pipe solution specifically to cool the Intel Core i7-8700 processor. The company has included an Nvidia GeForce GTX 1070 GPU with 8GB GDDR5 VRAM too, specifically the MSI GeForce GTX 1070 Gaming Armor 8G. The Aegis 3 8RD is rounded off with two 8 GB SO-DIMM modules, but this could be expanded to 32 GB should you need to.
A gaming laptop, or in this case a gaming PC, should have enough storage to accommodate a large collection of games. MSI has included a combined total of 1.2 TB with the Aegis 3 8RD, which is spread across a 256 GB SSD and a 3.5-inch 1 TB HDD. Moreover, there is also 16 GB of Intel Optane memory, which should quicken the load times of games that are stored on the 1 TB HDD.
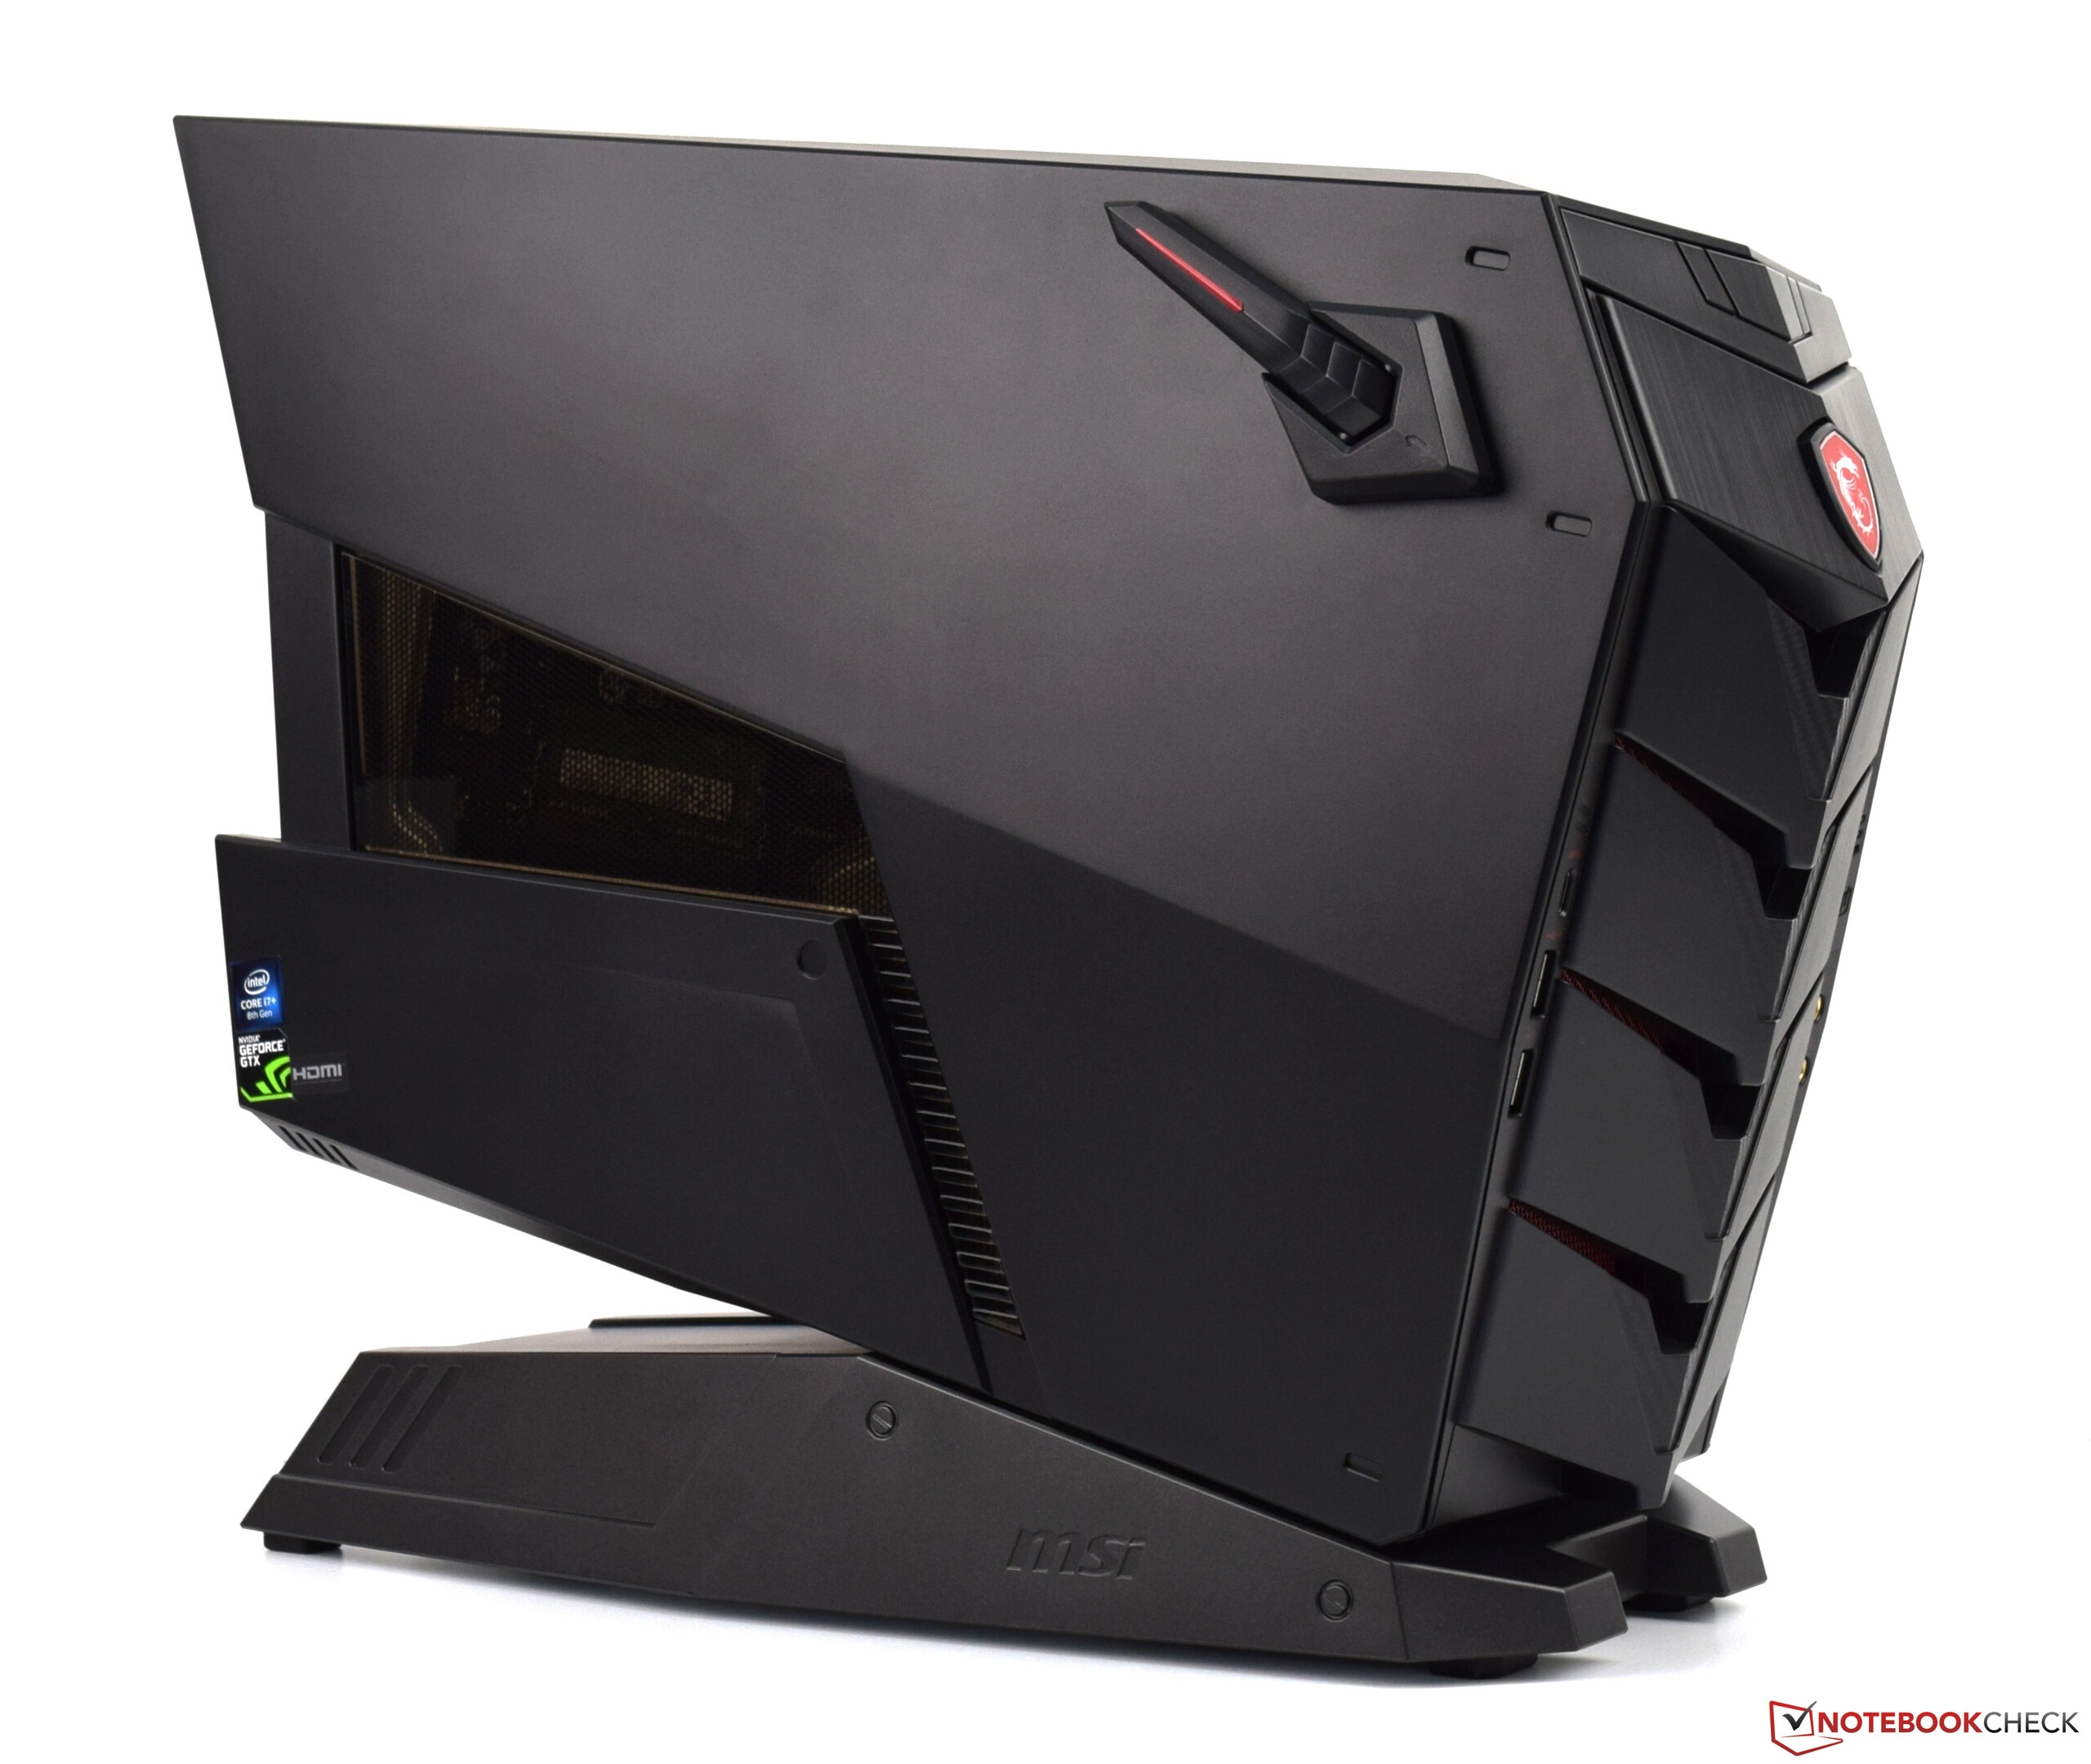
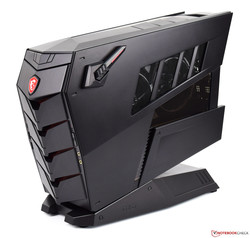
The Aegis 3 8RD is a compact gaming PC with a stylish case and RGB lighting. The device currently costs around US$1,500-US$1,600 at the time of writing from various companies online.
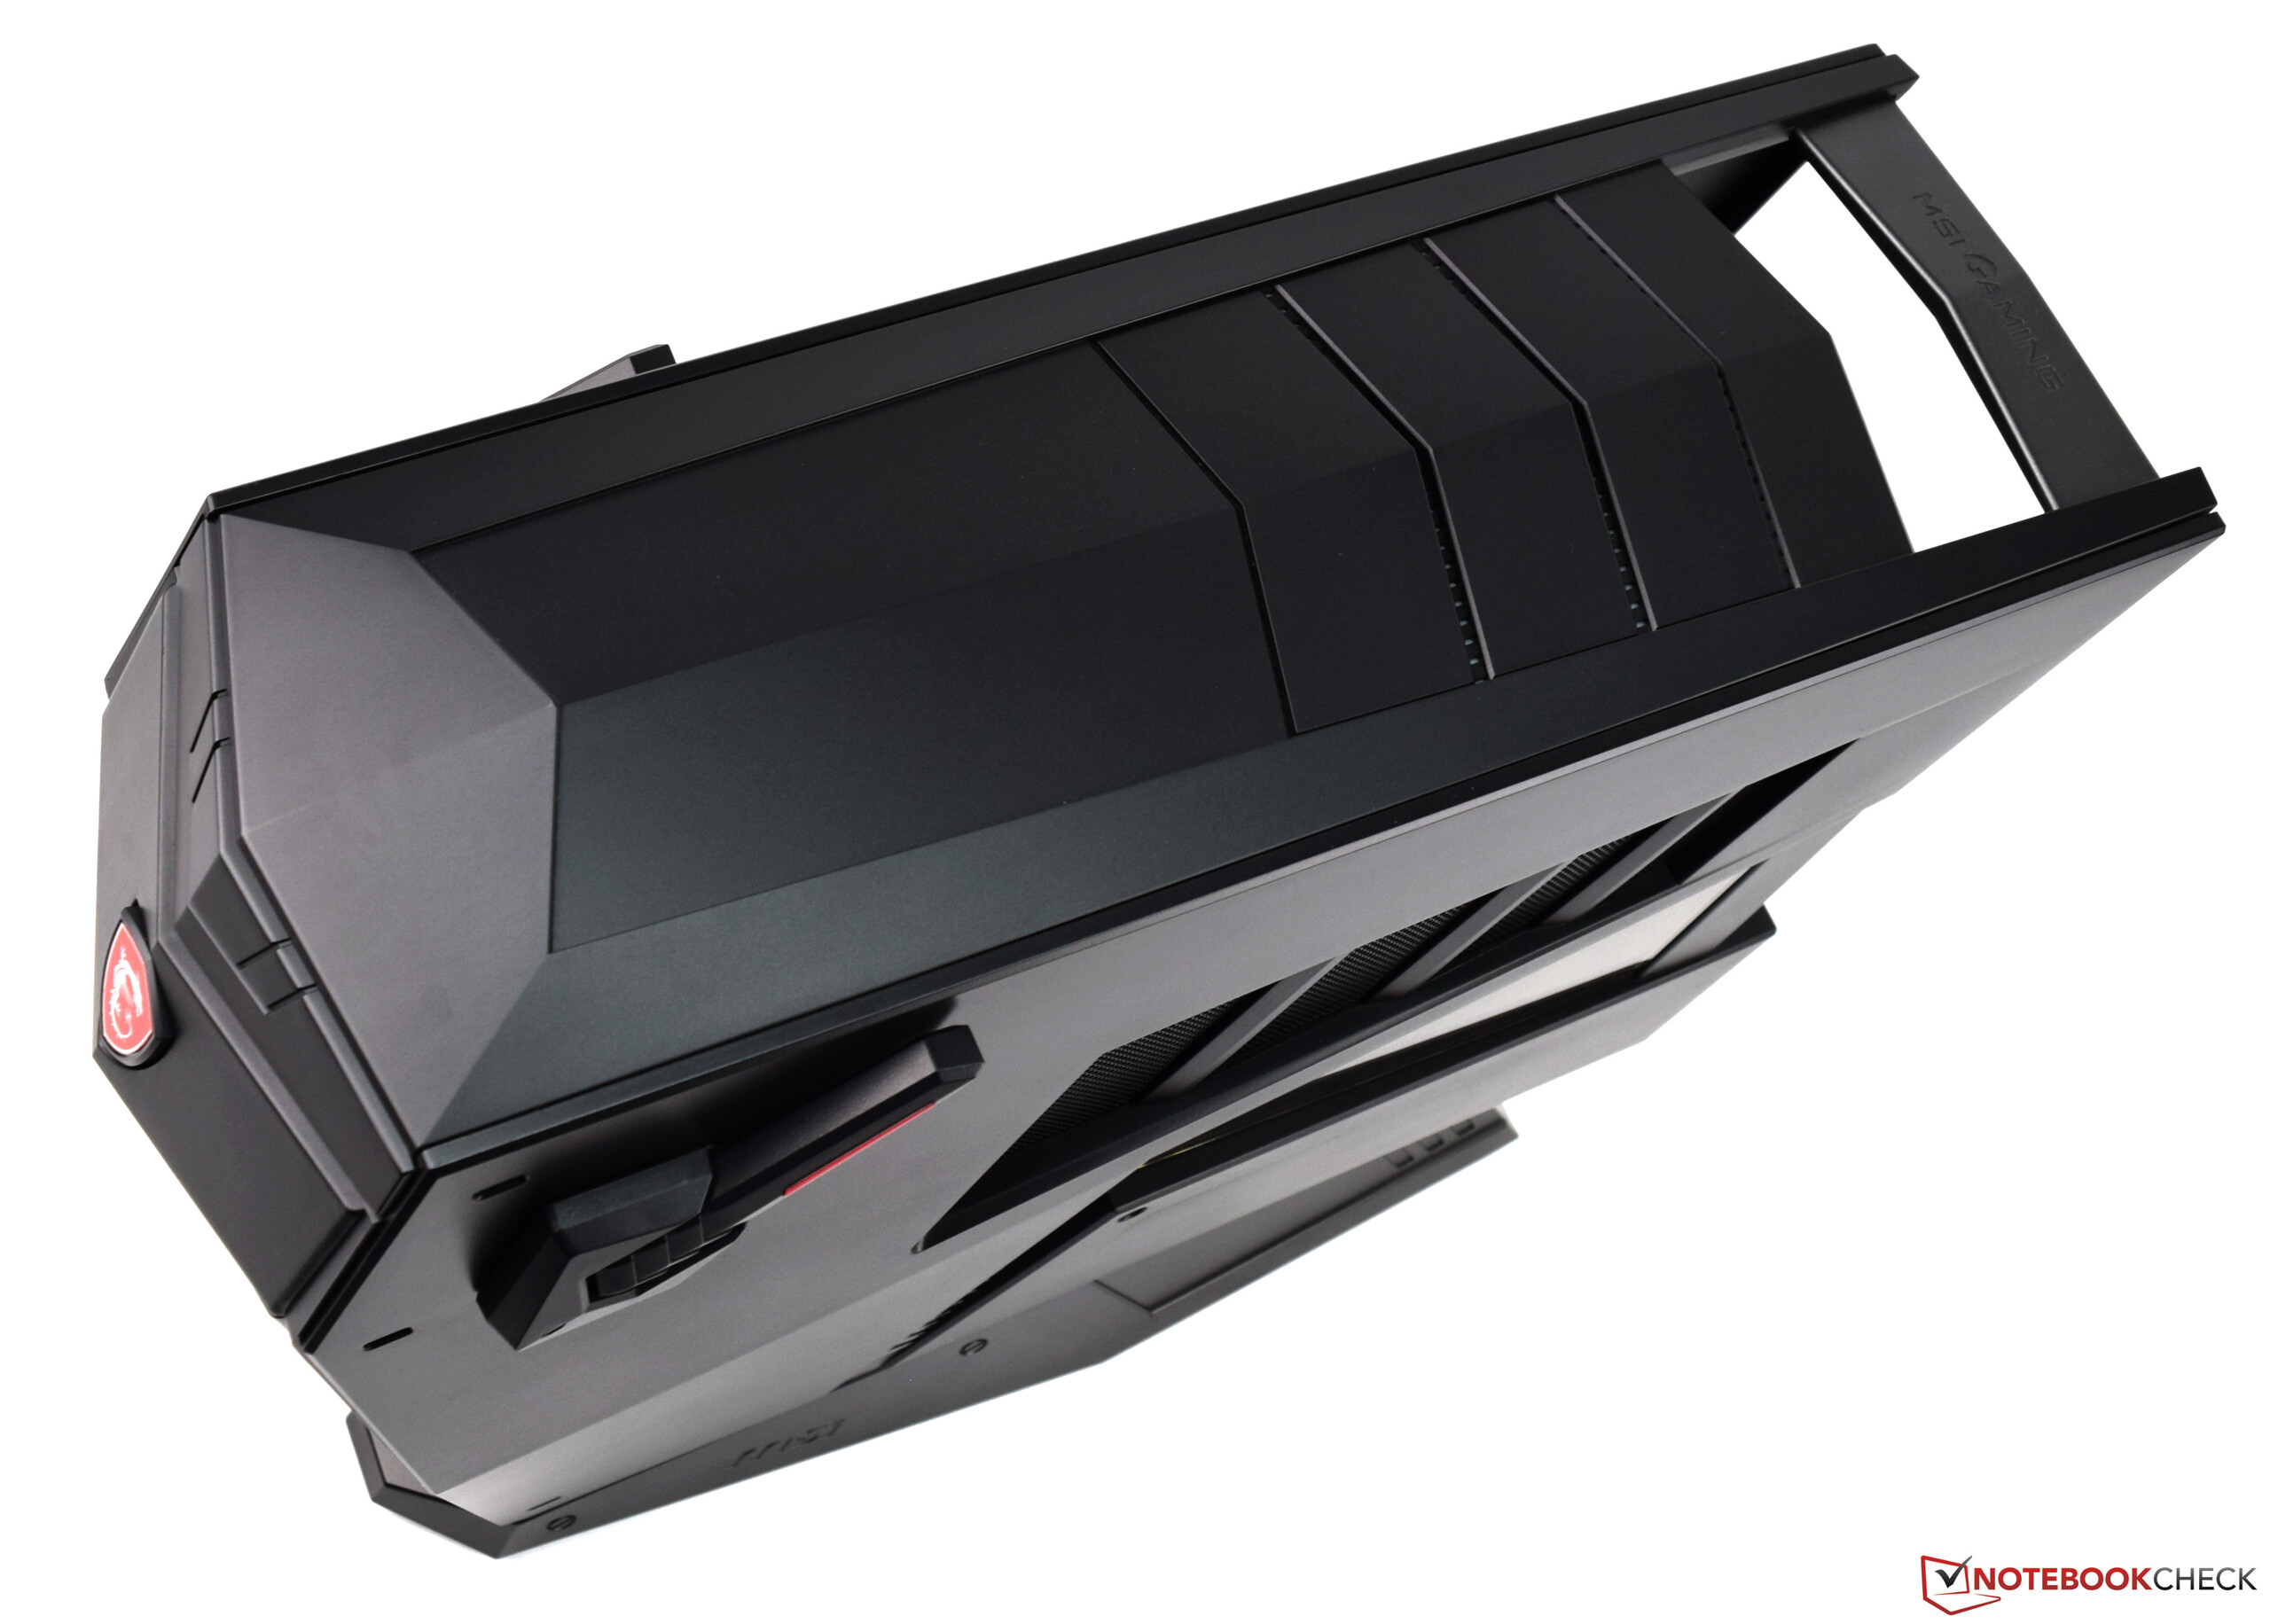
Case
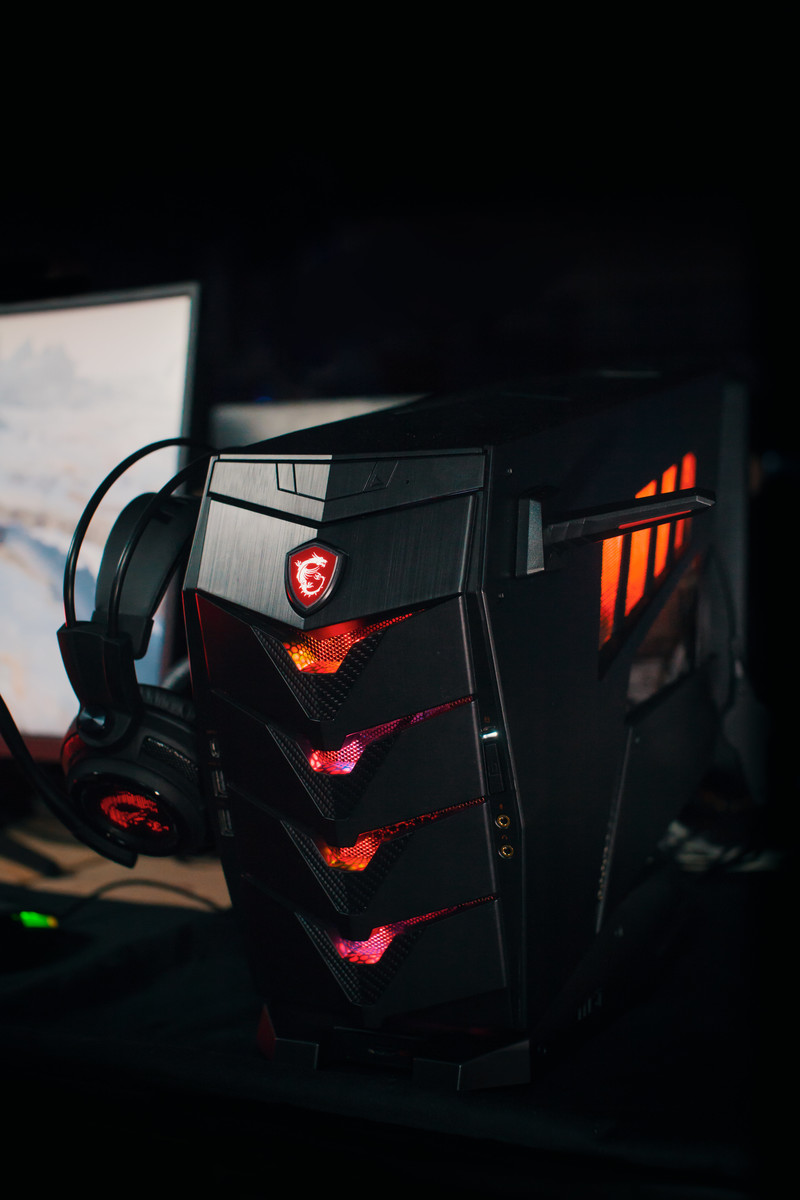
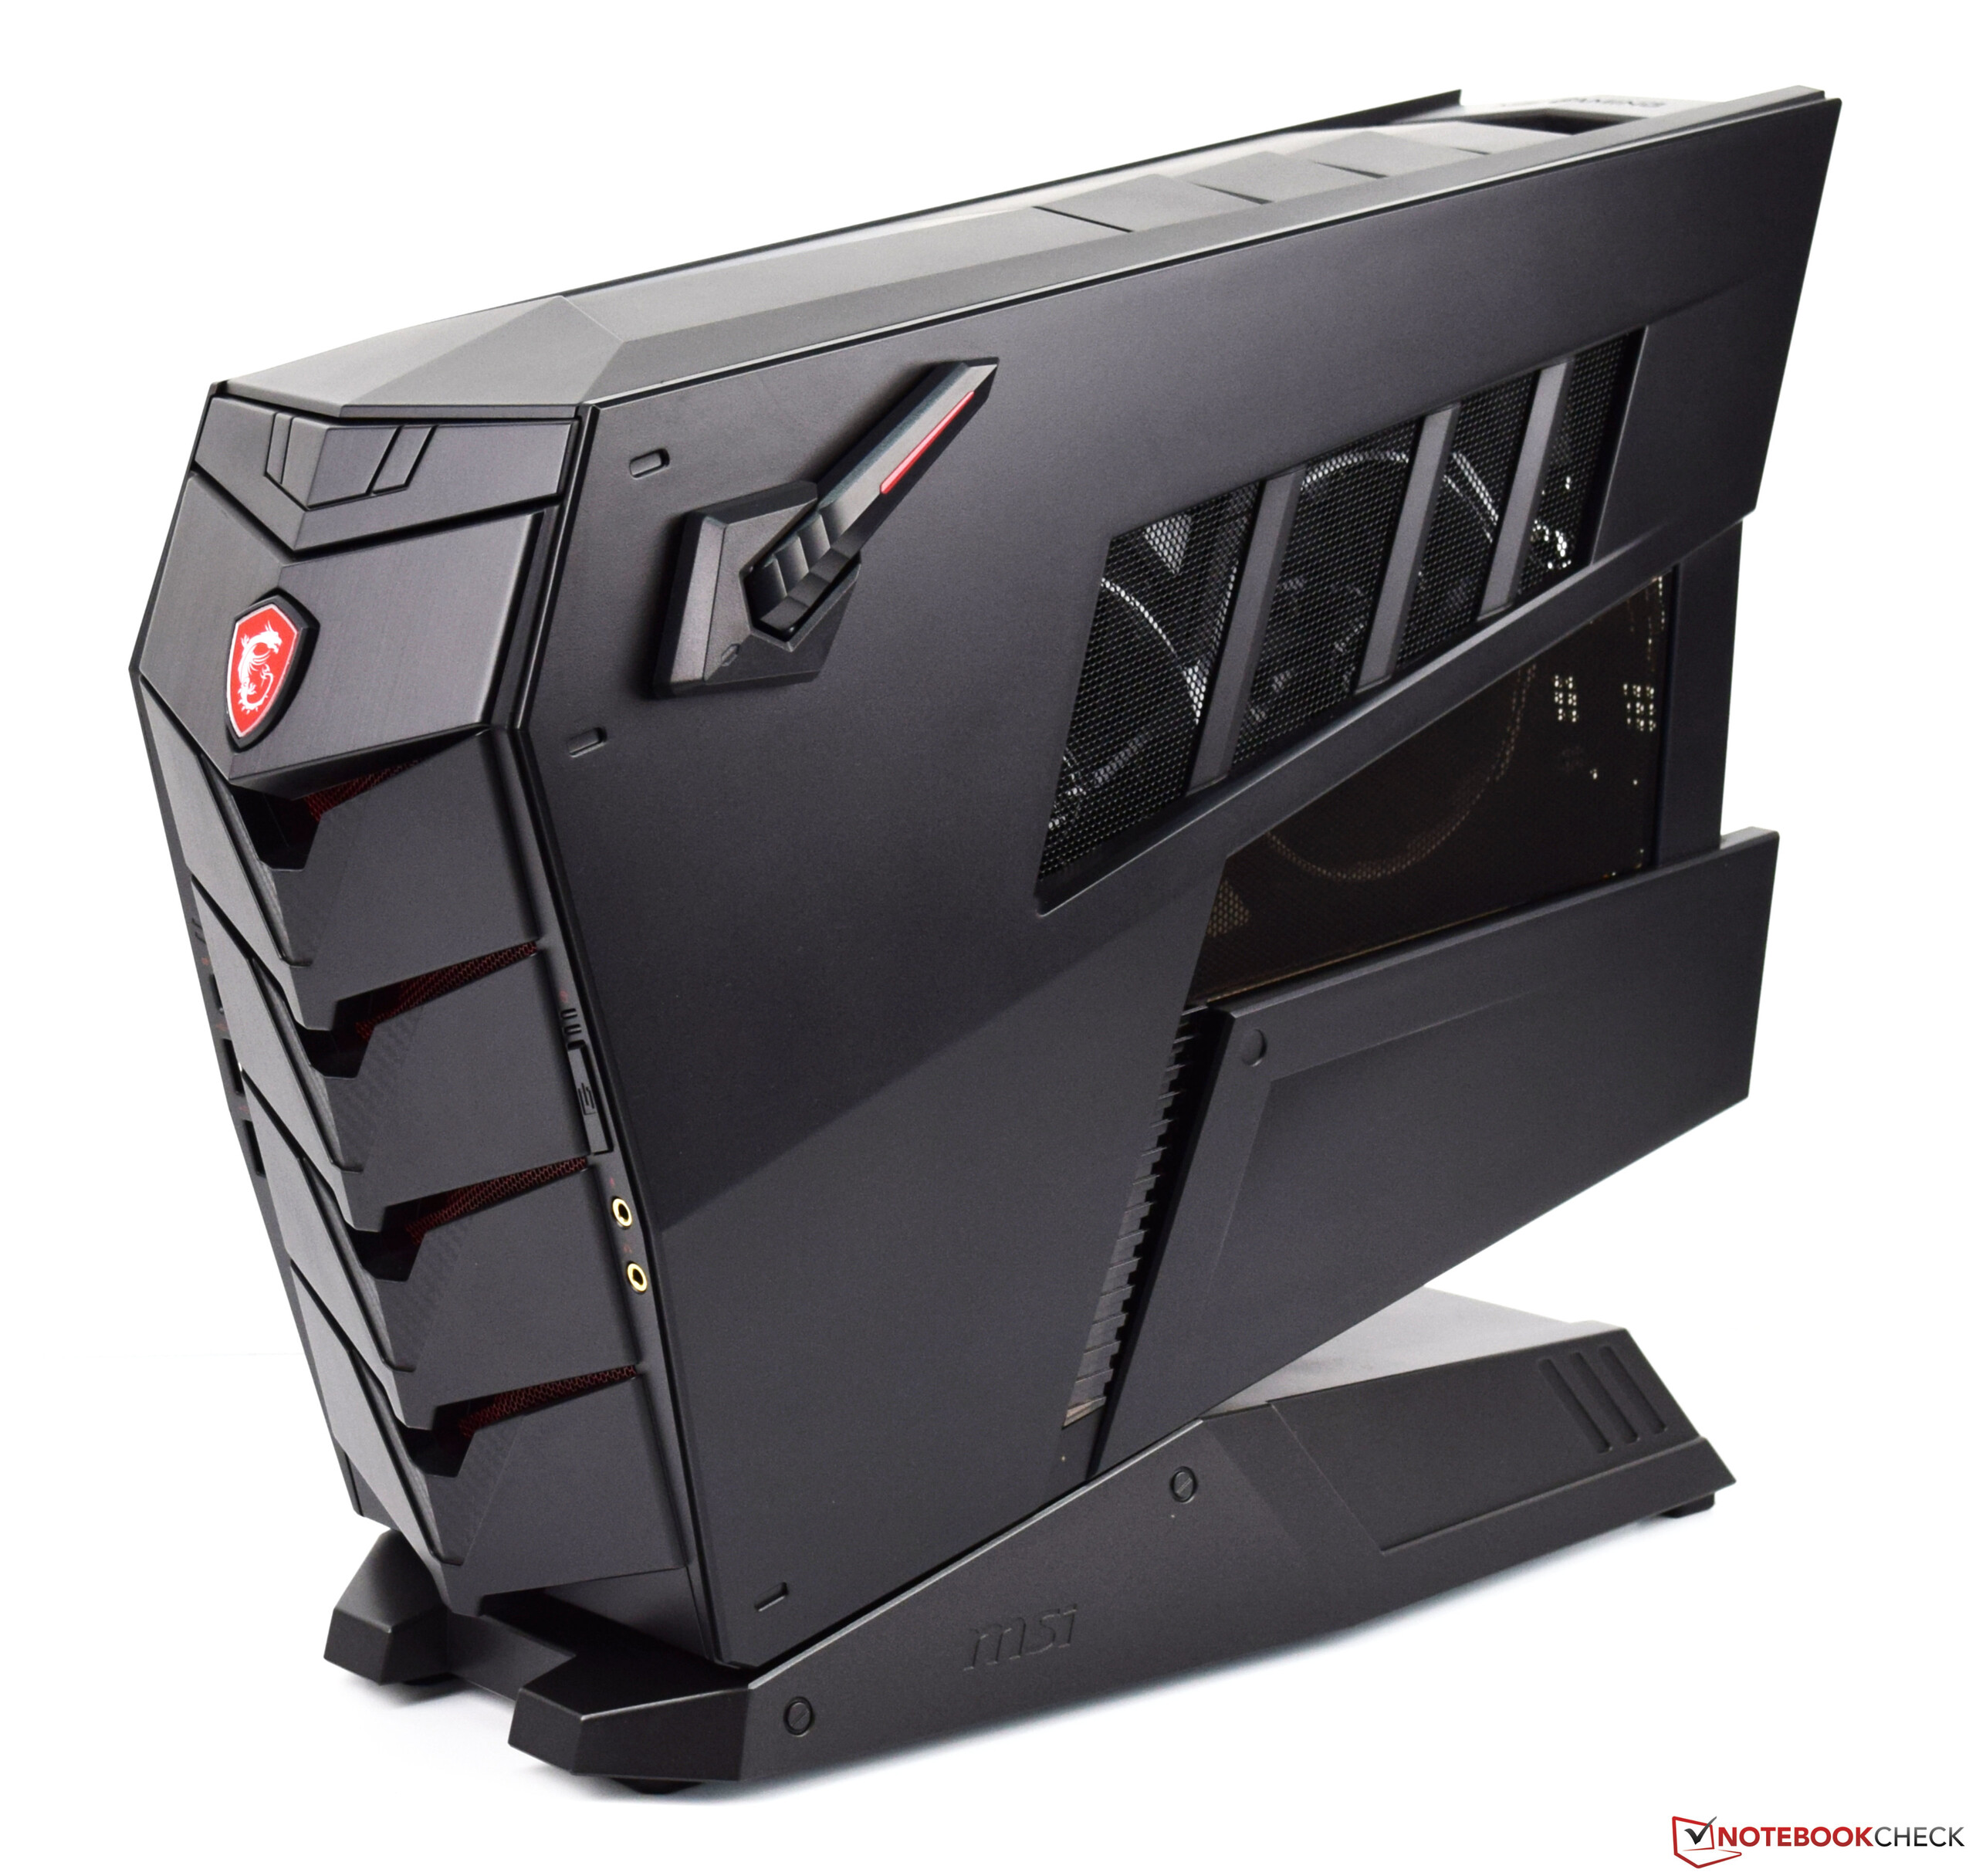
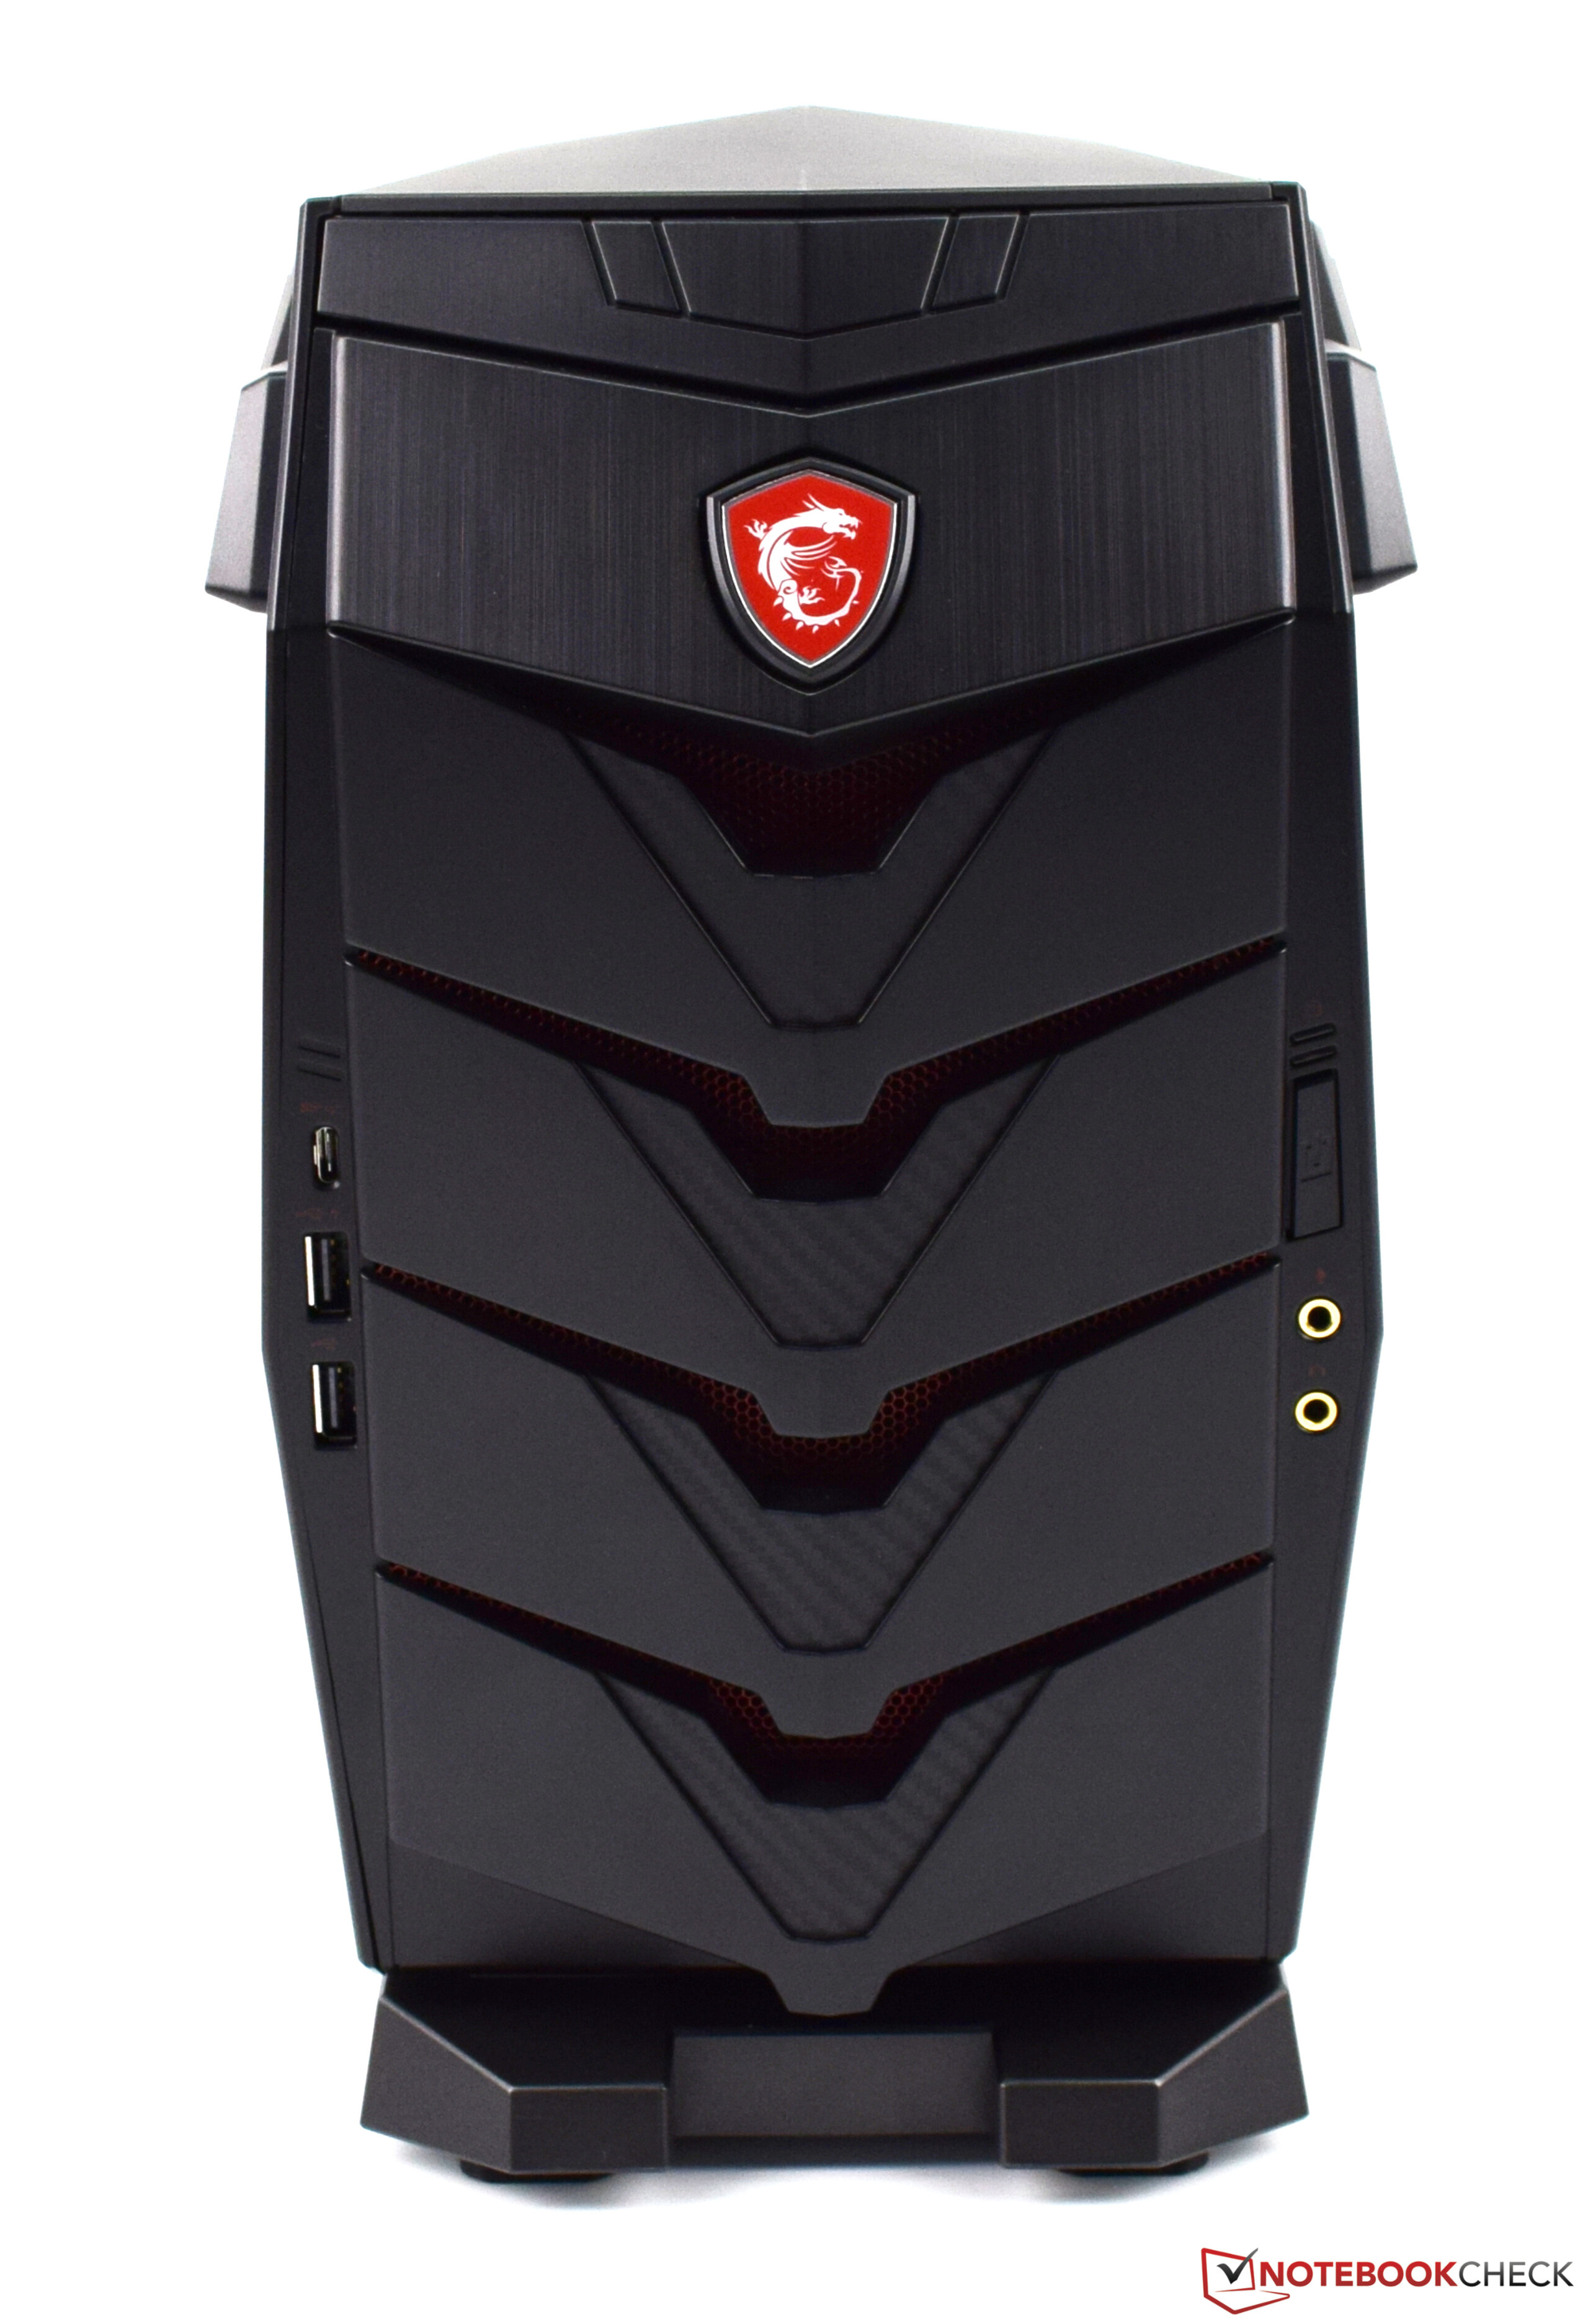
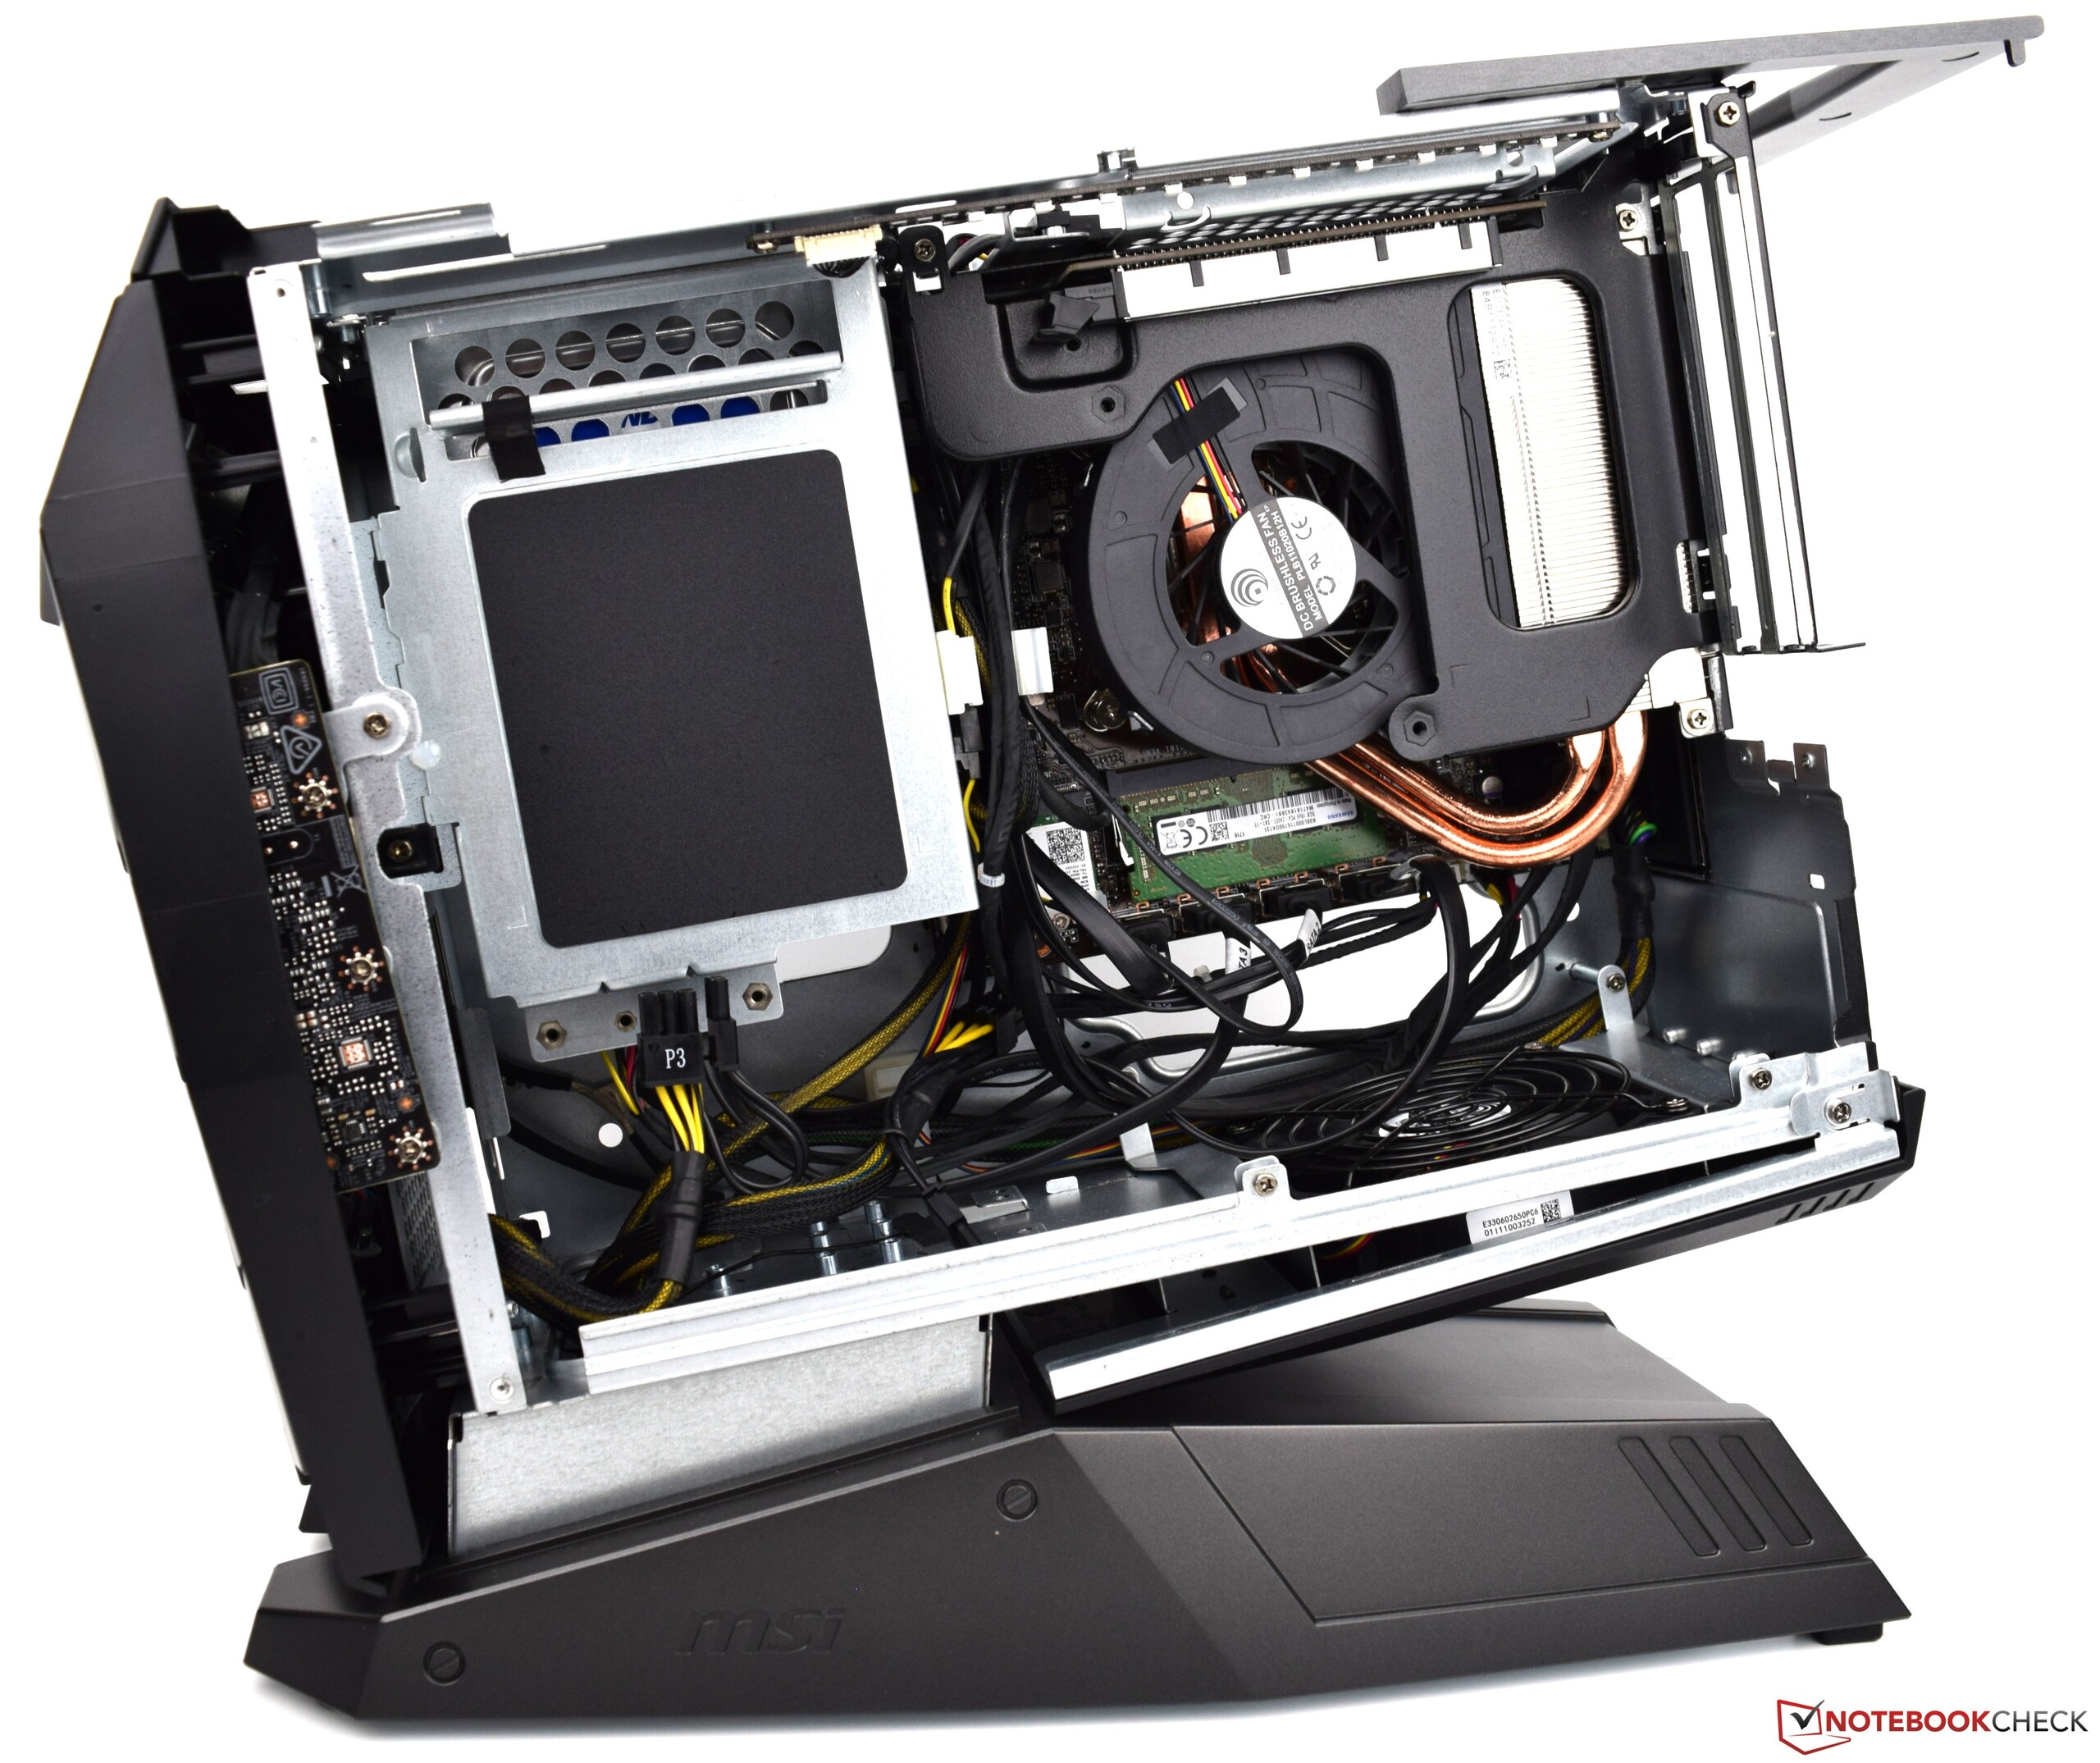
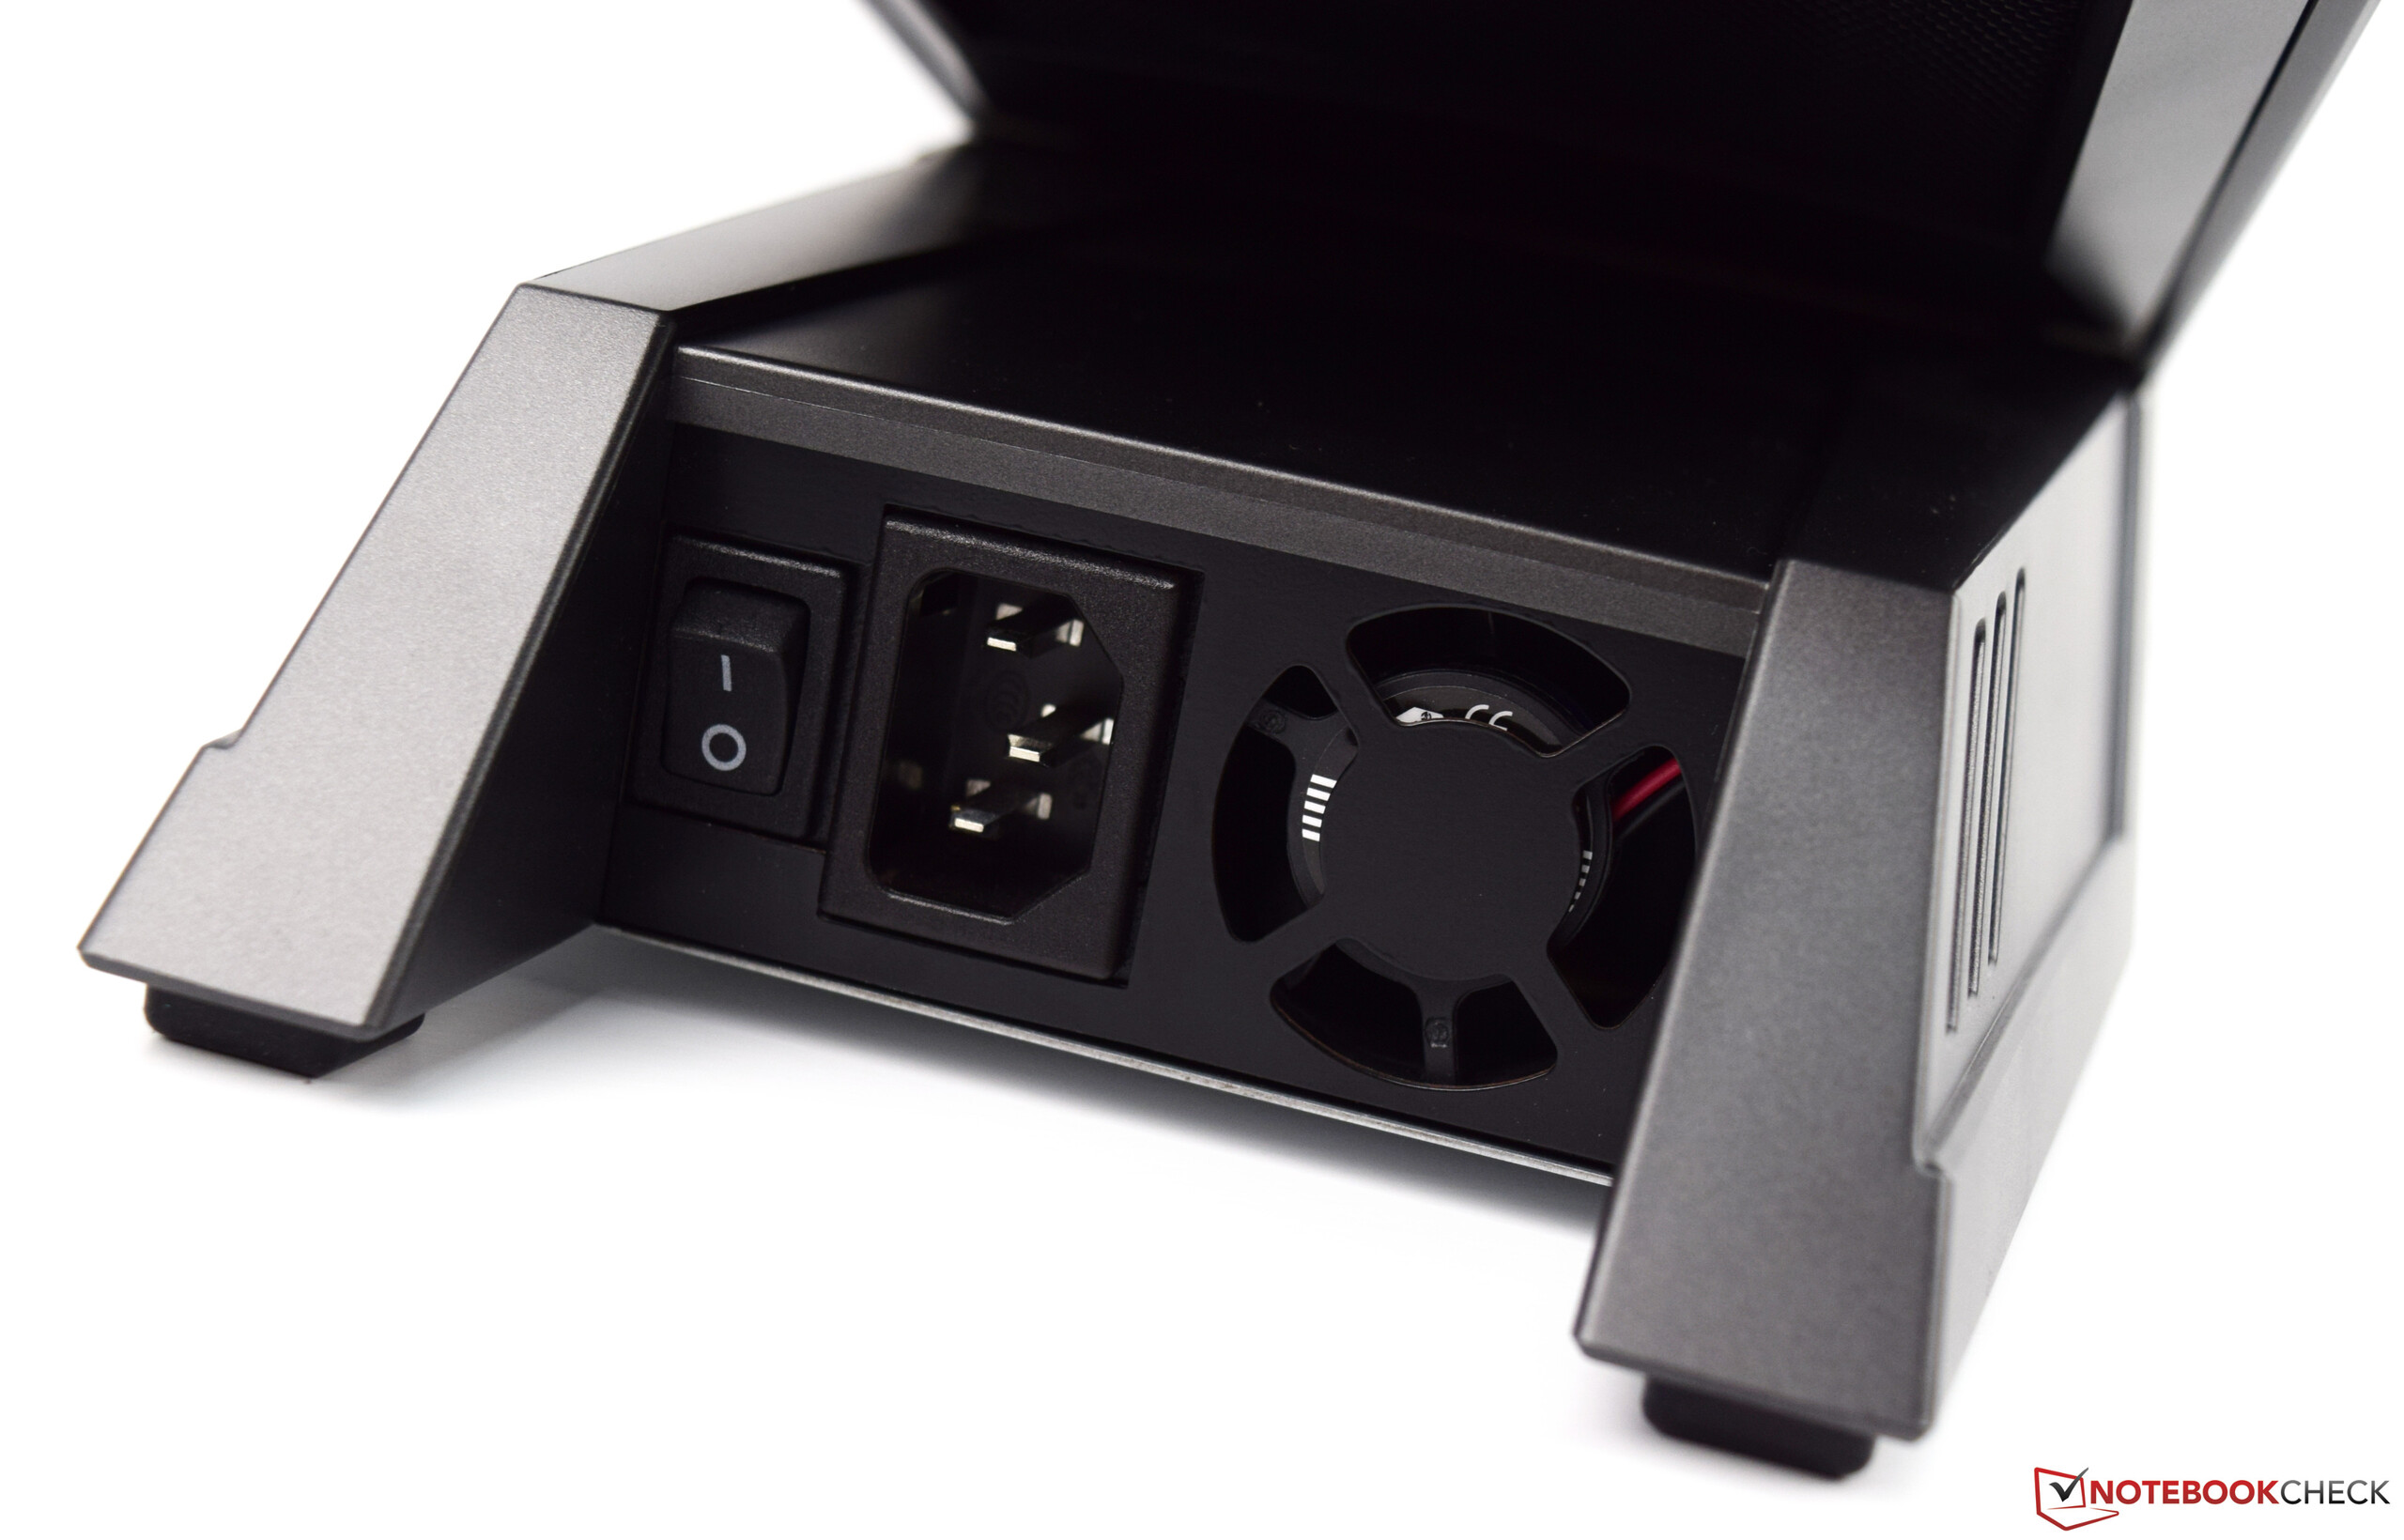
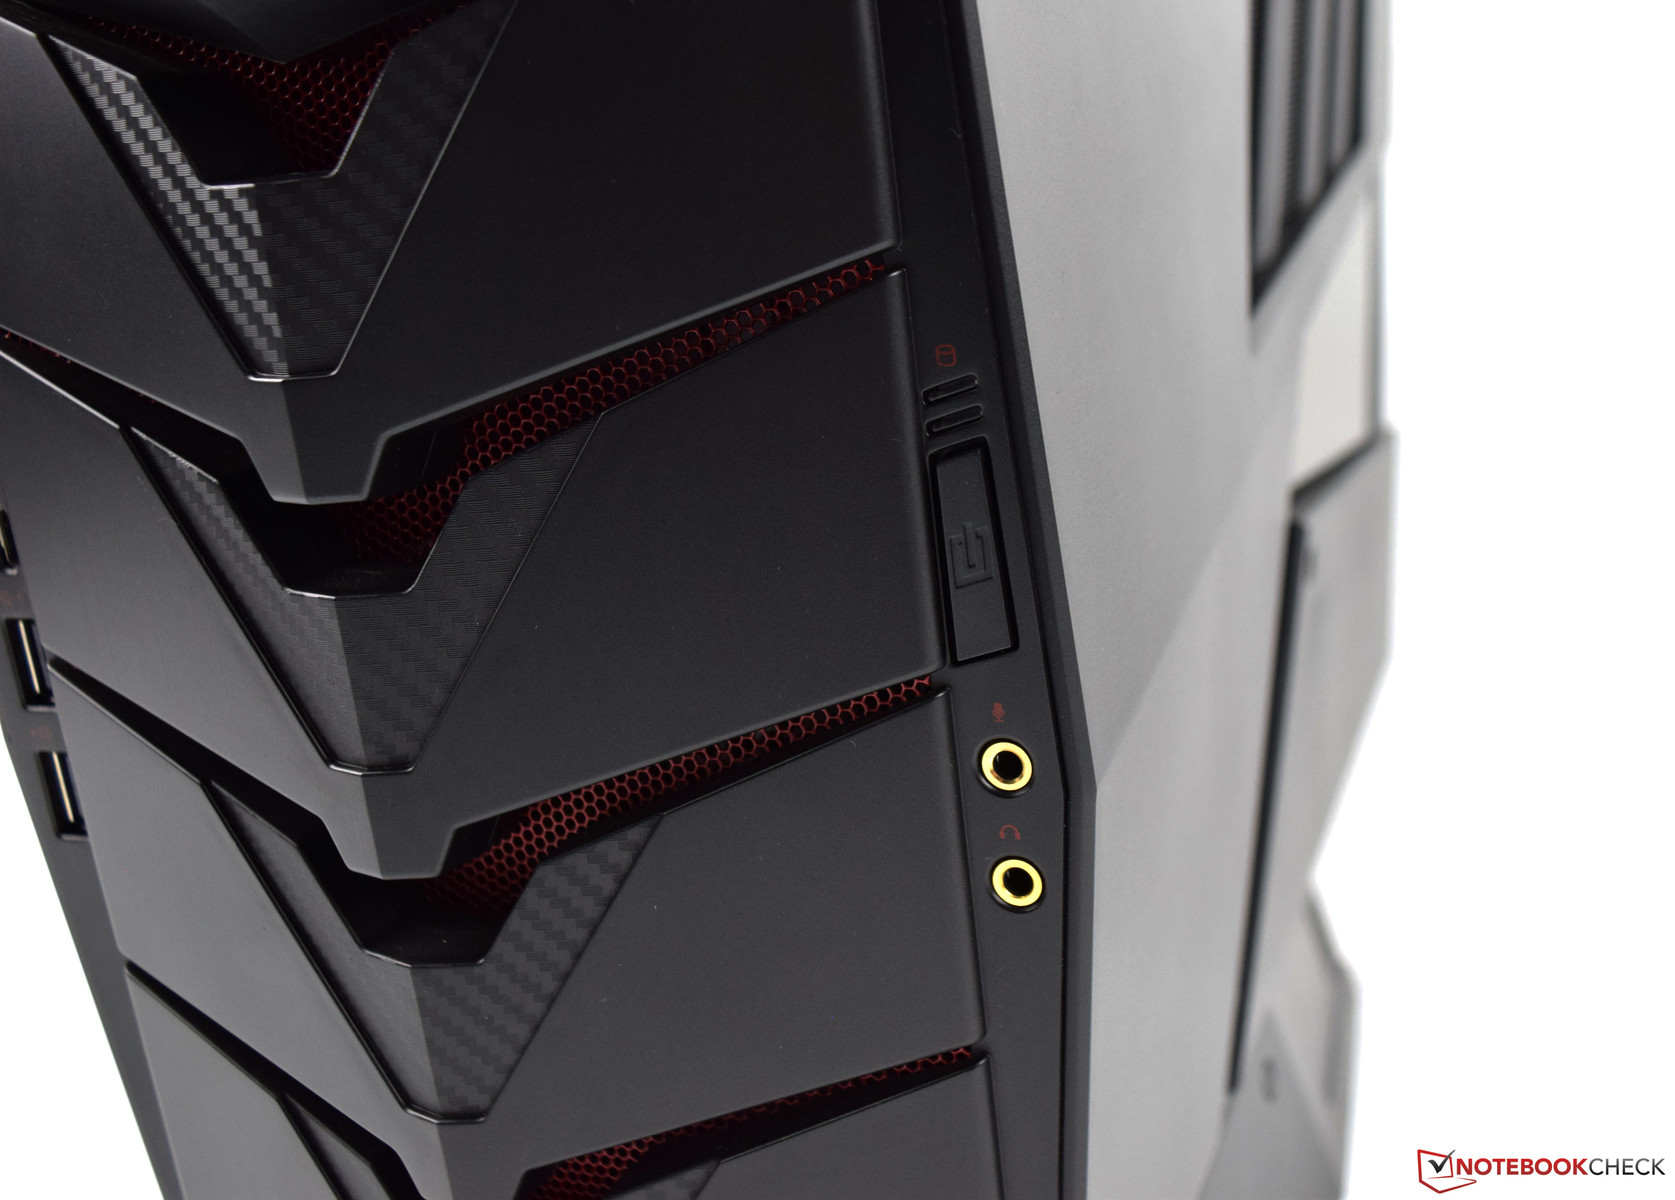
MSI has not equipped the Aegis 3 8RD with an off the shelf case. Its design is rather extravagant for our tastes though, particularly because of its aggressive angles and RGB lighting. Helpfully, MSI has placed the power supply at the bottom of the case, which helps make the machine feel stable and unlikely to fall over.
Metal and plastic dominate the materials used, with the former used for the internal frame, while all exterior panels are made from plastic. The lack of metal on the outside makes the Aegis 3 8RD look rather cheap to our eyes, an impression that is reinforced by the creaking sounds that emit from all corners and edges when we apply some pressure to the case with our hands. Overall, we would have wished that MSI had designed a more impressive outer case to match the machine’s premium price.
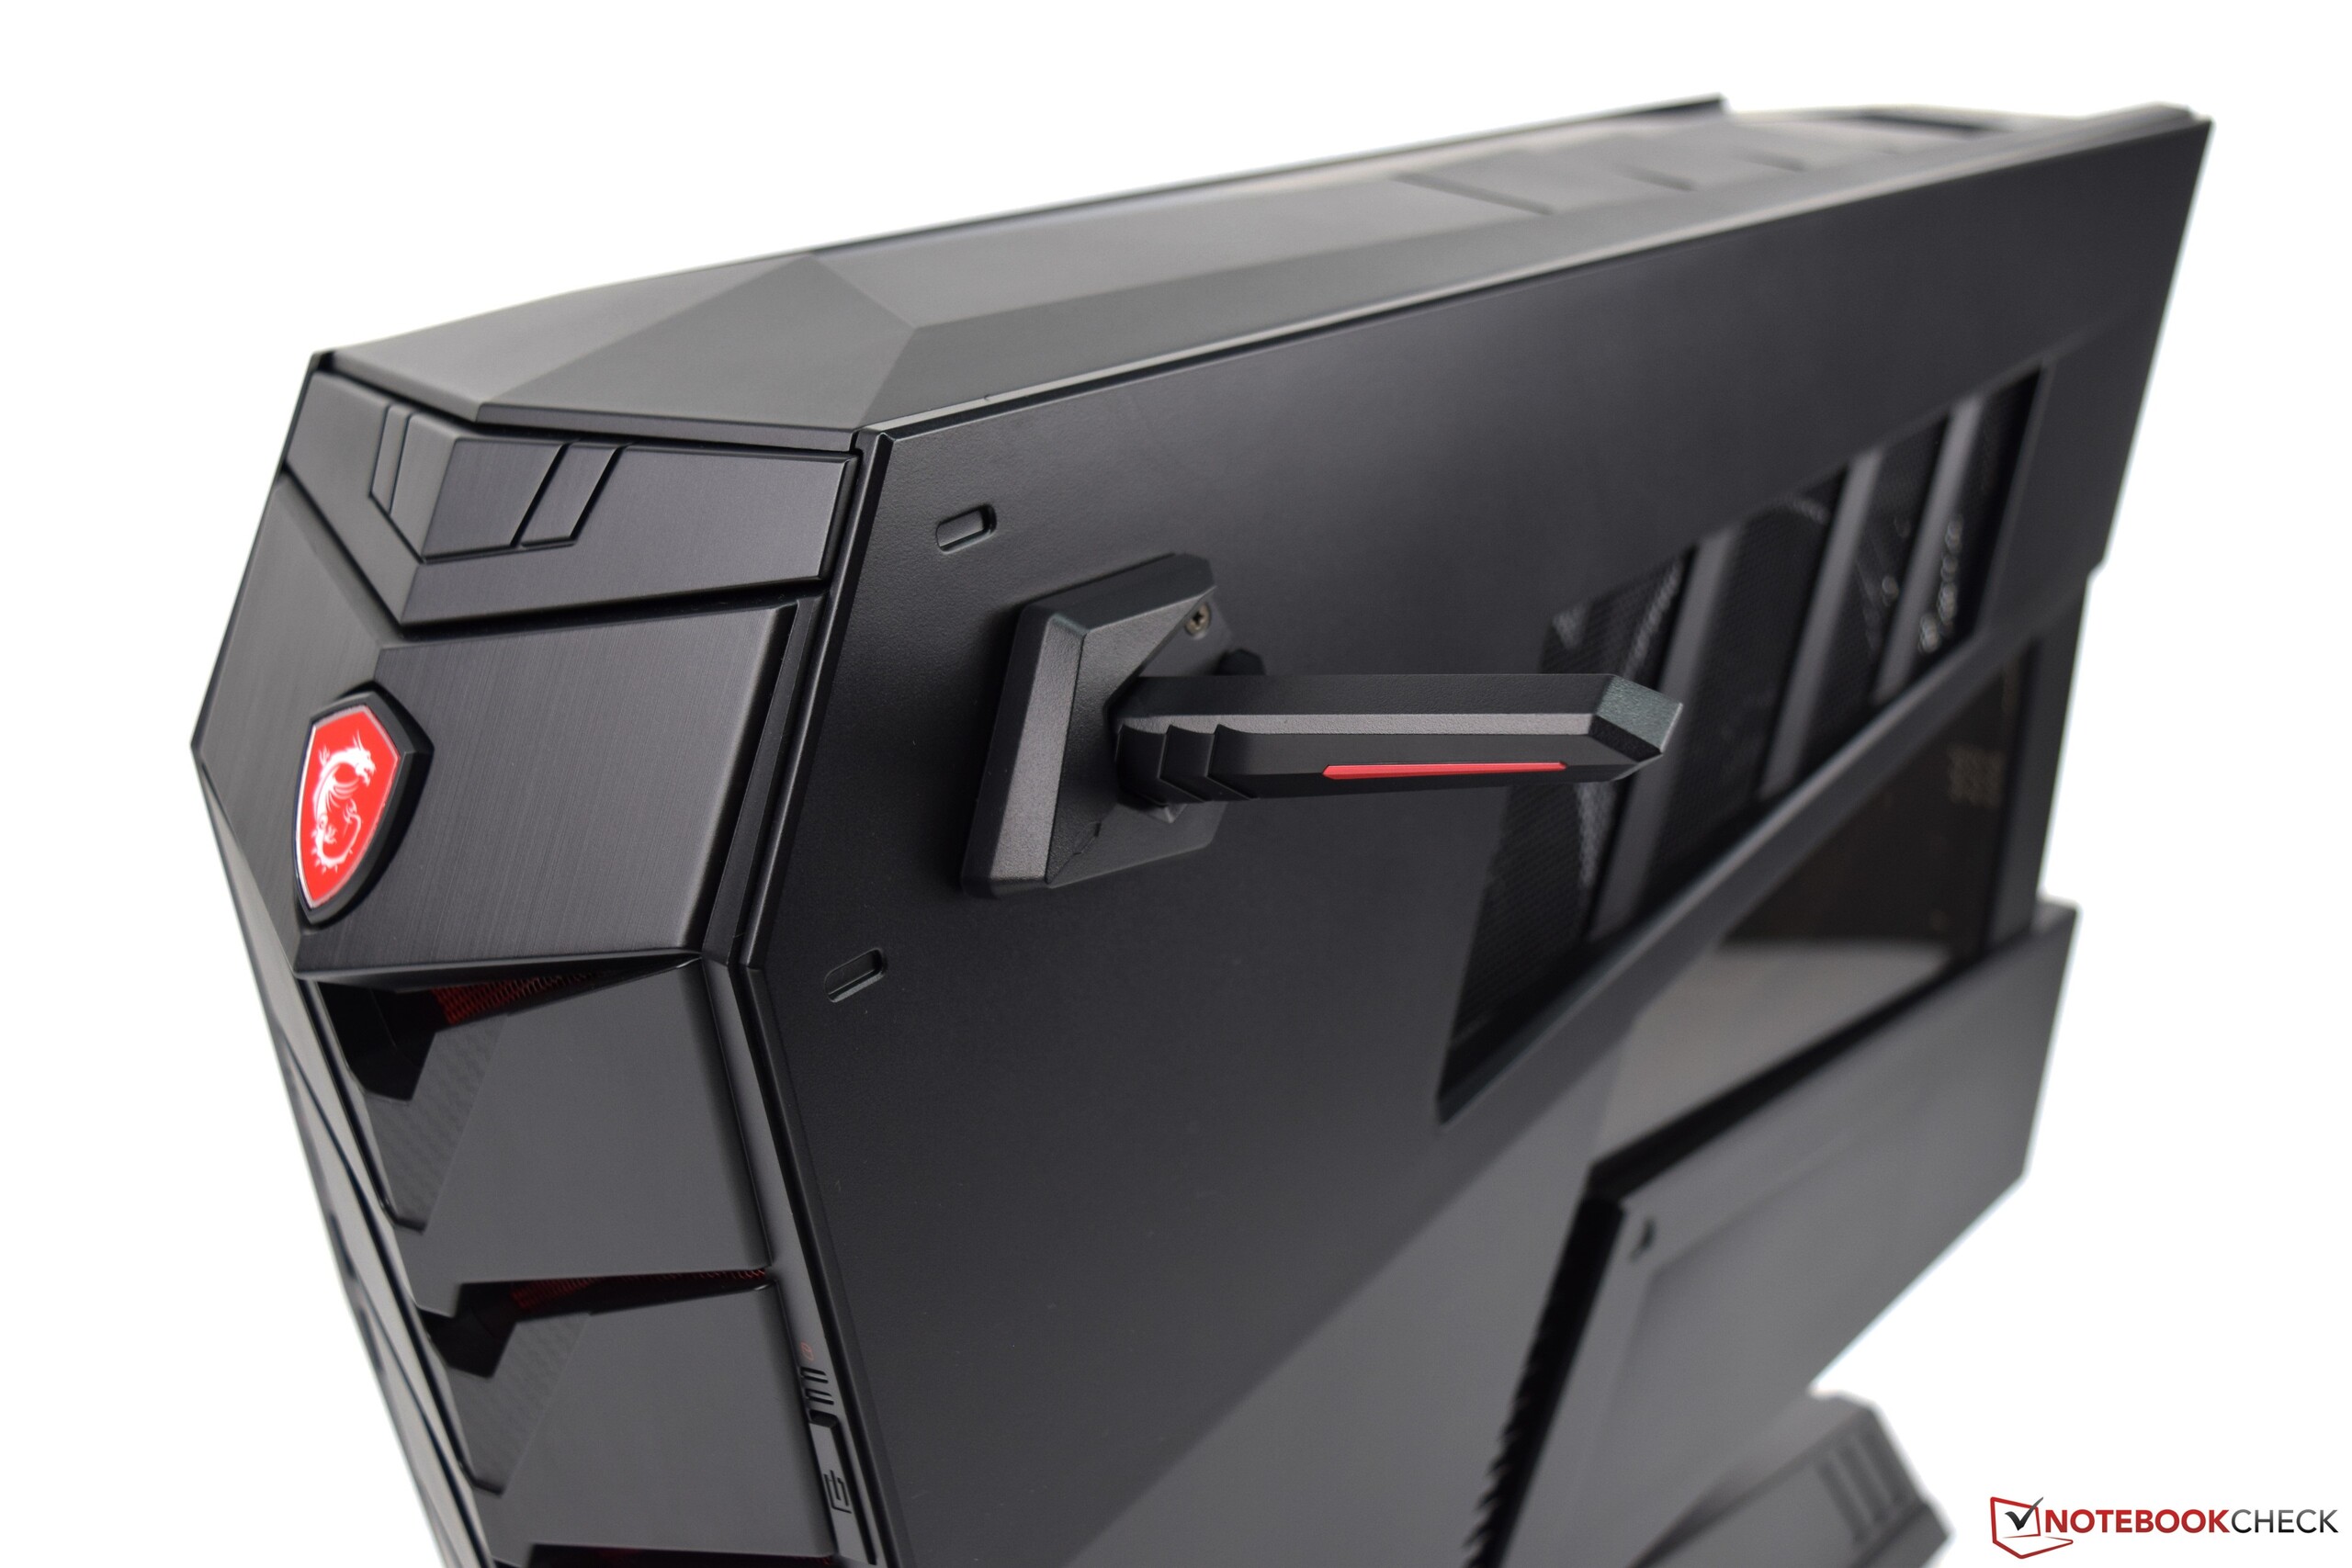
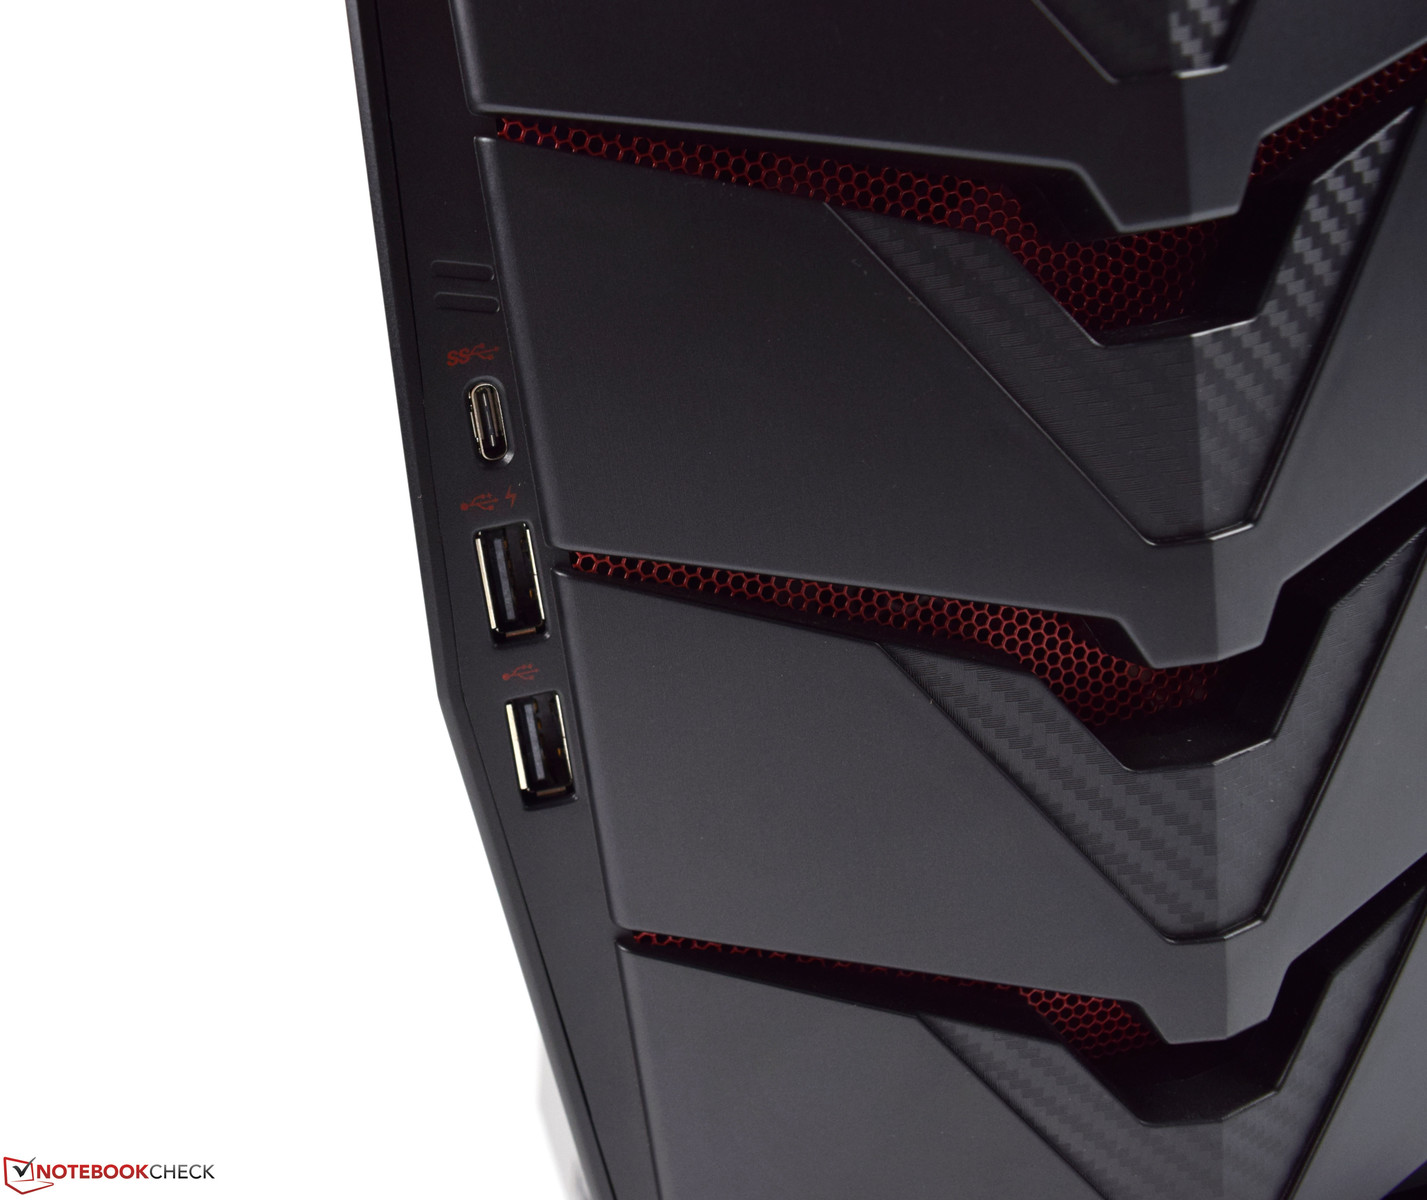
Looks are a matter of taste though, but those who like RGB lighting should like the Aegis 3 8RD, which has it in abundance. MSI has included a carrying handle too, which makes it easier to reposition or move the machine should you need to. There are also fold-out handles from which to hang headsets and a window on the right-hand side of the device that gives a glimpse of some of the components that are housed underneath the Aegis 3 8RD’s aggressive exterior. There is plenty of ventilation to cool the graphics card with fresh air too. Dispensing with the window would have given the machine a cleaner look though, in our opinion.
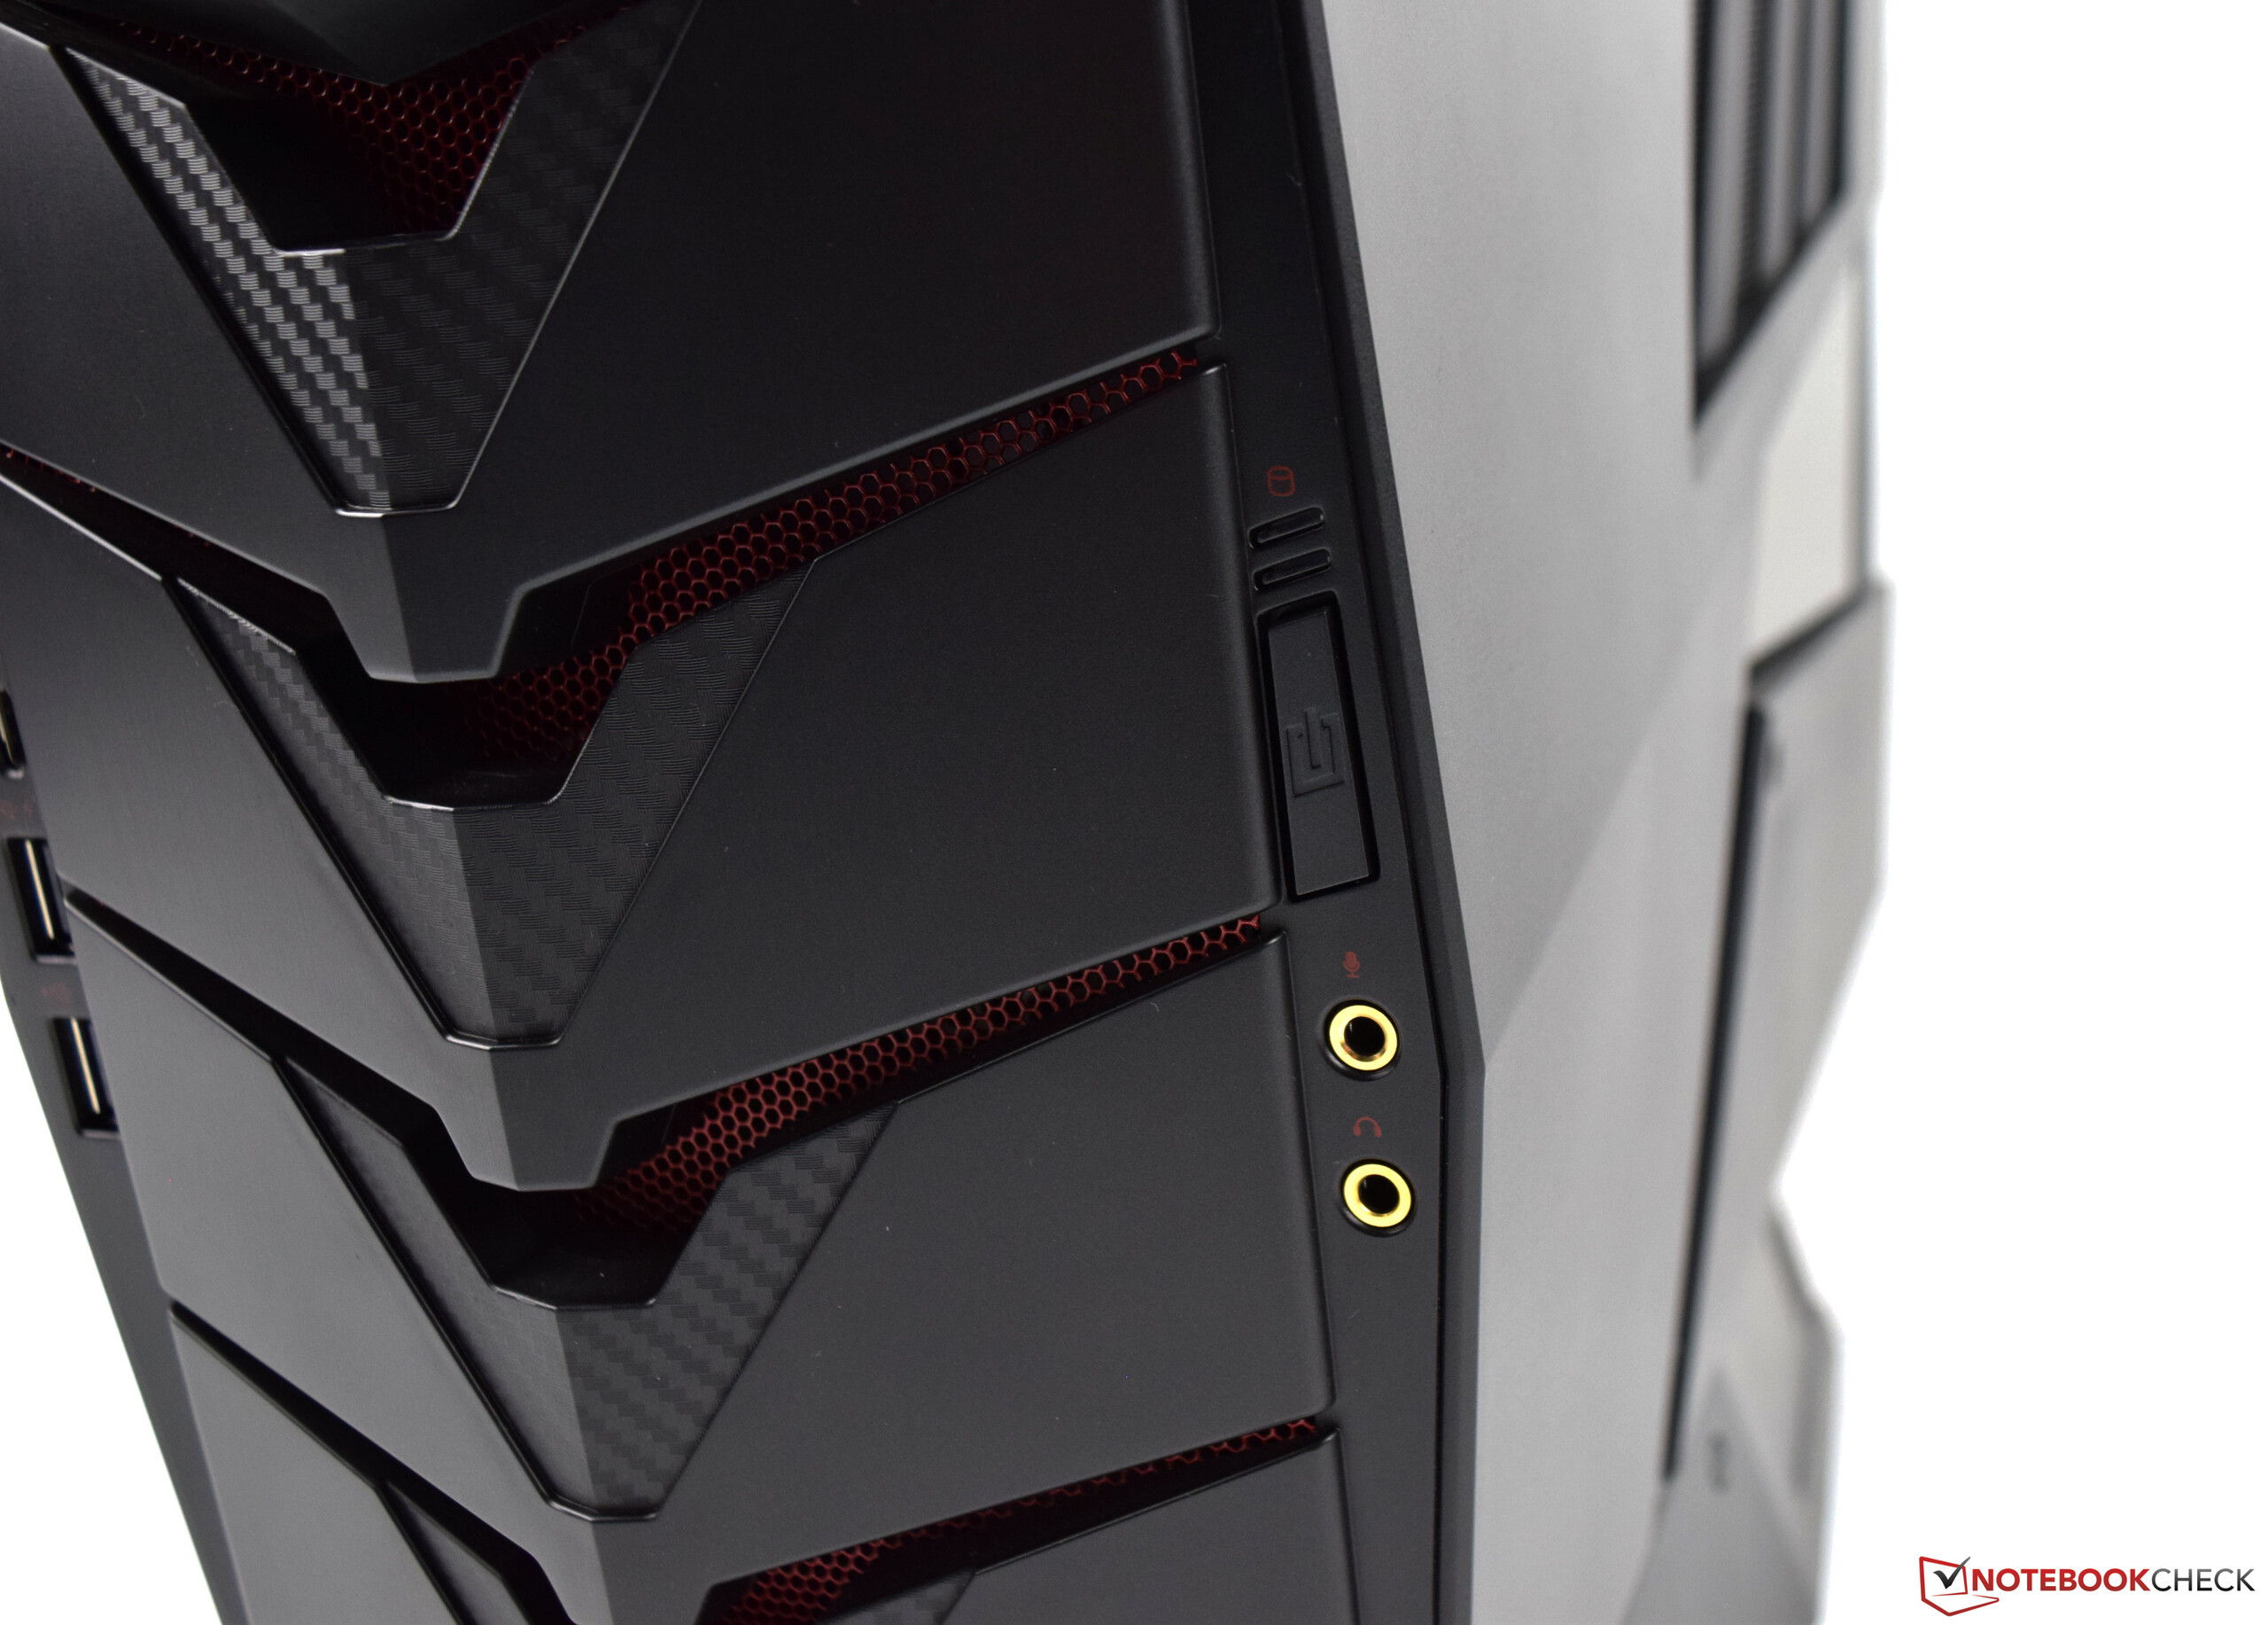
Connectivity
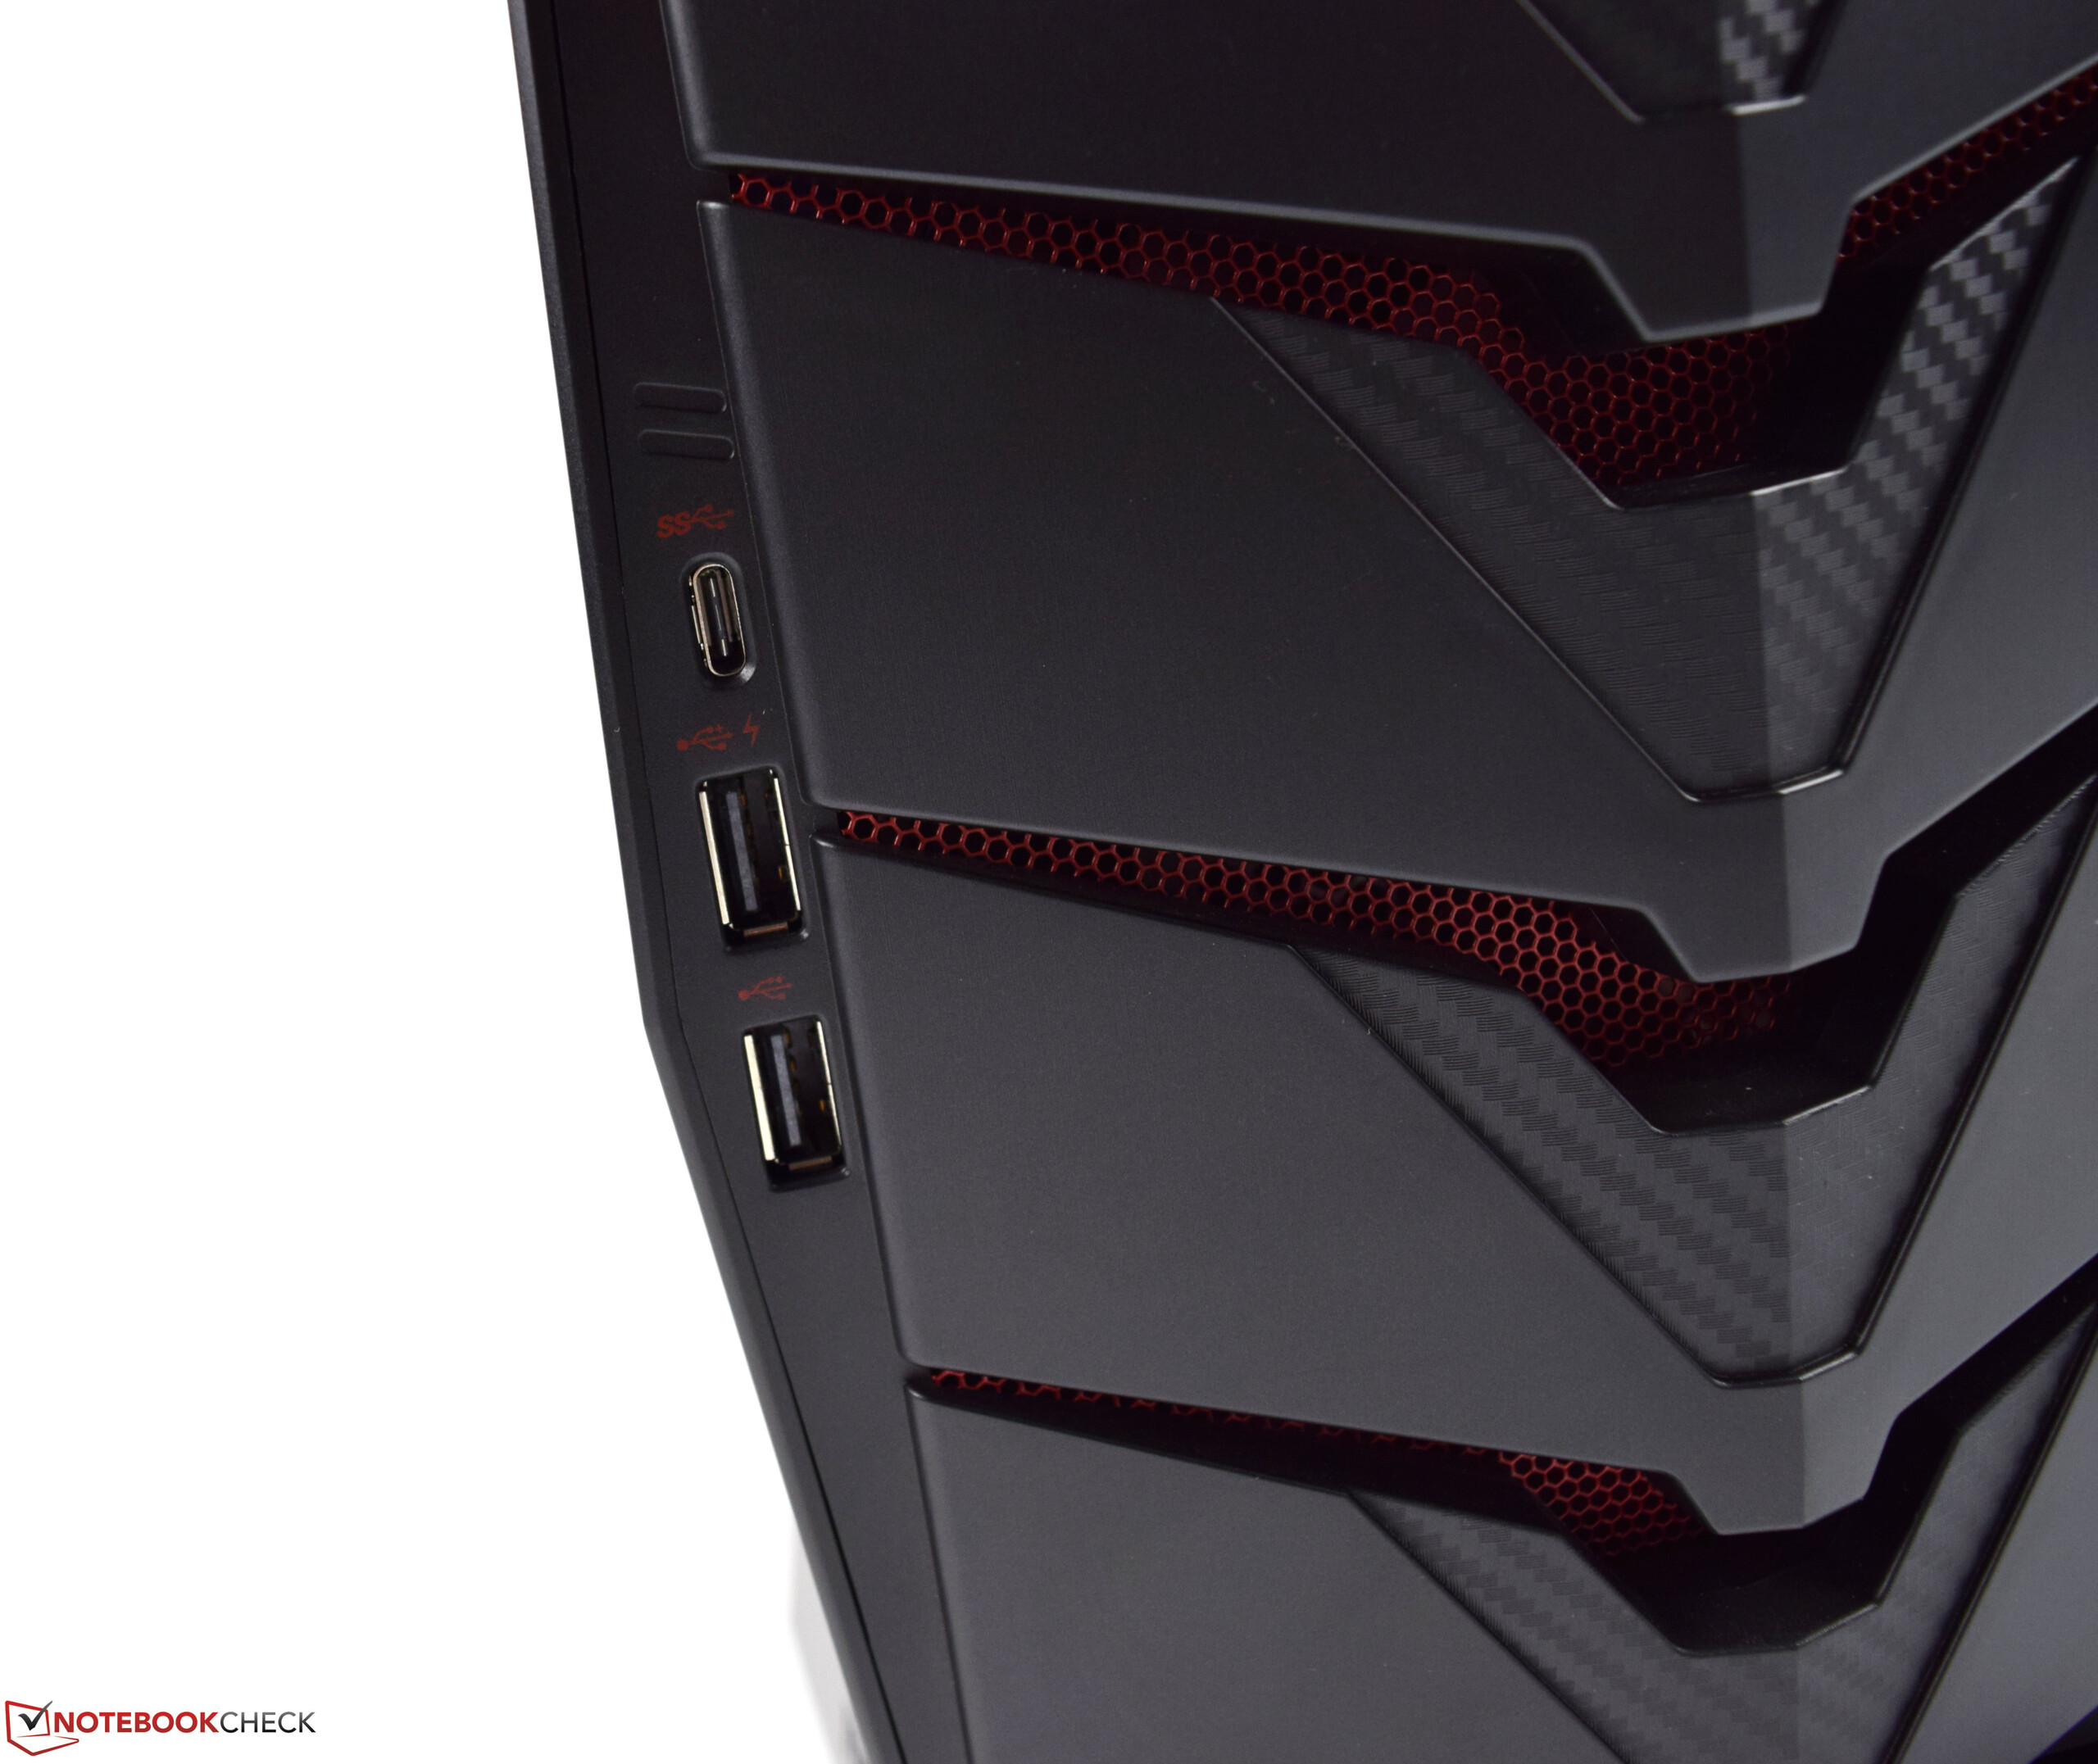
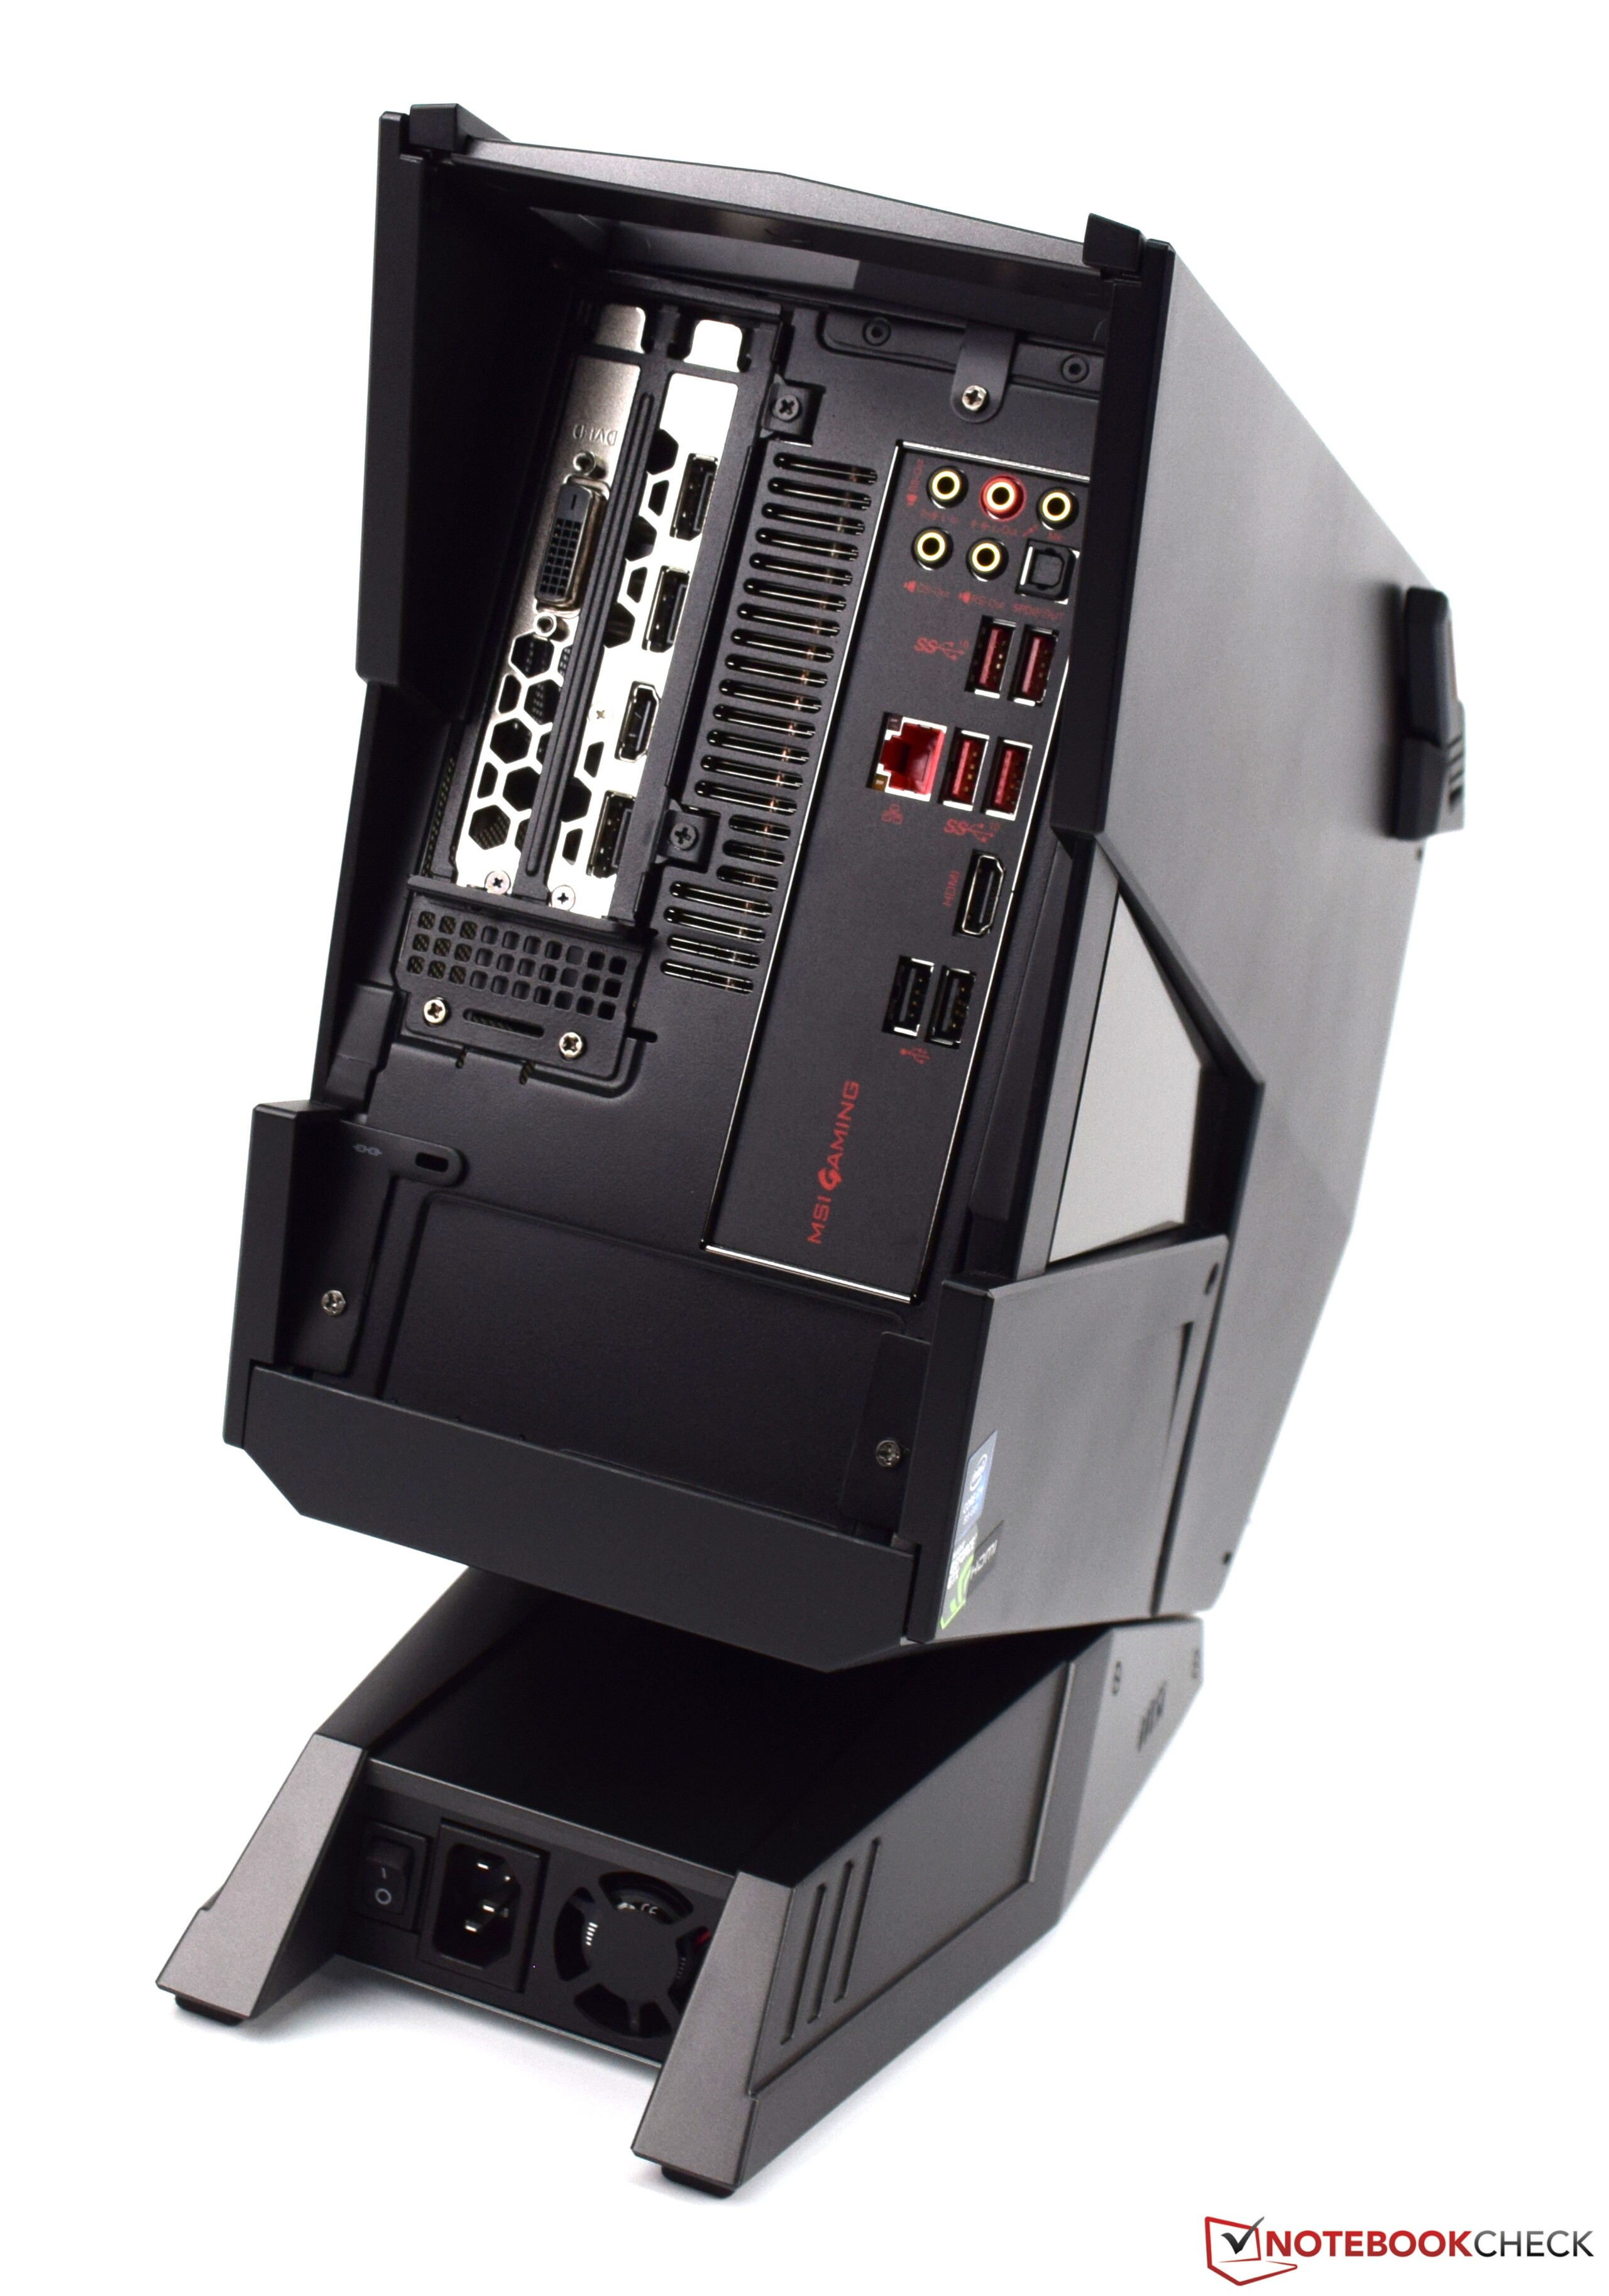
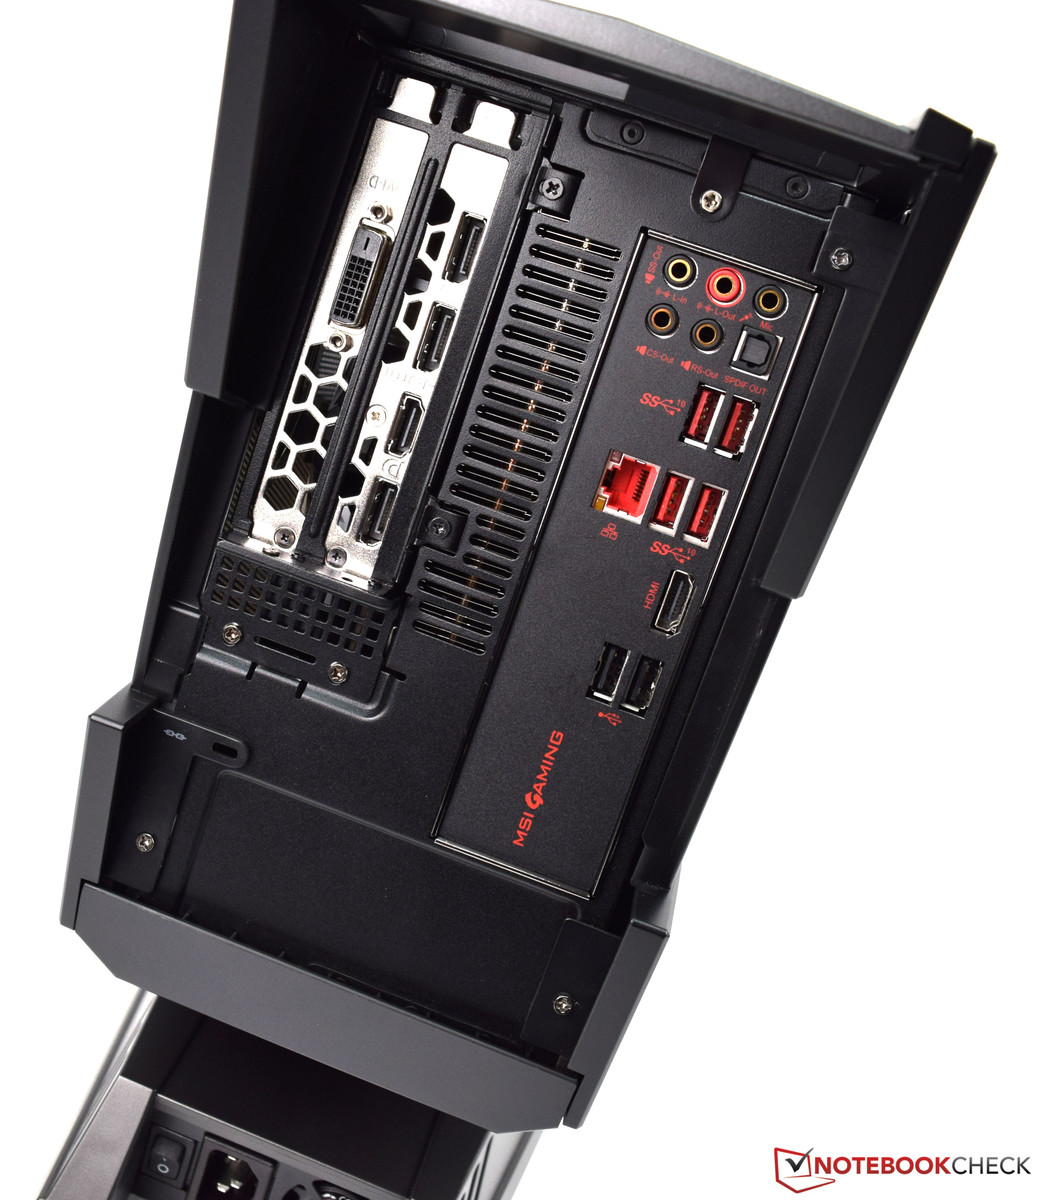
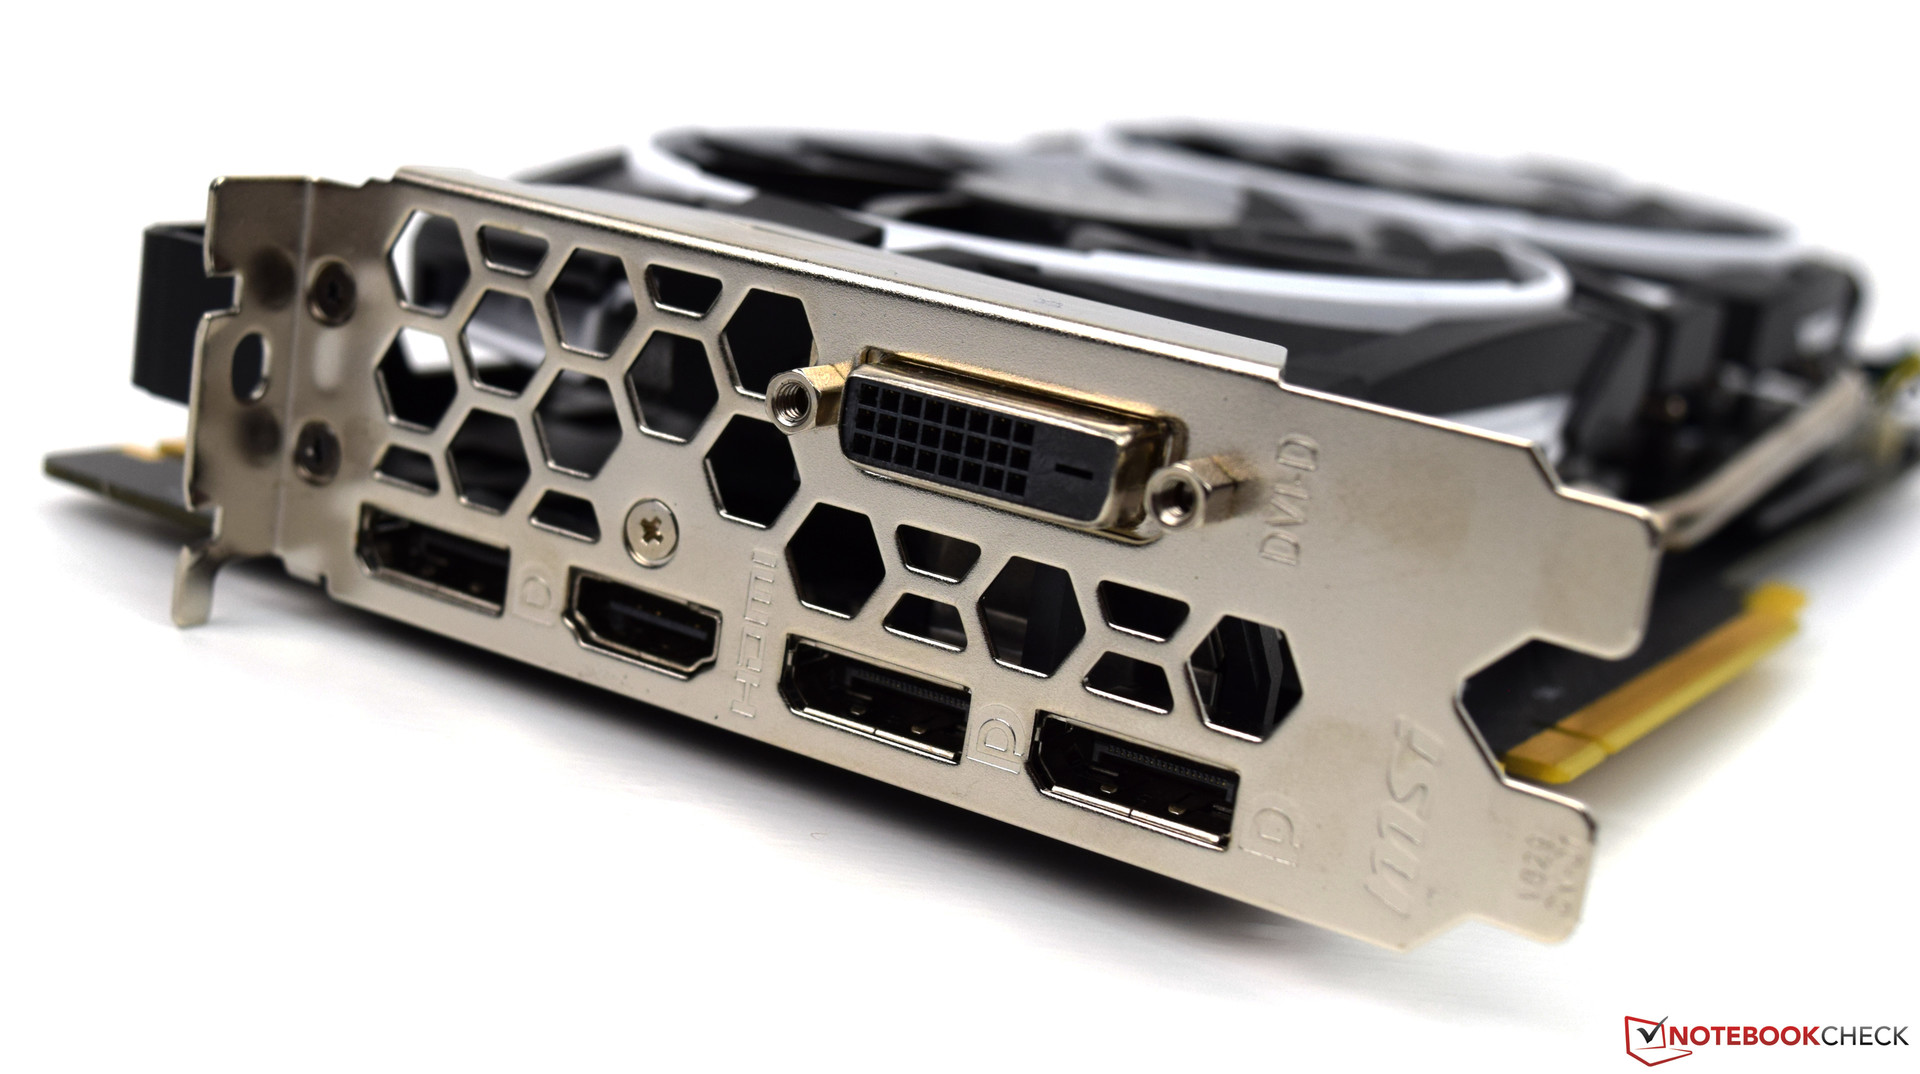
The Aegis 3 8RD has a solid selection of ports despite its compact size. There is a total of nine USB ports to which numerous peripherals could be connected including a USB 3.1 Gen1 Type-C port on the front of the device, which should future-proof it somewhat. The Intel Core i7-8700 processor has an integrated GPU too, so you could run an external monitor on the integrated graphics should you need to. However, we expect that most people will make use of the three DisplayPort 1.4 ports, the single HDMI 2.0 port or the DVI-D port that the GeForce GTX 1070 GPU offers. The Aegis 3 8RD supports up to three monitors simultaneously too.
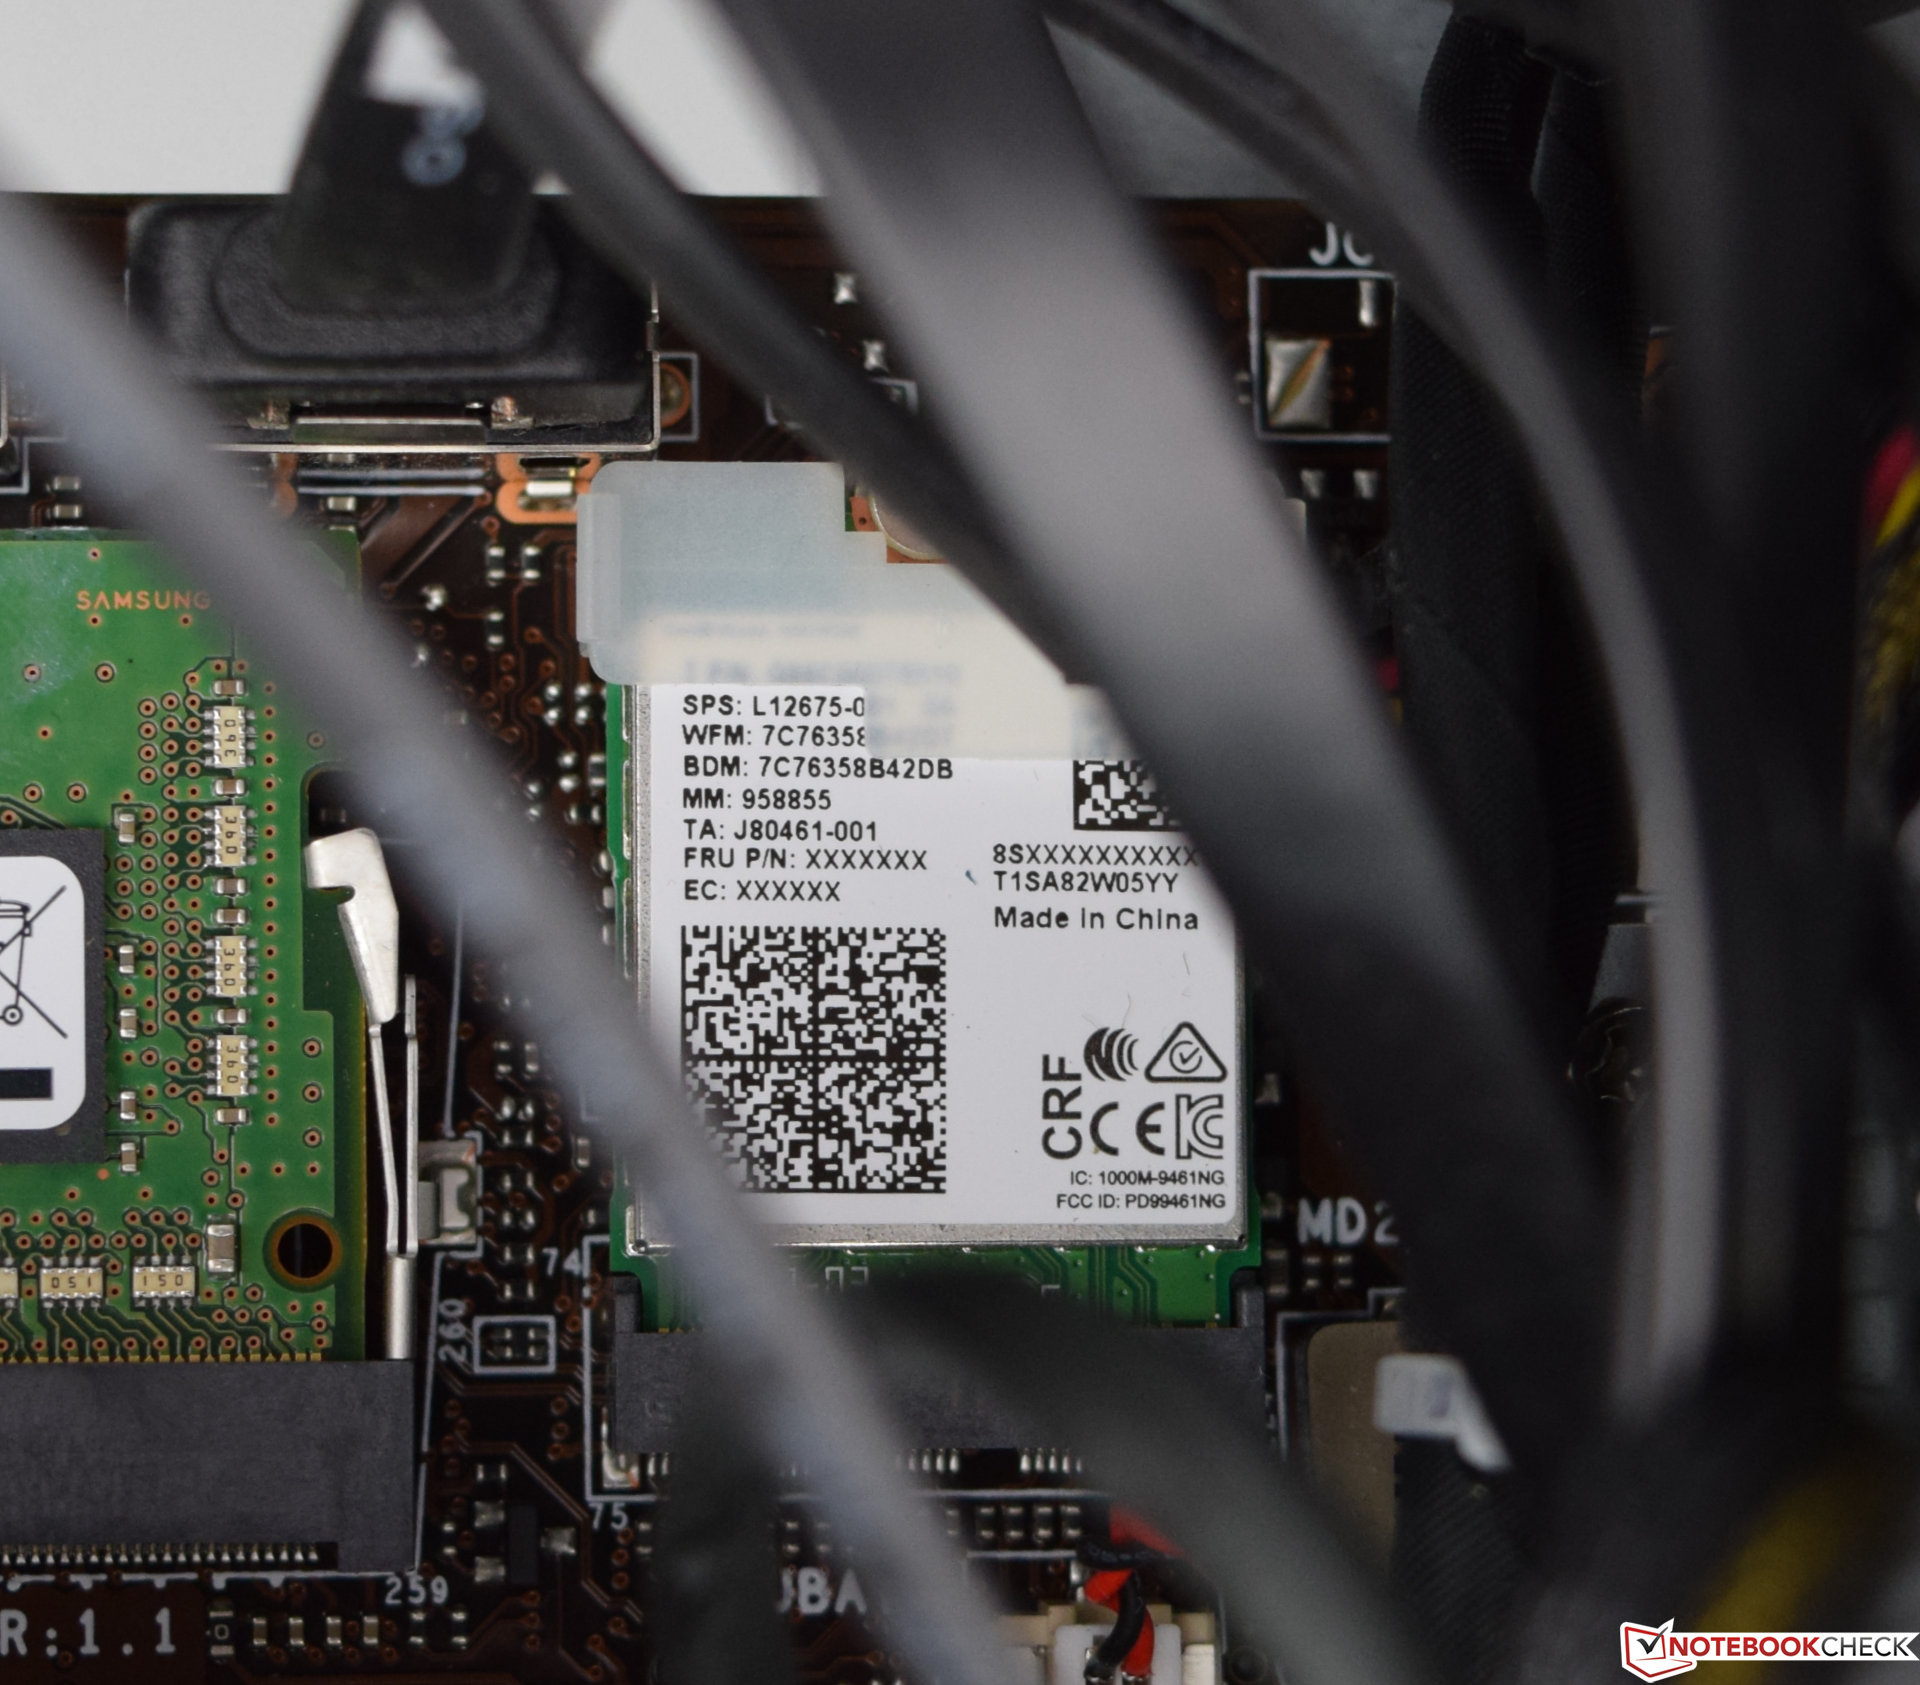
The machine uses an Intel Wireless-AC 9461 chip for Wi-Fi and Bluetooth 5.0 connectivity. There is also an RJ45 Ethernet port should you wish to use a wired Internet connection instead.
Security
The Aegis 3 8RD has a Kensington lock slot, which may be useful if you plan on frequently taking the machine to LAN parties. MSI preinstalls Norton Internet security software to protect the machine from viruses and other malicious code. There is also Windows Defender that is integrated into Windows 10 if you would rather not use third-party anti-virus software.
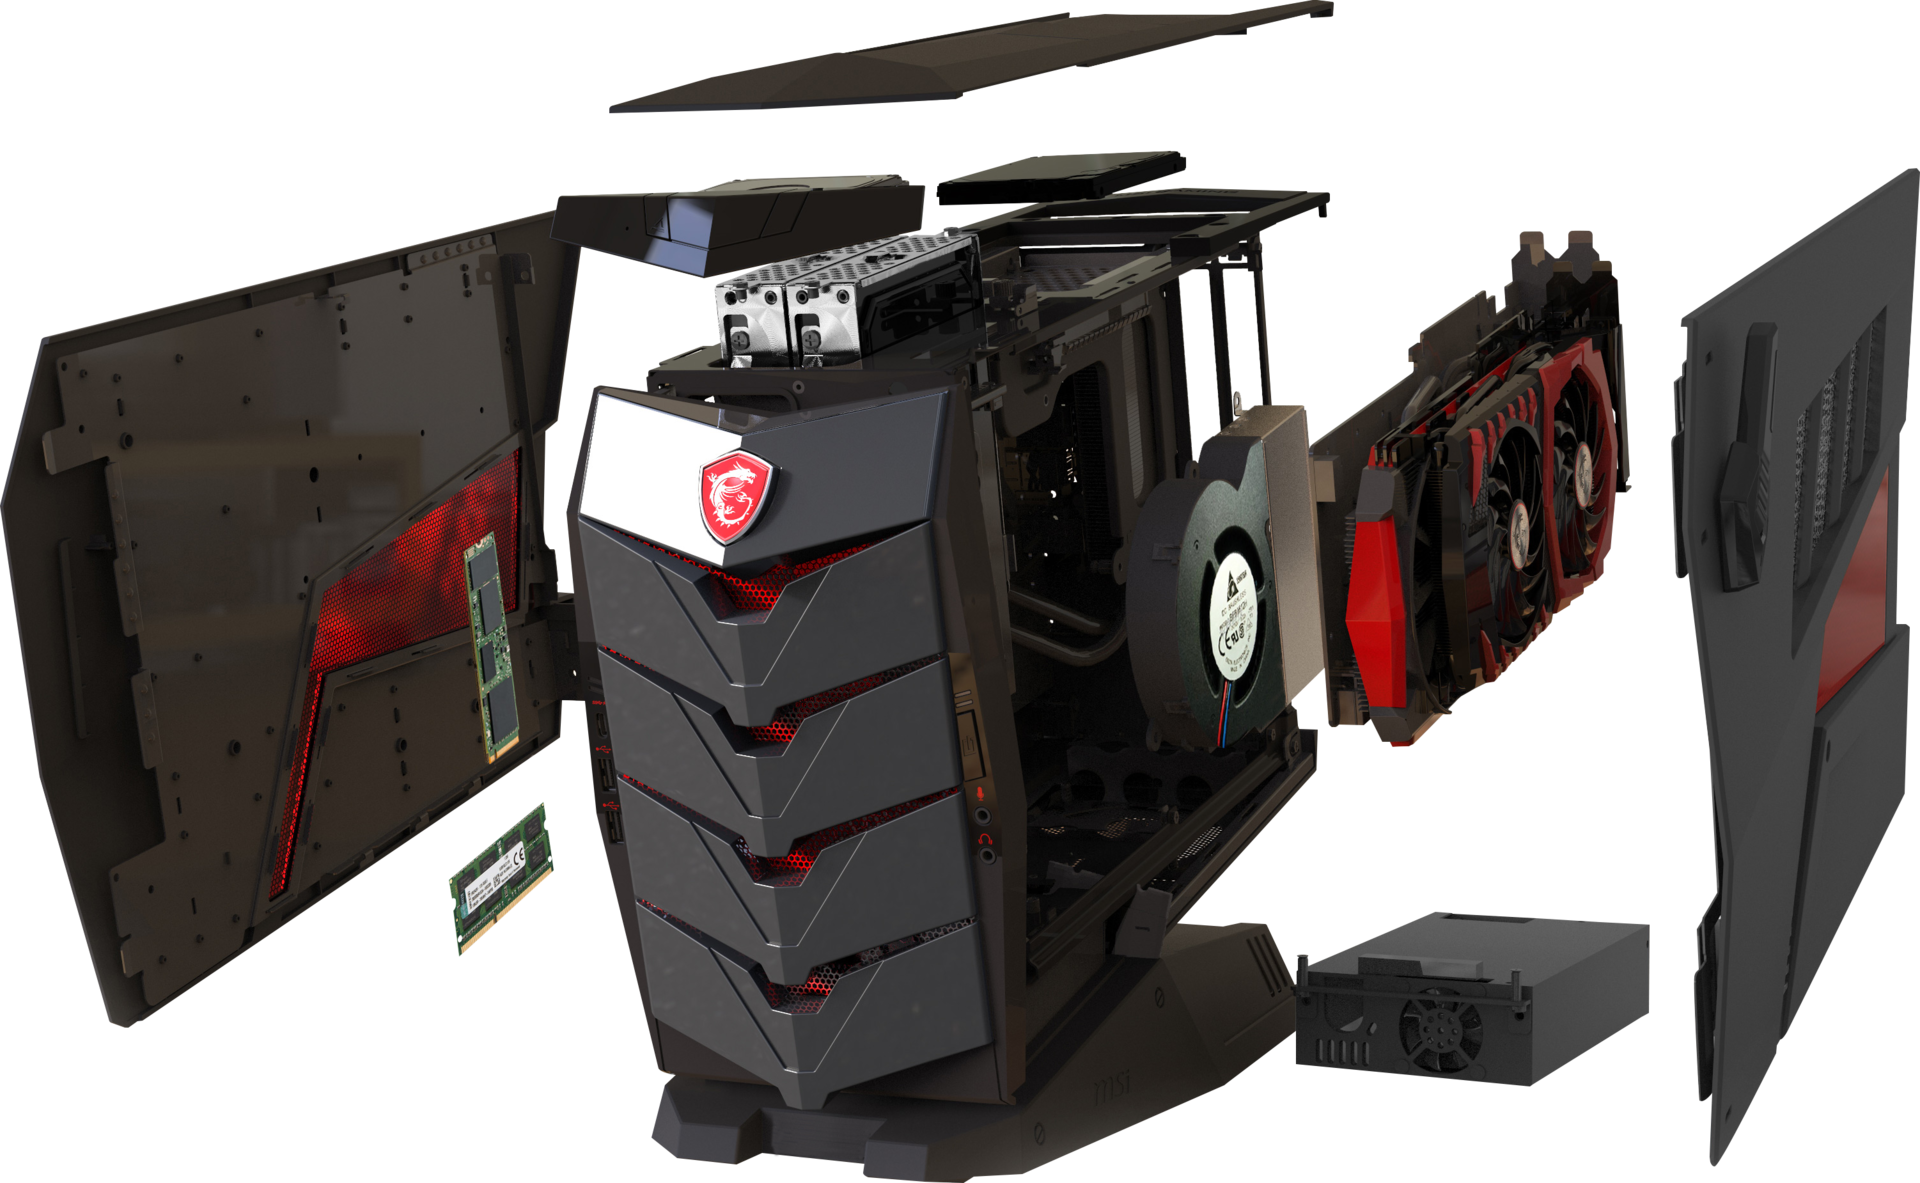
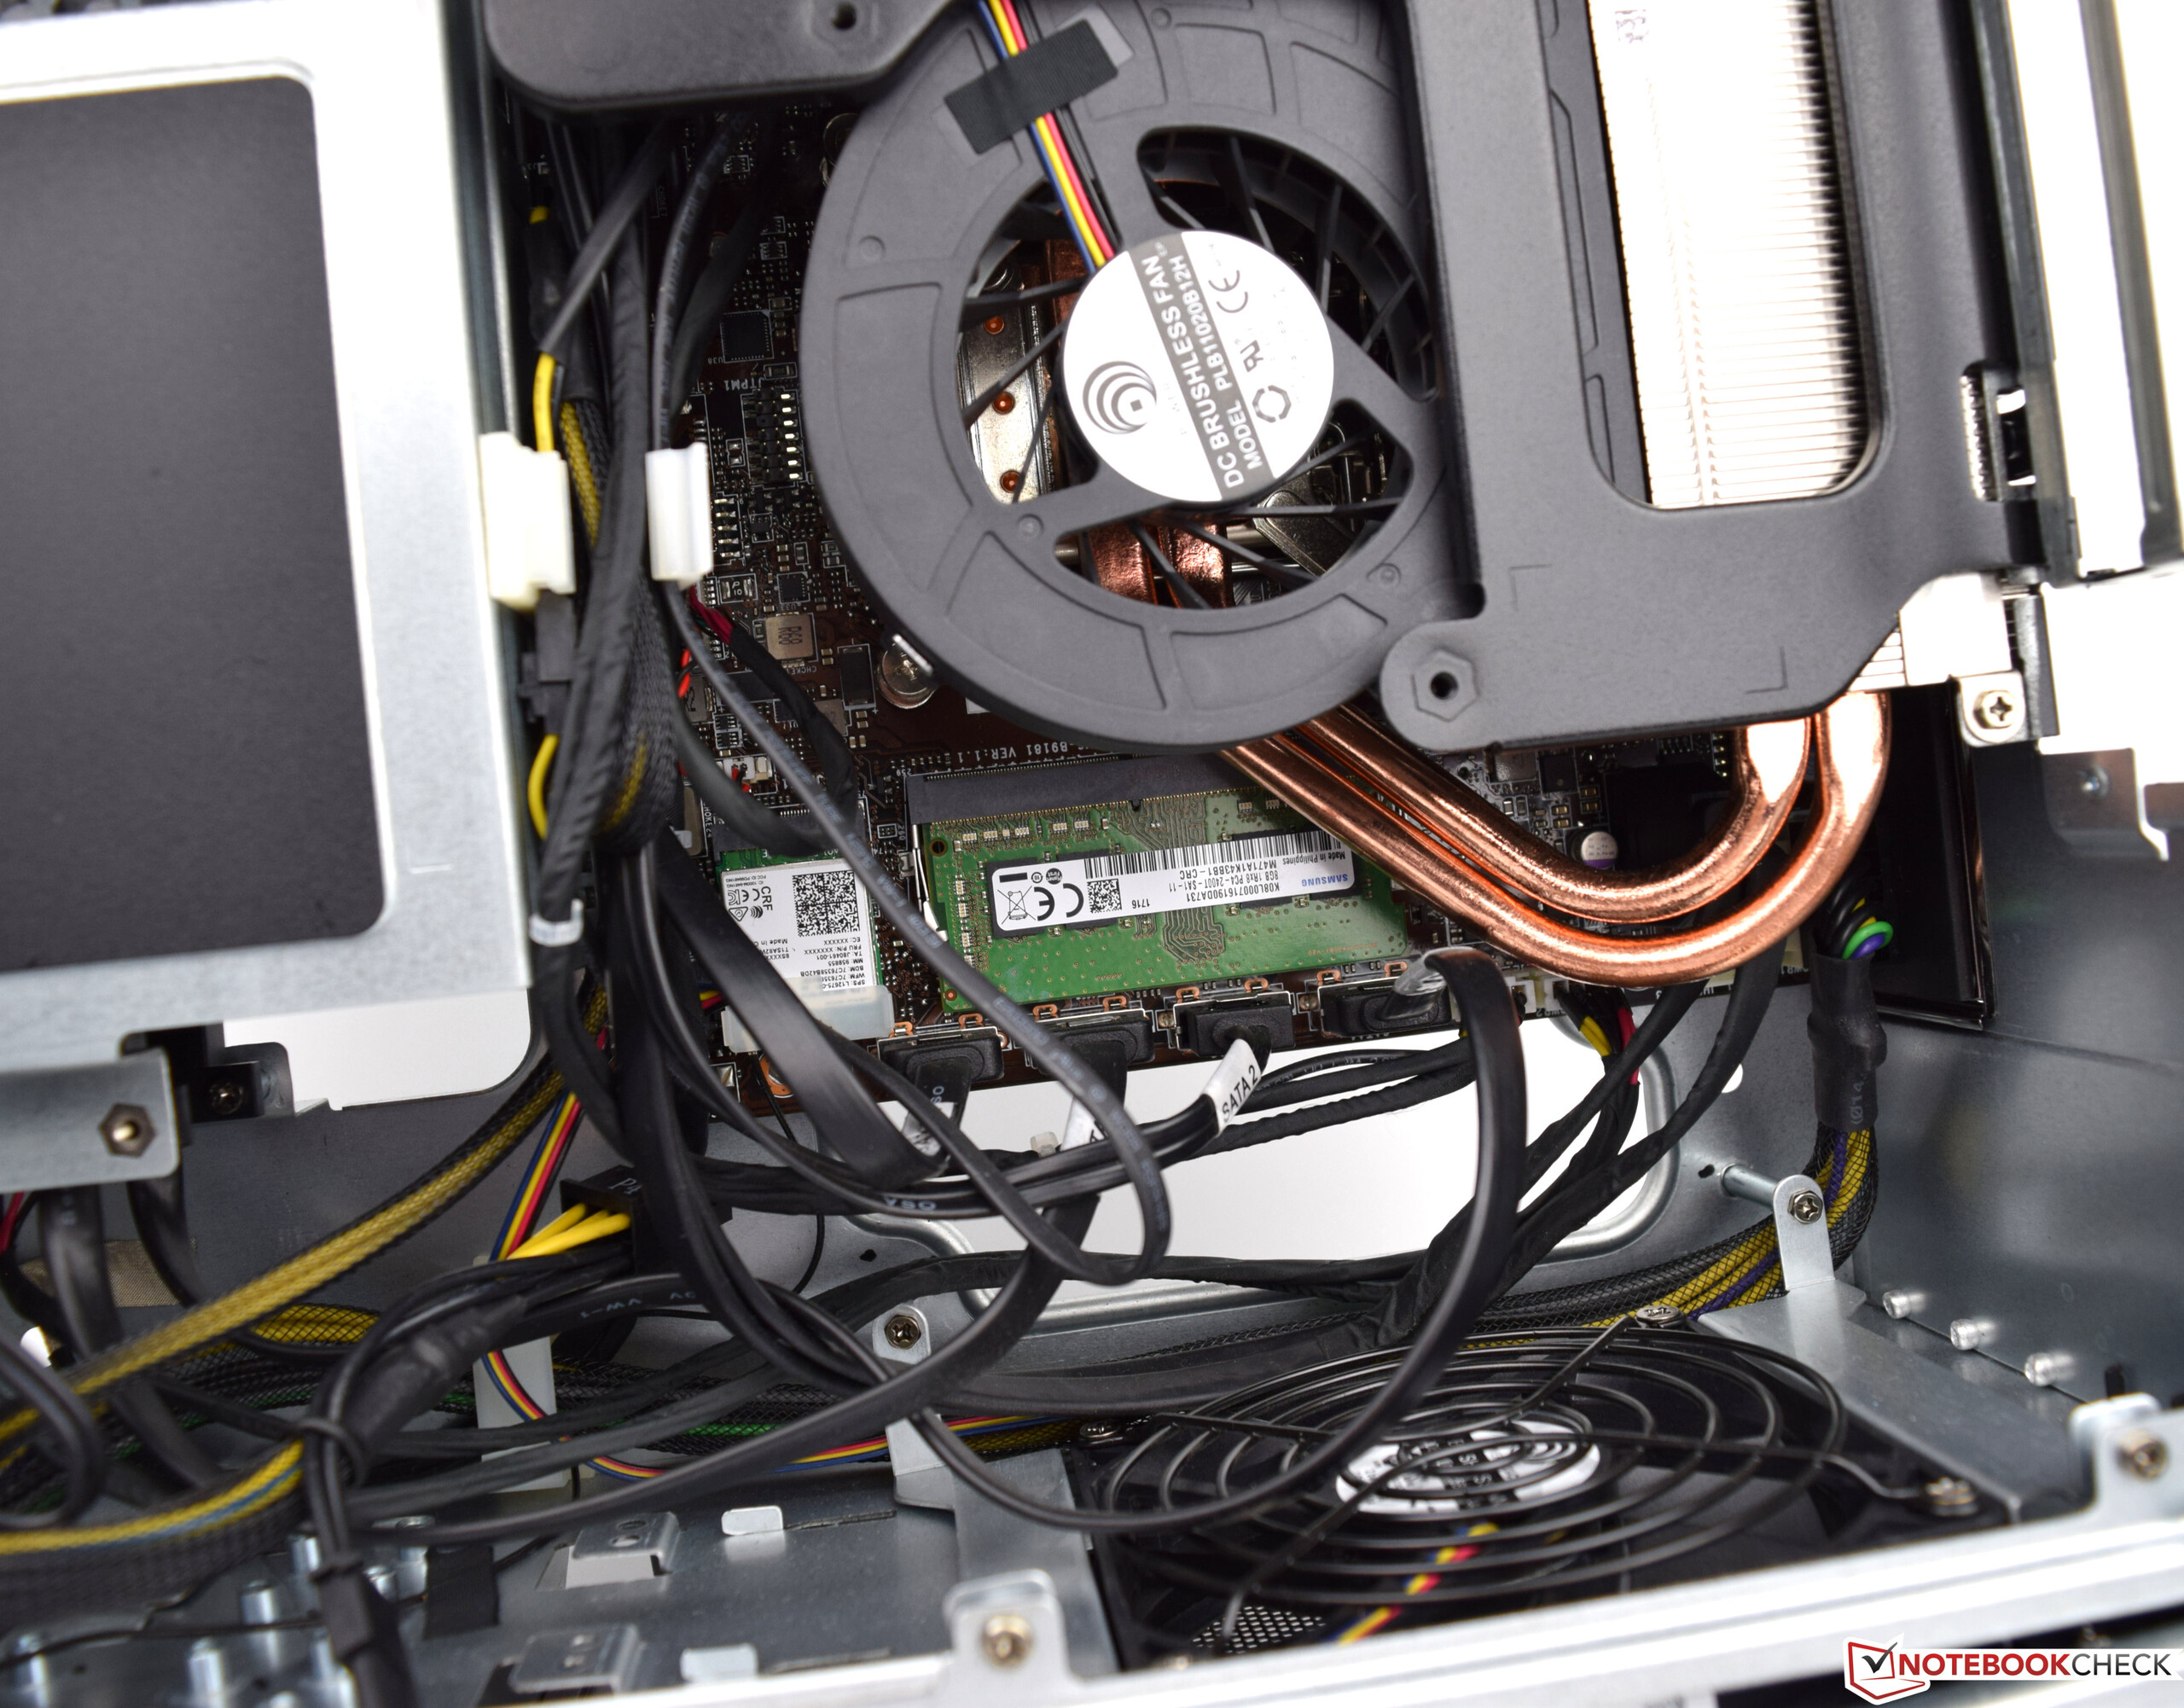
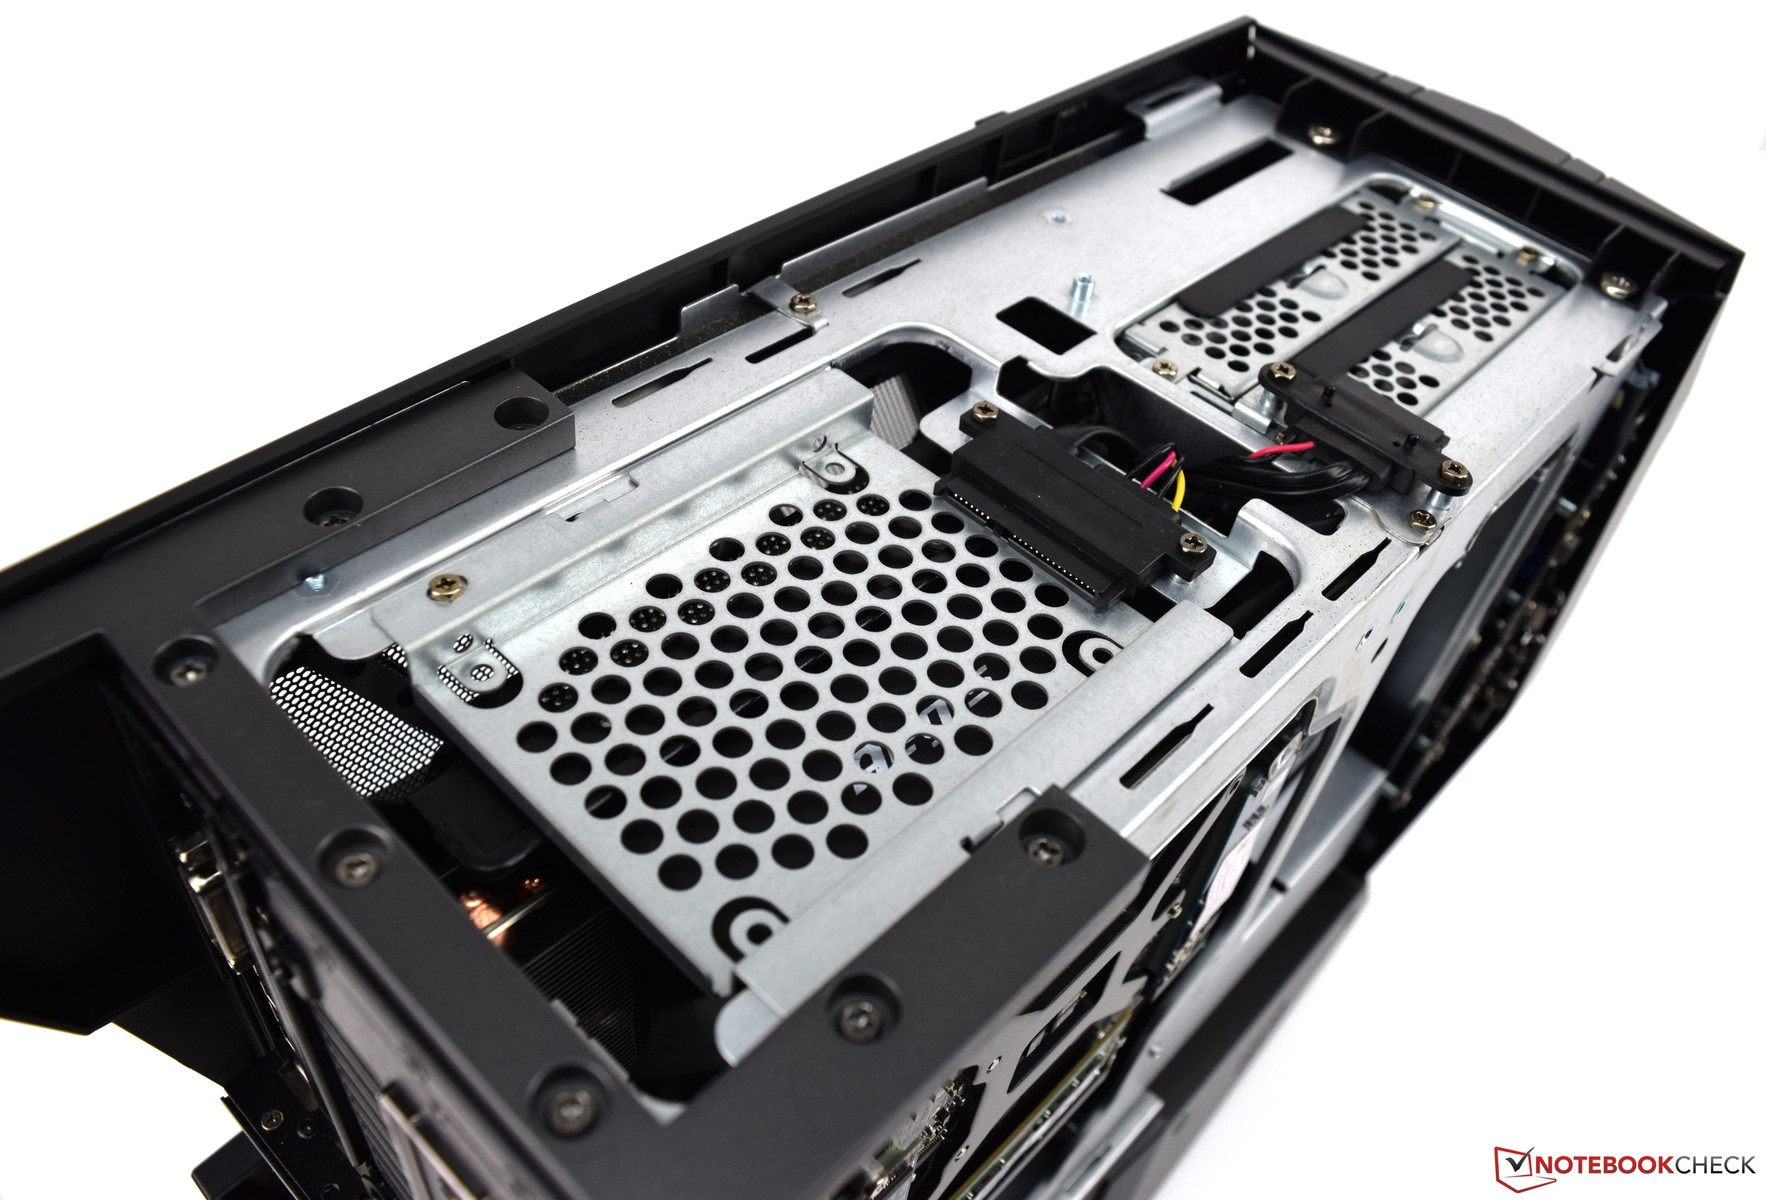
Maintenance
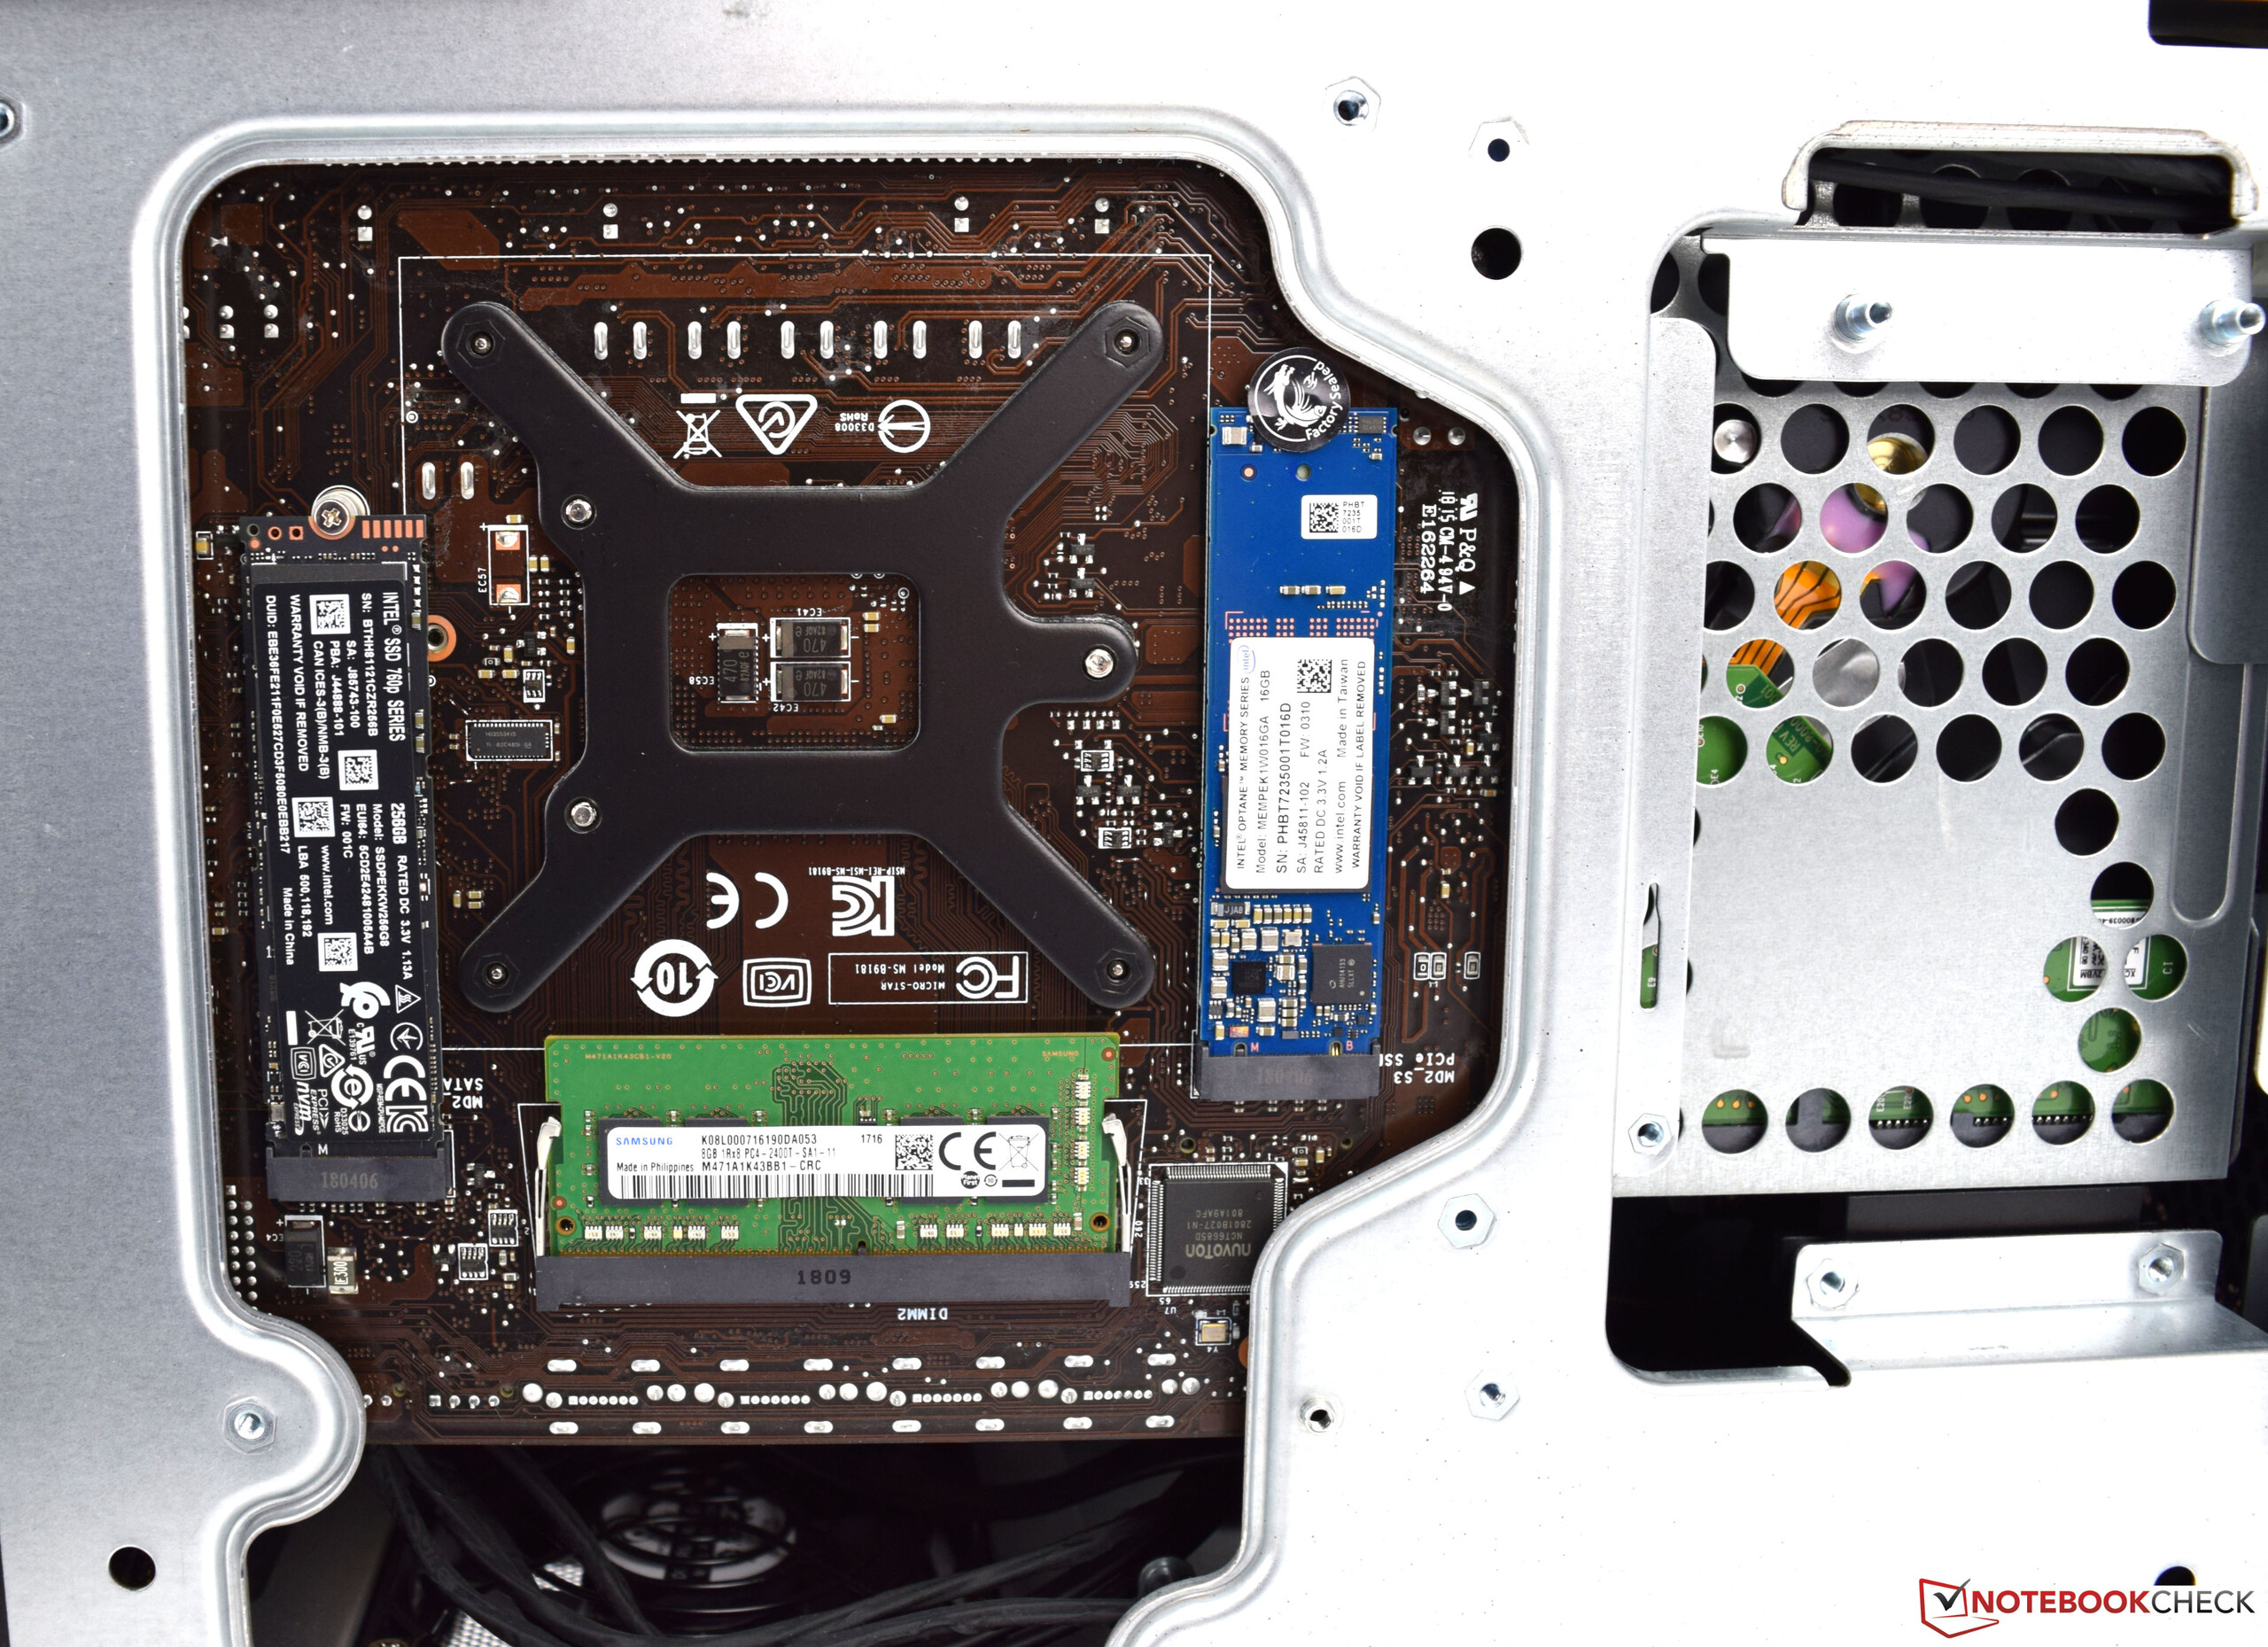
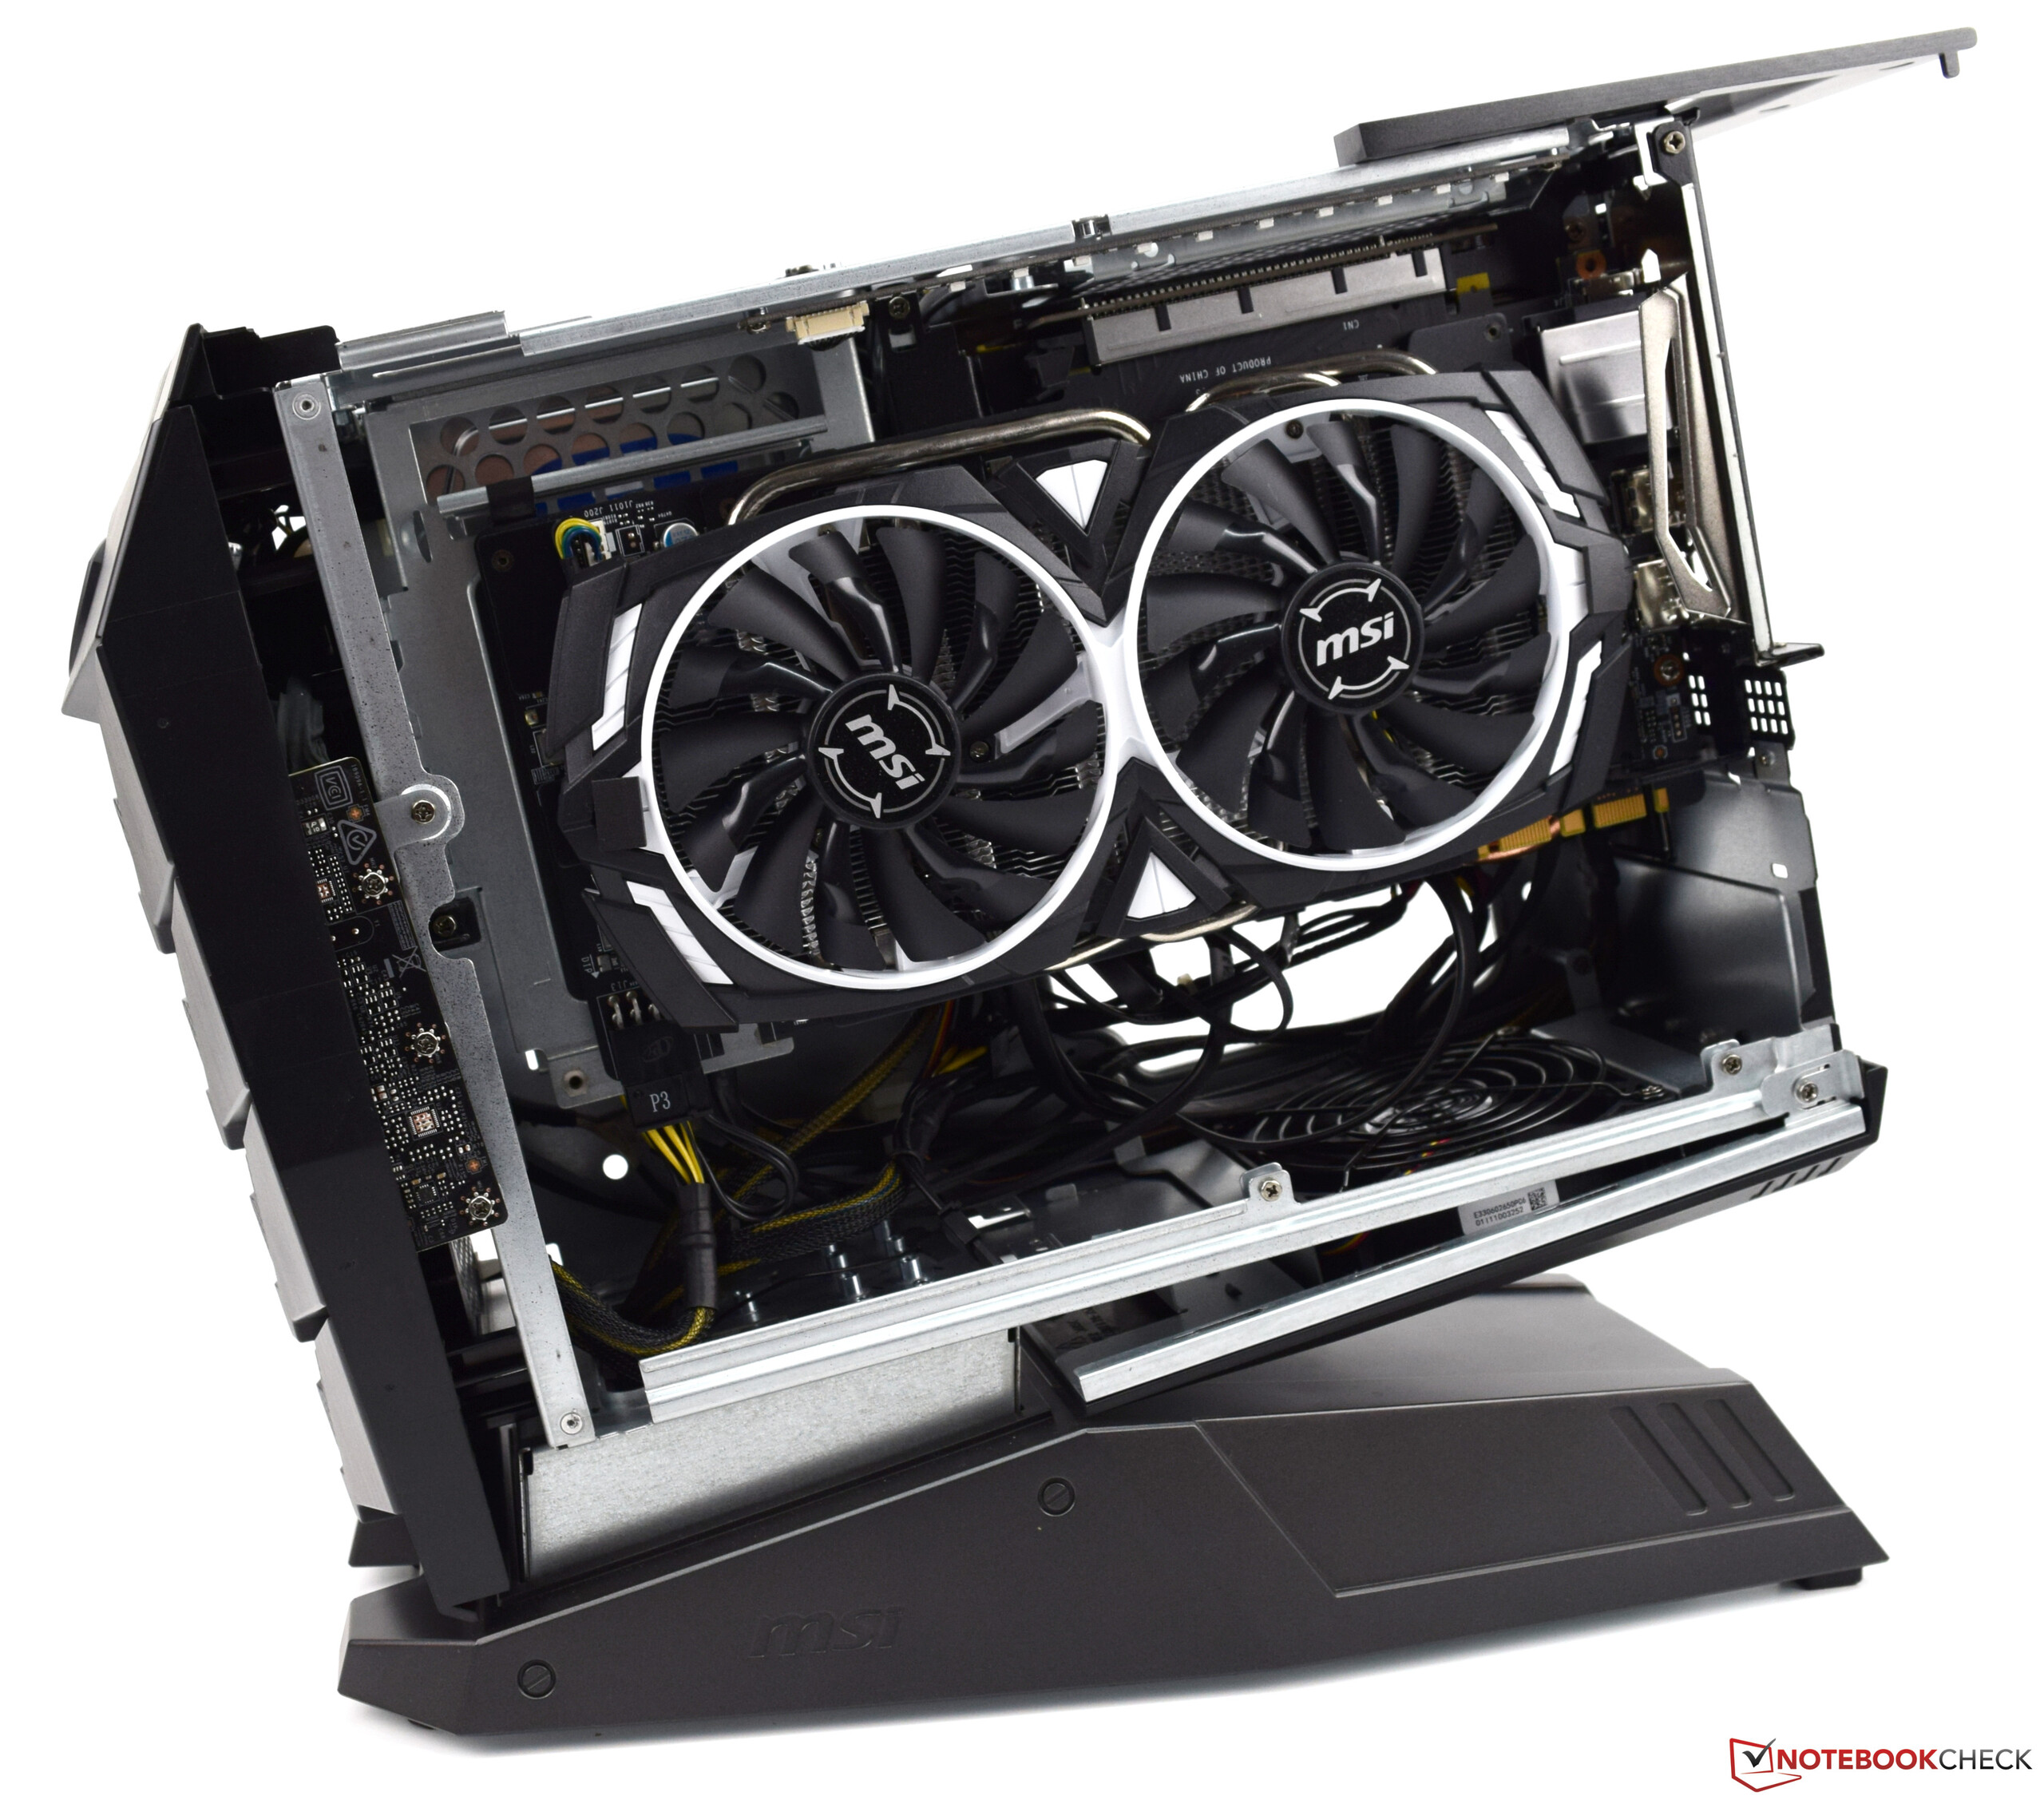
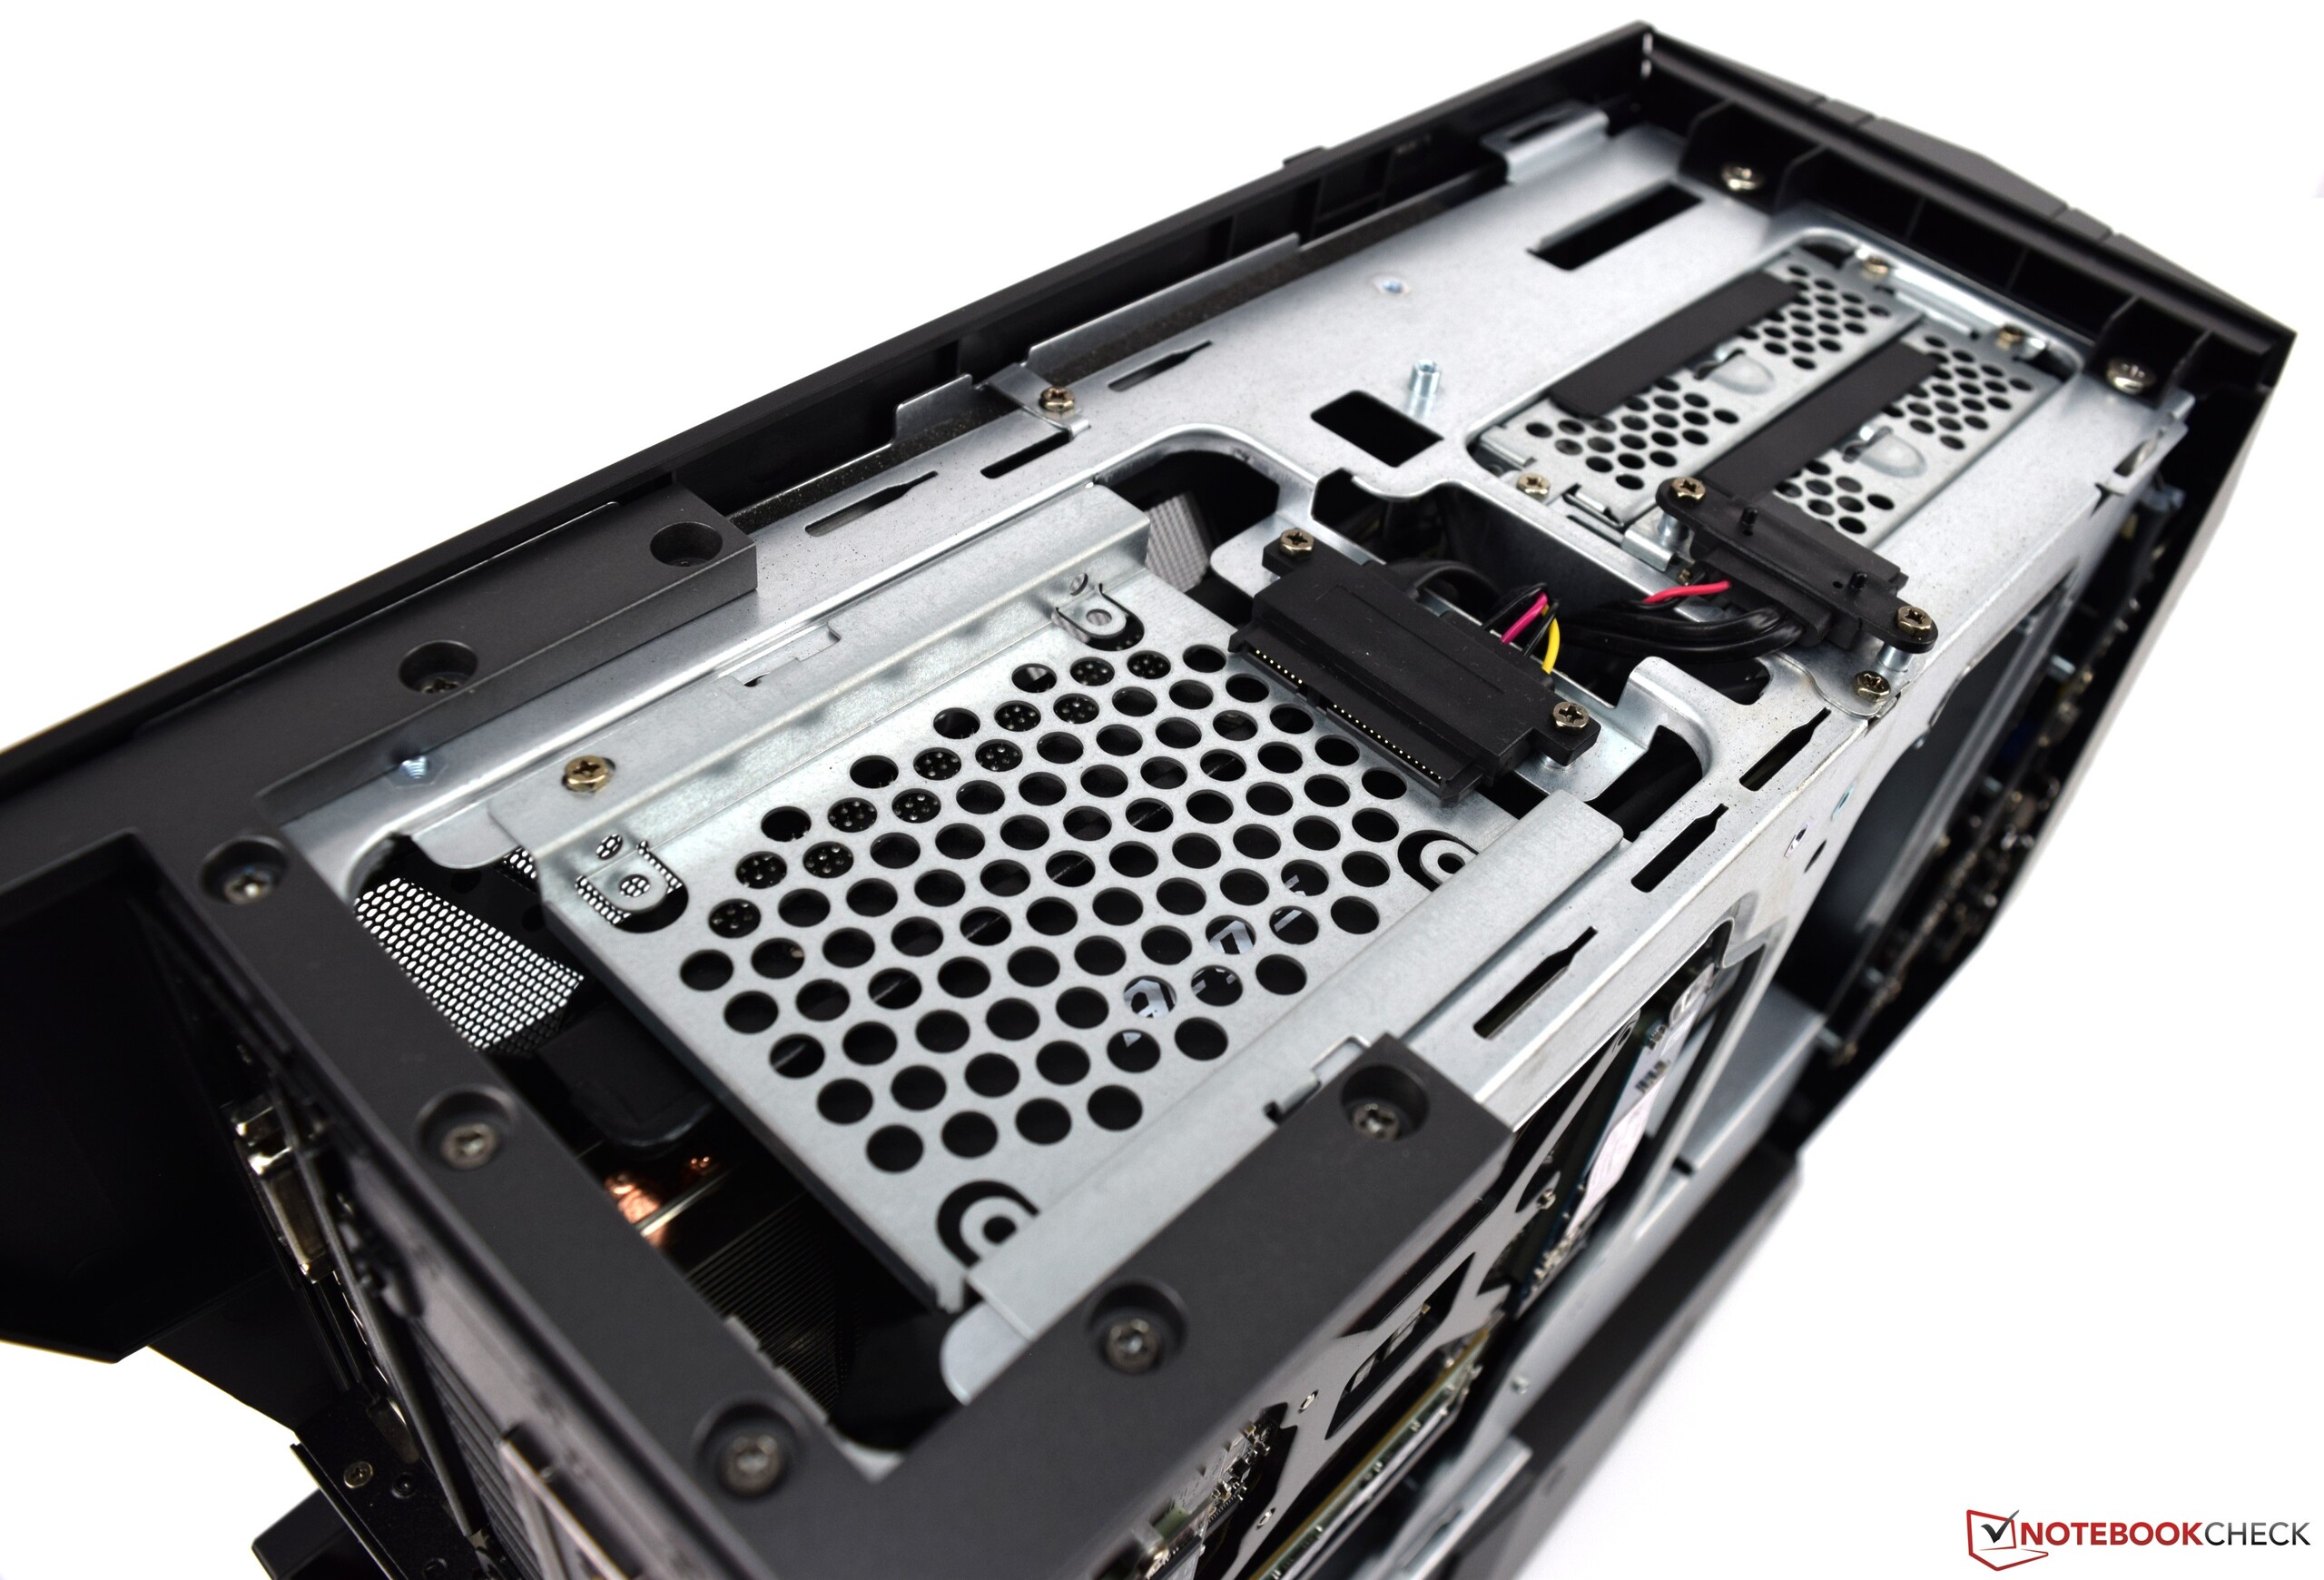
The machine is easy to open, which is useful for maintaining or upgrading components. The two side panels are quick to disassemble and are only fixed in place with screws. Removing these gives access to practically all components, like the fans and the GPU. The default power supply is rated at 450 W though, so keep that in mind if you plan on upgrading to a more powerful CPU or GPU in the future. MSI has also equipped the Aegis 3 8RD with SO-DIMM RAM, which manufacturers typically use in laptops. There are no trade-offs from using laptop RAM over conventional RAM and we suspect that MSI has done this to save space. The machine is well-equipped with storage media too. There are two 3.5-inch bays, one 2.5-inch drive bay, and two M.2-2280 bays, all of which are wired out of the box.
Warranty
The Aegis 3 8RD comes with 24 months manufacturer's warranty with an on-site pick-up and return service. Please see our Guarantees, Return policies and Warranties FAQ for country-specific information.
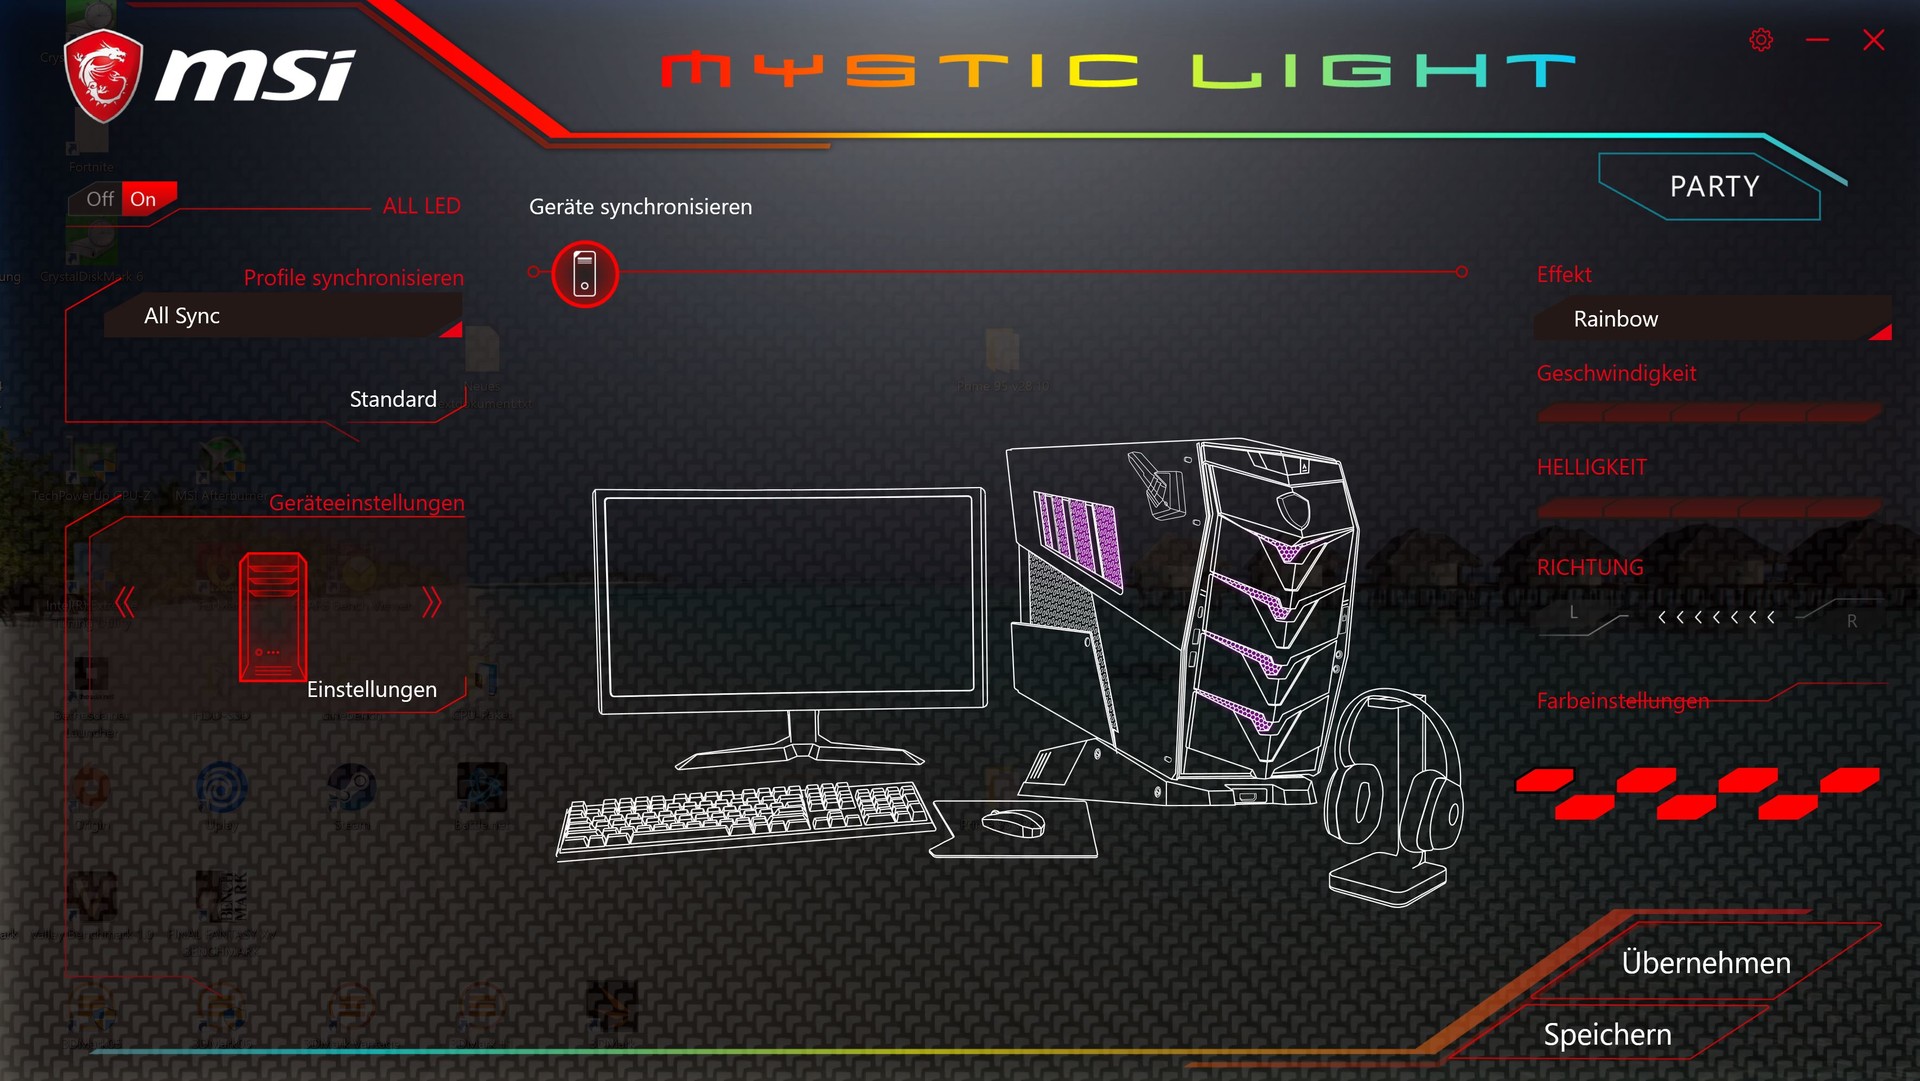
Software
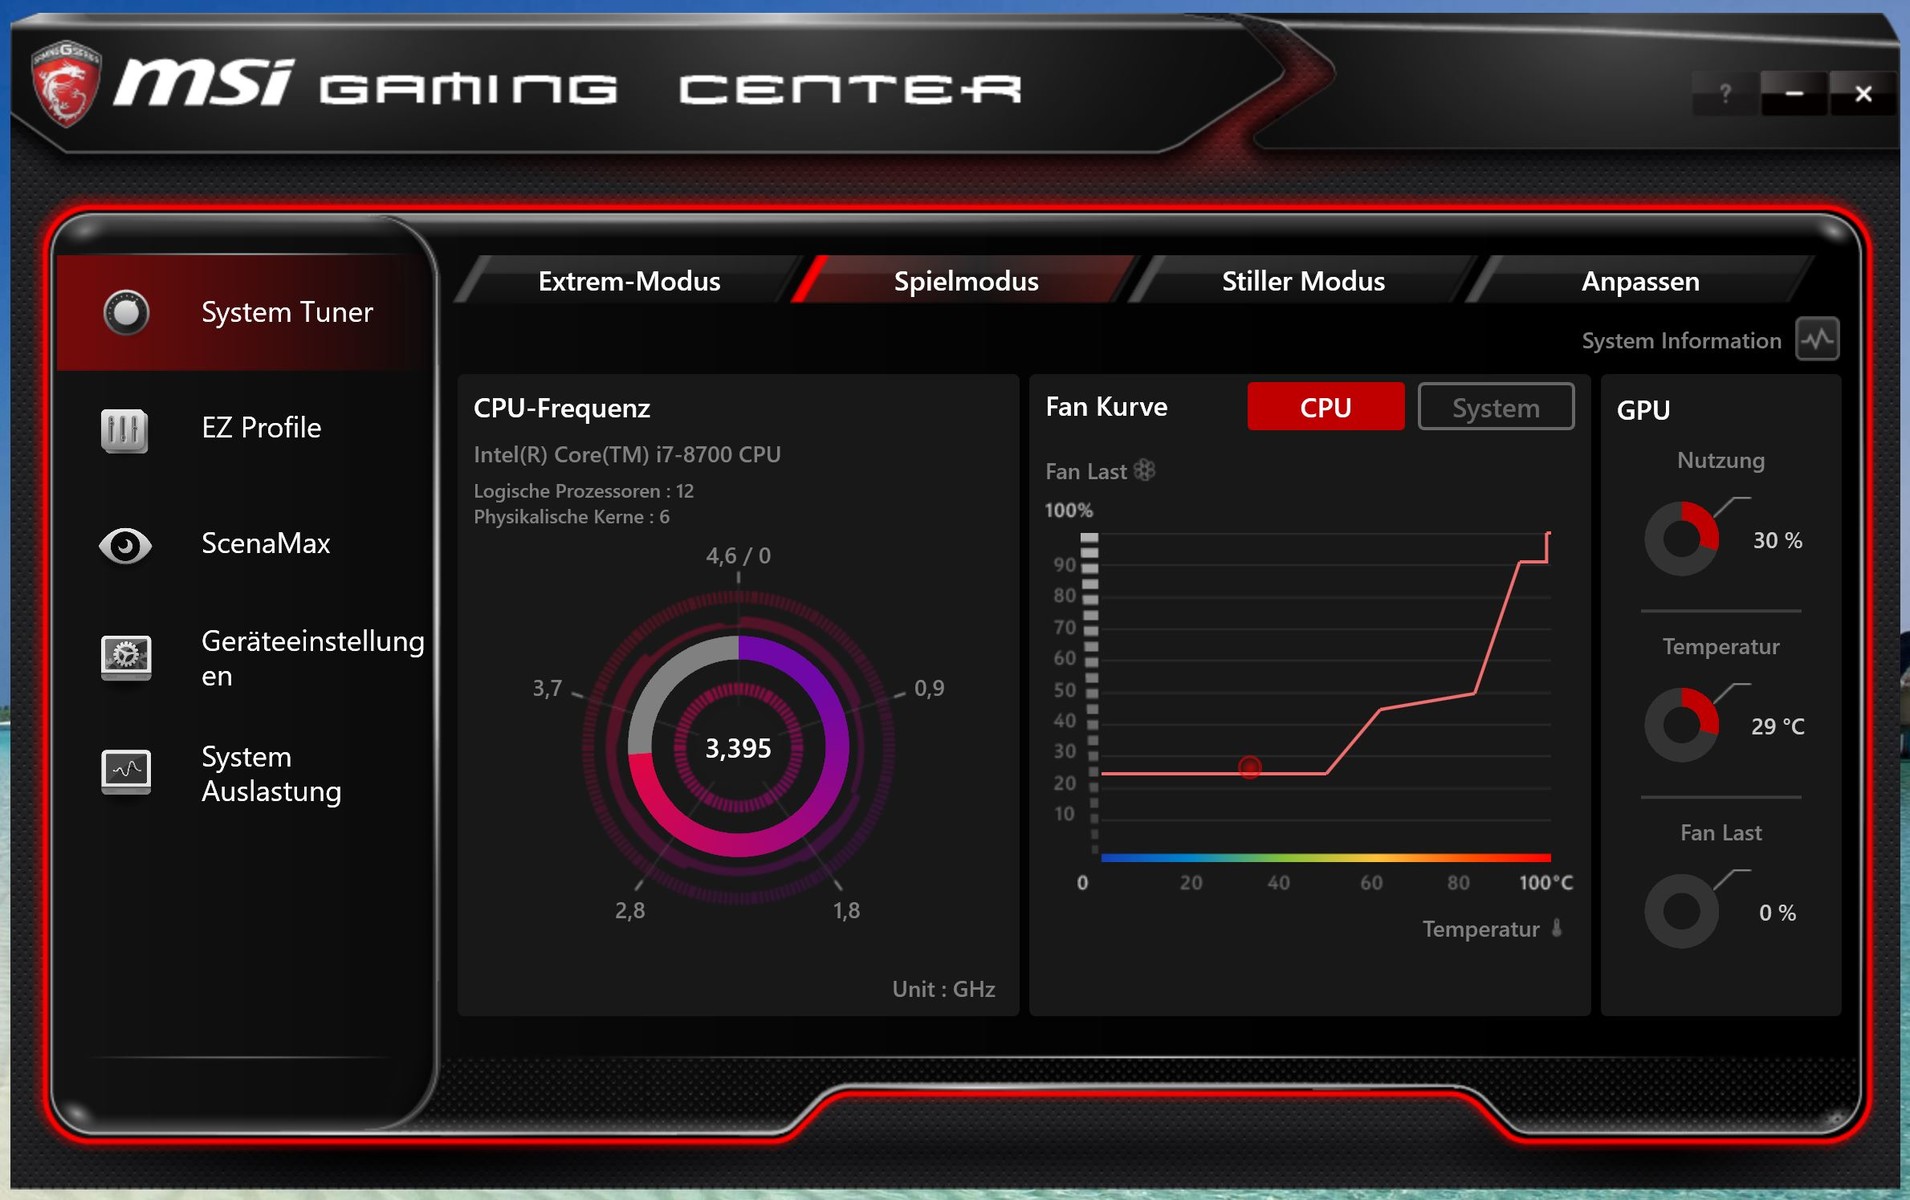
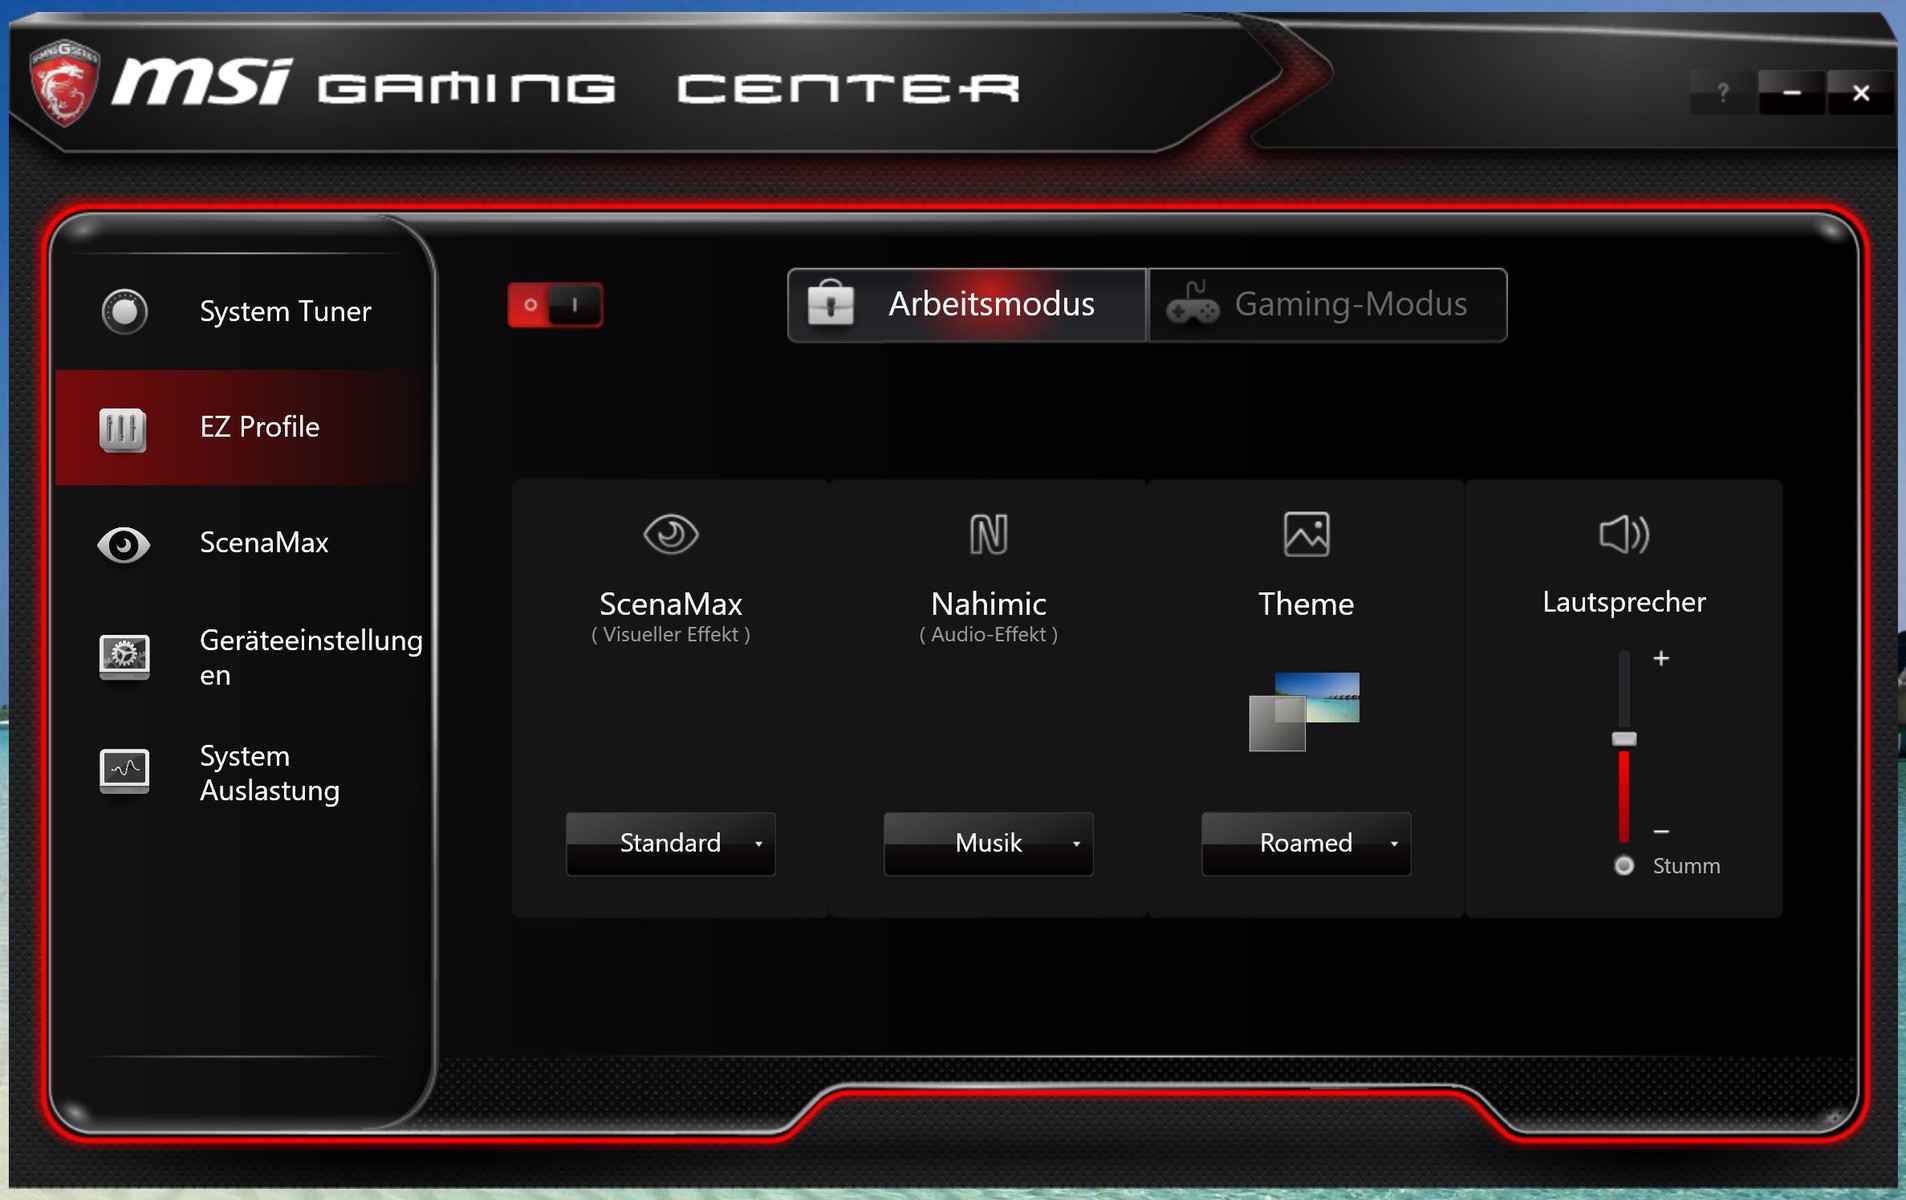
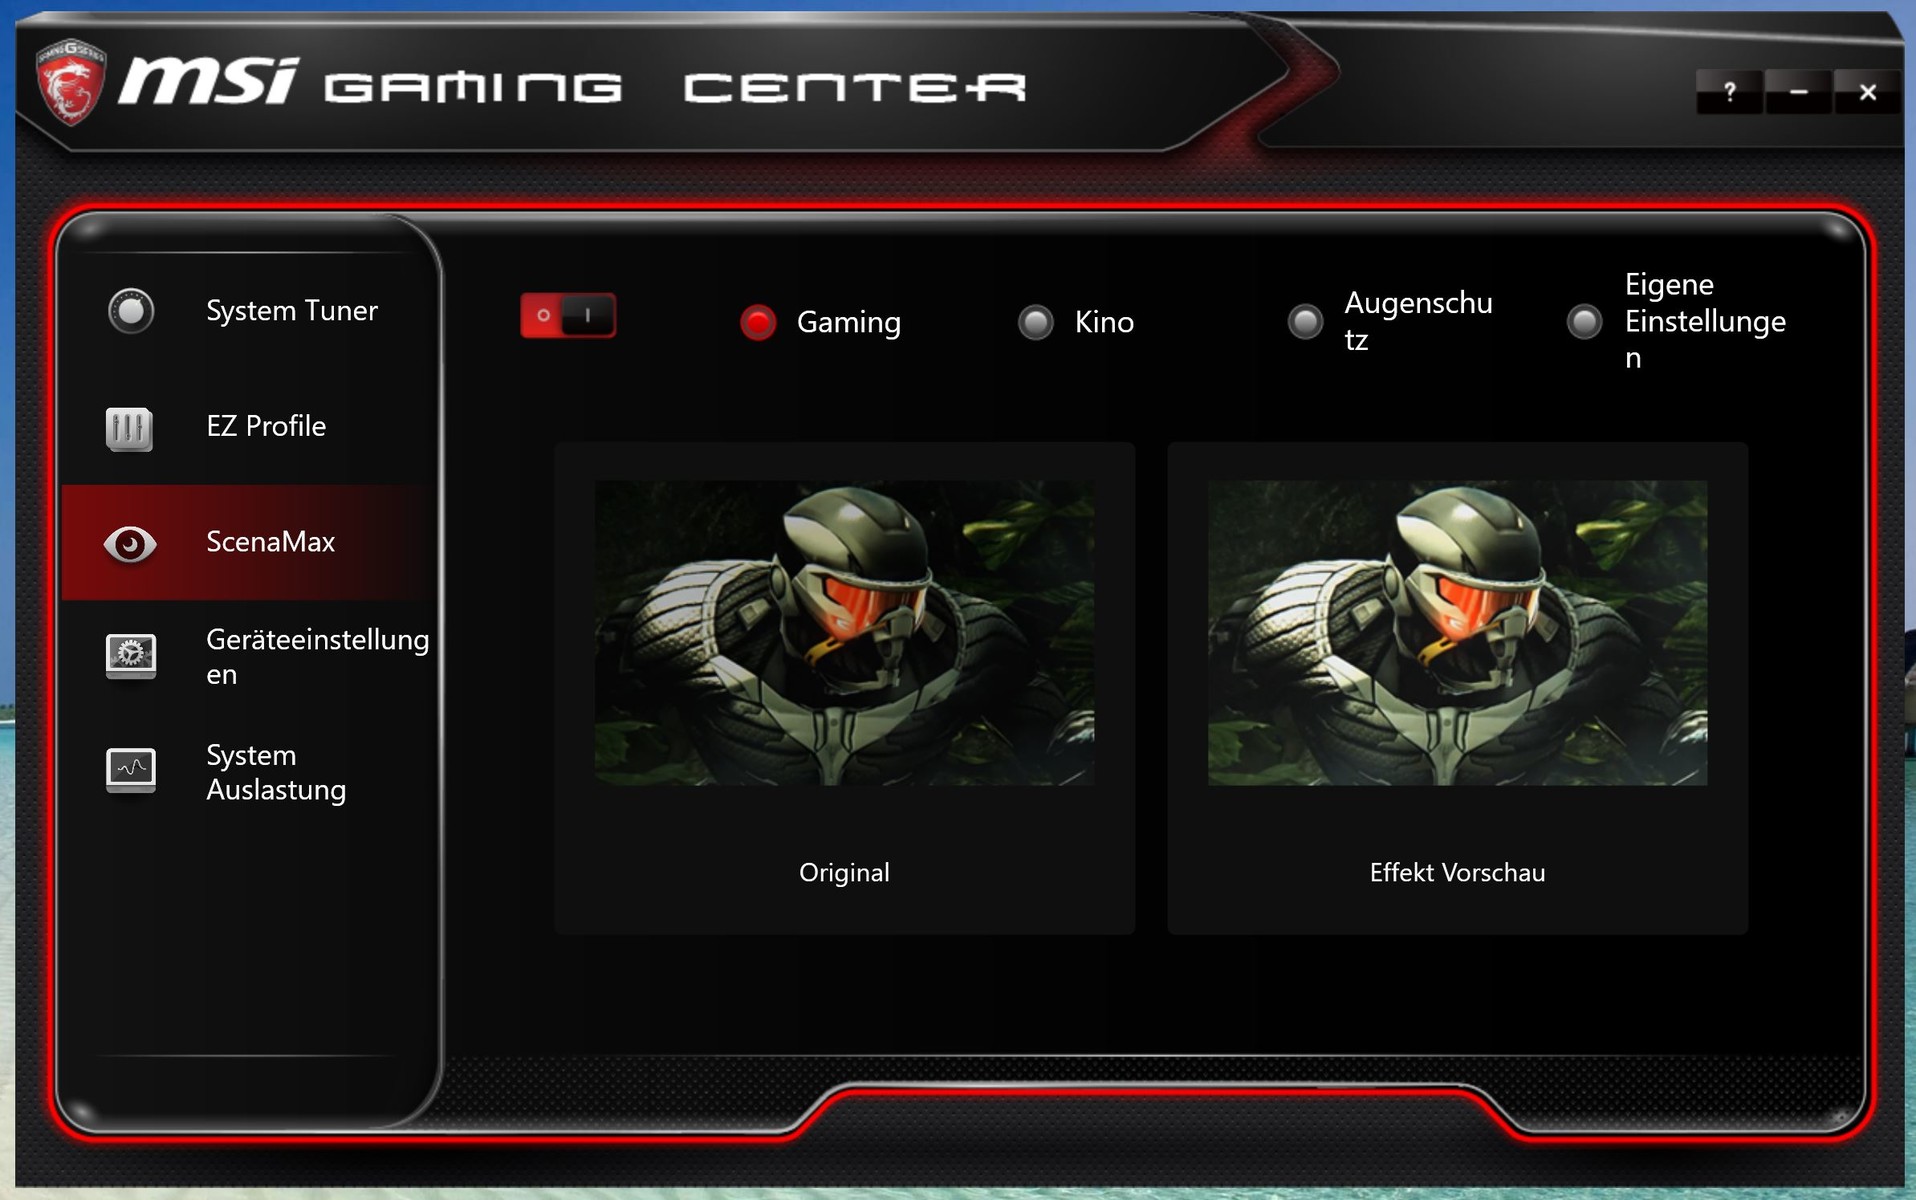
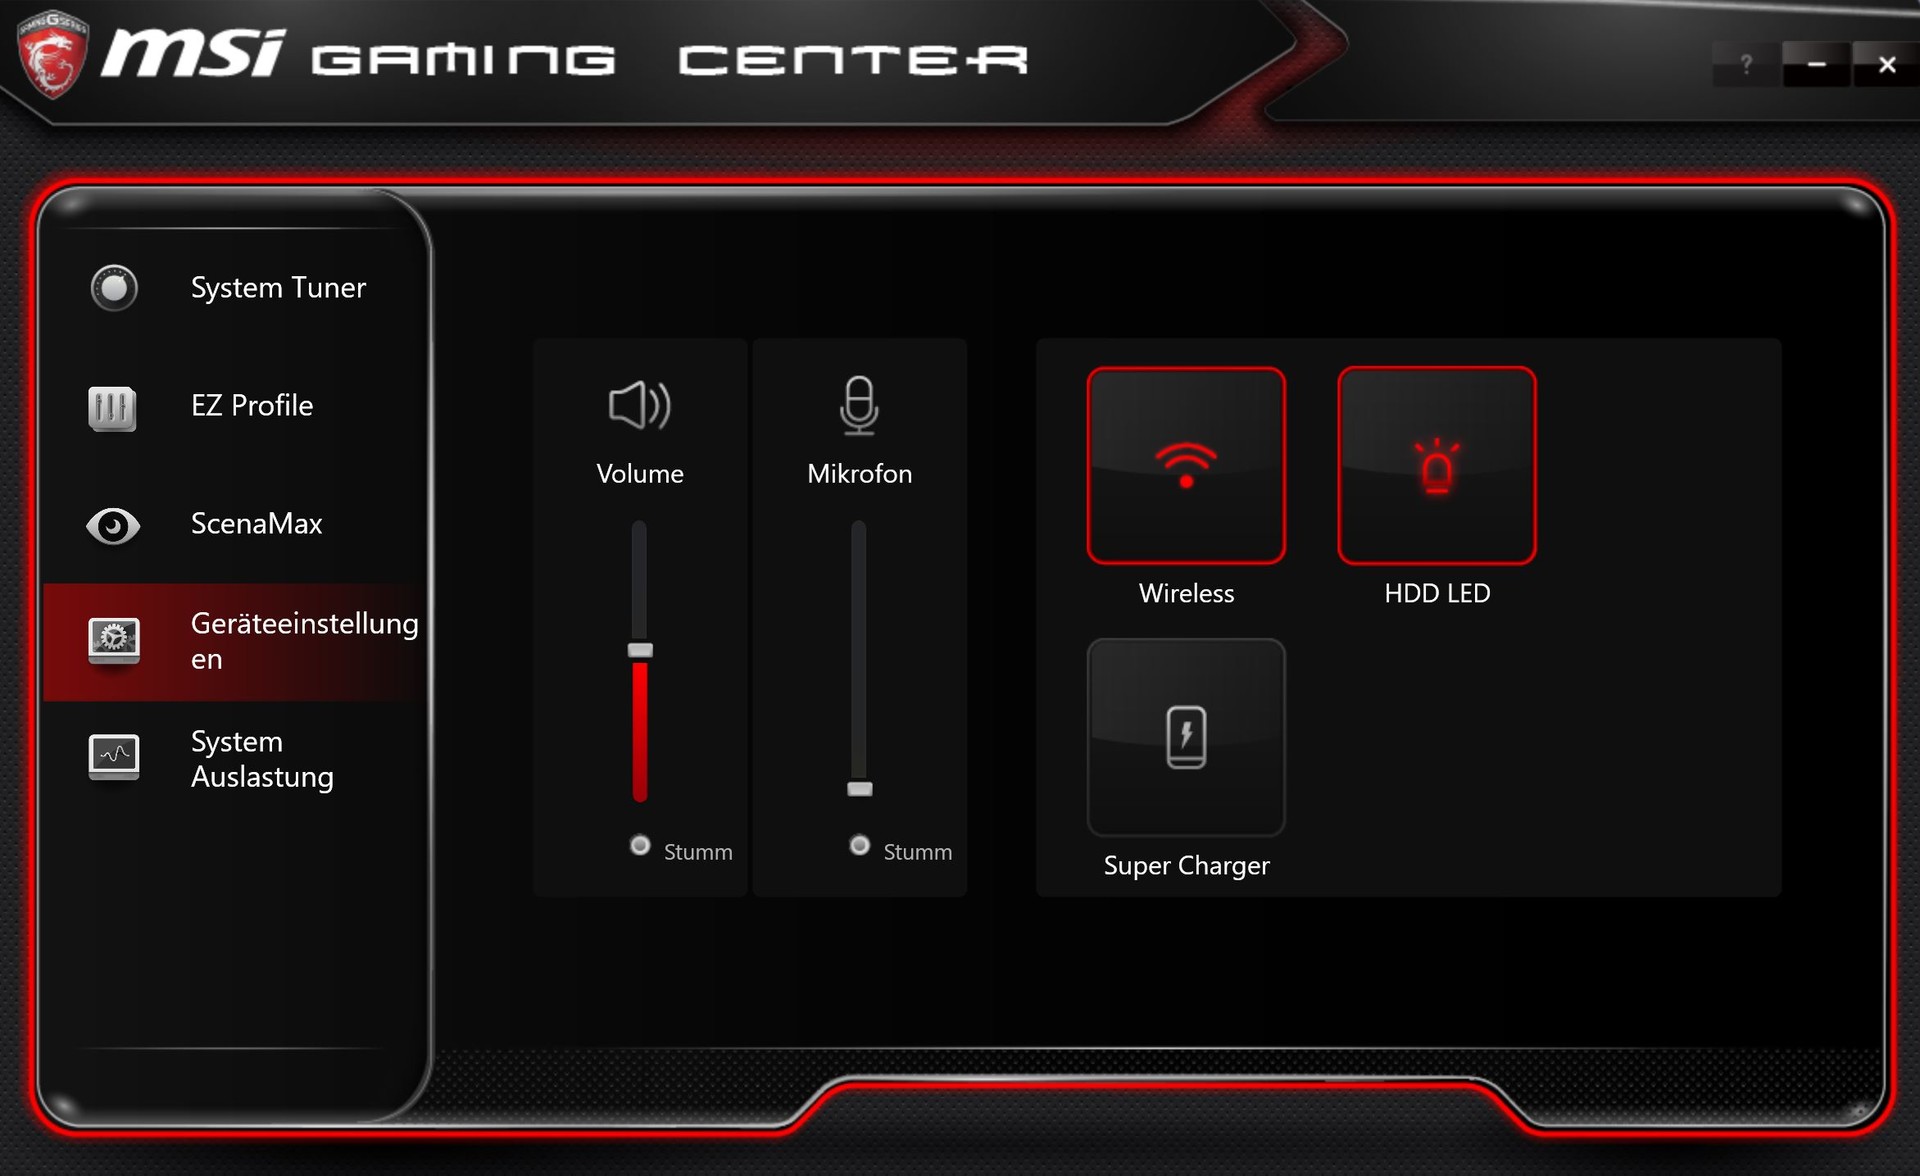
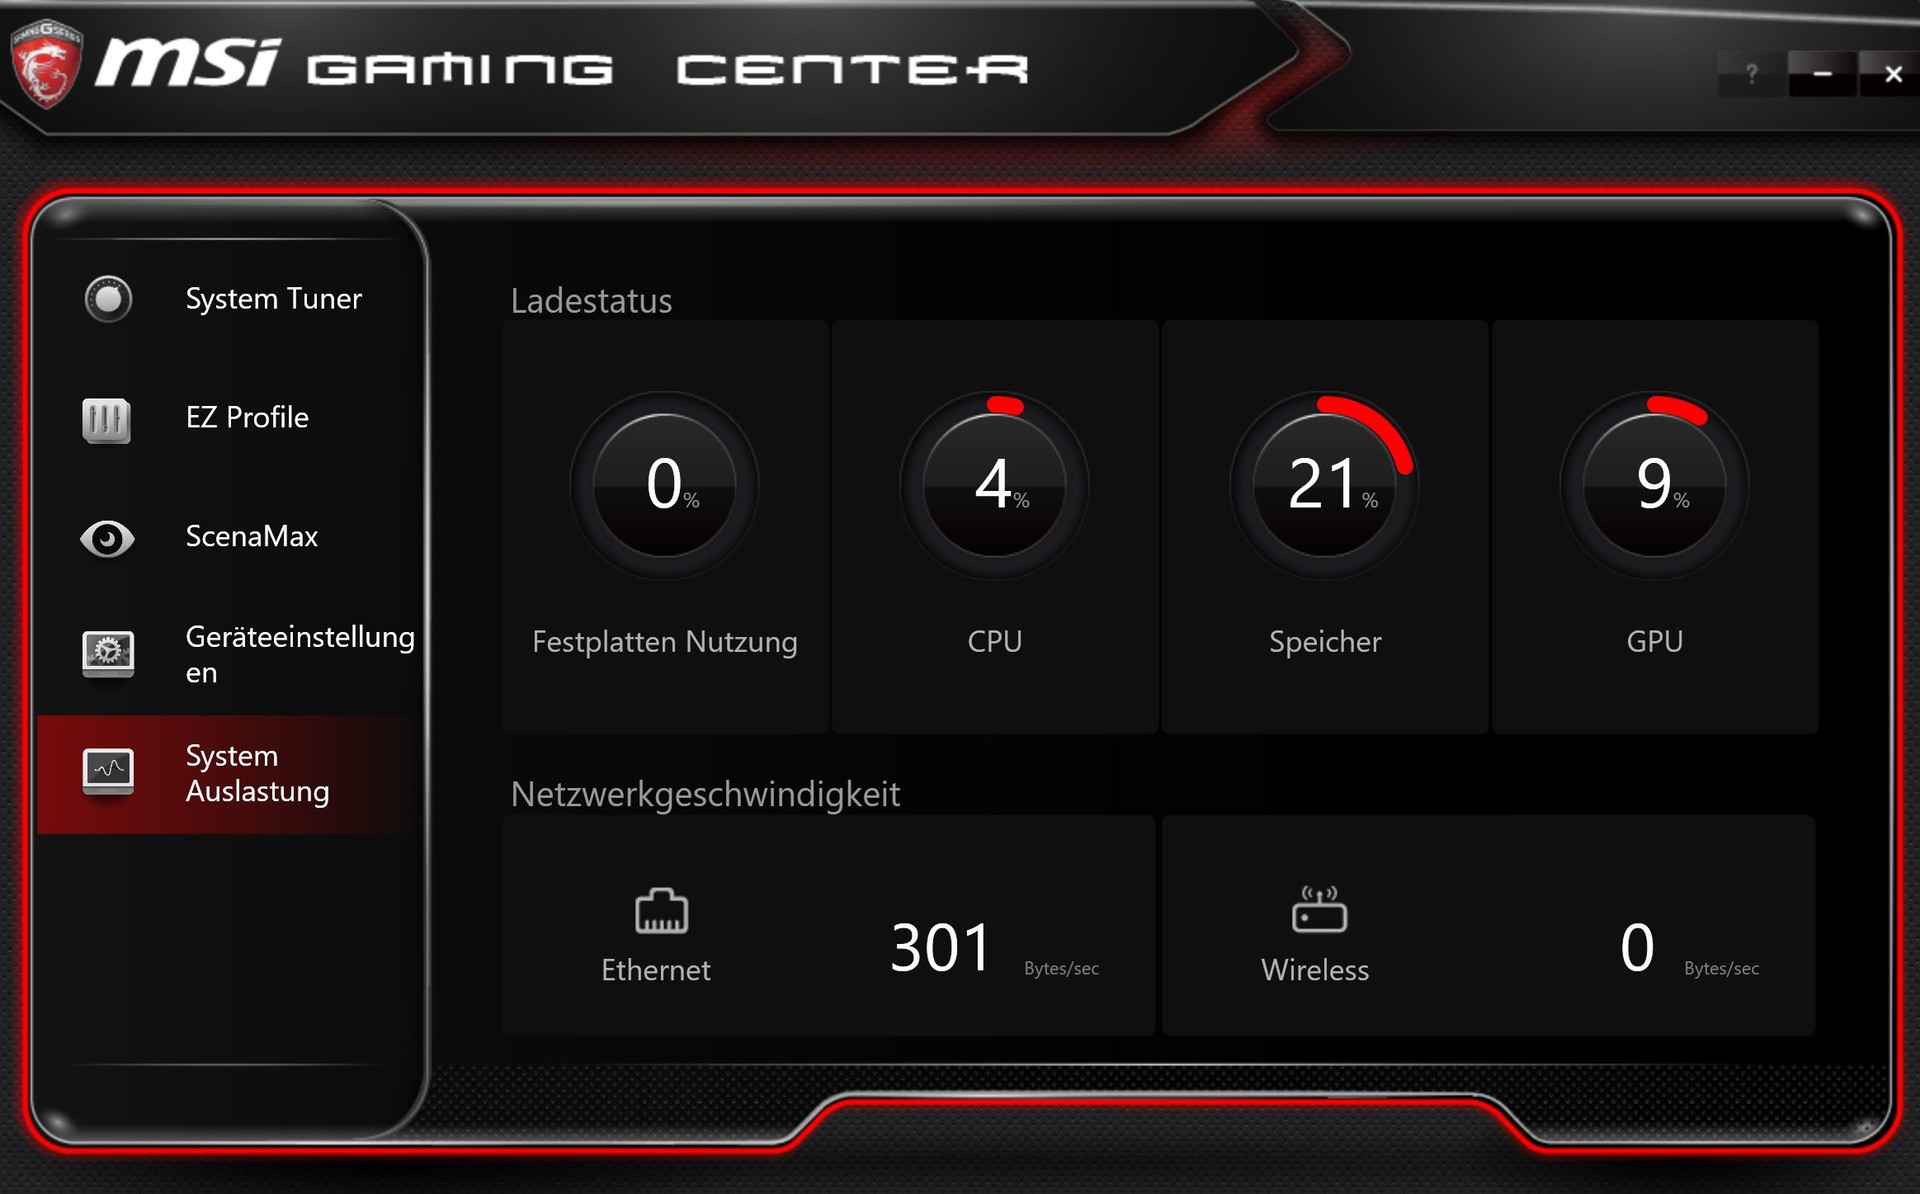
MSI has included its Mystic Light software to adjust RGB lighting. There are several preset profiles to choose from or an option to manually configure each lighting element individually. The company has also preinstalled its Gaming Center, which gives an overview of system information and has several fan modes. We set our test machine to the ‘Game mode’ fan curve for our tests. We would recommend using the ‘Silent mode’ though because the CPU fan runs much quieter on this profile than on ‘Game mode’.
Performance
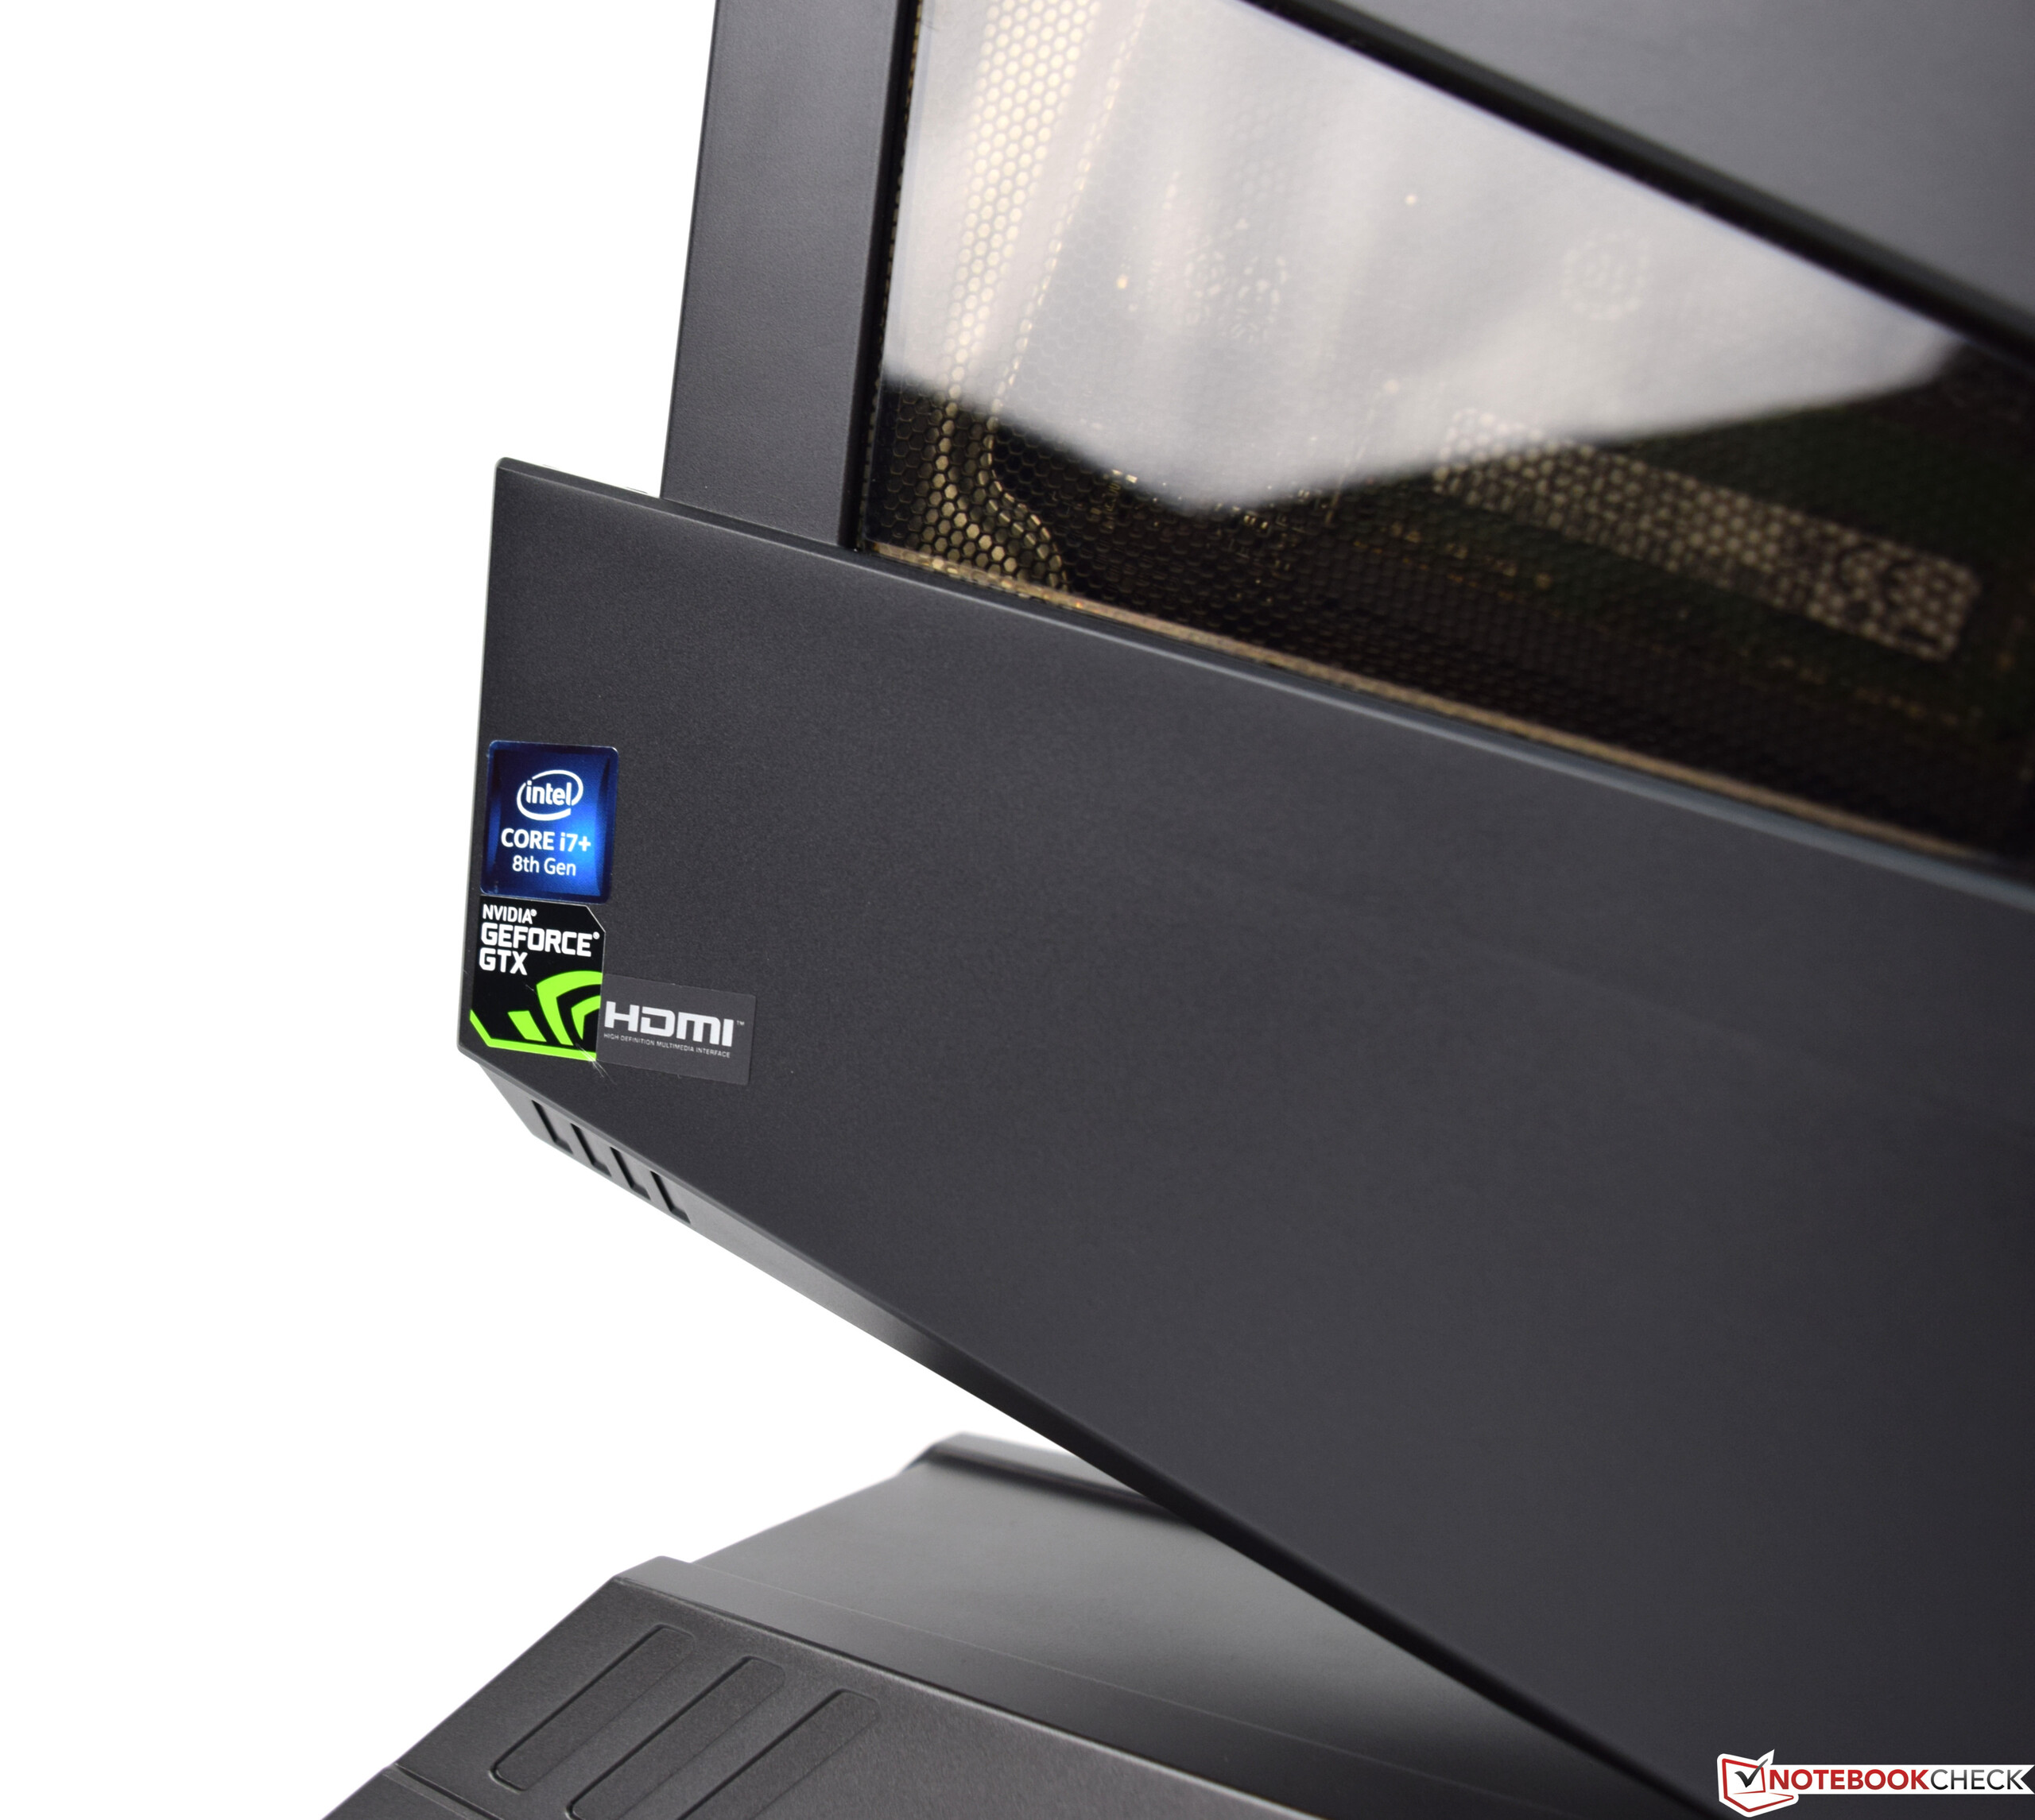
The Aegis 3 8RD is a desktop PC that MSI has designed primarily for gaming, something which is reinforced by the hardware used. Our test machine has an Intel Core i7-8700 processor and an Nvidia GeForce GTX 1070 GPU. The combination worked well in our tests and scored highly in benchmarks. However, the machine will not play all modern games comfortably at 4K, which is a pity given its US$1,500/US$1,600 cost. Overall, the Aegis 3 8RD performed as we expected during testing.
Processor
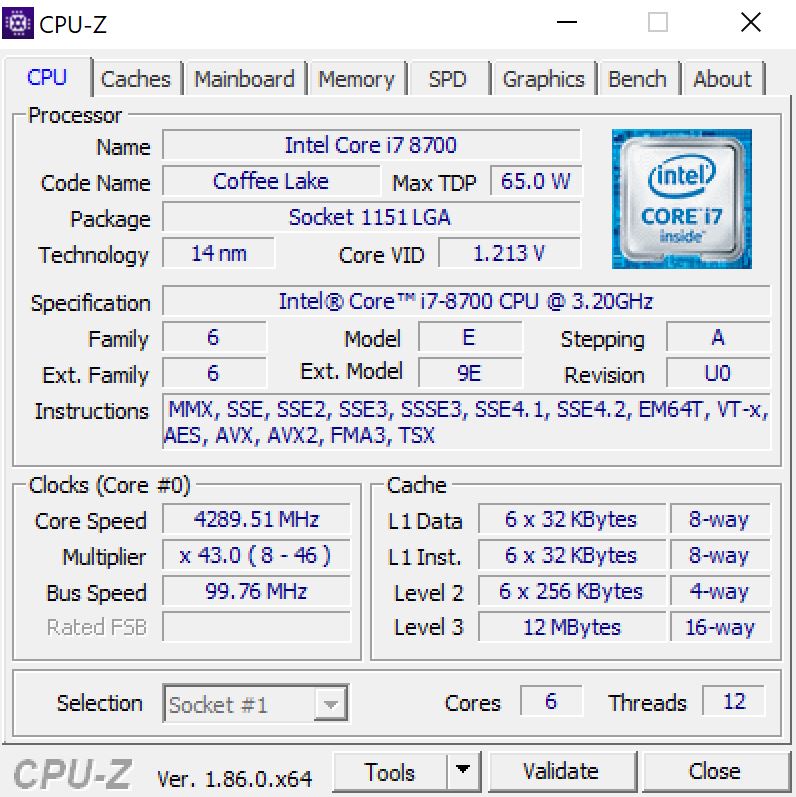
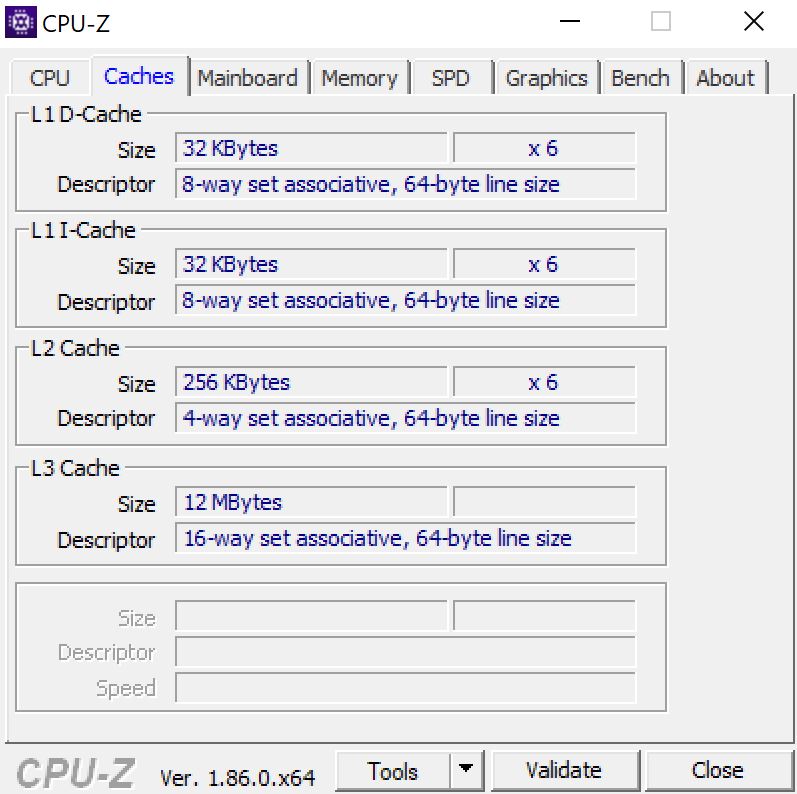
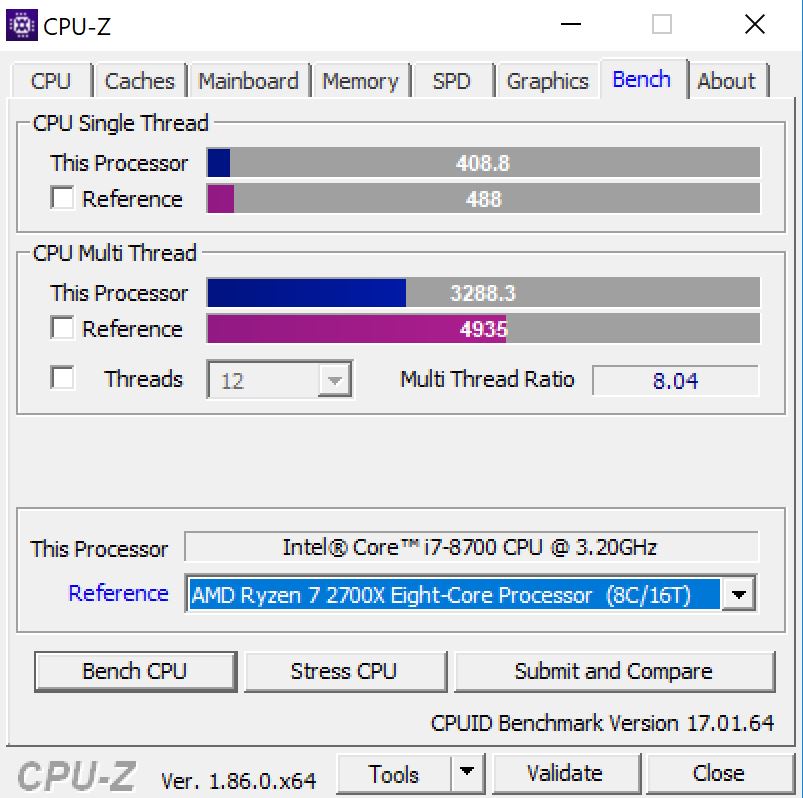
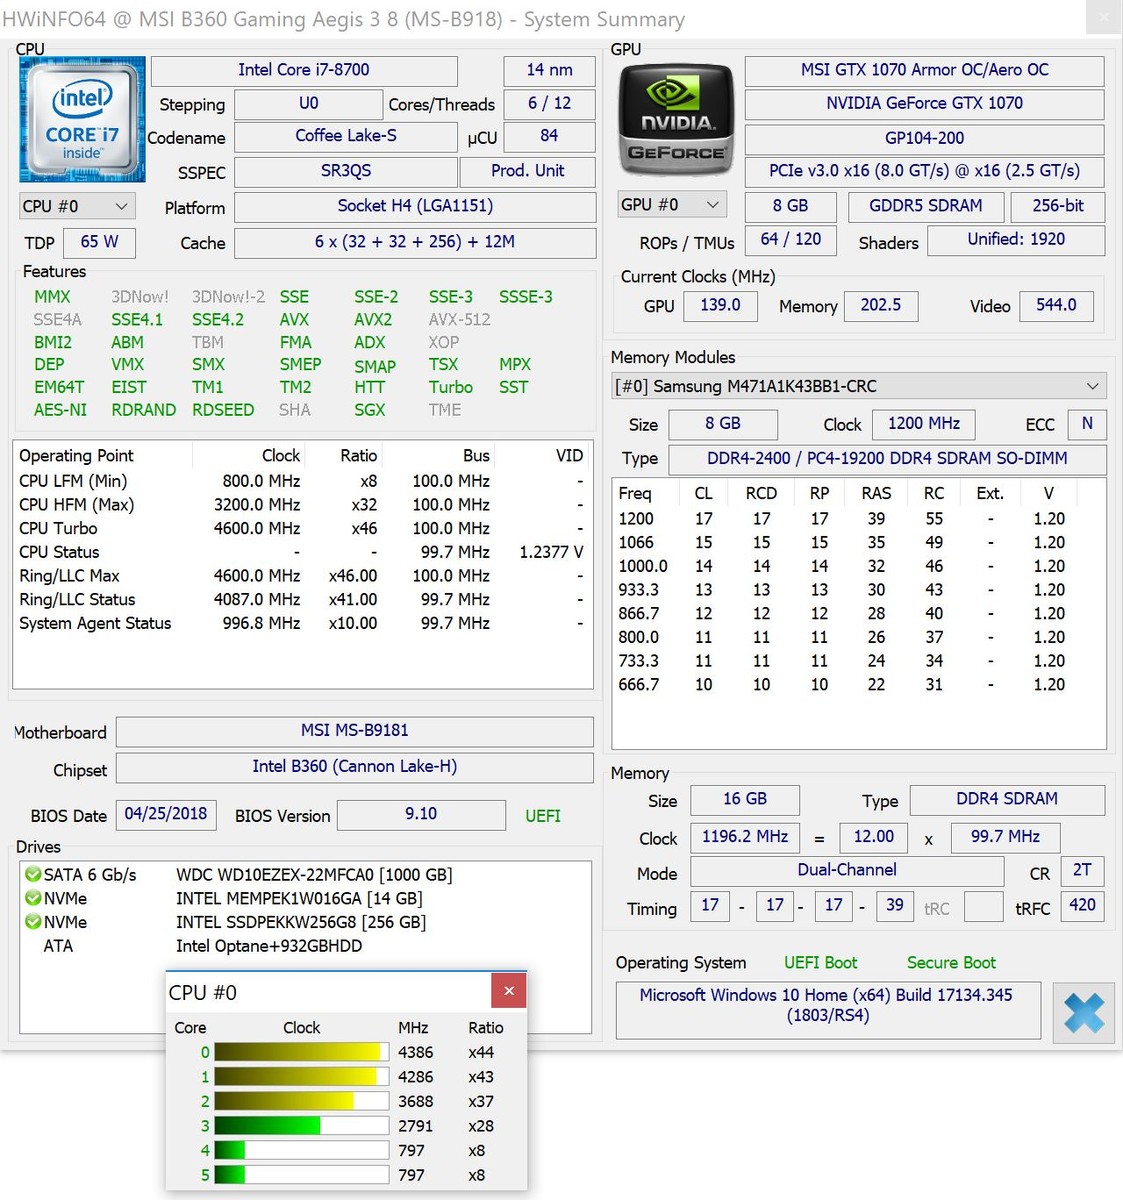
MSI equips the Aegis 3 8RD with an Intel Core i7-8700 processor, which has six cores that support up to 12 threads simultaneously. The Coffee Lake SoC has a 65 W thermal design power (TDP) and a 3.2 GHz base clock that can clock up to 4.3 GHz on all cores or 4.6 GHz on a single core thanks to Intel Turbo Boost technology. The Core i7-8700 is effectively a lower-clocked and multiplier-locked version of the Core i7-8700K.
Correspondingly, the Core i7-8700 sits behind the Core i7-8700K in our benchmark comparison tables. The Core i7-8700 compares directly with the AMD Ryzen 5 2600 because both are hexa-core processors that support up to 12 threads and have a 65 W TDP. Overall, the Core i7-8700 scores around 10% higher than the Ryzen 5 2600 in our benchmarks, while the more-powerful Ryzen 7 2700 sometimes finished below the Intel CPU too.
However, the Ryzen 7 2700 APU outscored the Core i7-8700 by 32% in a looped Cinebench R15 multi-core benchmark. The Ryzen 5 2600 even outscores the CPU in our test machine by 8% despite having the same core count, thread count and TDP. By contrast, the Core i7-8700 finished well clear of its AMD competition in the single-core benchmark, which is what Intel CPUs often manage to do.
| Performance Rating - Percent | |
| AMD Ryzen Threadripper 2950X | |
| AMD Ryzen Threadripper 1950X | |
| AMD Ryzen 7 2700X -1! | |
| Intel Core i7-8700 | |
| AMD Ryzen 5 2600X -1! | |
| Intel Core i7-8700K -2! | |
| AMD Ryzen 7 2700 | |
| AMD Ryzen 5 2600 | |
| Intel Core i5-8500T | |
| Cinebench R15 | |
| CPU Single 64Bit | |
| Intel Core i7-8700K | |
| Intel Core i7-8700 | |
| AMD Ryzen 7 2700X | |
| AMD Ryzen Threadripper 2950X | |
| AMD Ryzen 5 2600X | |
| AMD Ryzen 7 2700 | |
| AMD Ryzen Threadripper 1950X | |
| AMD Ryzen 5 2600 | |
| Intel Core i5-8500T | |
| CPU Multi 64Bit | |
| AMD Ryzen Threadripper 2950X | |
| AMD Ryzen Threadripper 1950X | |
| AMD Ryzen 7 2700X | |
| AMD Ryzen 7 2700 | |
| Intel Core i7-8700K | |
| AMD Ryzen 5 2600X | |
| AMD Ryzen 5 2600 | |
| Intel Core i7-8700 | |
| Intel Core i5-8500T | |
| Cinebench R11.5 | |
| CPU Multi 64Bit | |
| AMD Ryzen Threadripper 2950X | |
| AMD Ryzen Threadripper 1950X | |
| AMD Ryzen 7 2700X | |
| AMD Ryzen 7 2700 | |
| Intel Core i7-8700K | |
| AMD Ryzen 5 2600X | |
| AMD Ryzen 5 2600 | |
| Intel Core i7-8700 | |
| Intel Core i5-8500T | |
| CPU Single 64Bit | |
| Intel Core i7-8700K | |
| Intel Core i7-8700 | |
| AMD Ryzen 7 2700X | |
| AMD Ryzen Threadripper 2950X | |
| AMD Ryzen 5 2600X | |
| AMD Ryzen 7 2700 | |
| AMD Ryzen 5 2600 | |
| AMD Ryzen Threadripper 1950X | |
| Intel Core i5-8500T | |
| Blender - v2.79 BMW27 CPU | |
| Intel Core i5-8500T | |
| Intel Core i7-8700 | |
| AMD Ryzen 5 2600 | |
| AMD Ryzen 5 2600X | |
| AMD Ryzen 7 2700 | |
| AMD Ryzen 7 2700X | |
| AMD Ryzen Threadripper 1950X | |
| AMD Ryzen Threadripper 2950X | |
| wPrime 2.10 | |
| 32m | |
| Intel Core i5-8500T | |
| AMD Ryzen 5 2600 | |
| Intel Core i7-8700 | |
| AMD Ryzen 7 2700 | |
| AMD Ryzen 5 2600X | |
| AMD Ryzen Threadripper 2950X | |
| Intel Core i7-8700K | |
| AMD Ryzen 7 2700X | |
| AMD Ryzen Threadripper 1950X | |
| 1024m | |
| Intel Core i5-8500T | |
| Intel Core i7-8700 | |
| AMD Ryzen 5 2600 | |
| AMD Ryzen 5 2600X | |
| AMD Ryzen 7 2700 | |
| Intel Core i7-8700K | |
| AMD Ryzen 7 2700X | |
| AMD Ryzen Threadripper 1950X | |
| AMD Ryzen Threadripper 2950X | |
| HWBOT x265 Benchmark v2.2 - 4k Preset | |
| AMD Ryzen Threadripper 2950X | |
| AMD Ryzen Threadripper 1950X | |
| Intel Core i7-8700 | |
| AMD Ryzen 7 2700 | |
| AMD Ryzen 5 2600 | |
| Intel Core i5-8500T | |
| X264 HD Benchmark 4.0 | |
| Pass 1 | |
| Intel Core i7-8700 | |
| Intel Core i7-8700K | |
| AMD Ryzen 7 2700X | |
| AMD Ryzen 5 2600X | |
| AMD Ryzen 5 2600 | |
| AMD Ryzen Threadripper 2950X | |
| Intel Core i5-8500T | |
| AMD Ryzen 7 2700 | |
| AMD Ryzen Threadripper 1950X | |
| Pass 2 | |
| AMD Ryzen Threadripper 2950X | |
| AMD Ryzen Threadripper 1950X | |
| AMD Ryzen 7 2700X | |
| AMD Ryzen 7 2700 | |
| Intel Core i7-8700K | |
| AMD Ryzen 5 2600X | |
| Intel Core i7-8700 | |
| AMD Ryzen 5 2600 | |
| Intel Core i5-8500T | |
| WinRAR - Result | |
| Intel Core i7-8700K | |
| Intel Core i7-8700 | |
| AMD Ryzen 7 2700X | |
| AMD Ryzen 5 2600X | |
| AMD Ryzen Threadripper 2950X | |
| AMD Ryzen 5 2600 | |
| AMD Ryzen 7 2700 | |
| Intel Core i5-8500T | |
| AMD Ryzen Threadripper 1950X | |
| TrueCrypt | |
| AES Mean 100MB | |
| AMD Ryzen Threadripper 2950X | |
| AMD Ryzen Threadripper 1950X | |
| AMD Ryzen 7 2700X | |
| AMD Ryzen 7 2700 | |
| Intel Core i7-8700K | |
| AMD Ryzen 5 2600X | |
| Intel Core i7-8700 | |
| AMD Ryzen 5 2600 | |
| Intel Core i5-8500T | |
| Twofish Mean 100MB | |
| AMD Ryzen Threadripper 1950X | |
| AMD Ryzen Threadripper 2950X | |
| AMD Ryzen 7 2700X | |
| Intel Core i7-8700K | |
| AMD Ryzen 7 2700 | |
| Intel Core i7-8700 | |
| AMD Ryzen 5 2600X | |
| AMD Ryzen 5 2600 | |
| Intel Core i5-8500T | |
| Serpent Mean 100MB | |
| AMD Ryzen Threadripper 1950X | |
| AMD Ryzen Threadripper 2950X | |
| AMD Ryzen 7 2700X | |
| AMD Ryzen 7 2700 | |
| Intel Core i7-8700 | |
| Intel Core i7-8700K | |
| AMD Ryzen 5 2600X | |
| AMD Ryzen 5 2600 | |
| Intel Core i5-8500T | |
| Geekbench 4.4 | |
| 64 Bit Single-Core Score | |
| Intel Core i7-8700K | |
| Intel Core i7-8700 | |
| AMD Ryzen 7 2700X | |
| AMD Ryzen Threadripper 2950X | |
| AMD Ryzen 5 2600X | |
| AMD Ryzen 7 2700 | |
| AMD Ryzen 5 2600 | |
| Intel Core i5-8500T | |
| AMD Ryzen Threadripper 1950X | |
| 64 Bit Multi-Core Score | |
| AMD Ryzen Threadripper 2950X | |
| AMD Ryzen Threadripper 1950X | |
| AMD Ryzen 7 2700X | |
| Intel Core i7-8700K | |
| Intel Core i7-8700 | |
| AMD Ryzen 7 2700 | |
| AMD Ryzen 5 2600X | |
| AMD Ryzen 5 2600 | |
| Intel Core i5-8500T | |
* ... smaller is better
Cinebench R15 multithreaded benchmark loop
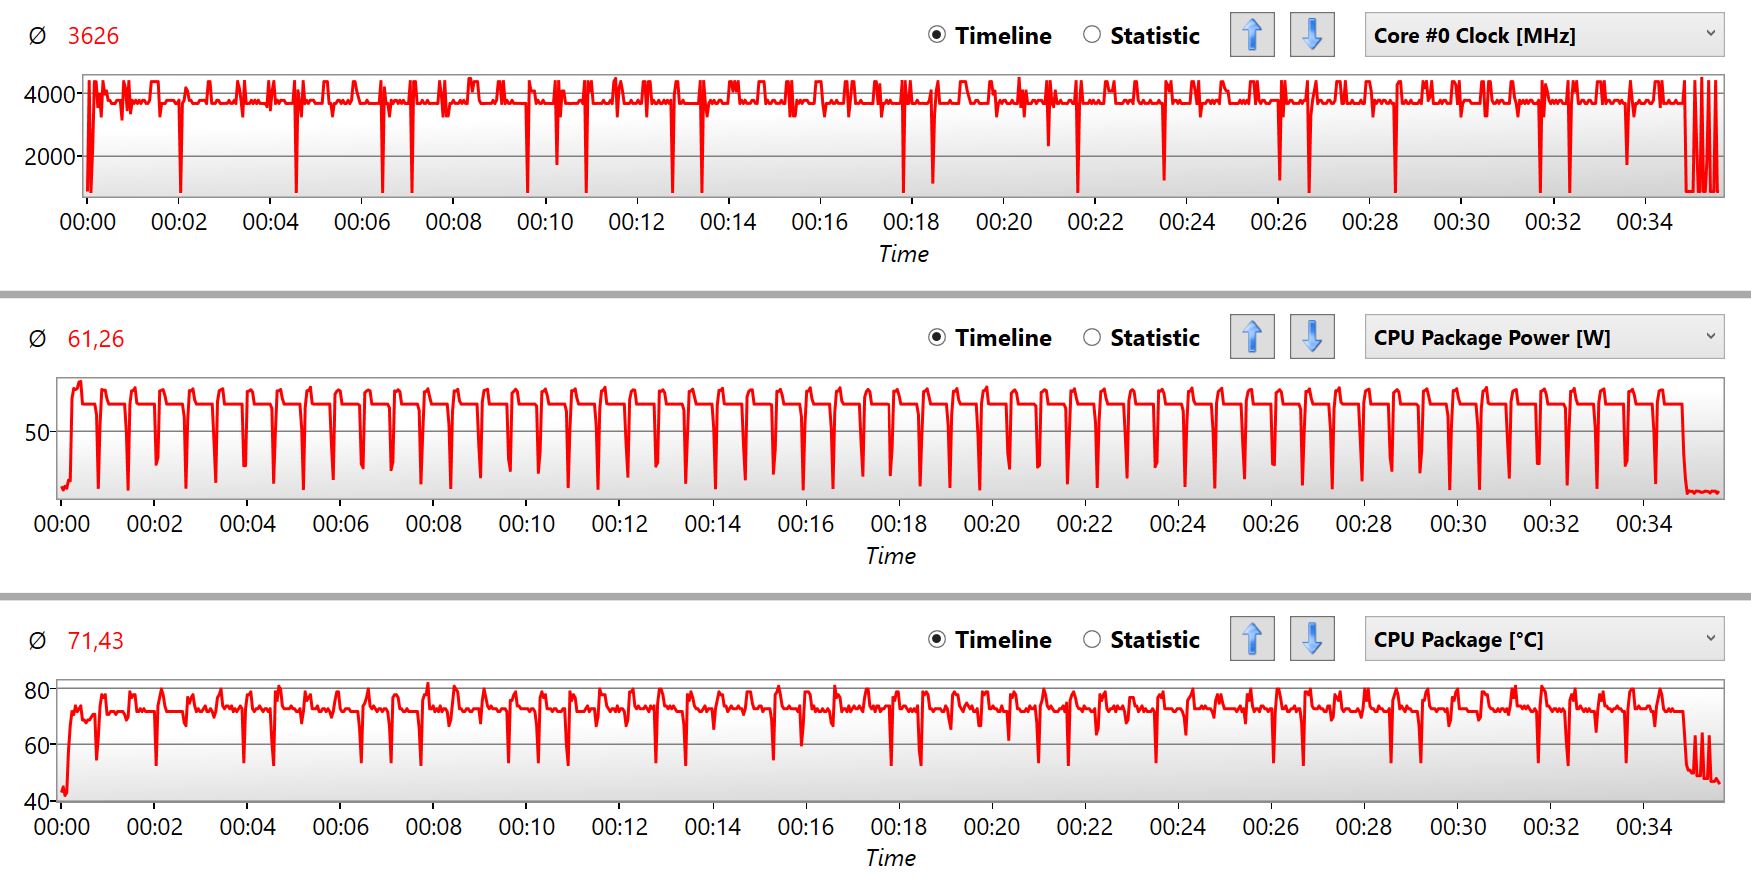
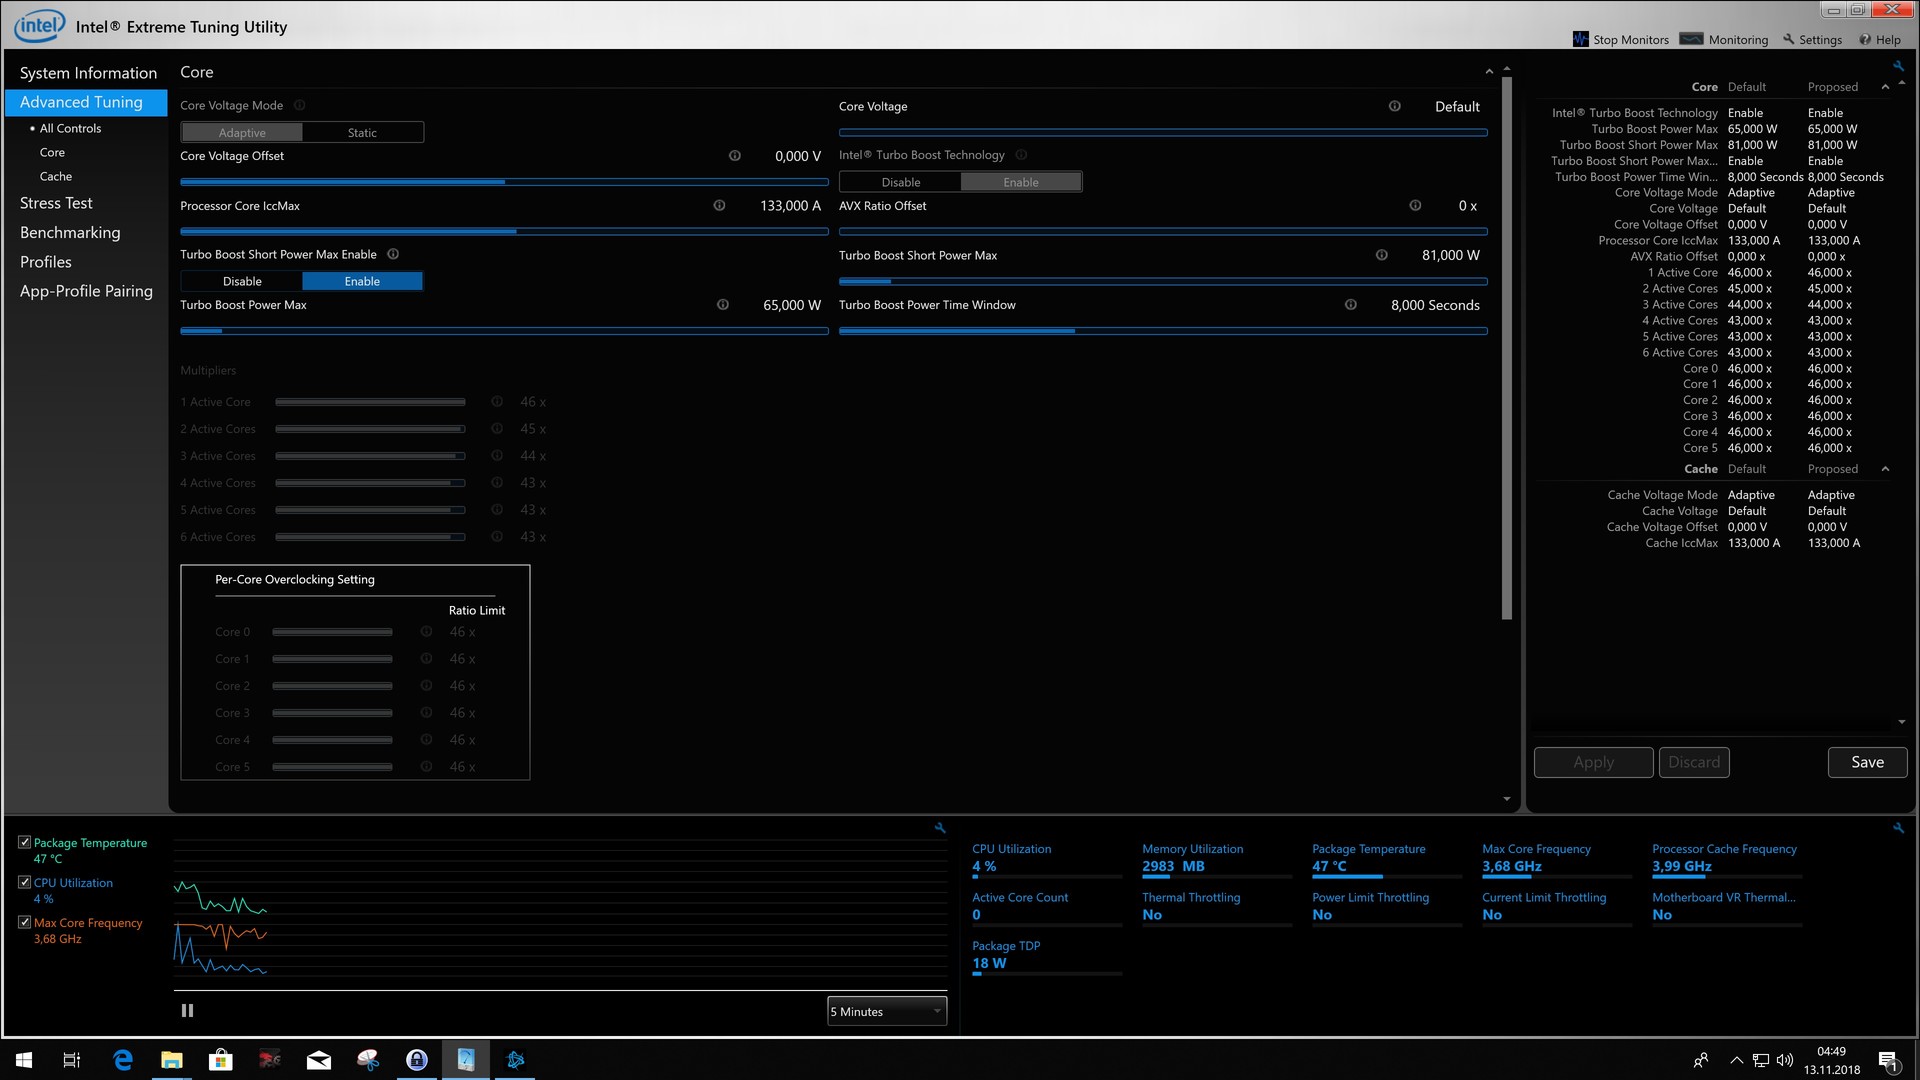
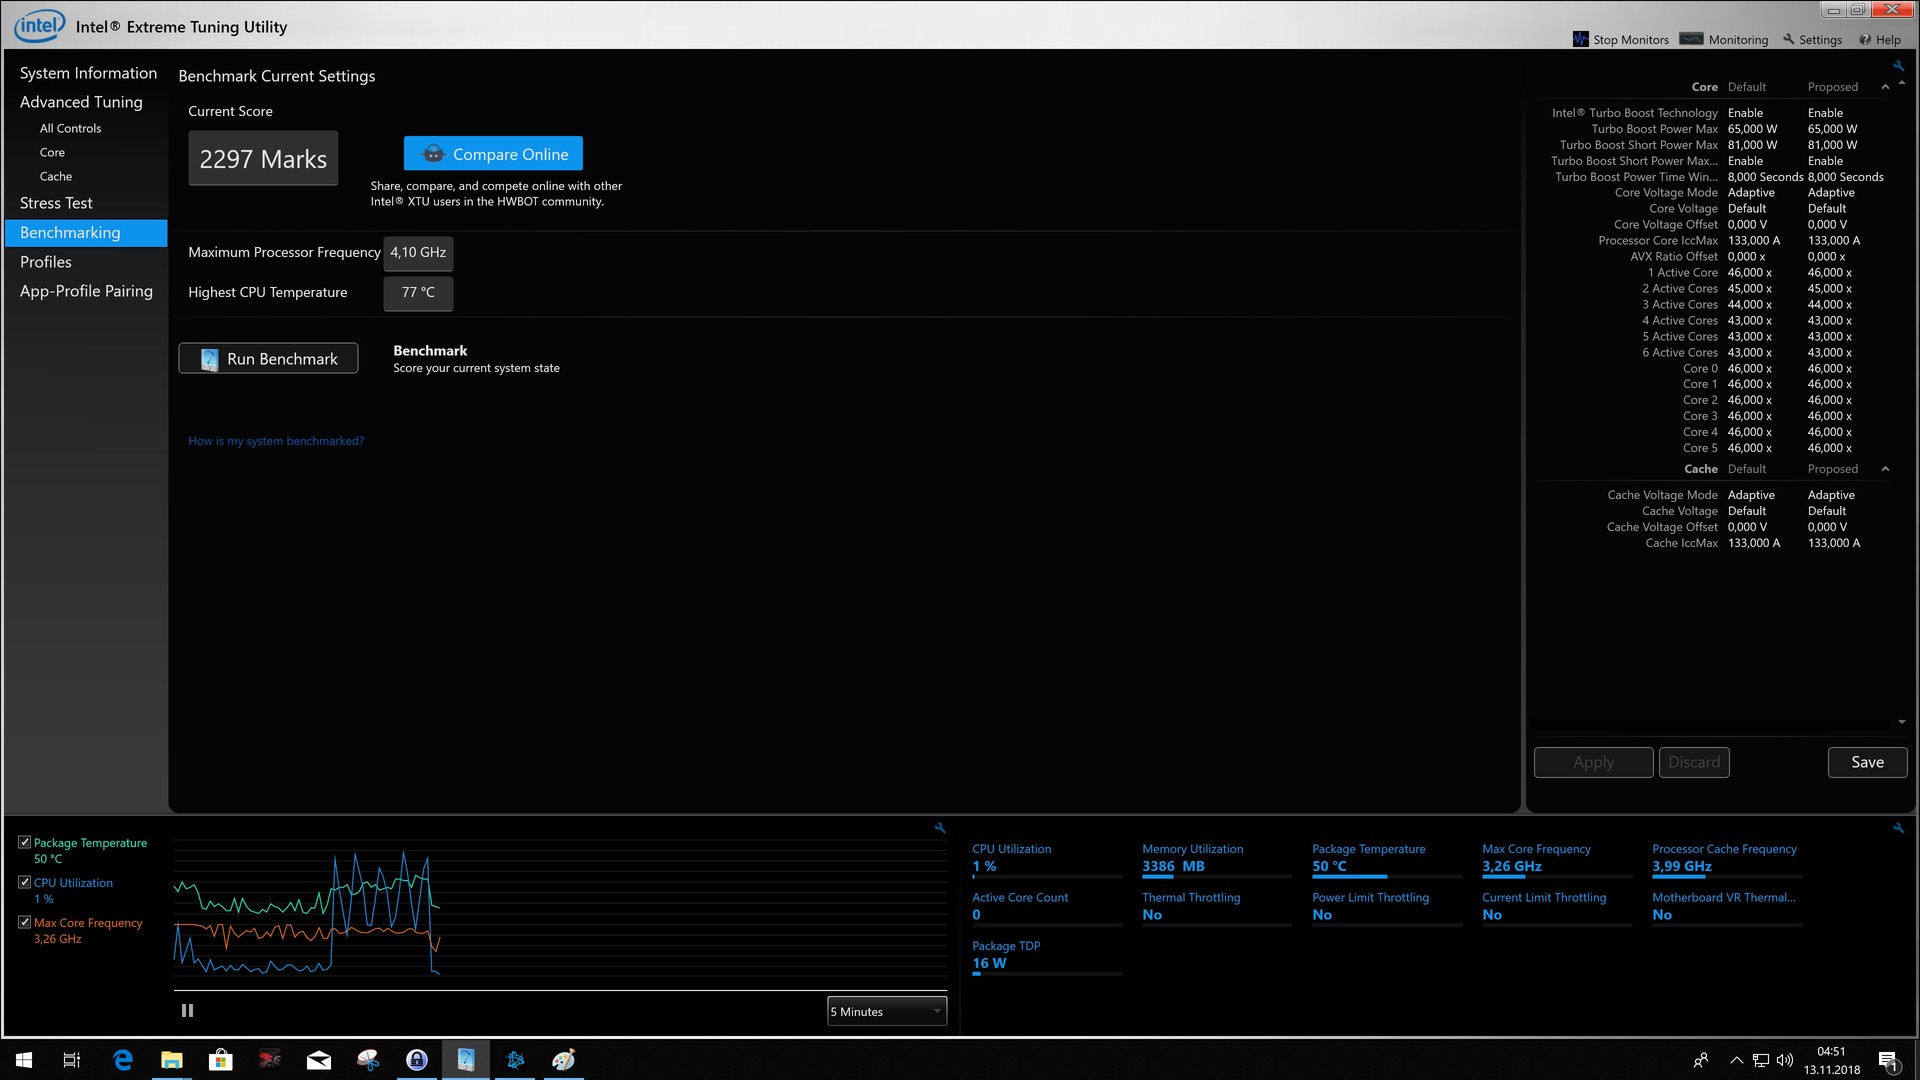
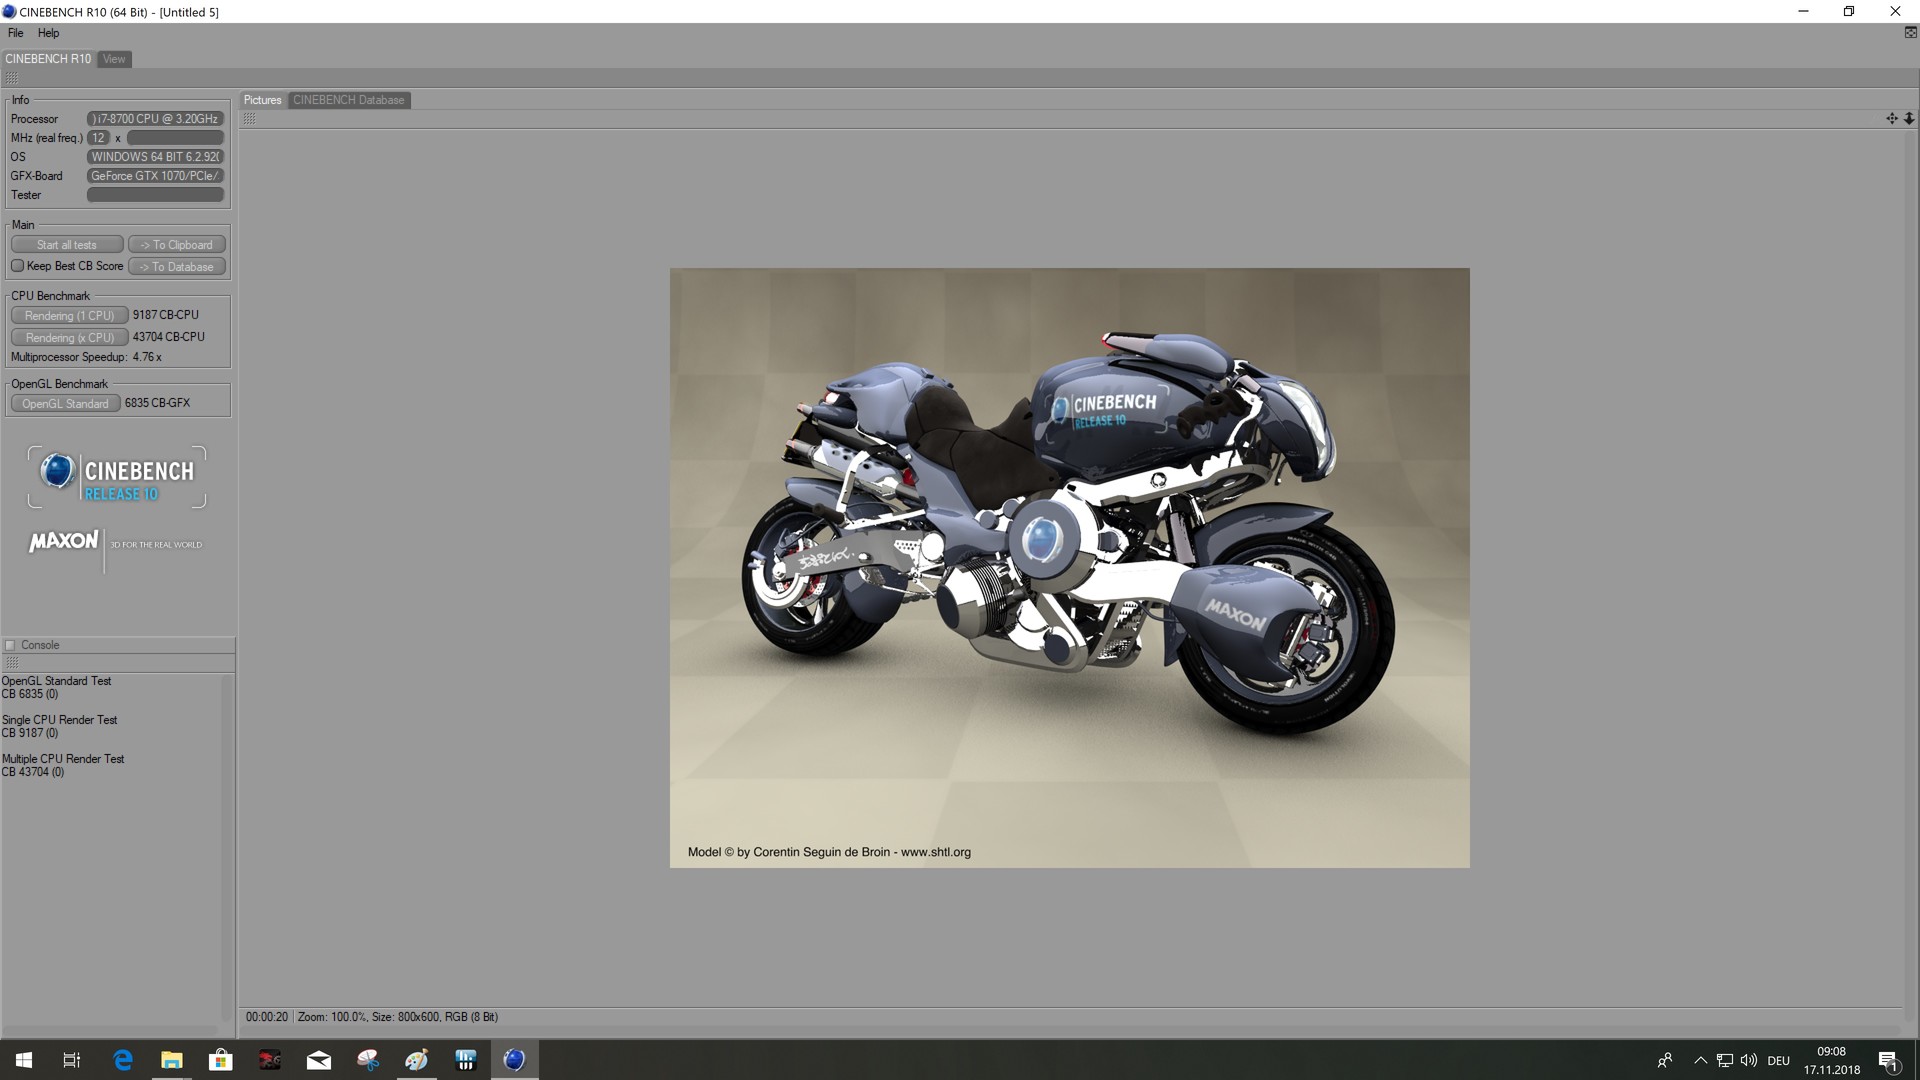
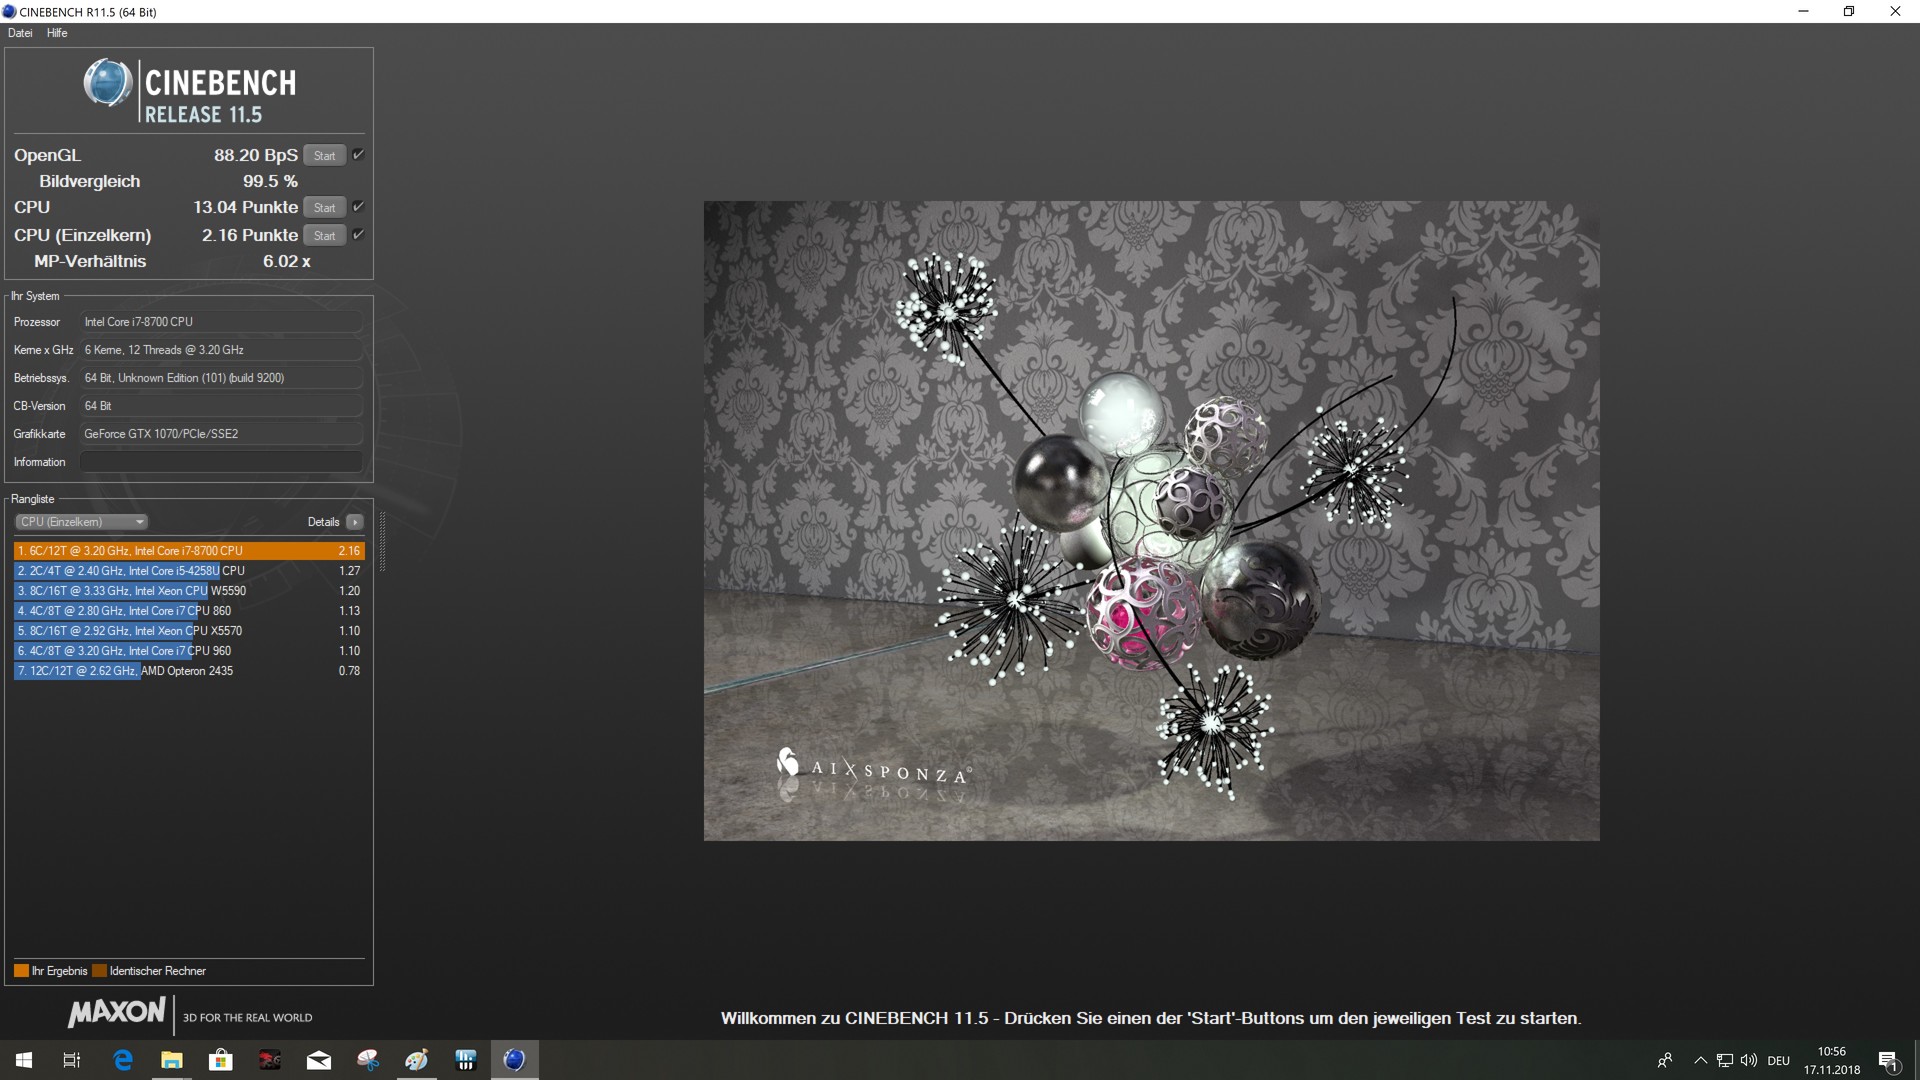
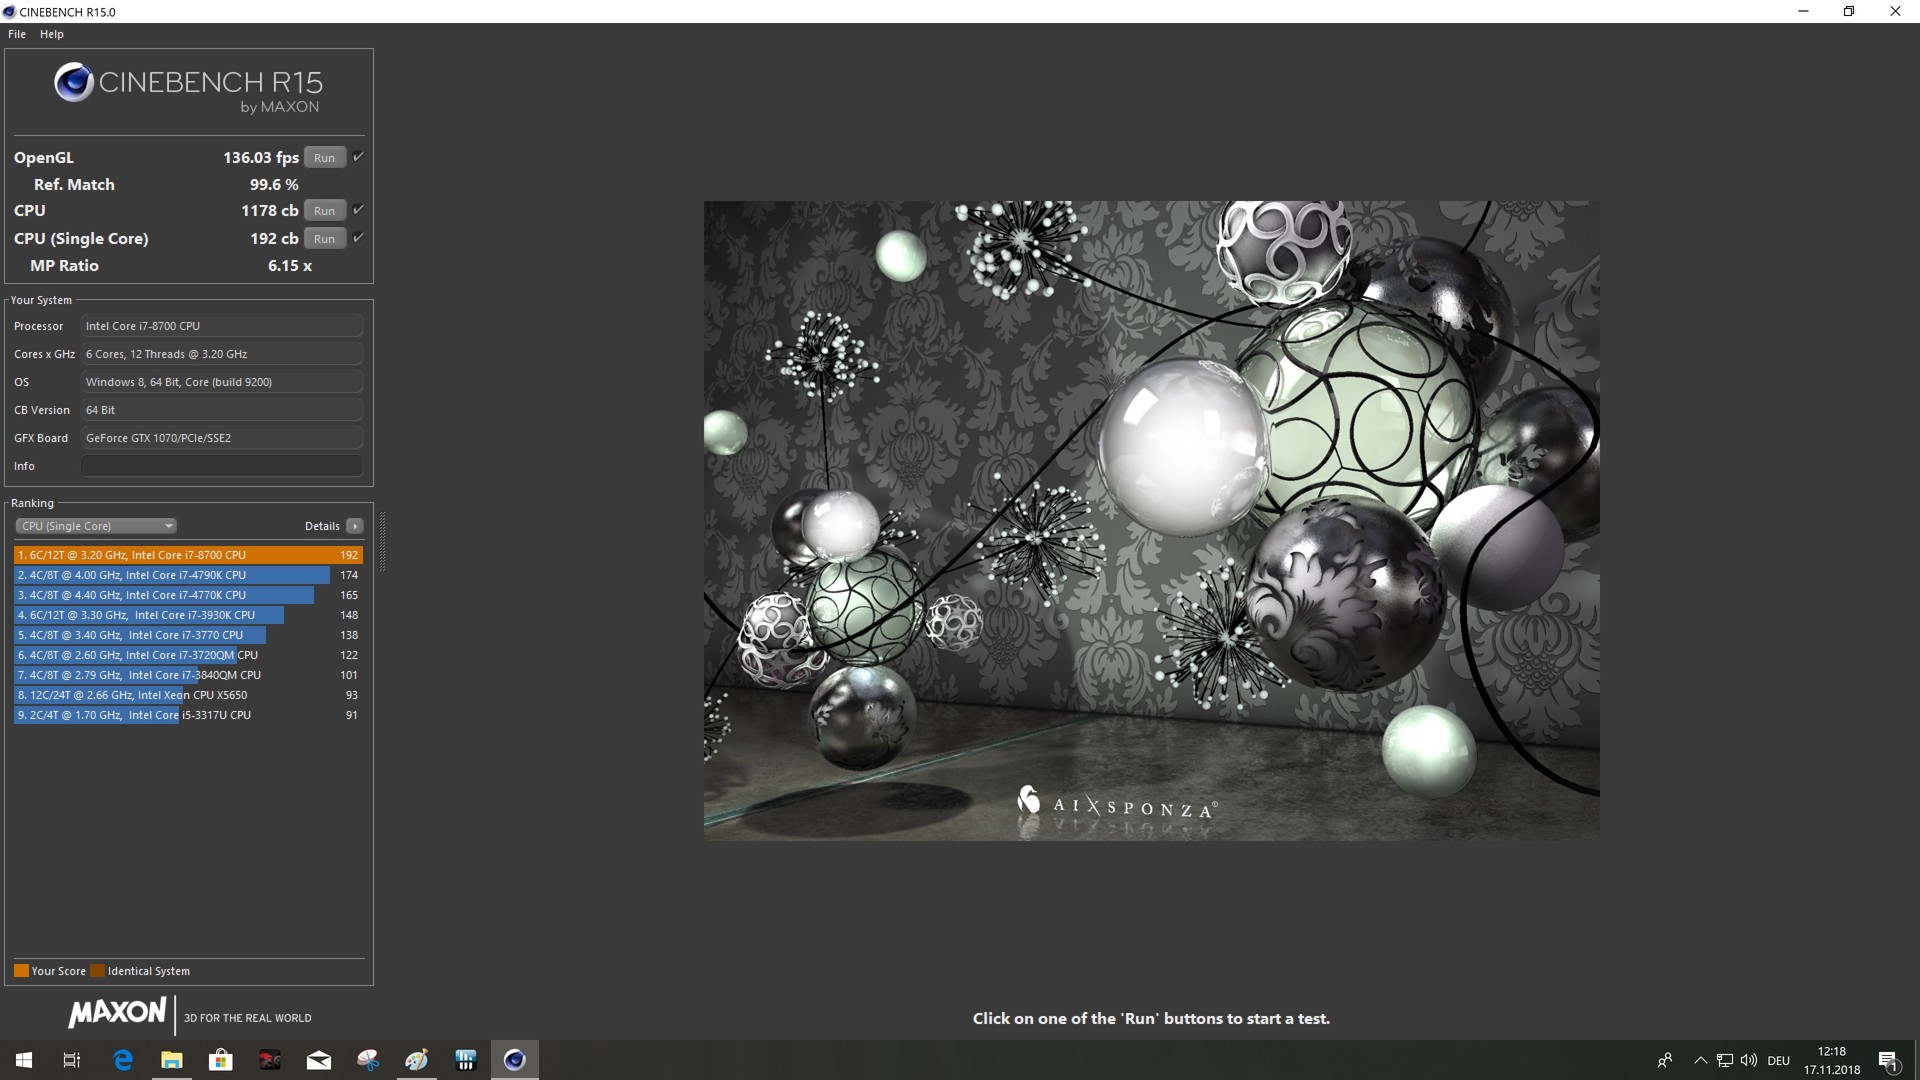
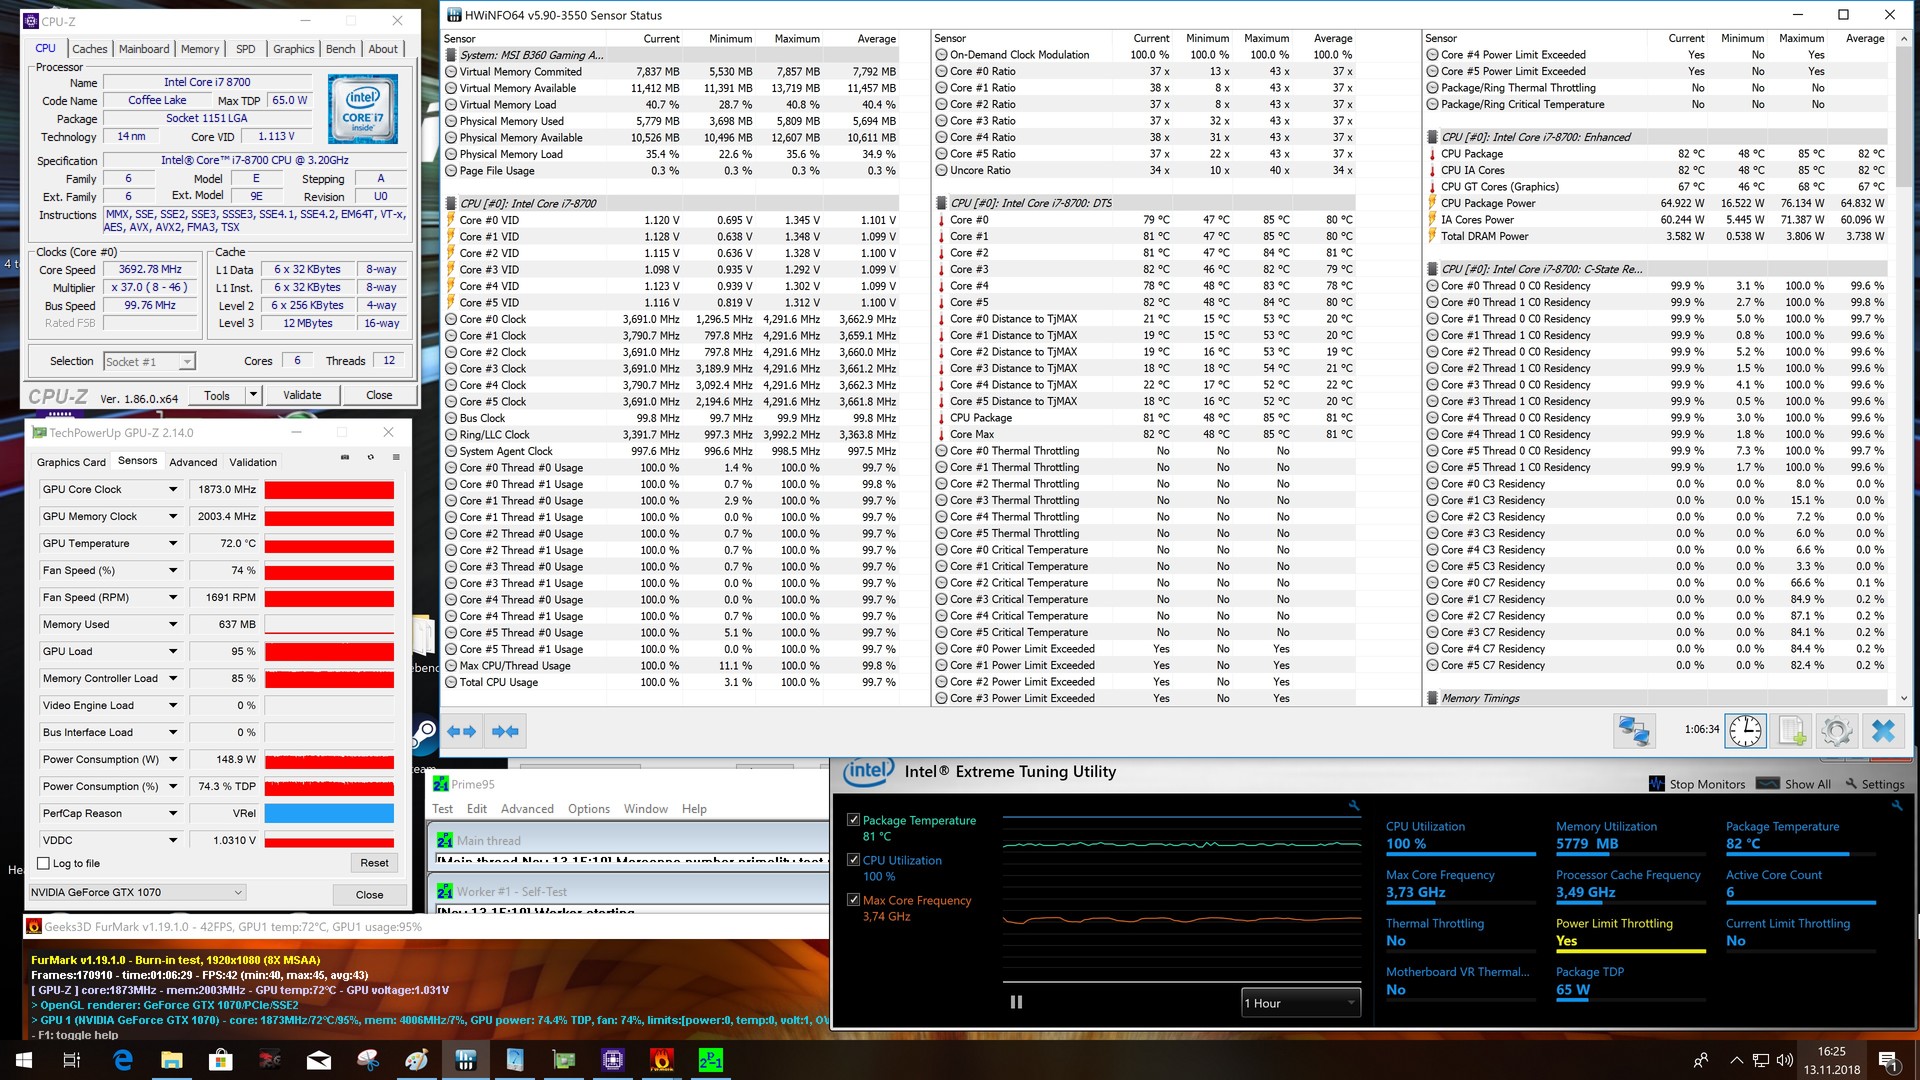
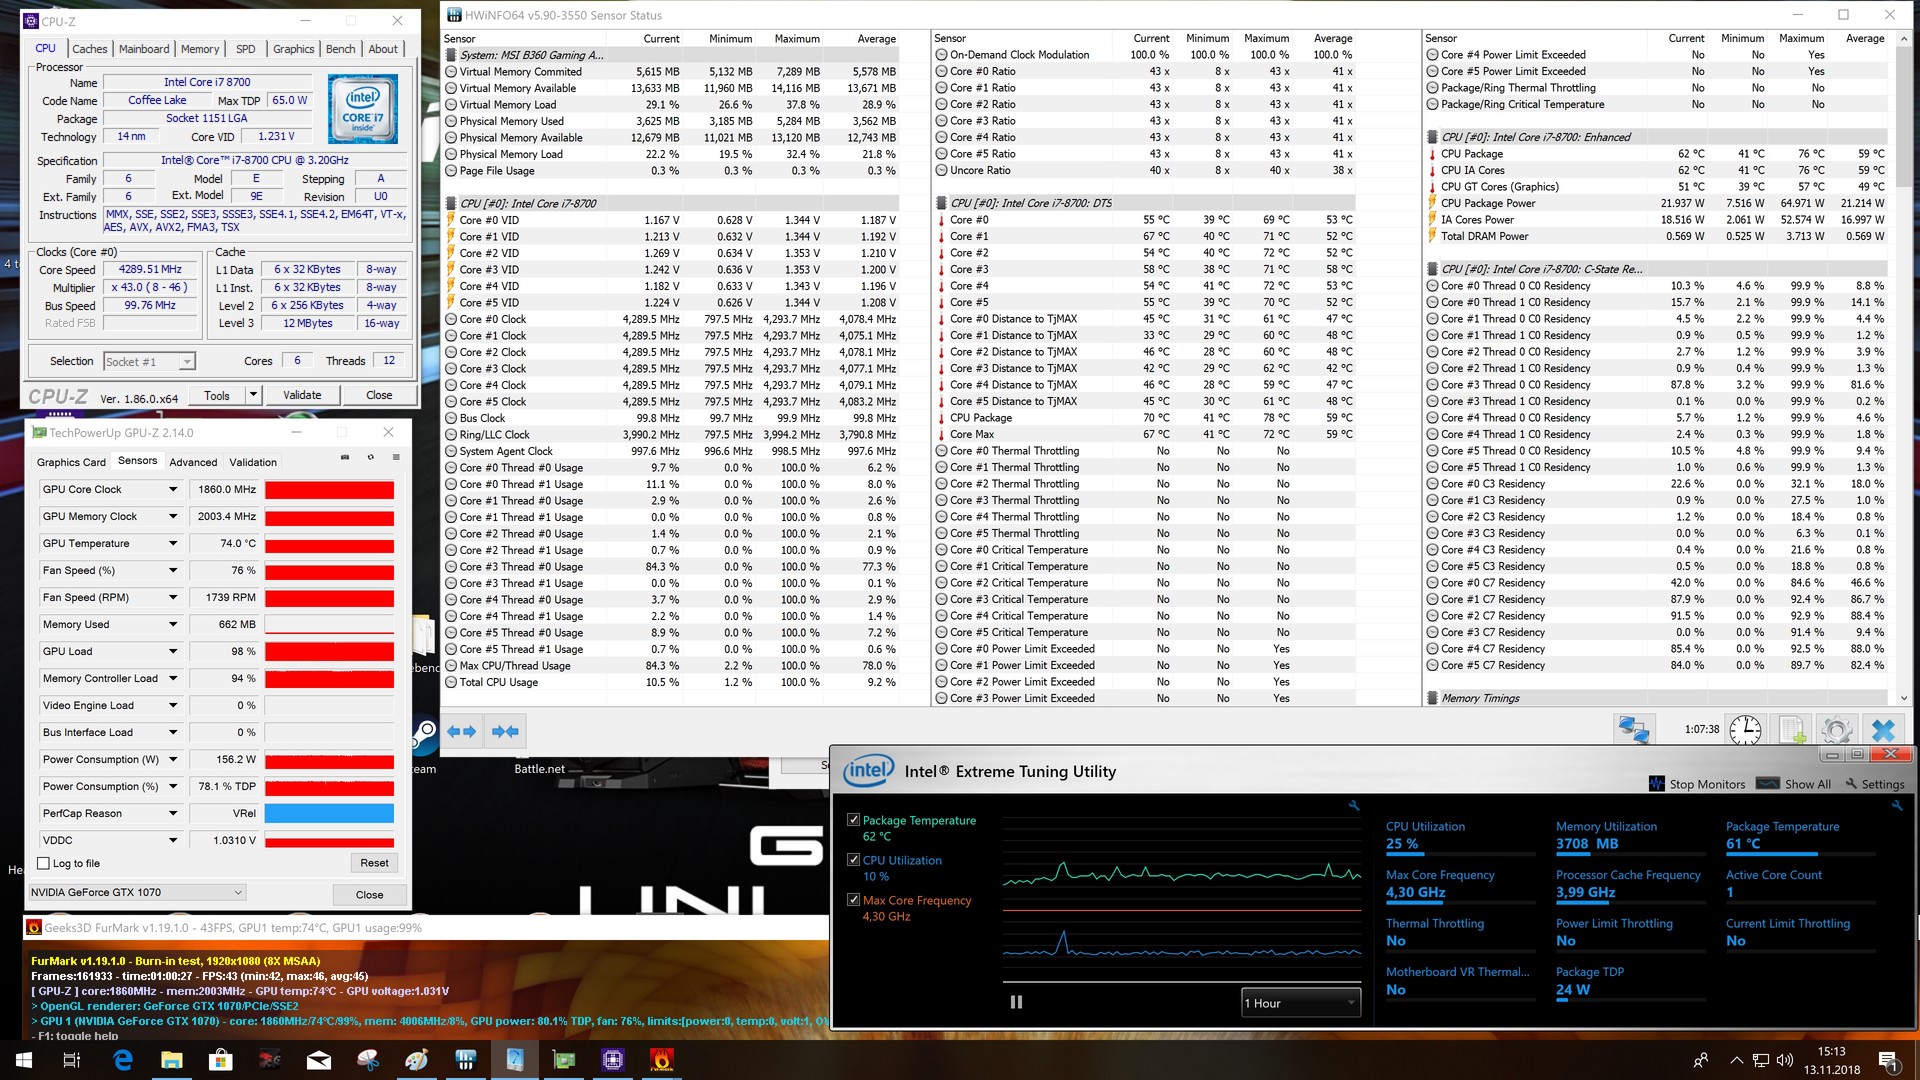
We ran a looped Cinebench R15 multithreaded benchmark to determine how well the CPU performed under sustained load. Our test machine performed largely consistently in the benchmark loop, scoring 1,199 points initially before dropping to an average of around 1,169 points. This represents a 3% drop in performance, which does not count as thermal throttling in our opinion. Hence, MSI has developed a solid cooling solution, which is supported by our core temperature results. The Core i7-8700 averaged 71.4 °C during the looped multi-core benchmark and consistently consumed around 61 W. The CPU also started each benchmark run at 4.3 GHz across all cores before dropping to just 4.0 GHz after eight seconds, during which time it consumed up to 81 W.
System Performance
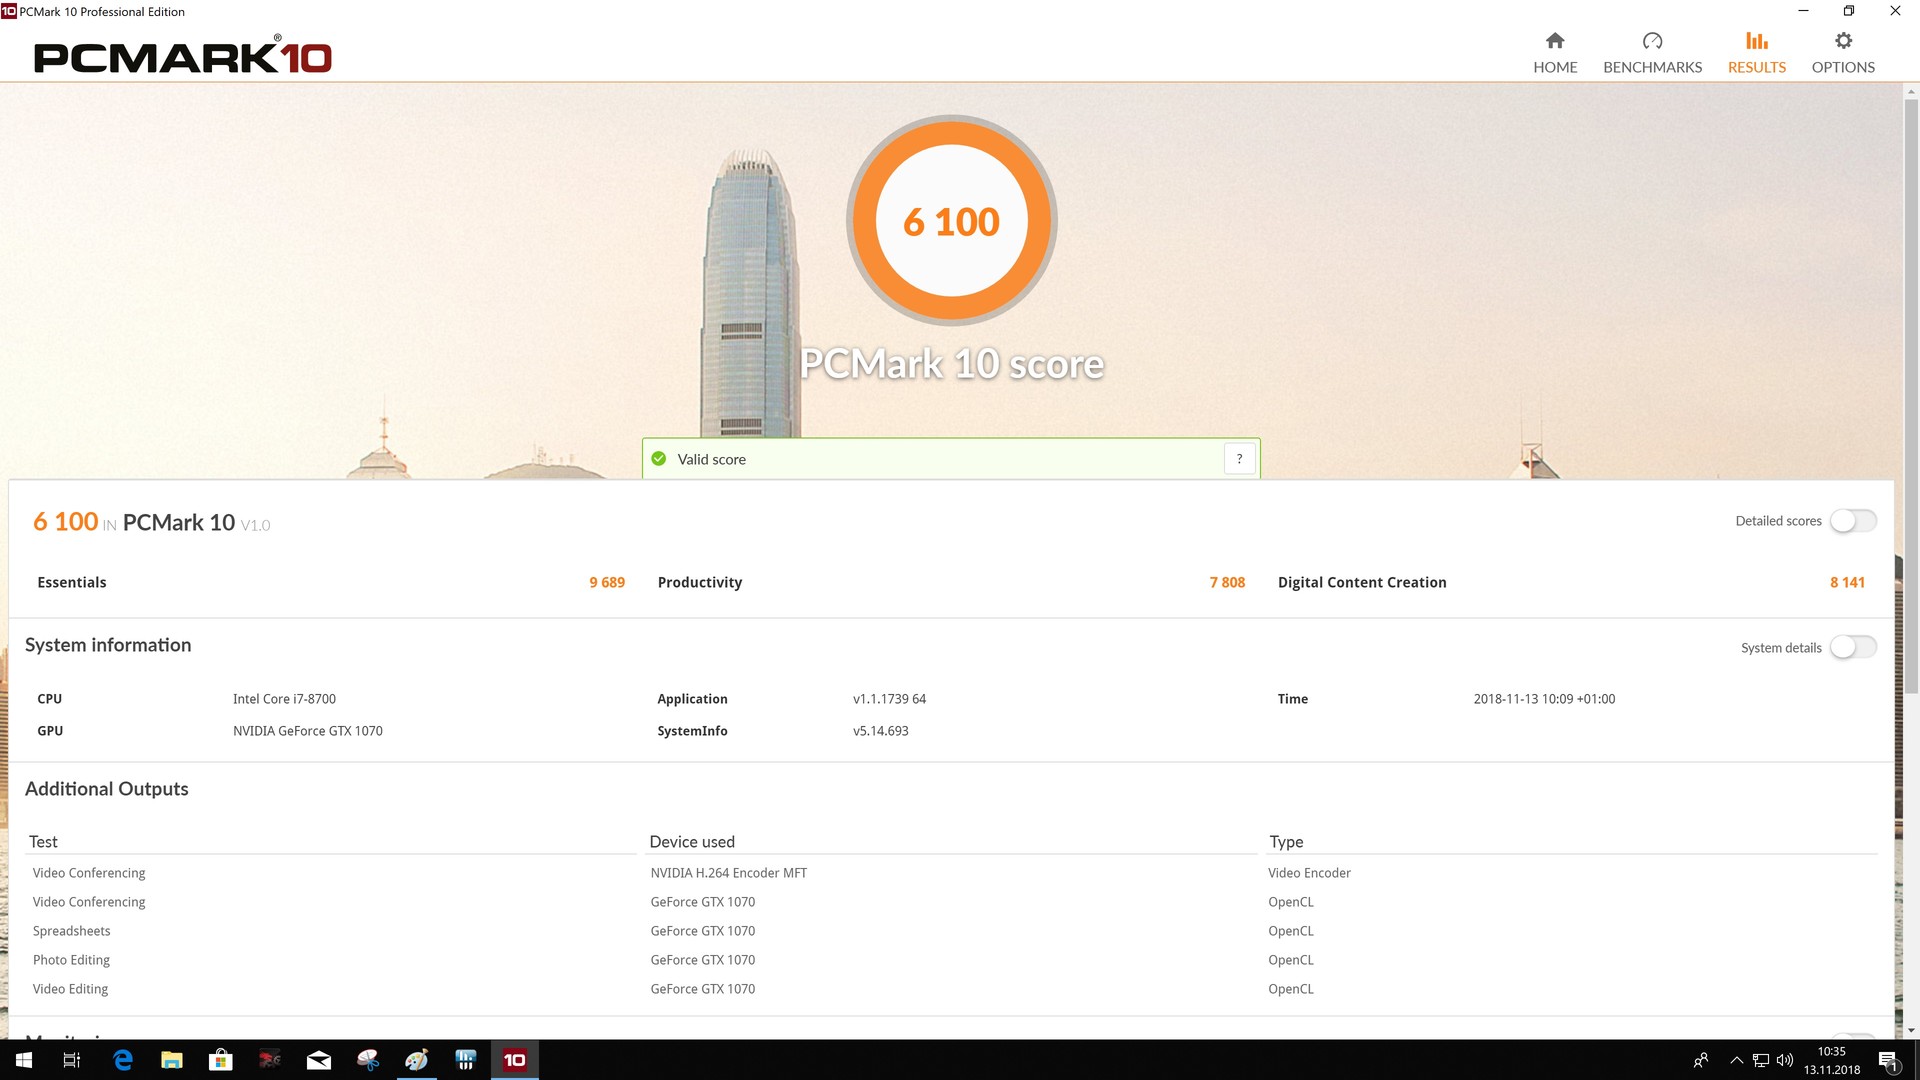
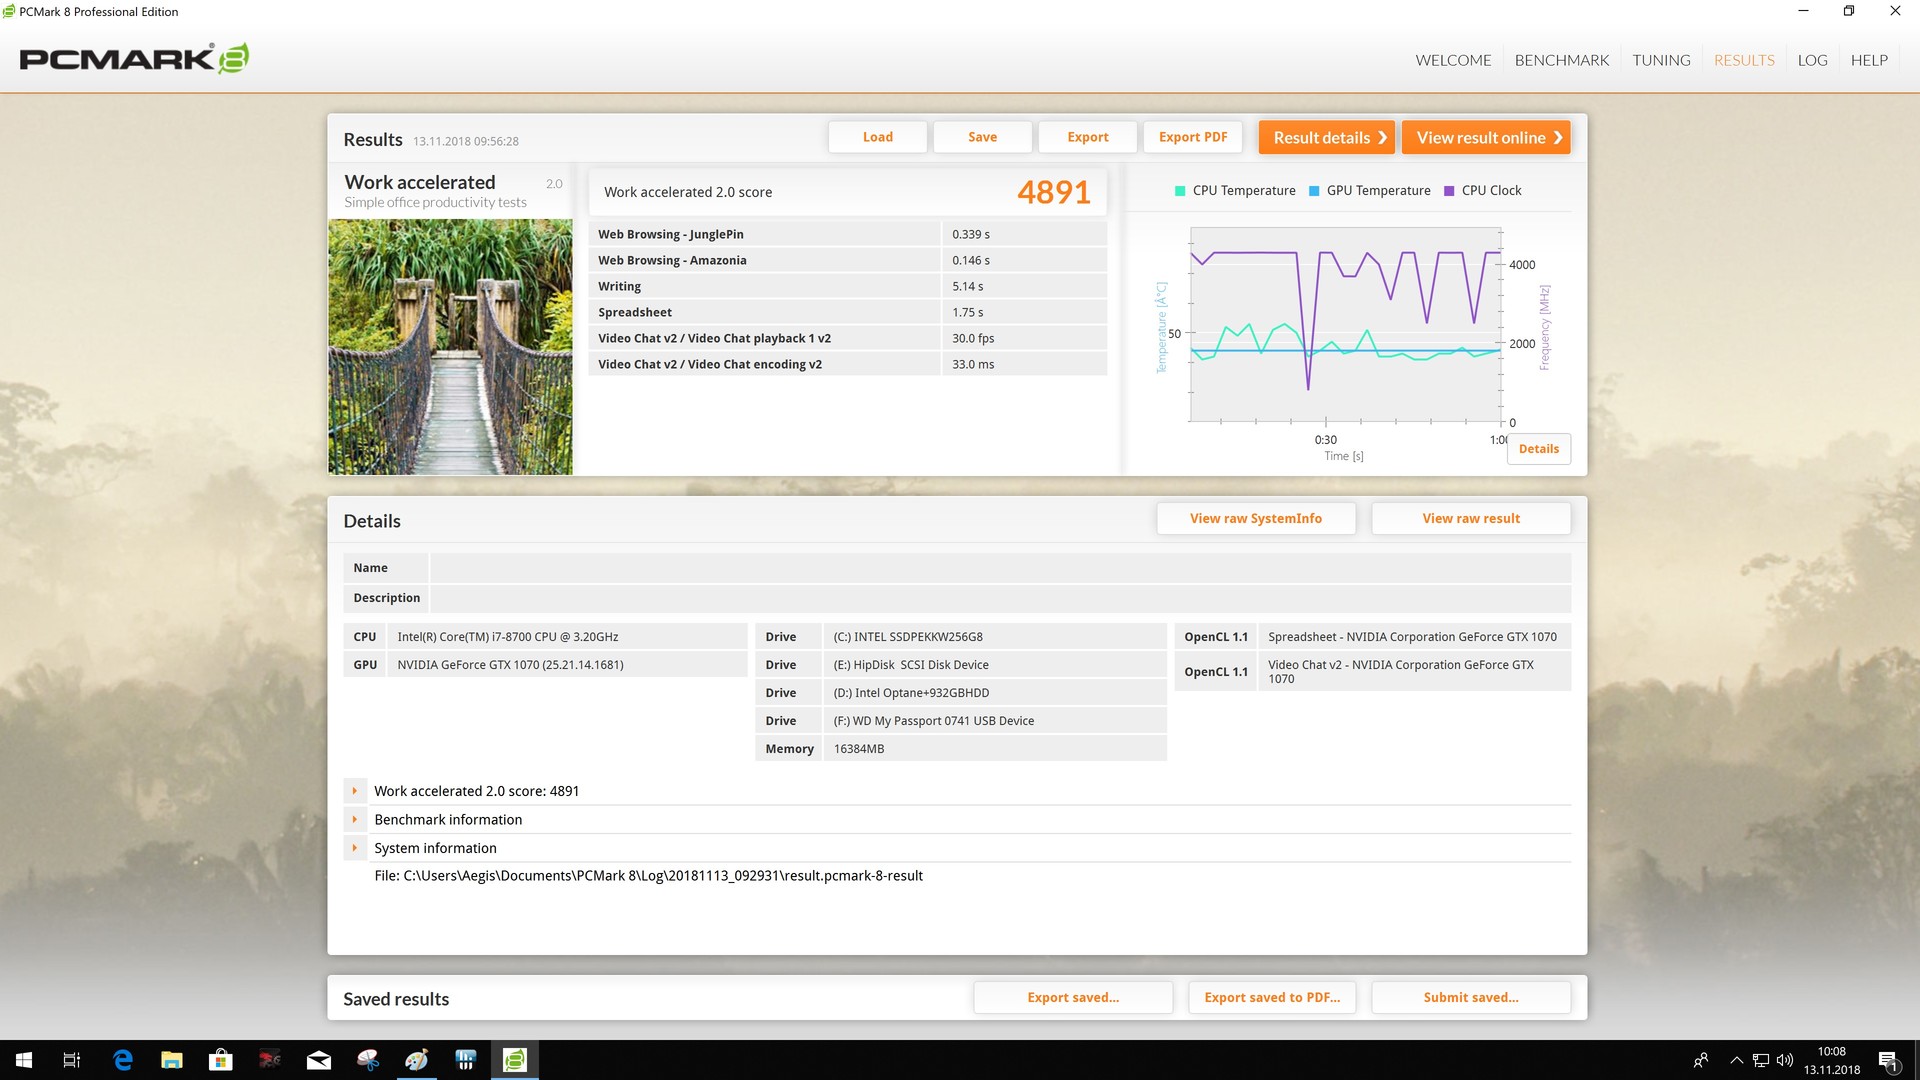
Our test machine performed well in system performance benchmarks too, although all our AMD comparison APUs scored higher overall in PCMark 10. Nevertheless, the Aegis 3 8RD is powerful enough for photo- and video-editing or other computationally intense tasks. The Intel Optane memory should drastically shorten load or render times.
| PCMark 10 | |
| Score | |
| AMD Ryzen 7 2700X | |
| AMD Ryzen Threadripper 2950X | |
| AMD Ryzen 5 2600X | |
| AMD Ryzen Threadripper 1950X | |
| AMD Ryzen 7 2700 | |
| AMD Ryzen 5 2600 | |
| Intel Core i7-8700K | |
| Intel Core i7-8700 | |
| Intel Core i5-8500T | |
| Essentials | |
| Intel Core i7-8700 | |
| Intel Core i7-8700K | |
| AMD Ryzen 7 2700X | |
| AMD Ryzen 5 2600X | |
| AMD Ryzen 7 2700 | |
| Intel Core i5-8500T | |
| AMD Ryzen 5 2600 | |
| AMD Ryzen Threadripper 1950X | |
| AMD Ryzen Threadripper 2950X | |
| Productivity | |
| AMD Ryzen 7 2700X | |
| AMD Ryzen 5 2600X | |
| Intel Core i7-8700K | |
| Intel Core i7-8700 | |
| AMD Ryzen Threadripper 2950X | |
| Intel Core i5-8500T | |
| AMD Ryzen 7 2700 | |
| AMD Ryzen Threadripper 1950X | |
| AMD Ryzen 5 2600 | |
| Digital Content Creation | |
| AMD Ryzen Threadripper 1950X | |
| Intel Core i7-8700K | |
| AMD Ryzen Threadripper 2950X | |
| AMD Ryzen 7 2700X | |
| Intel Core i7-8700 | |
| AMD Ryzen 7 2700 | |
| AMD Ryzen 5 2600X | |
| AMD Ryzen 5 2600 | |
| Intel Core i5-8500T | |
| PCMark 8 | |
| Home Score Accelerated v2 | |
| Intel Core i5-8500T | |
| Intel Core i7-8700 | |
| Intel Core i7-8700K | |
| AMD Ryzen 7 2700X | |
| AMD Ryzen 5 2600X | |
| AMD Ryzen Threadripper 1950X | |
| AMD Ryzen Threadripper 2950X | |
| AMD Ryzen 5 2600 | |
| AMD Ryzen 7 2700 | |
| Work Score Accelerated v2 | |
| Intel Core i5-8500T | |
| AMD Ryzen 7 2700X | |
| Intel Core i7-8700 | |
| Intel Core i7-8700K | |
| AMD Ryzen 5 2600X | |
| AMD Ryzen Threadripper 2950X | |
| AMD Ryzen 7 2700 | |
| AMD Ryzen 5 2600 | |
| AMD Ryzen Threadripper 1950X | |
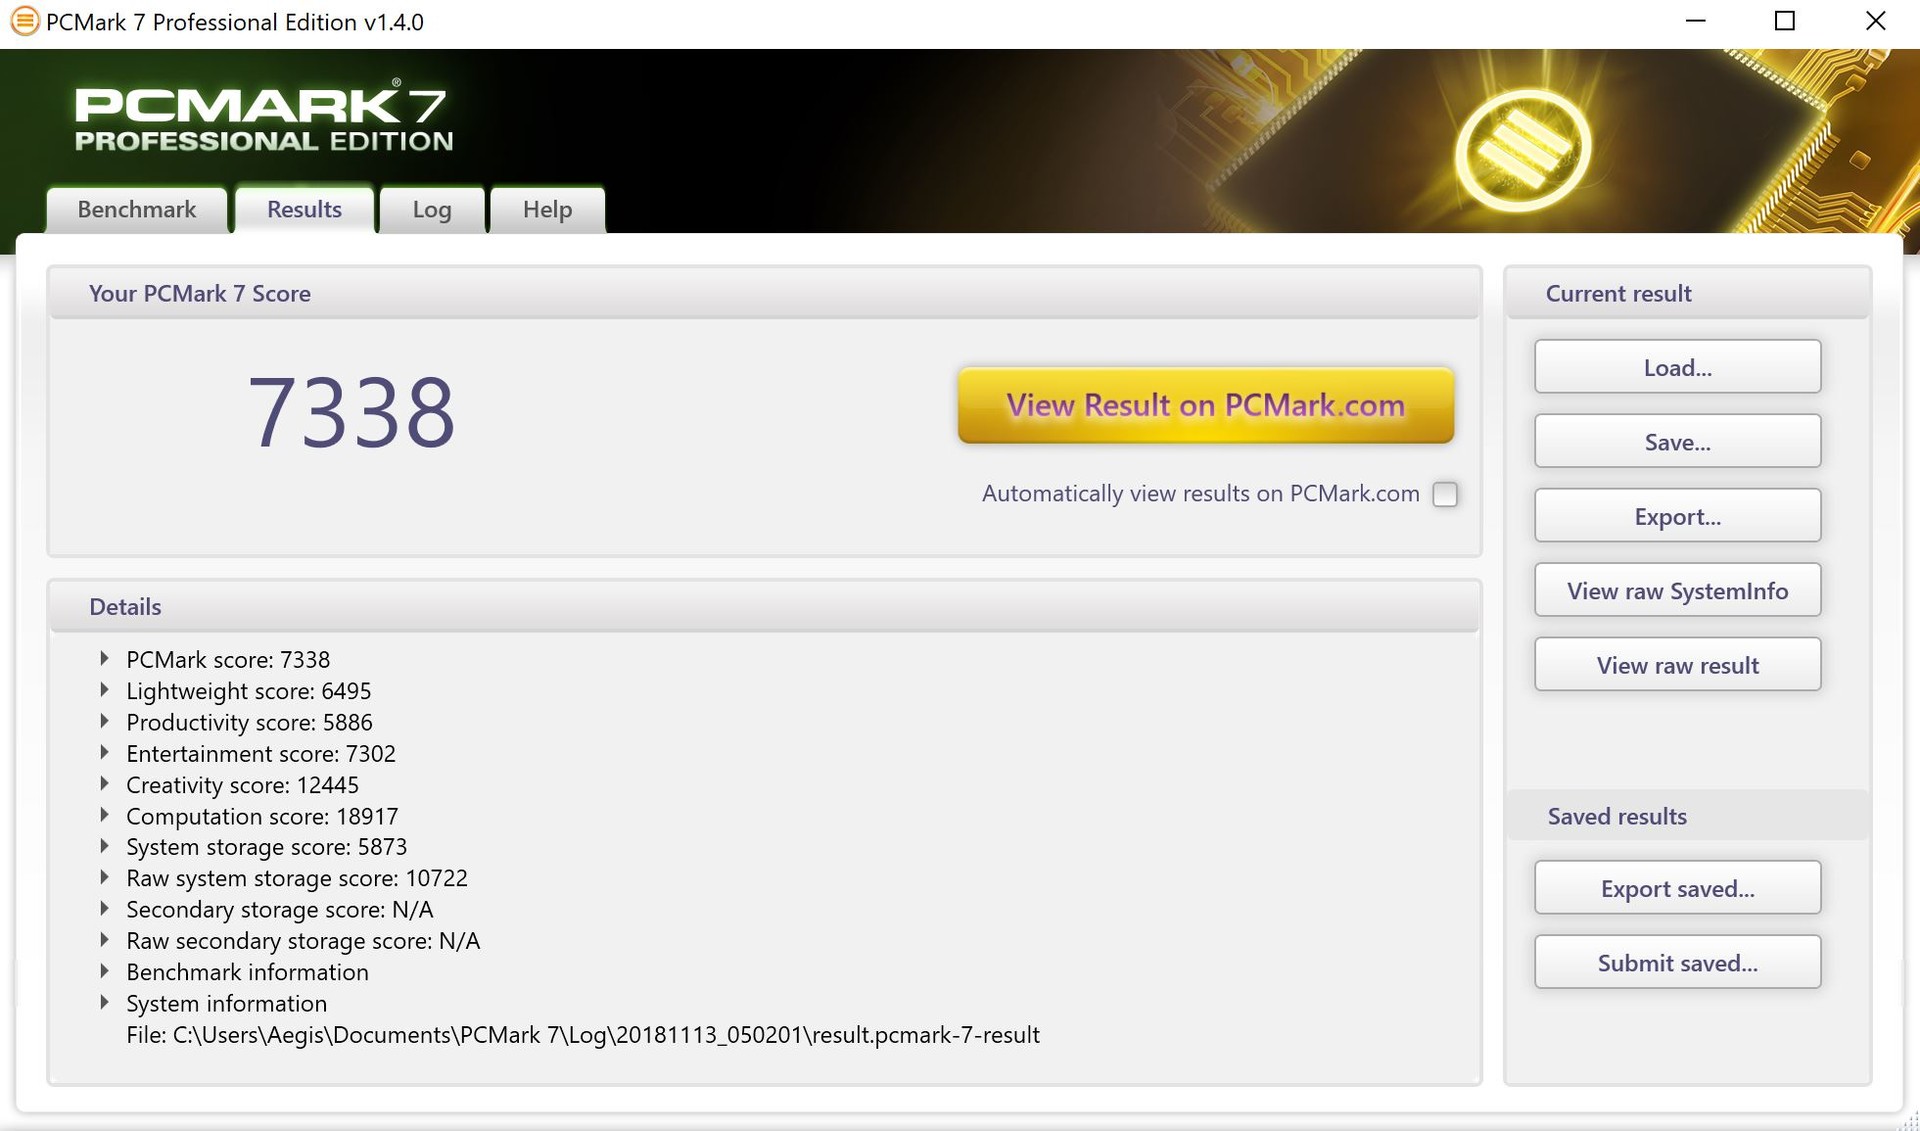
| PCMark 7 Score | 7338 points | |
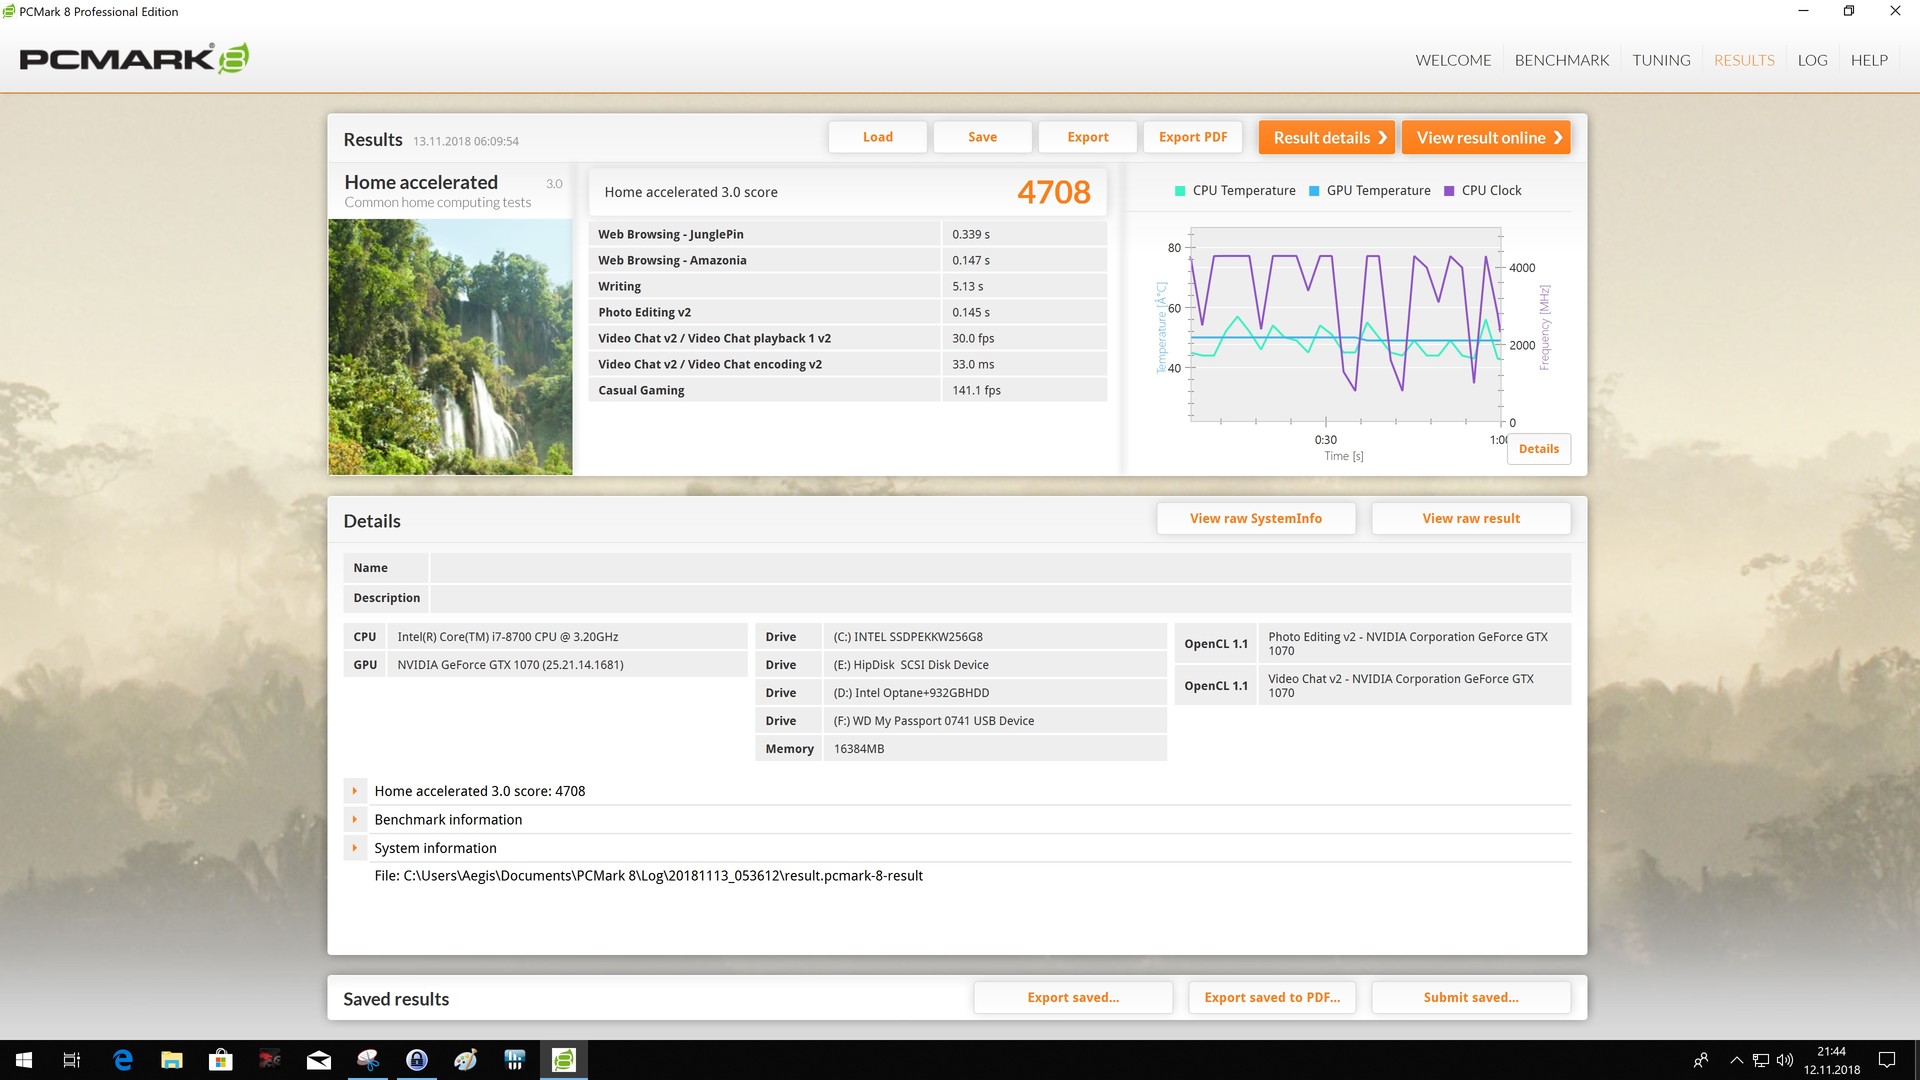
| PCMark 8 Home Score Accelerated v2 | 4708 points | |
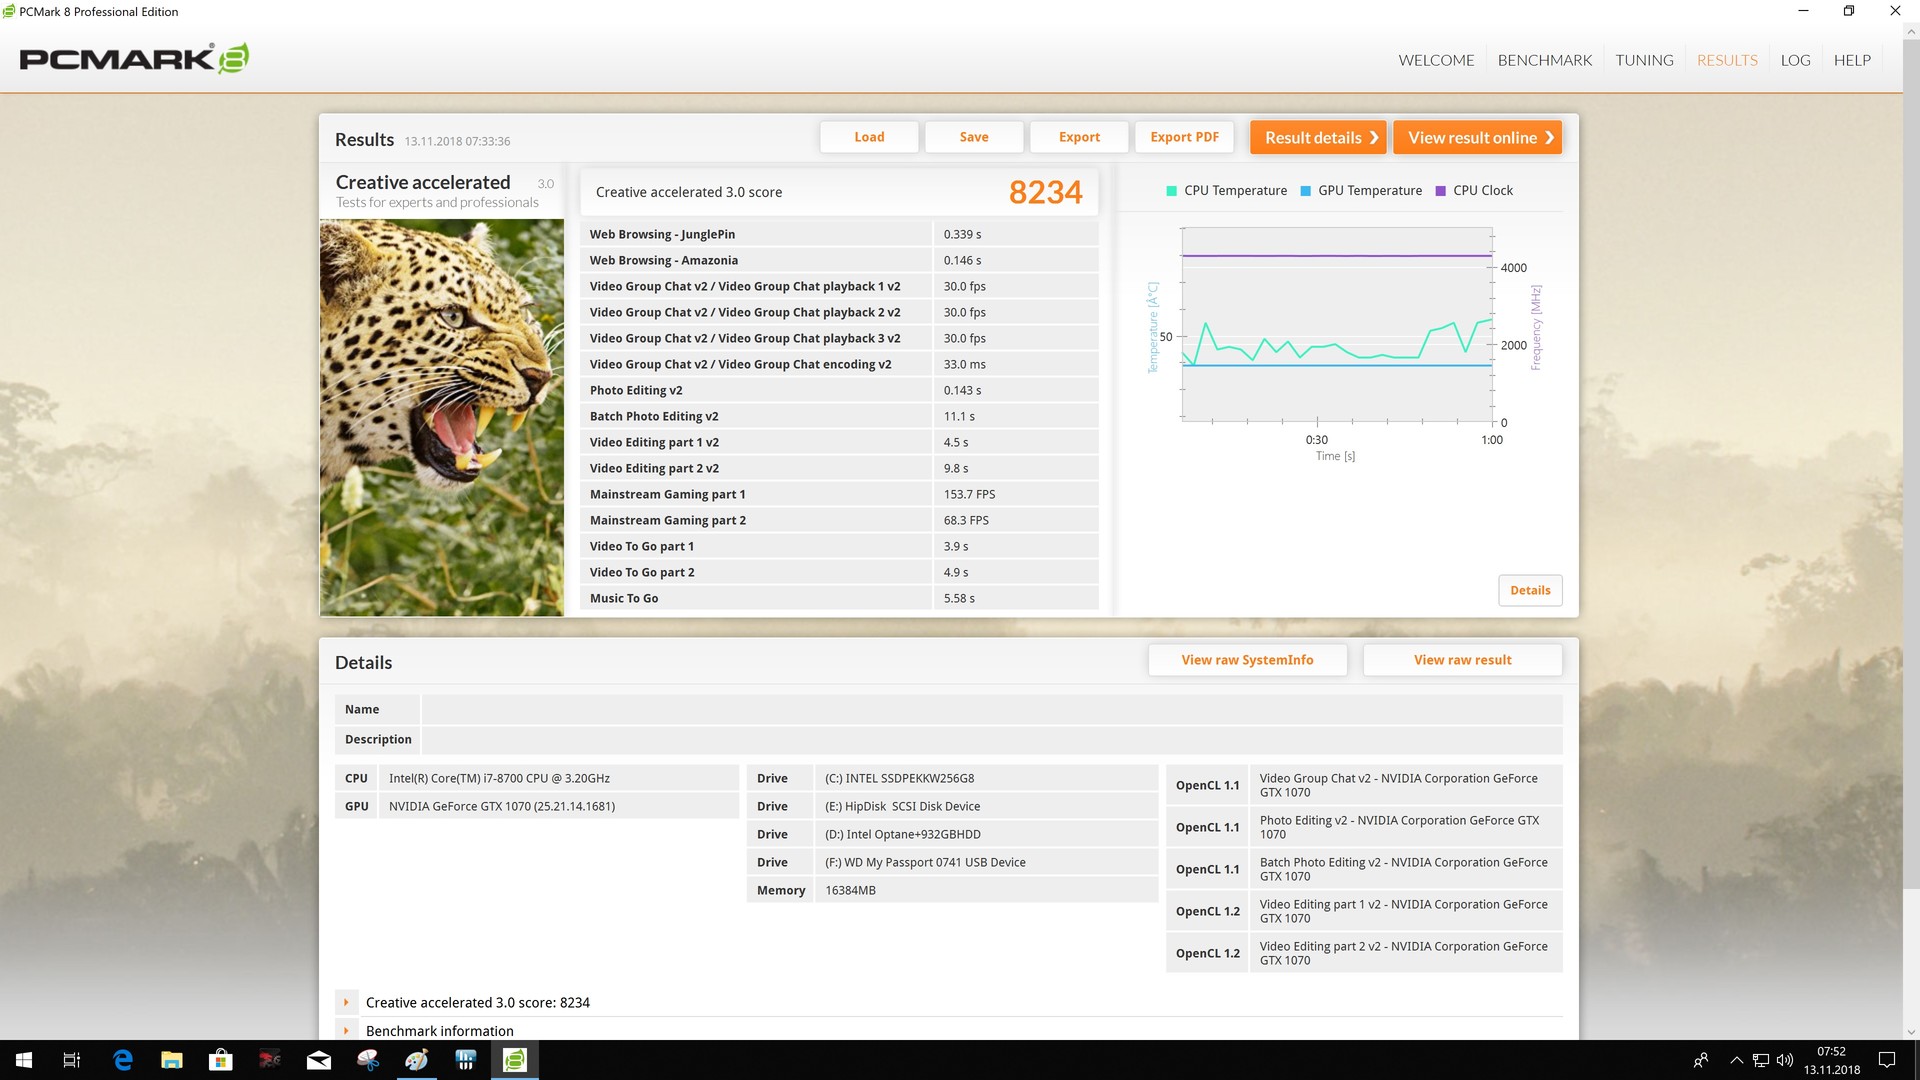
| PCMark 8 Creative Score Accelerated v2 | 8234 points | |
| PCMark 8 Work Score Accelerated v2 | 4891 points | |
| PCMark 10 Score | 6100 points | |
Help | ||
Storage Devices
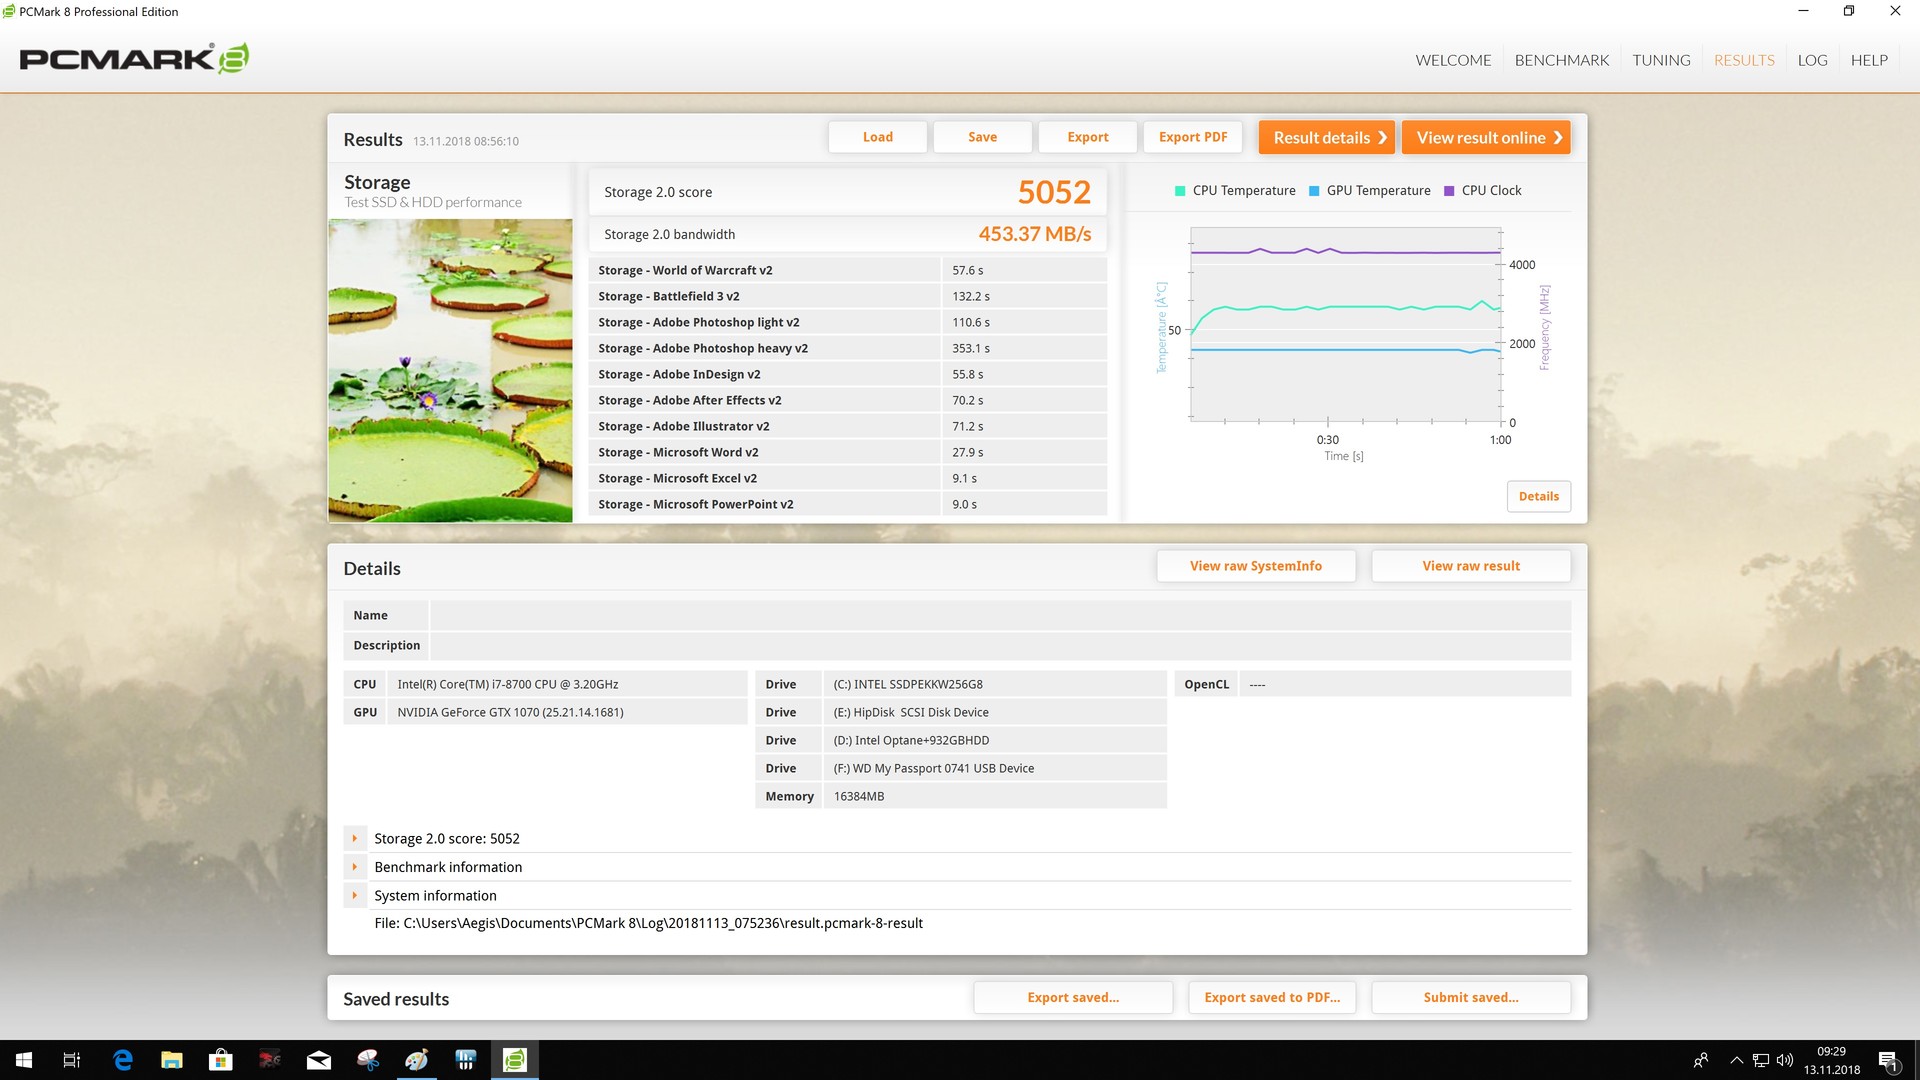
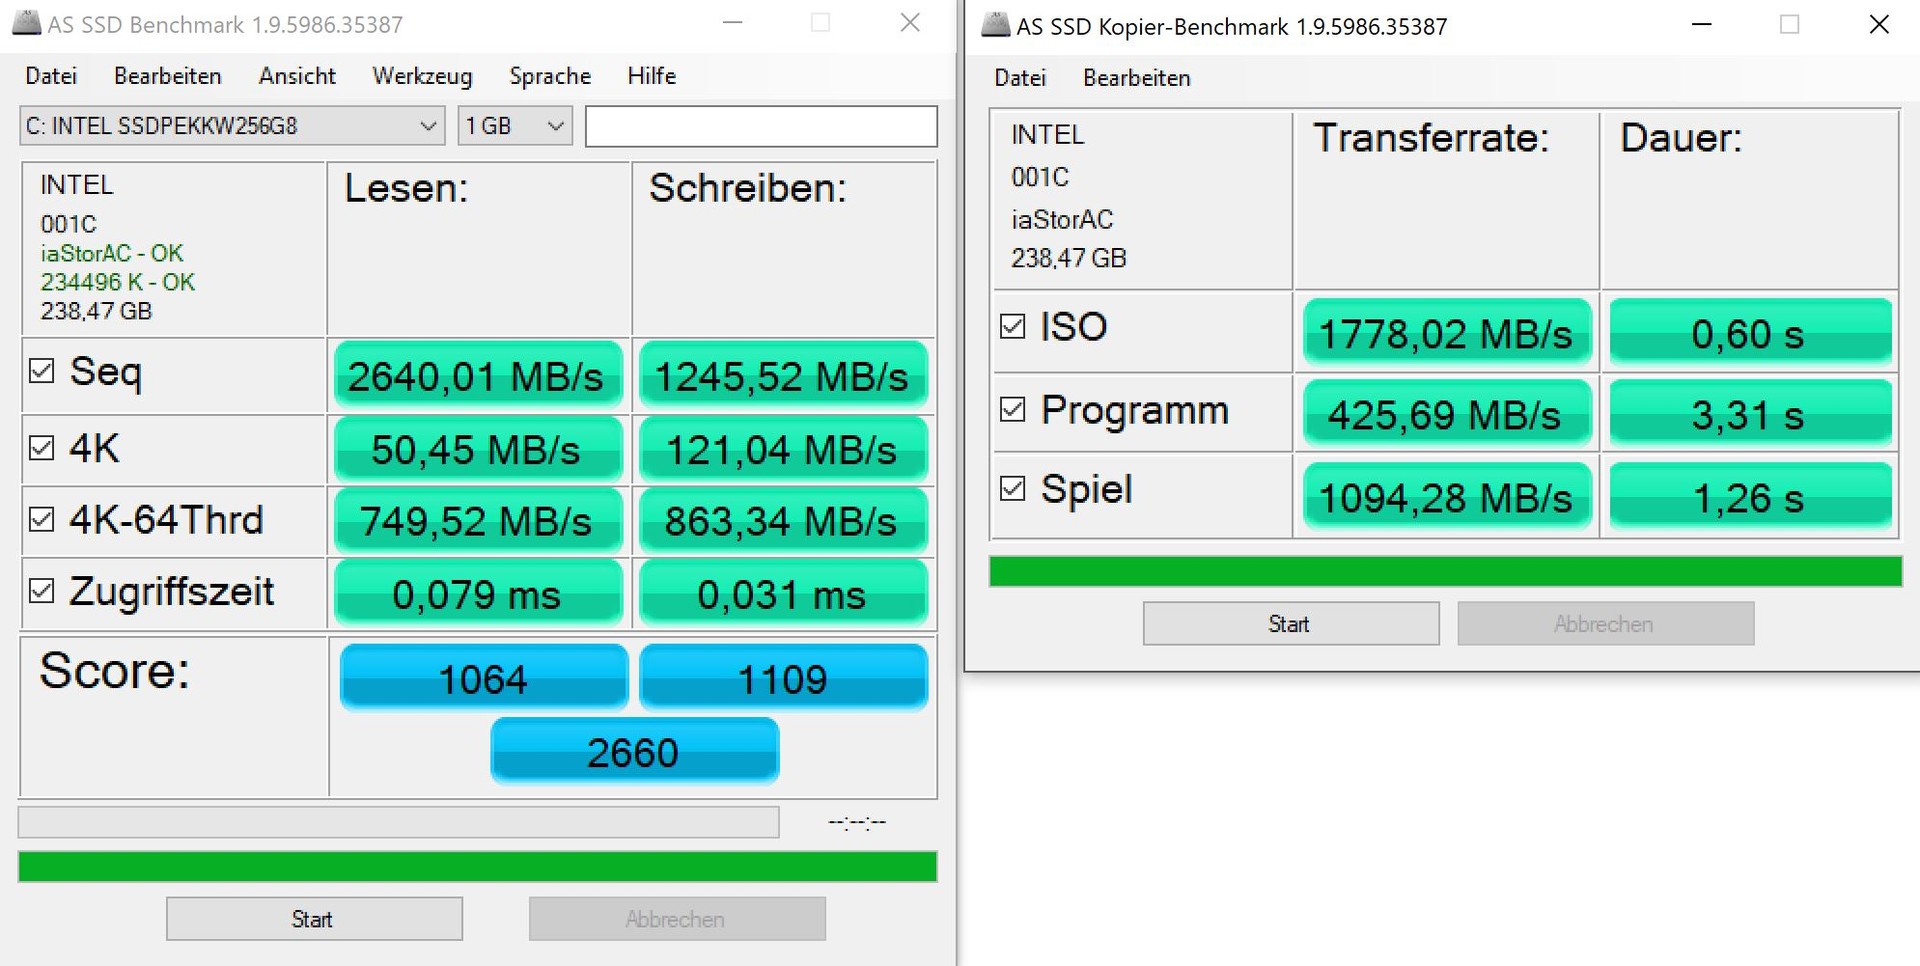
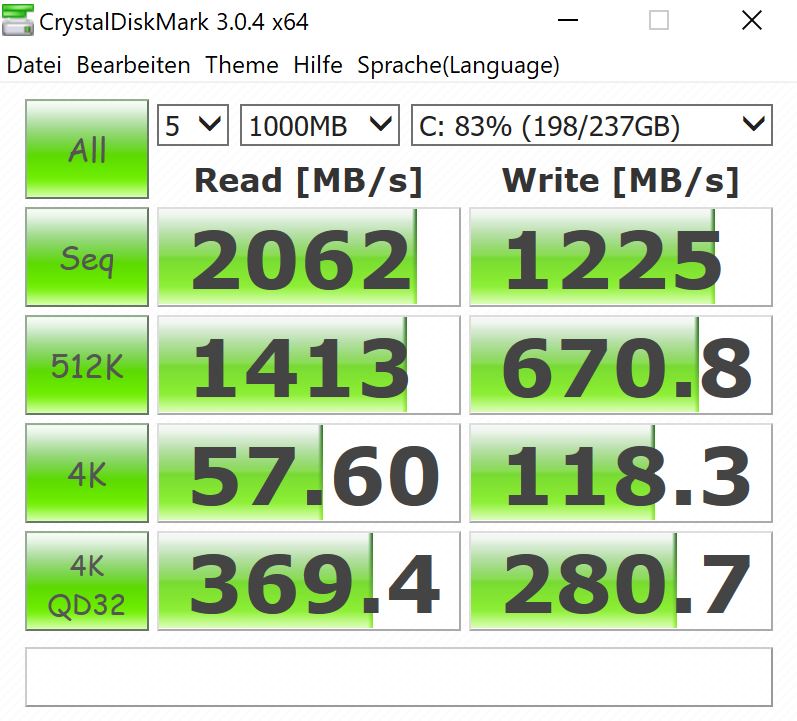
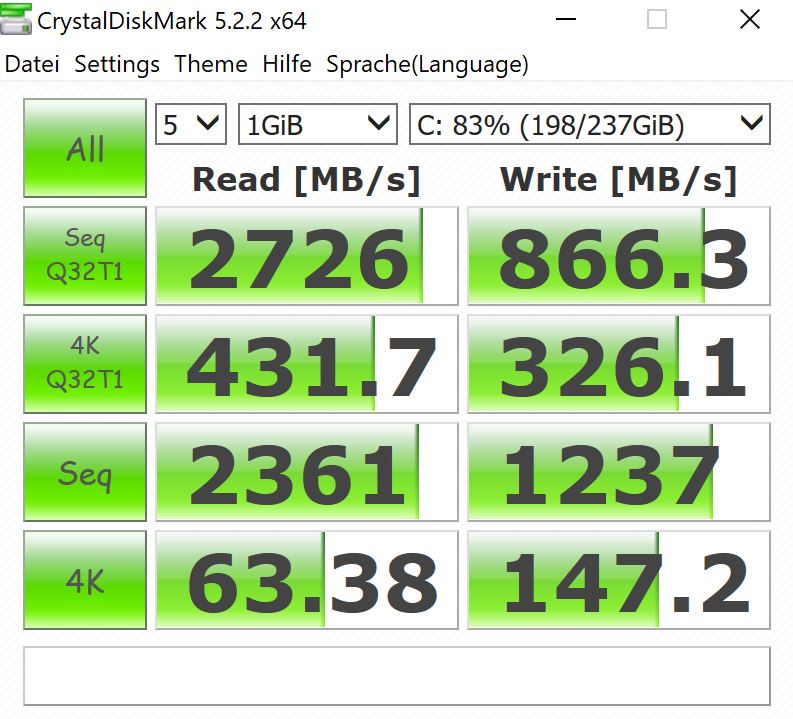
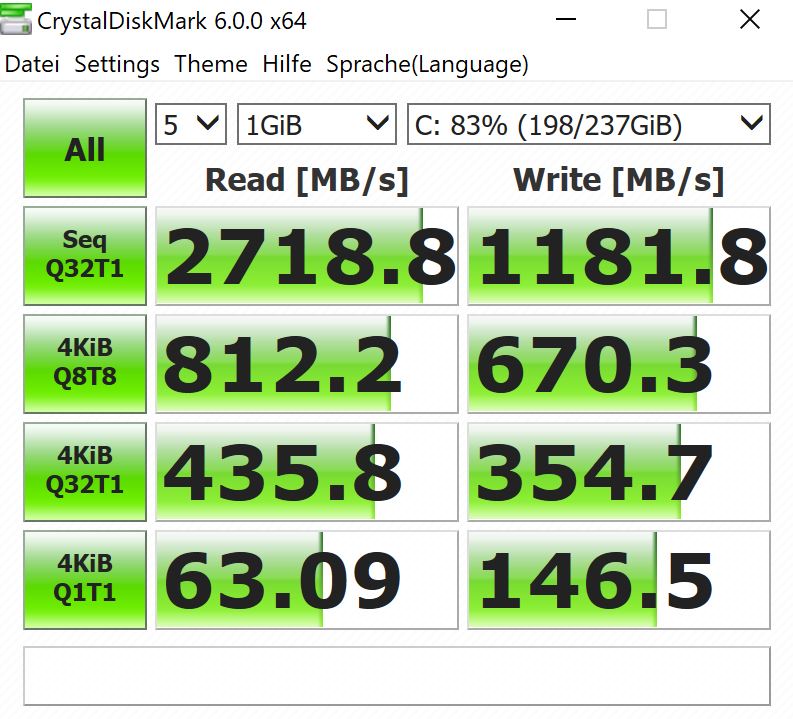
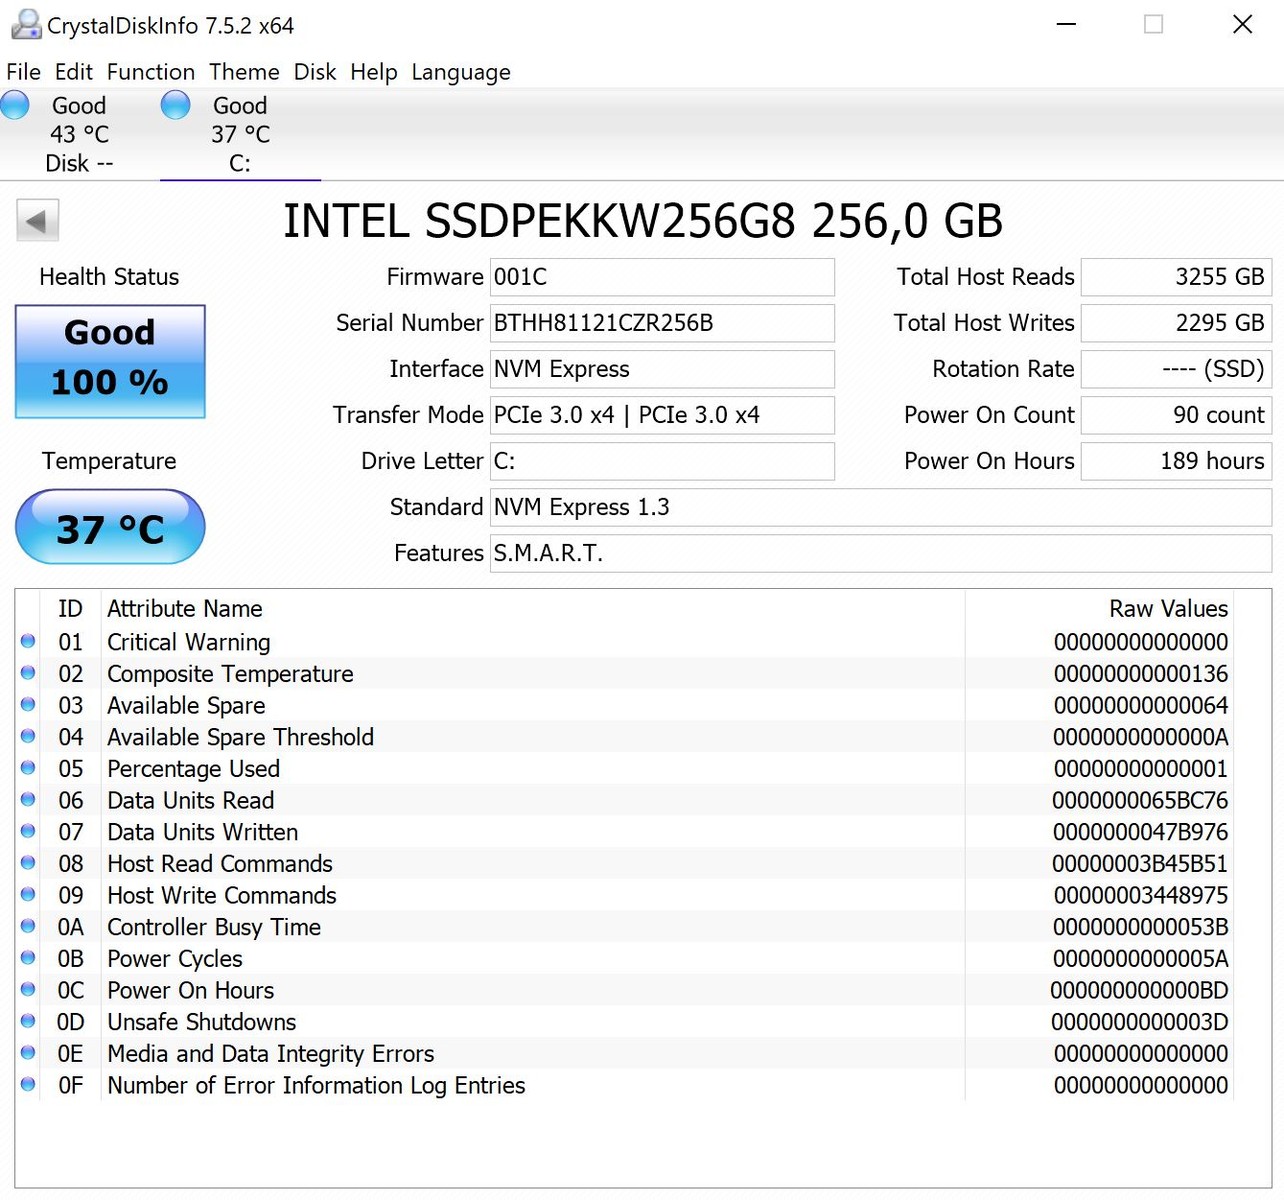
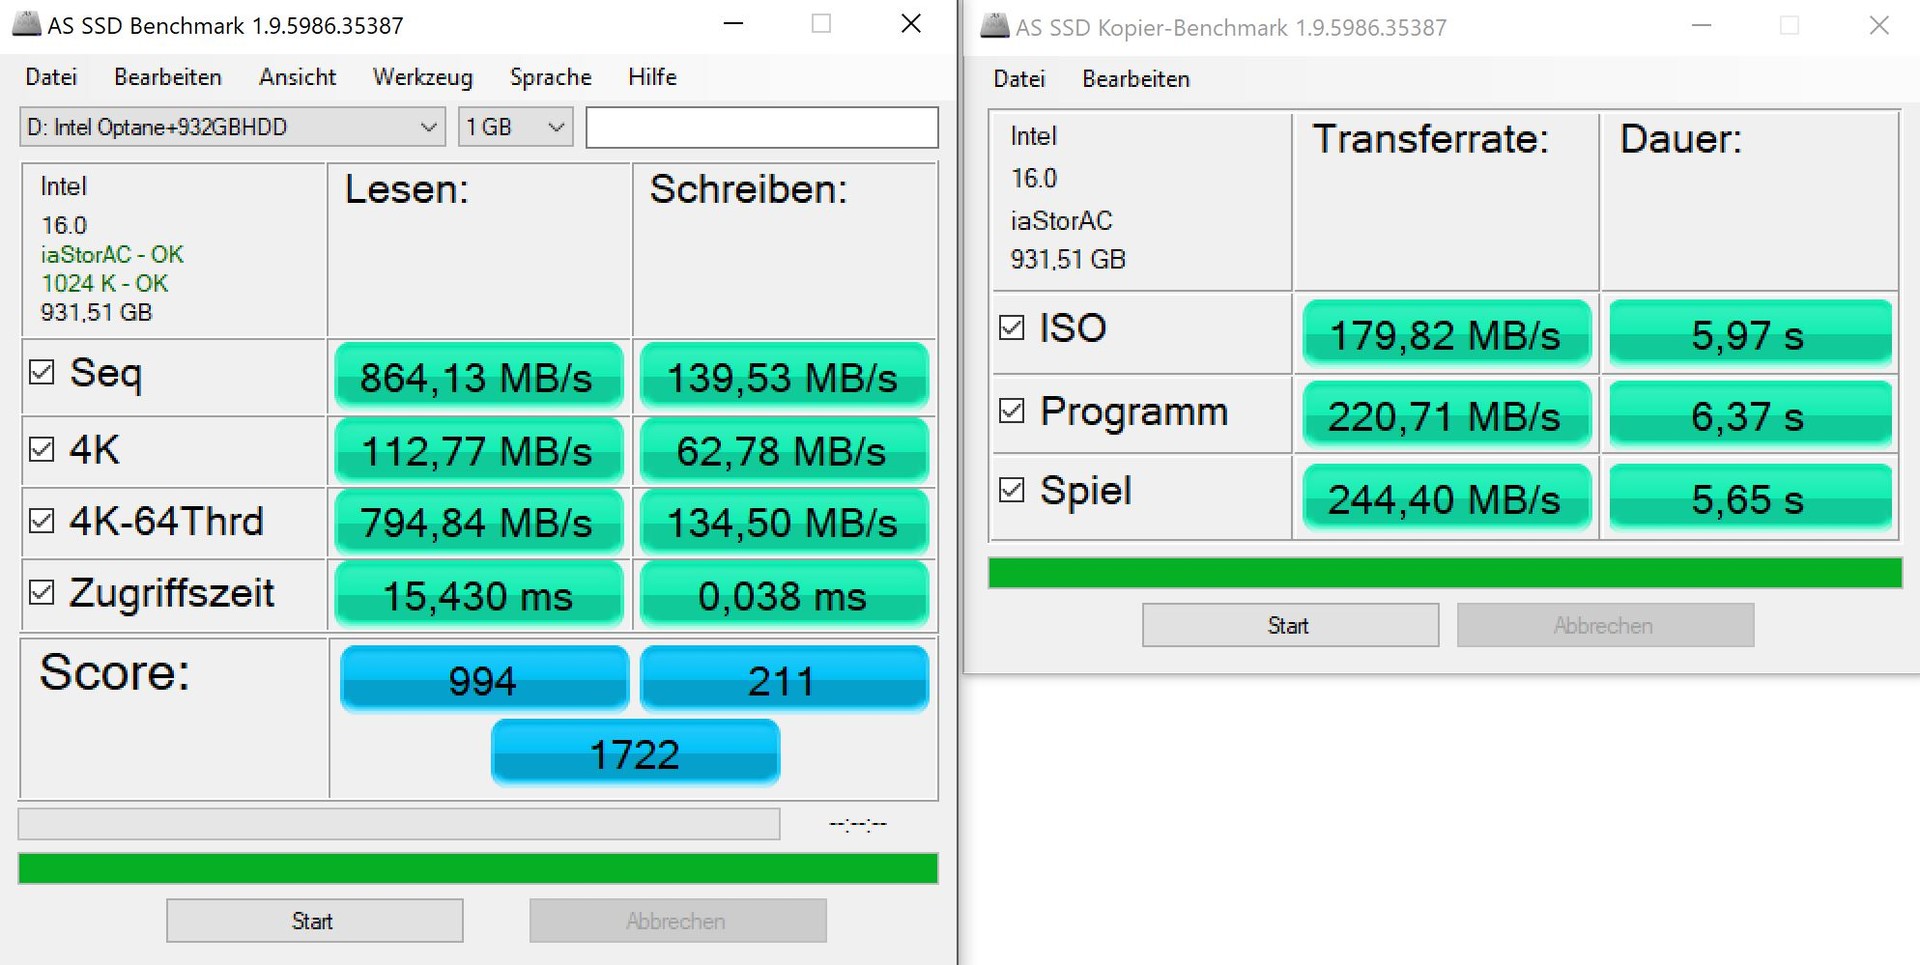
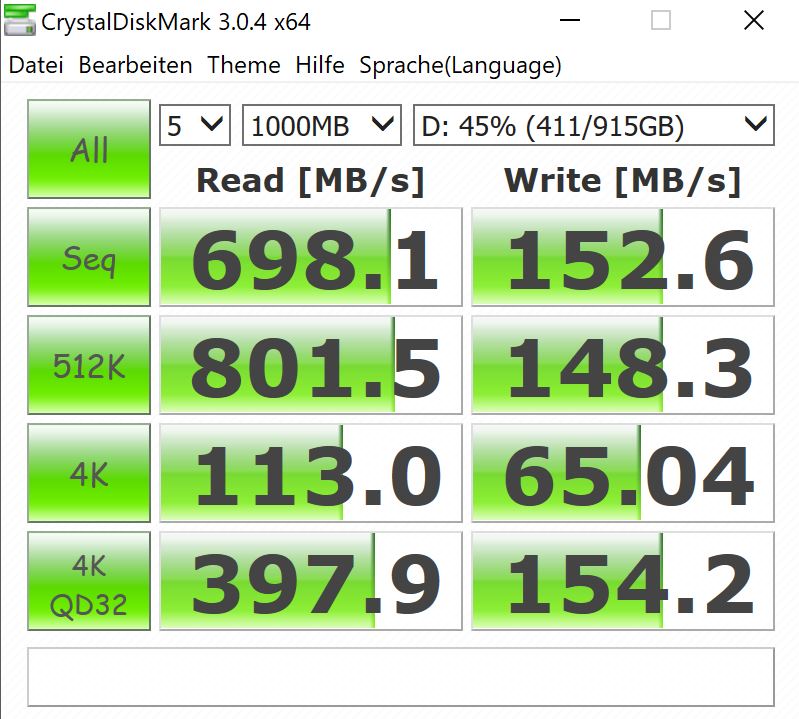
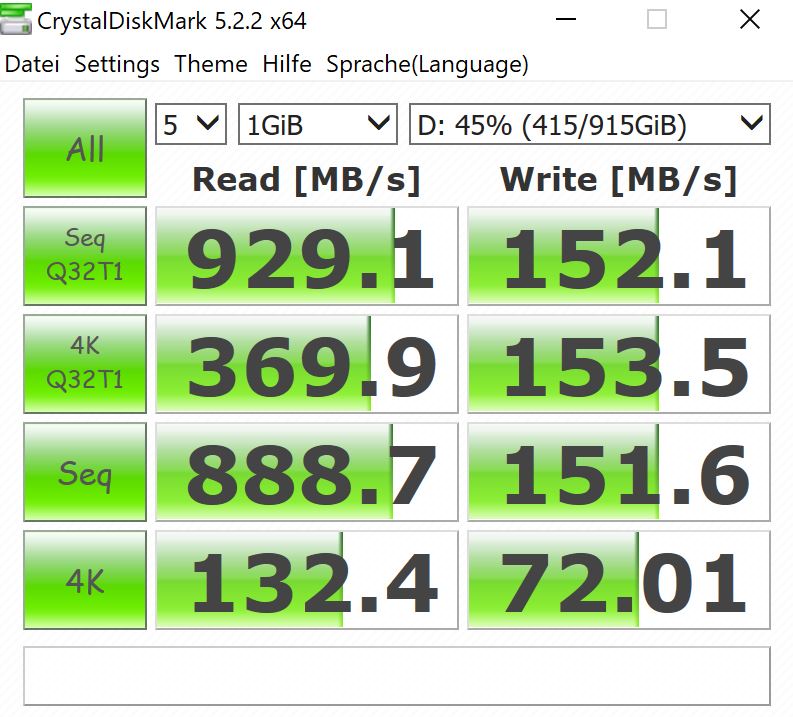
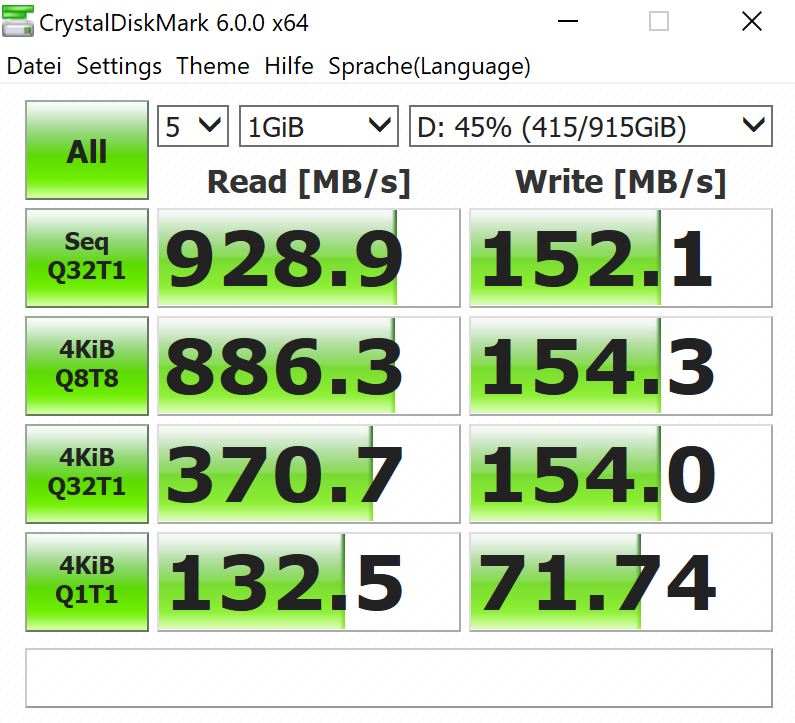
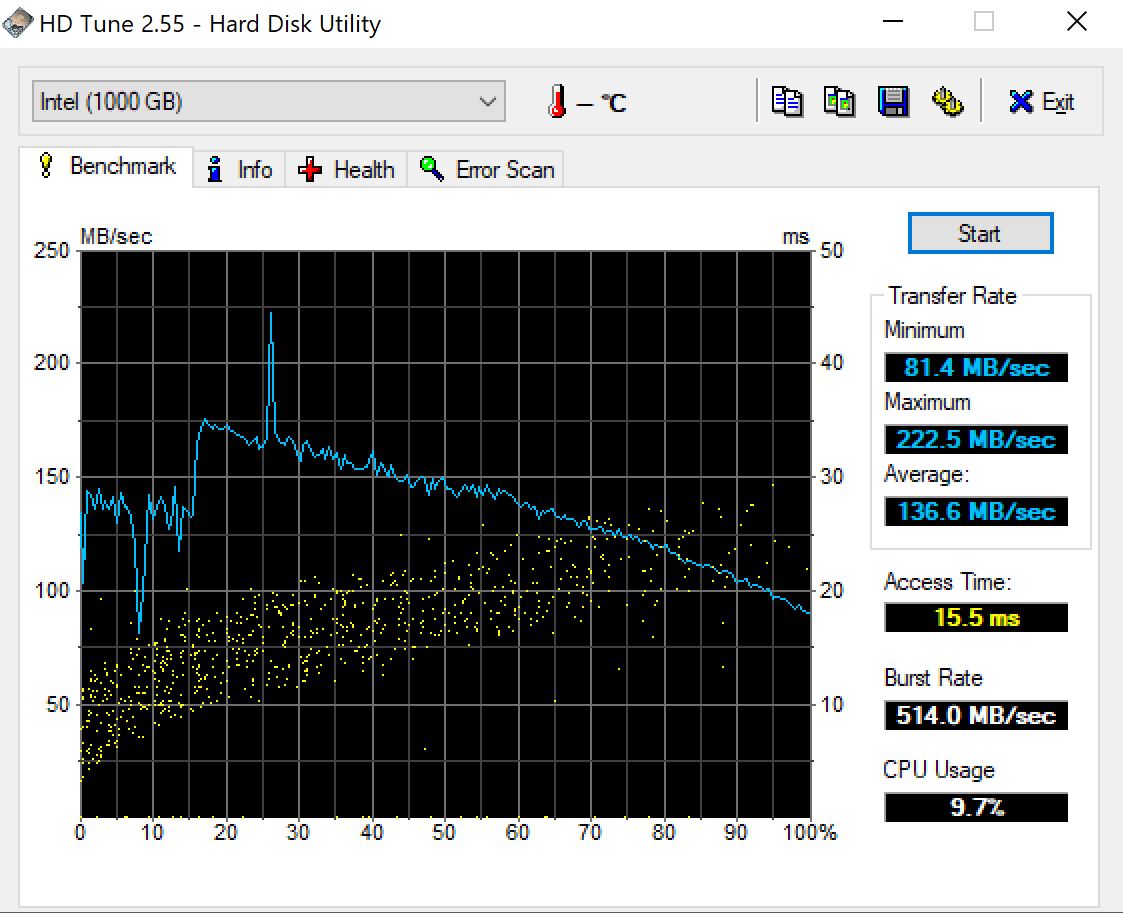
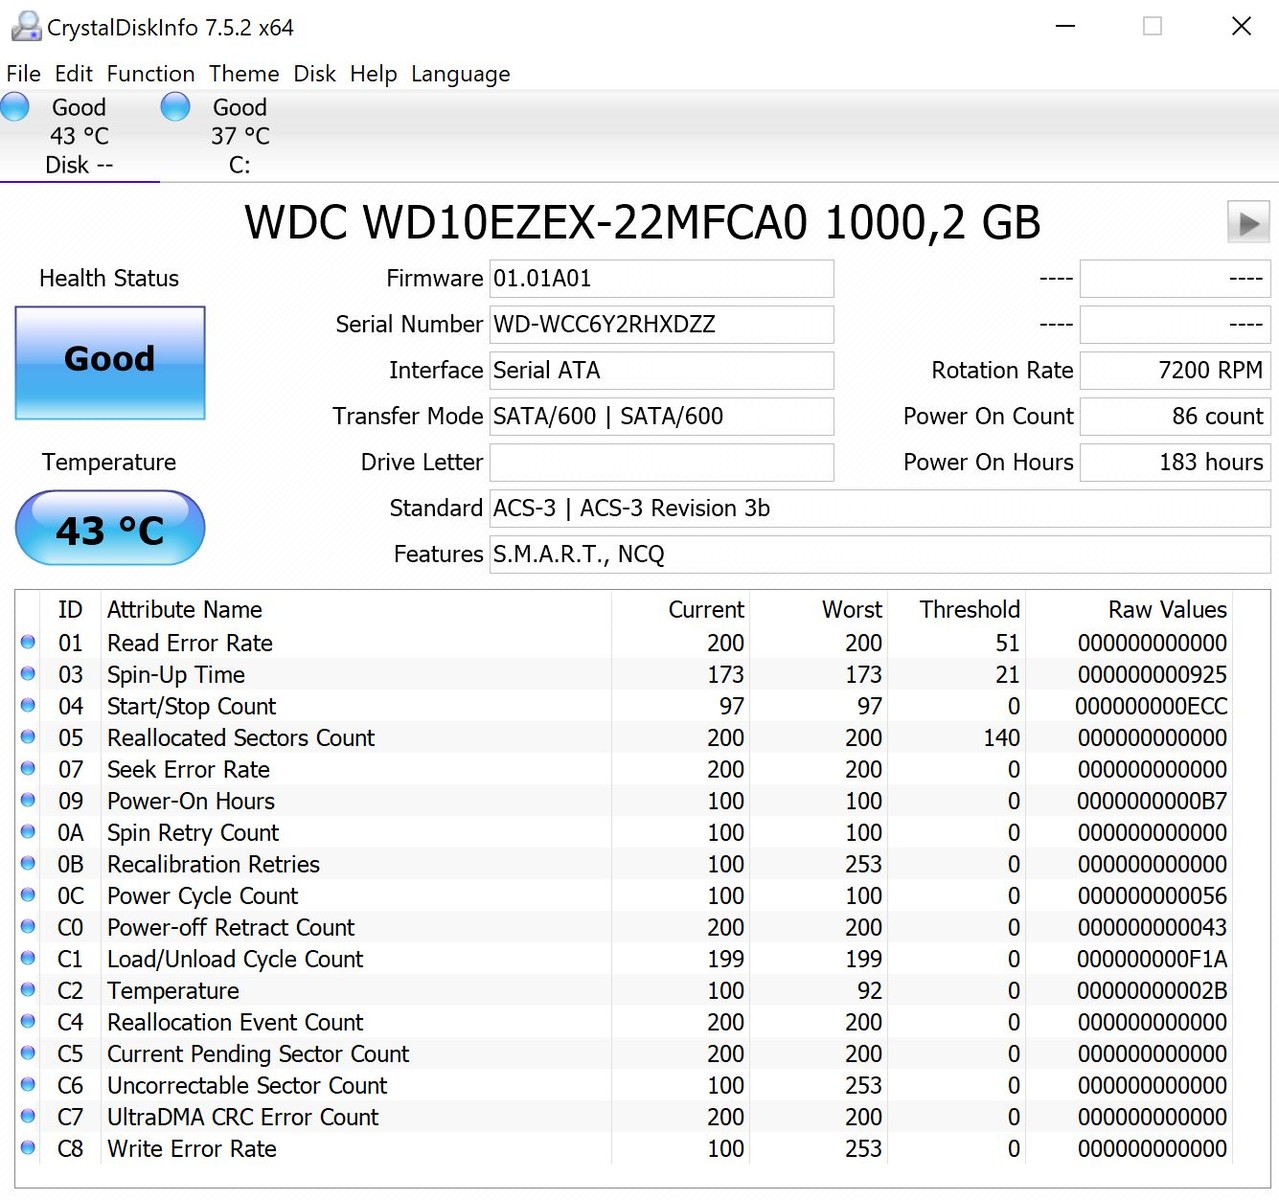
Gaming devices need a lot of disk space on which to store games, and the Aegis 3 8RD has plenty. MSI installs Windows 10 on a 256 GB Intel NVMe SSD, which is much faster than its SATA III counterparts. There is also a 1 TB 3.5-inch Western Digital HDD that is supported by an Intel Optane SSD. The HDD writes only at 136 MB/s, which is much slower than the Intel NVMe SSD.
Moreover, there are spare 3.5-inch and 2.5-inch drive bays should you need more storage. MSI has pre-wired all drive bays, so you can simply drop in additional drives and format them.
Intel SSD benchmarks
Western Digital HDD & Intel Optane benchmarks

Graphics Card
The Core i7-8700 processor integrates an Intel UHD Graphics 630, although the latter is not powerful enough to handle most modern games. The Aegis 3 8RD does not support Nvidia Optimus technology for graphics switching, which is something that manufacturers have increasingly integrated into notebooks to reduce power consumption. This could be useful to bring down electricity bills, but it is not necessary by design for a gaming PC.
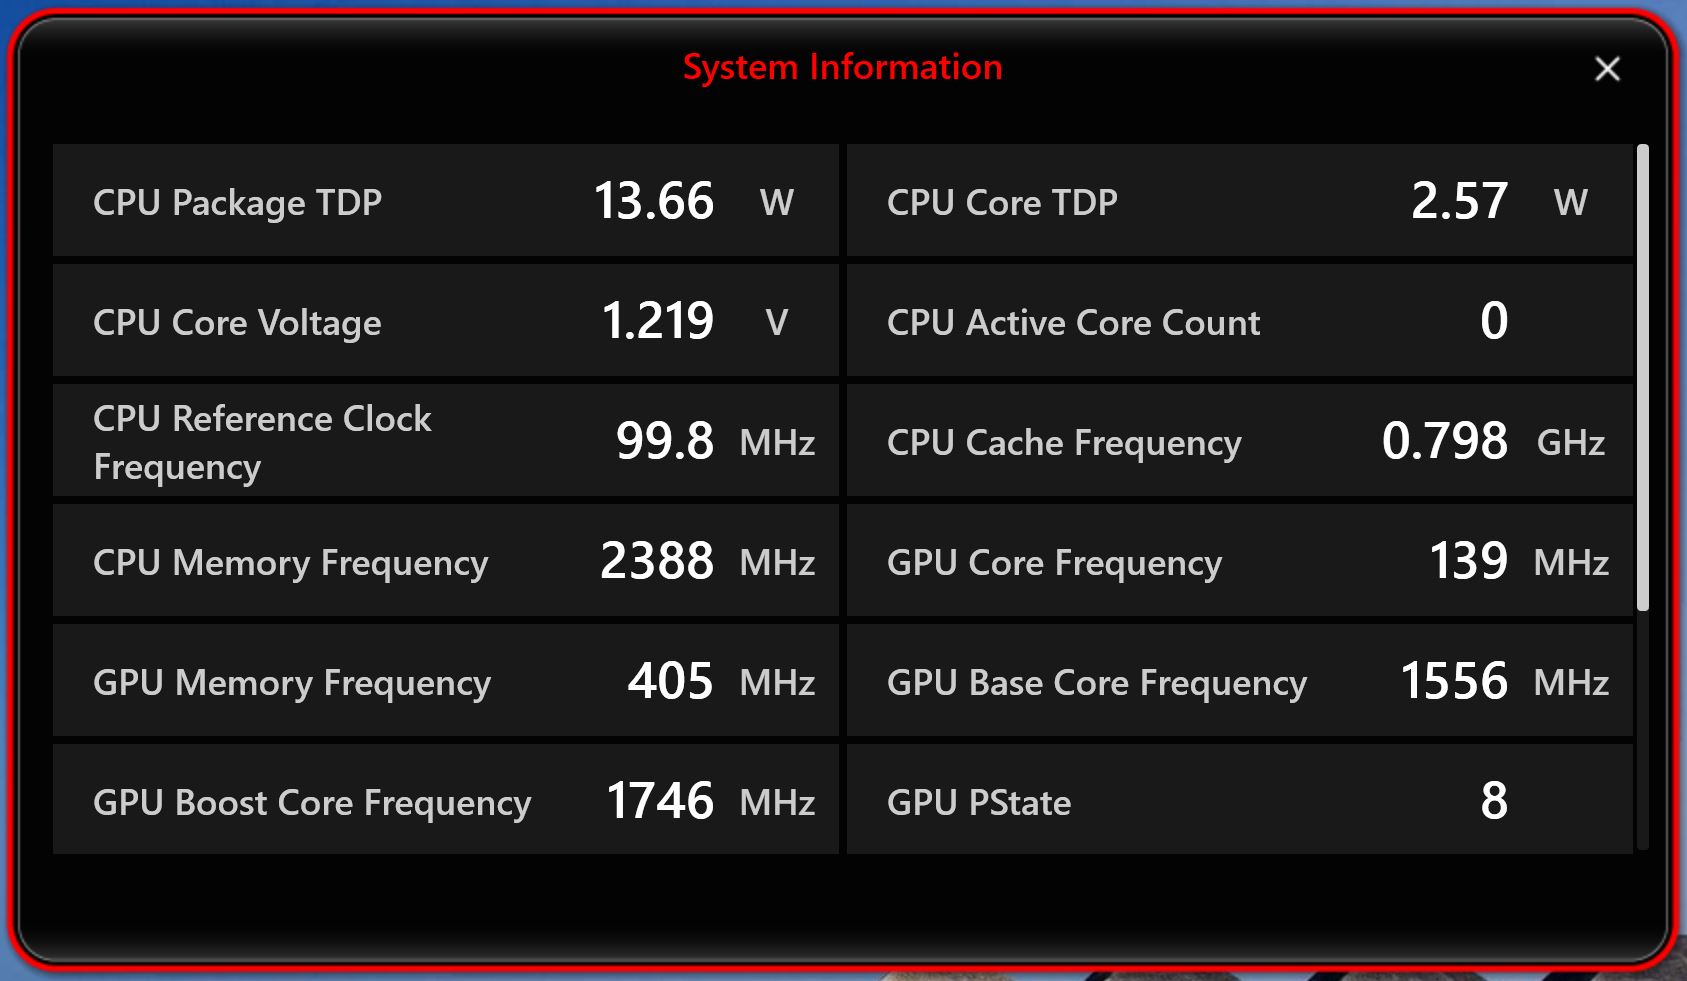
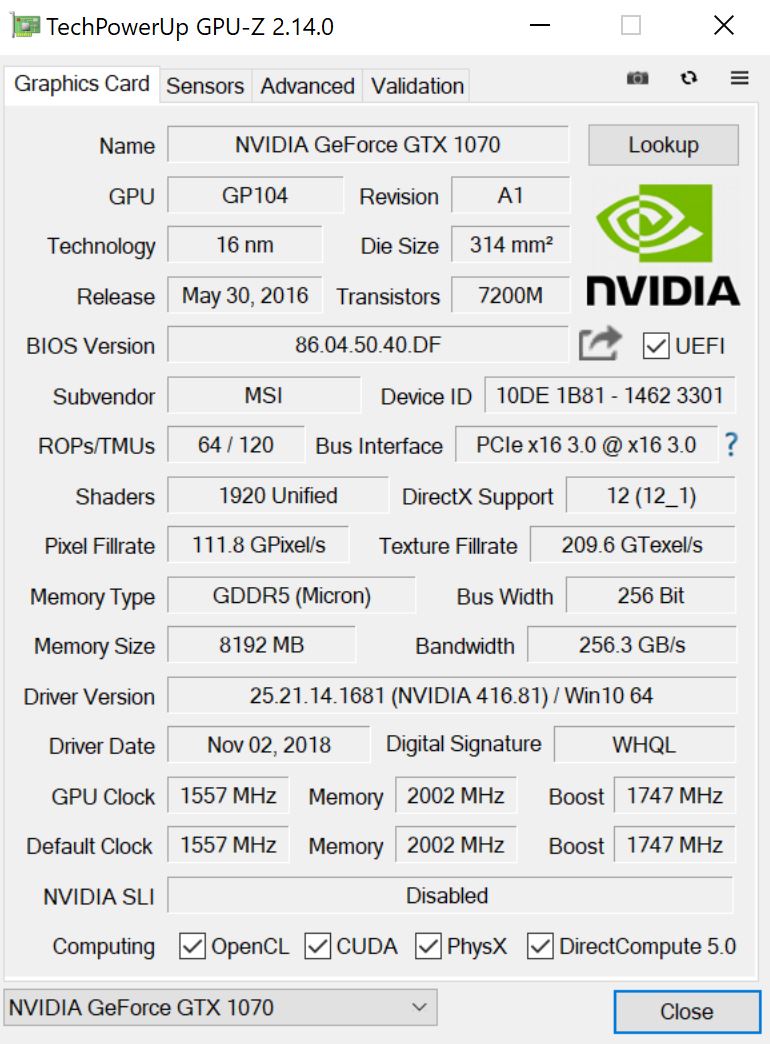
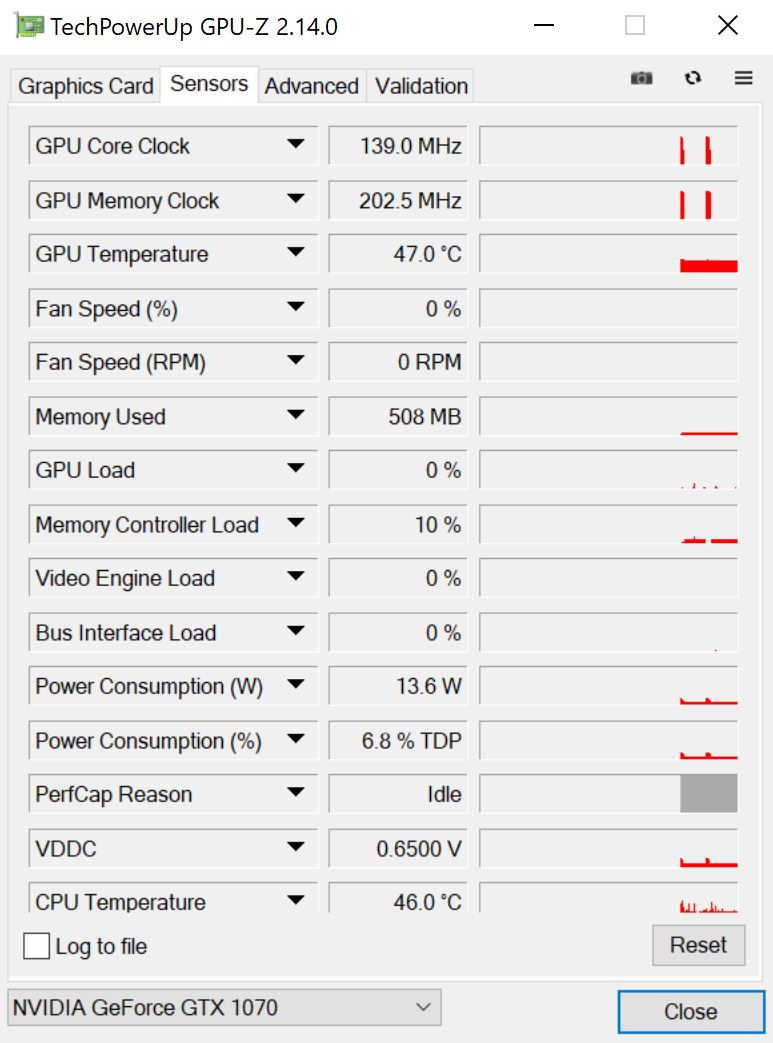
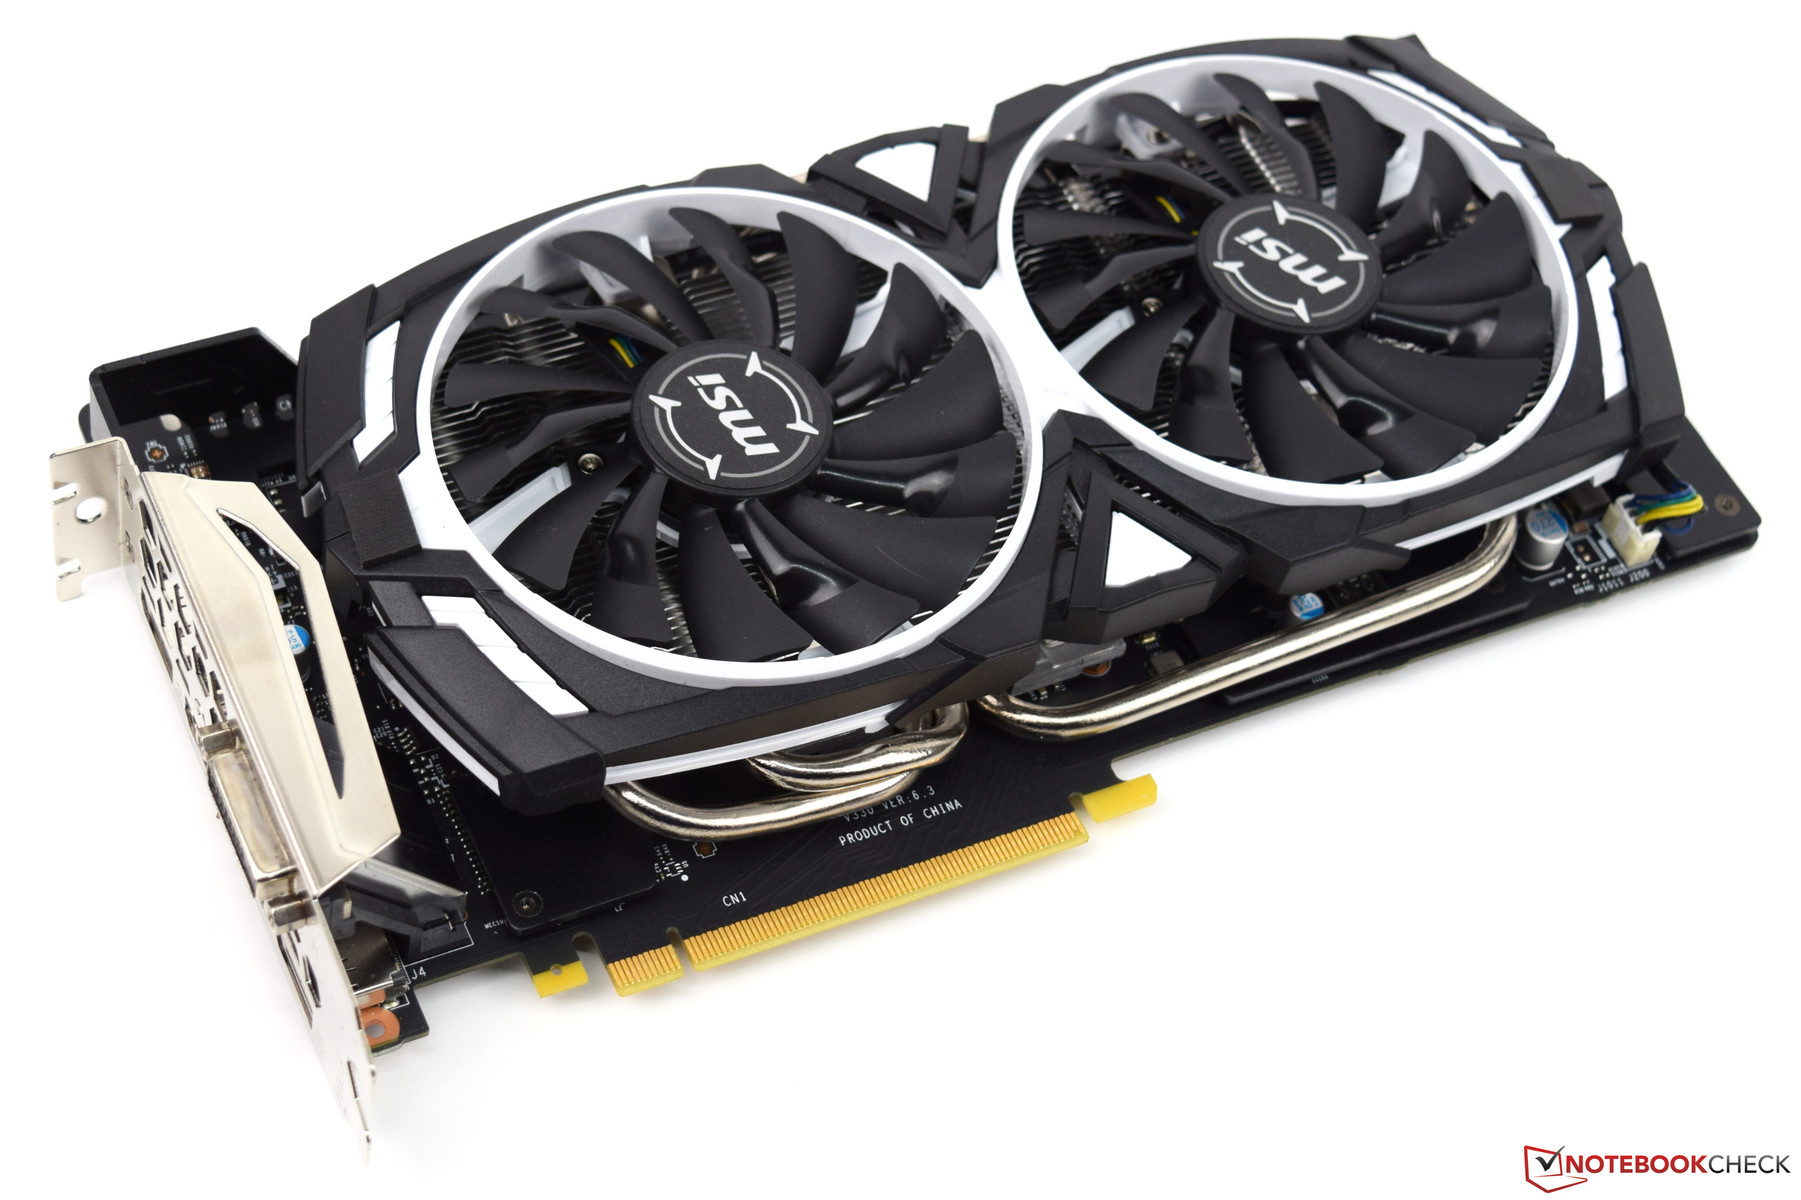
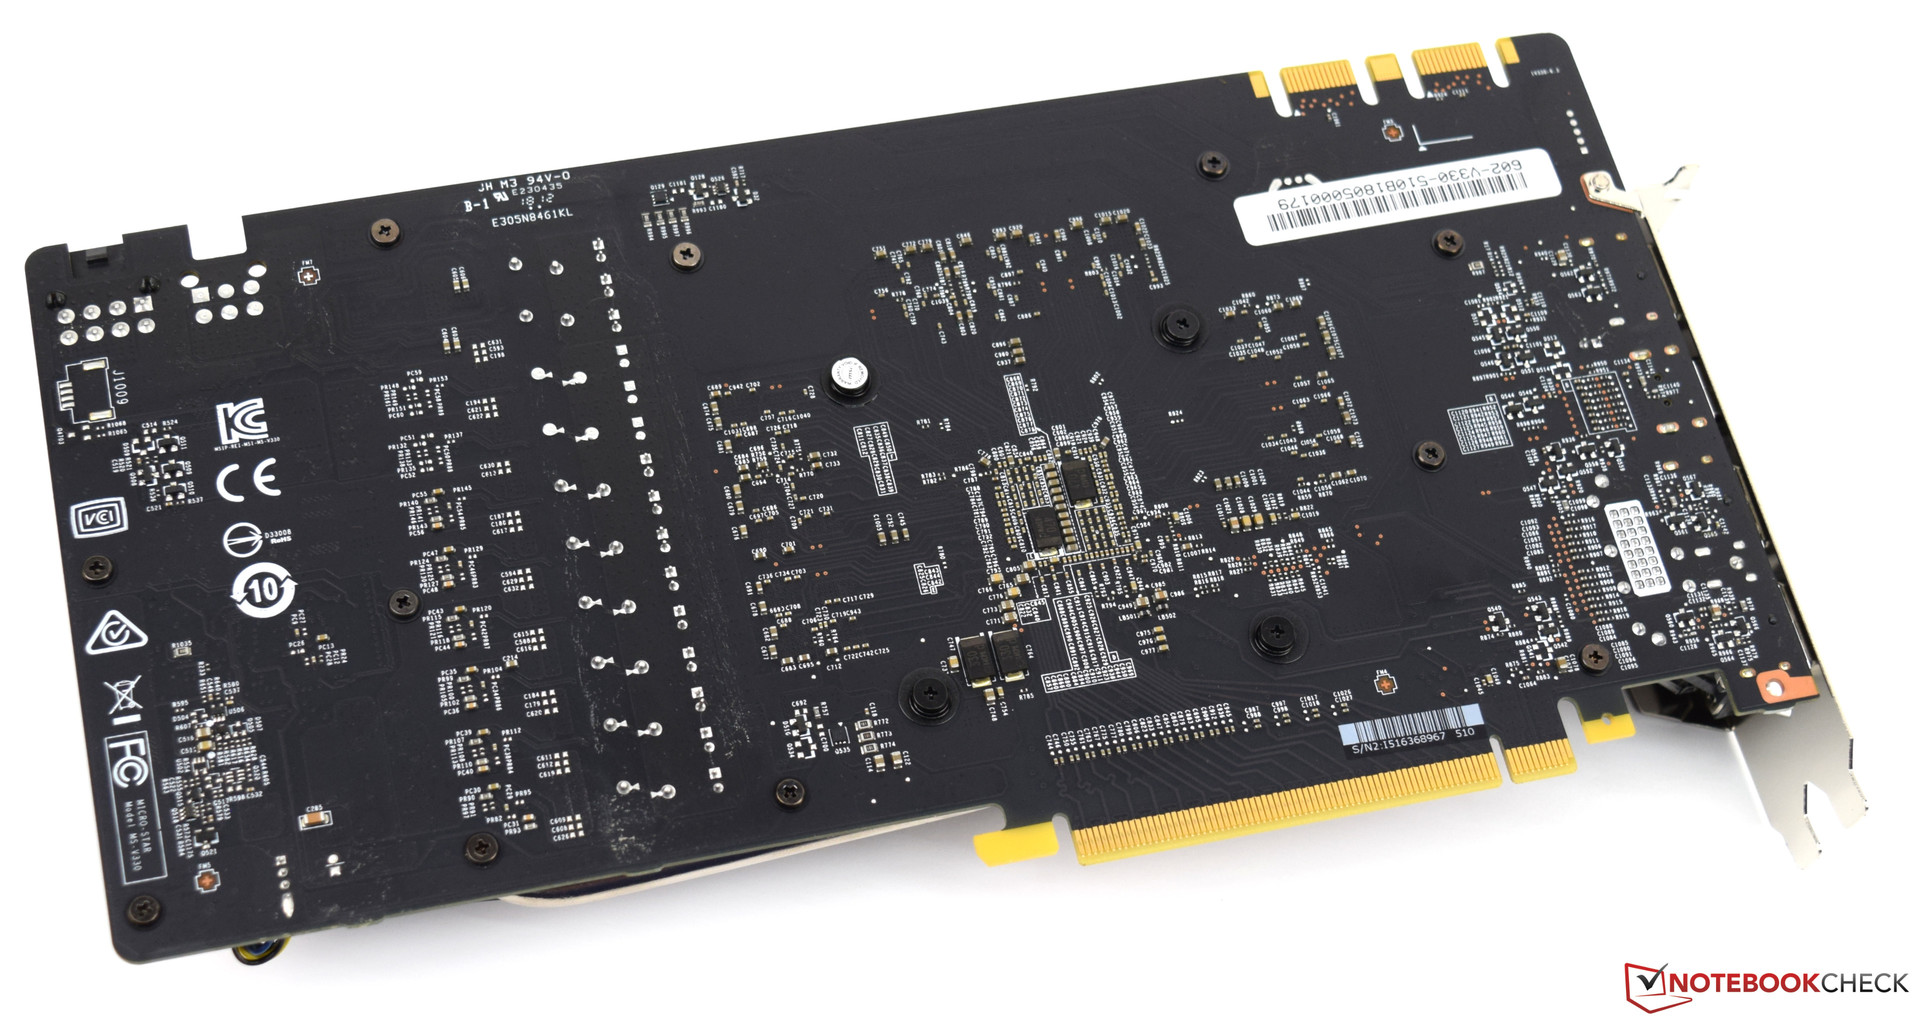
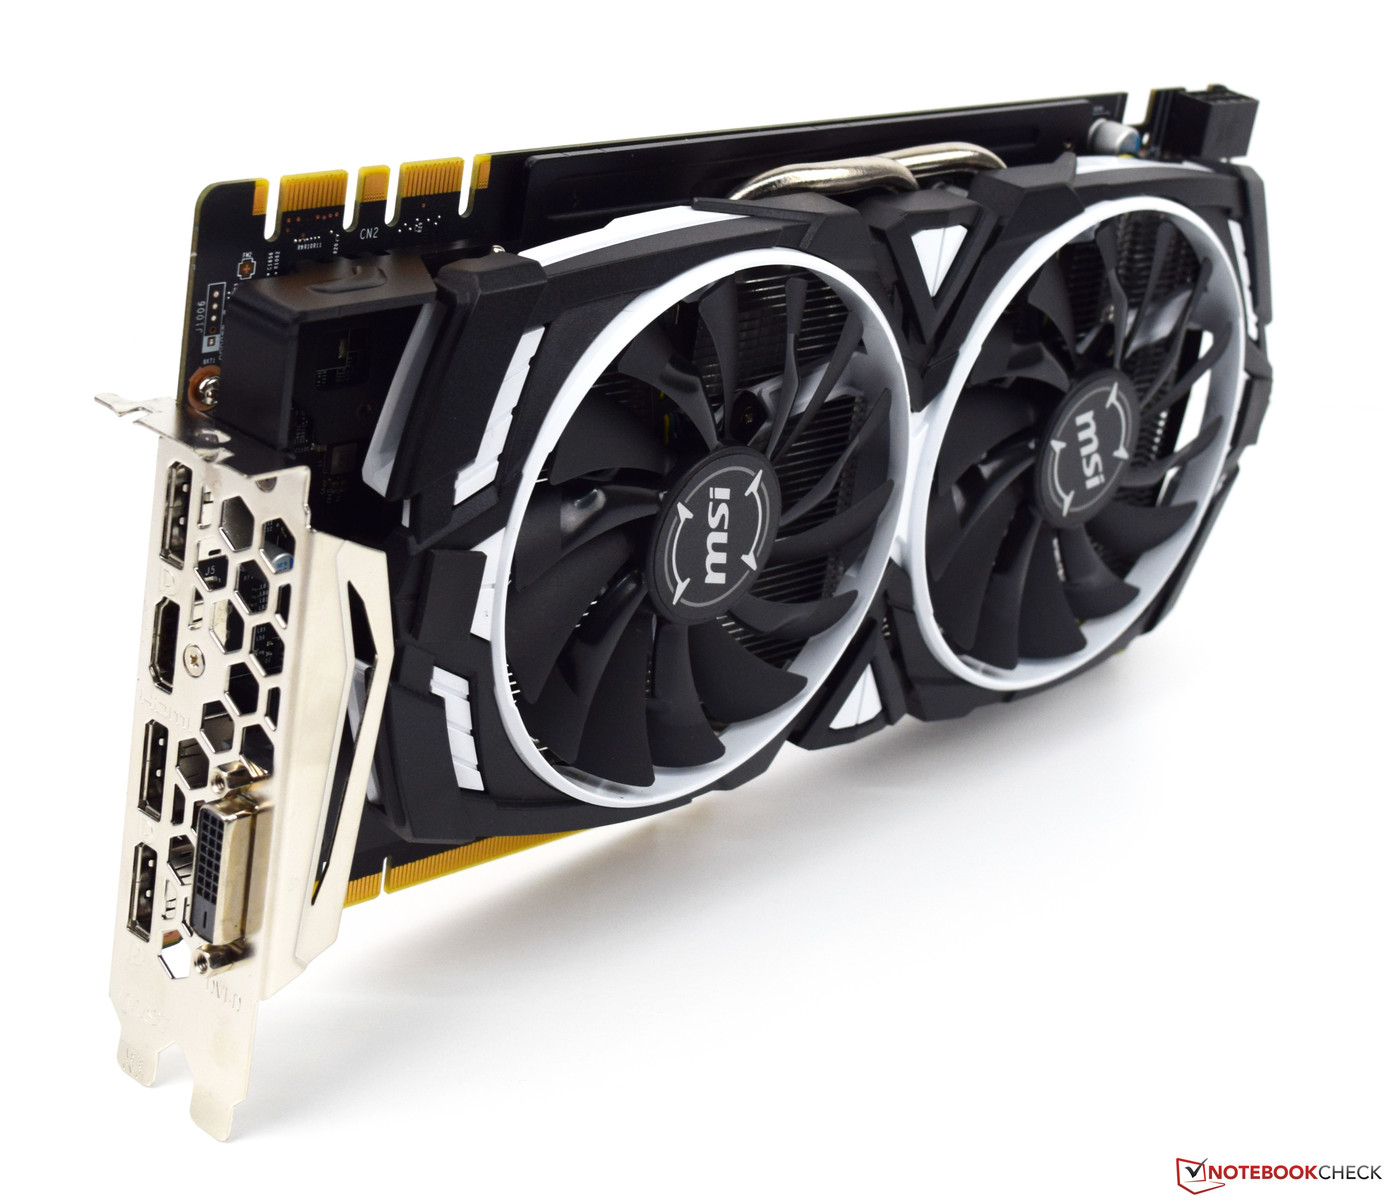
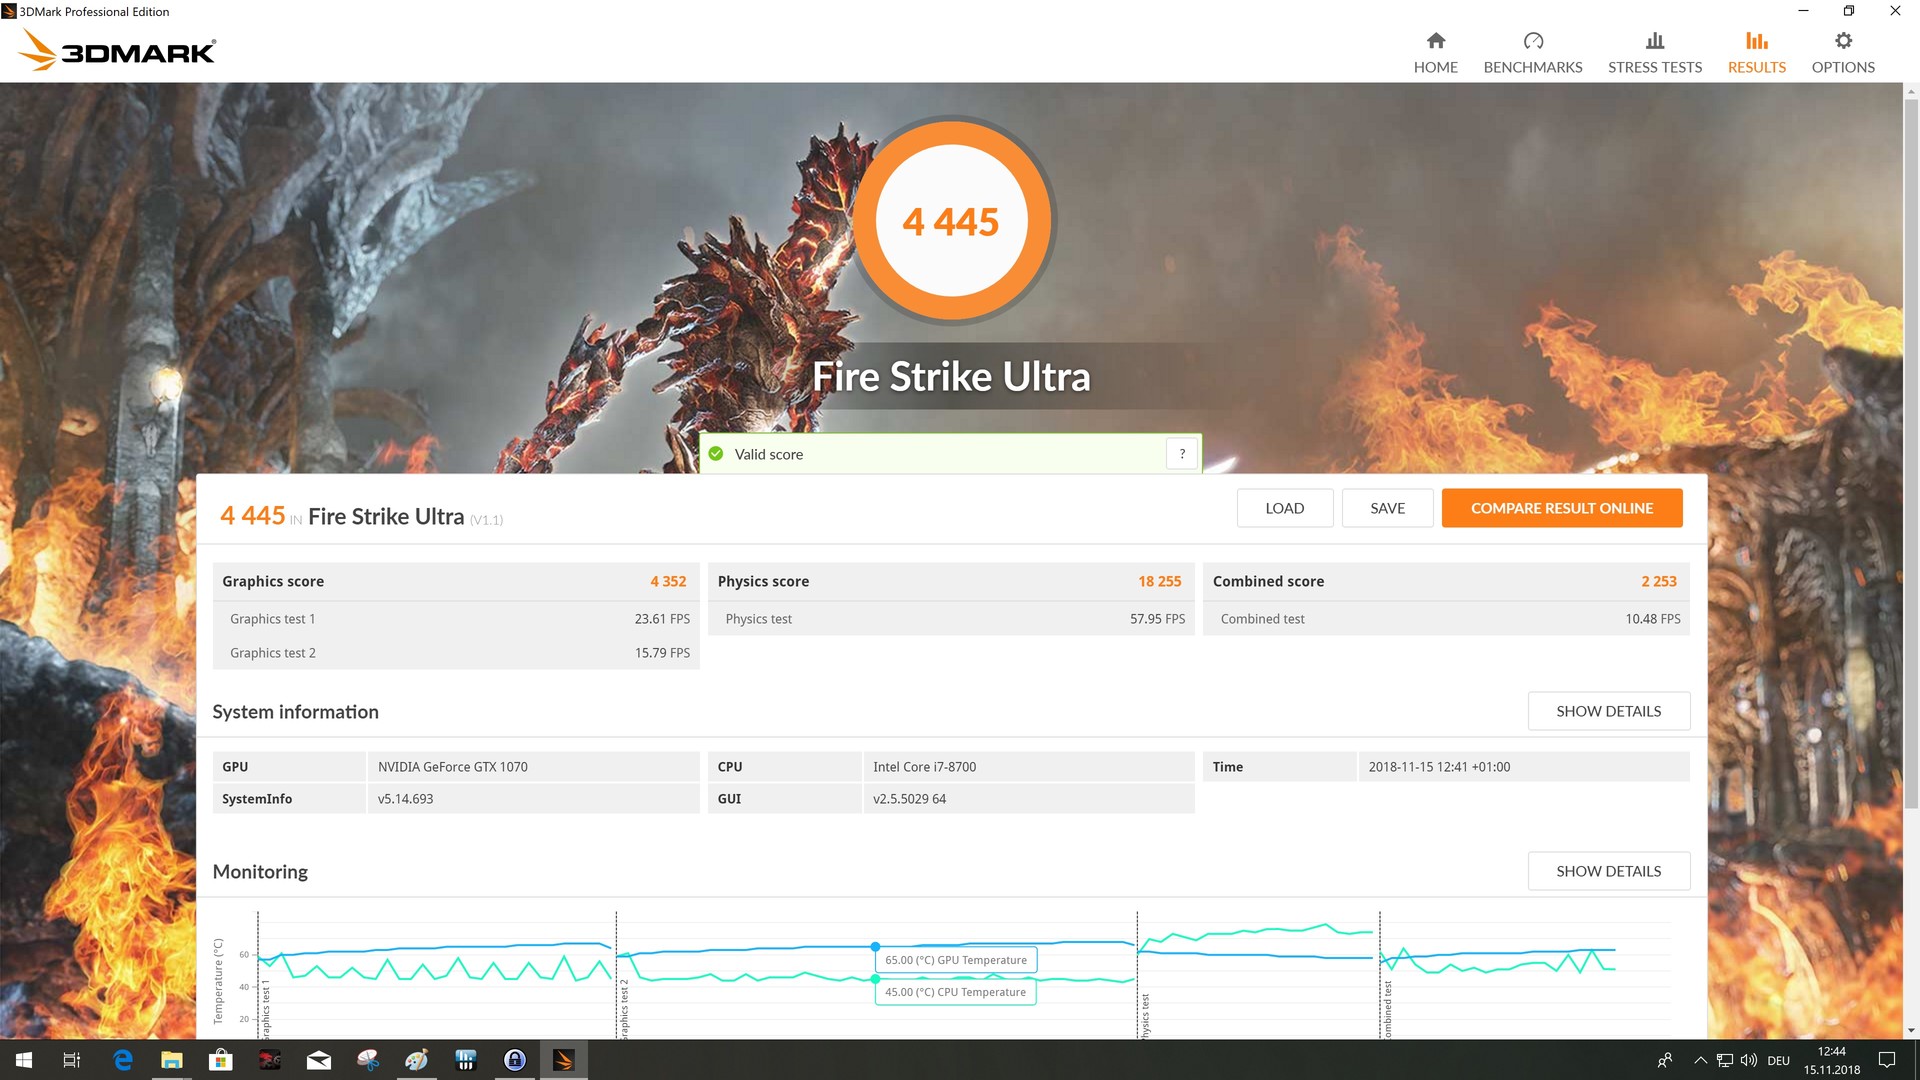
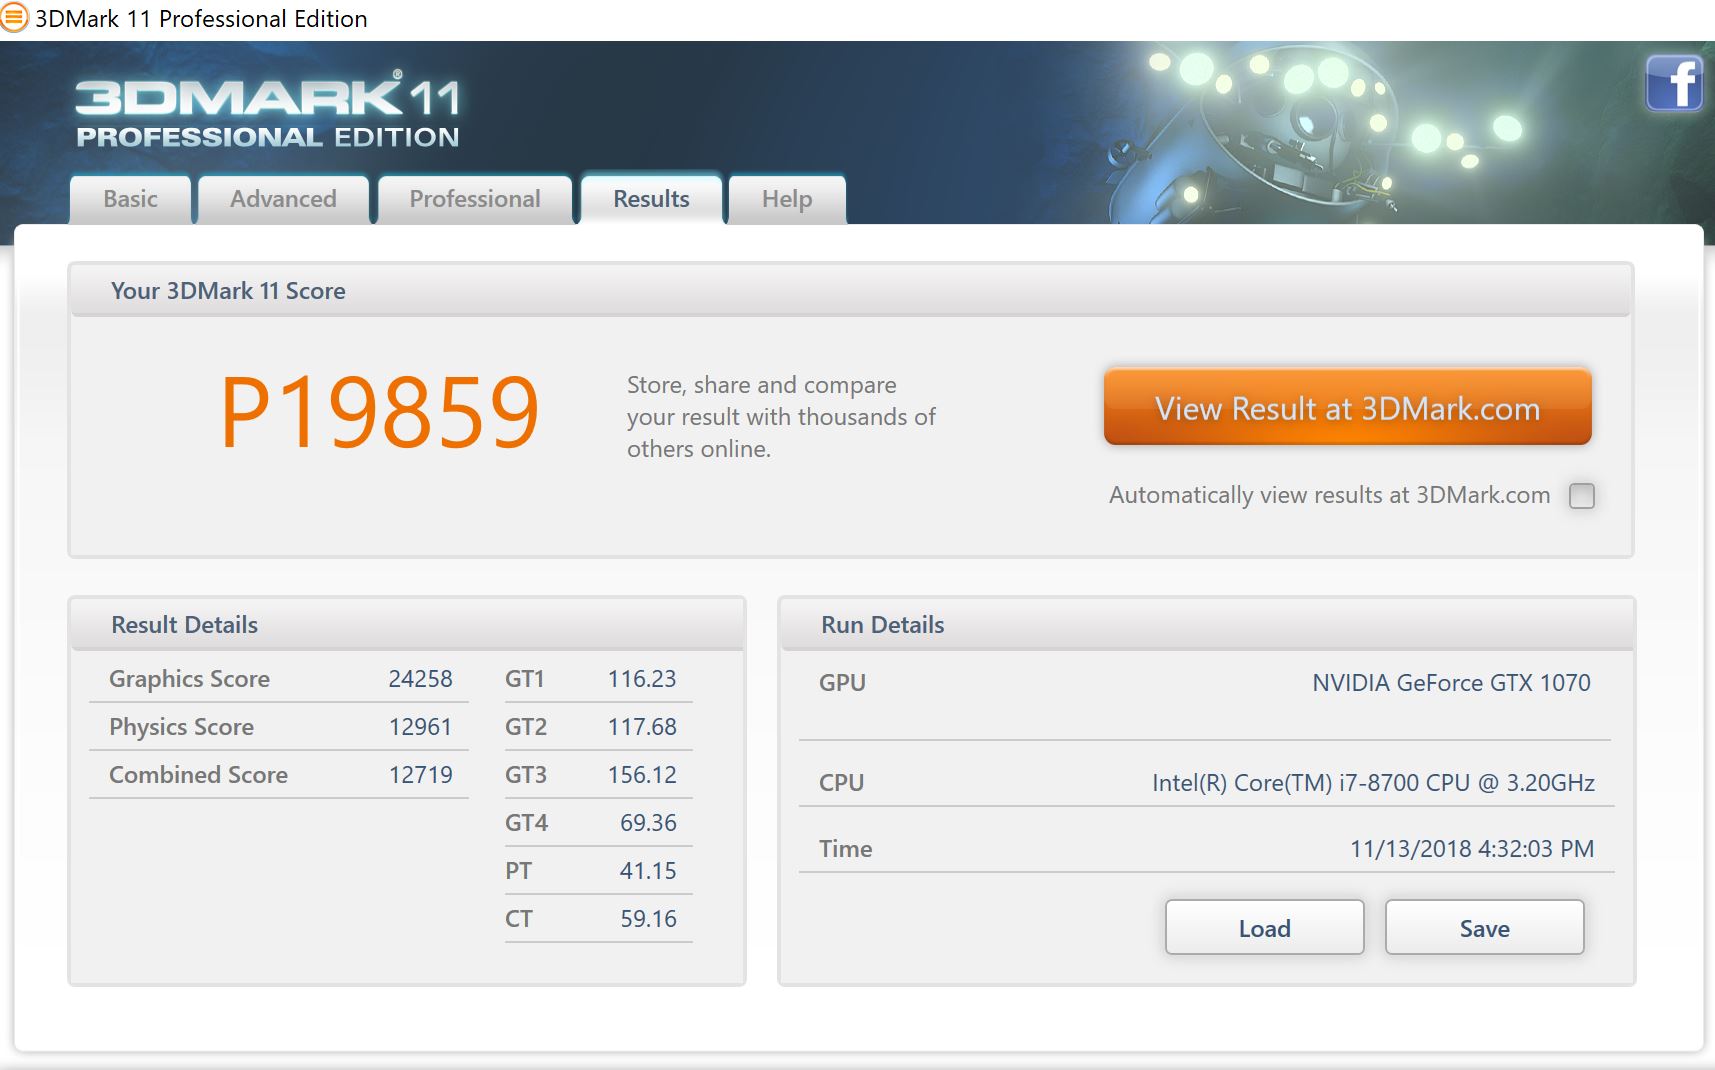
The Aegis 3 8RD has an Nvidia GeForce GTX 1070 GPU, which is the MSI-customised Armor 8G version. The GPU has 8 GB GDD5 VRAM and a 1,557 MHz base clock speed that can boost up to 1,747 MHz when required. Overall, the GPU is powerful enough to play modern games at high resolutions with smooth frame rates. The GPU in our test machine performed at expected levels in synthetic benchmarks too.
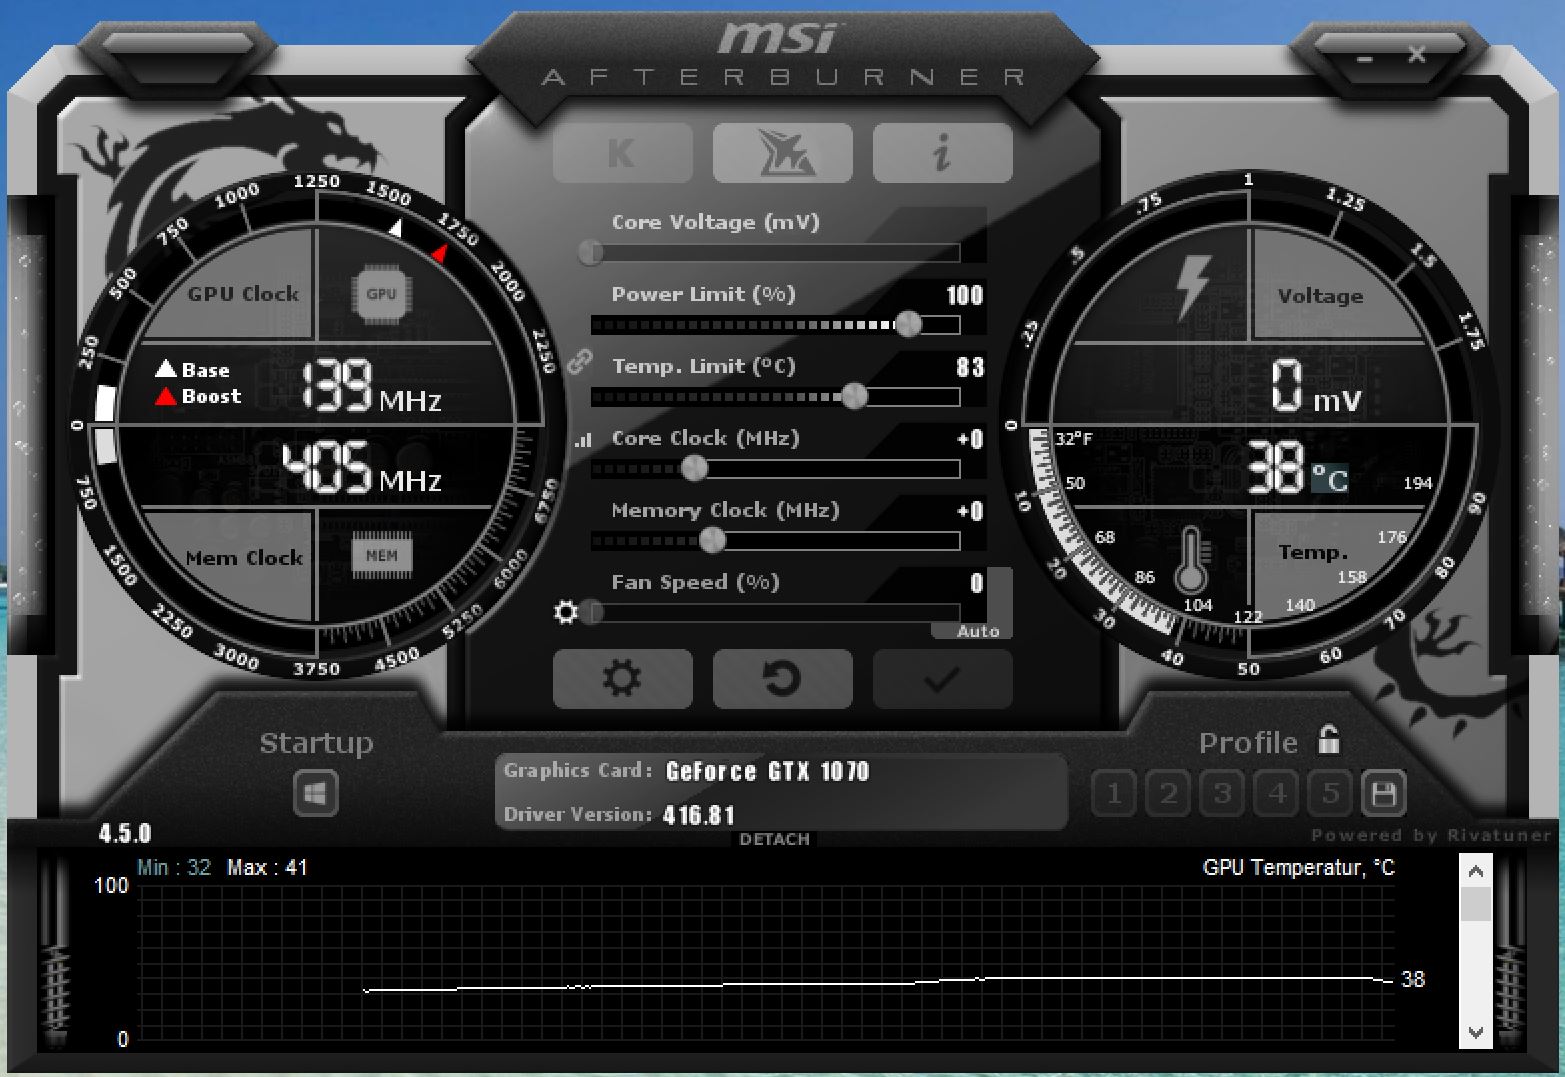
You could also use MSI Afterburner to overclock the GPU for improved performance at the cost of higher power consumption. The GeForce GTX 1070 in our test machine could handle a 108% power limit, but your results may vary. We would not recommend overclocking the GPU though given how compact the case is. An 8% power limit increase is relatively low too.
| 3DMark 11 - 1280x720 Performance GPU | |
| Average of class Desktop (650 - 104464, n=36, last 2 years) | |
| AMD Radeon RX Vega 64 | |
| AMD Radeon RX Vega 64 | |
| AMD Radeon RX Vega 64 | |
| AMD Radeon RX Vega 64 | |
| AMD Radeon RX Vega 64 | |
| AMD Radeon RX Vega 64 | |
| AMD Radeon RX Vega 64 | |
| NVIDIA Titan X Pascal | |
| Average NVIDIA GeForce GTX 1070 (Desktop) (23660 - 26098, n=5) | |
| NVIDIA GeForce GTX 1070 (Desktop) | |
| 3DMark 03 Standard | 163345 points | |
| 3DMark 06 Standard Score | 39794 points | |
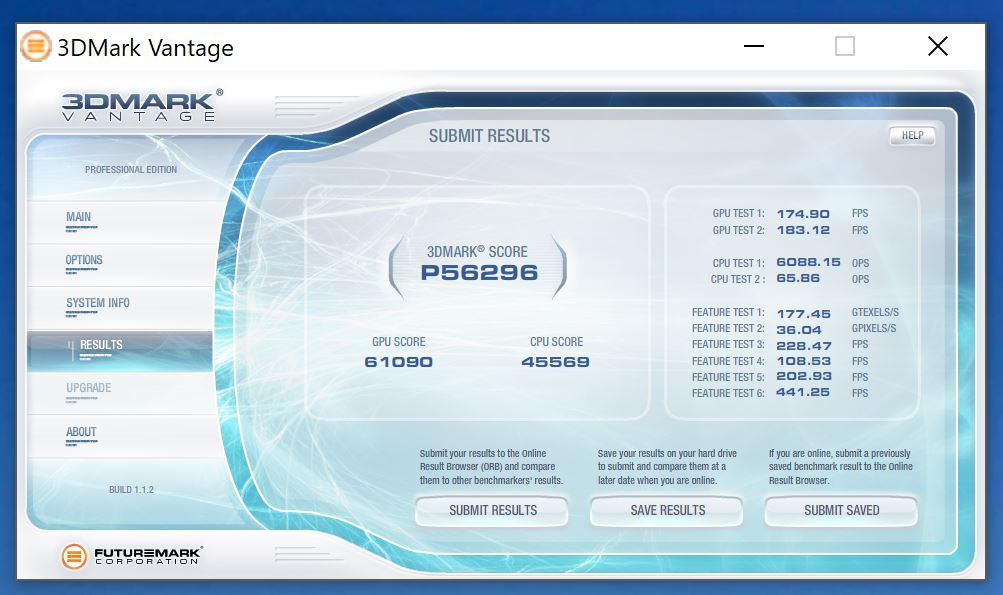
| 3DMark Vantage P Result | 56296 points | |
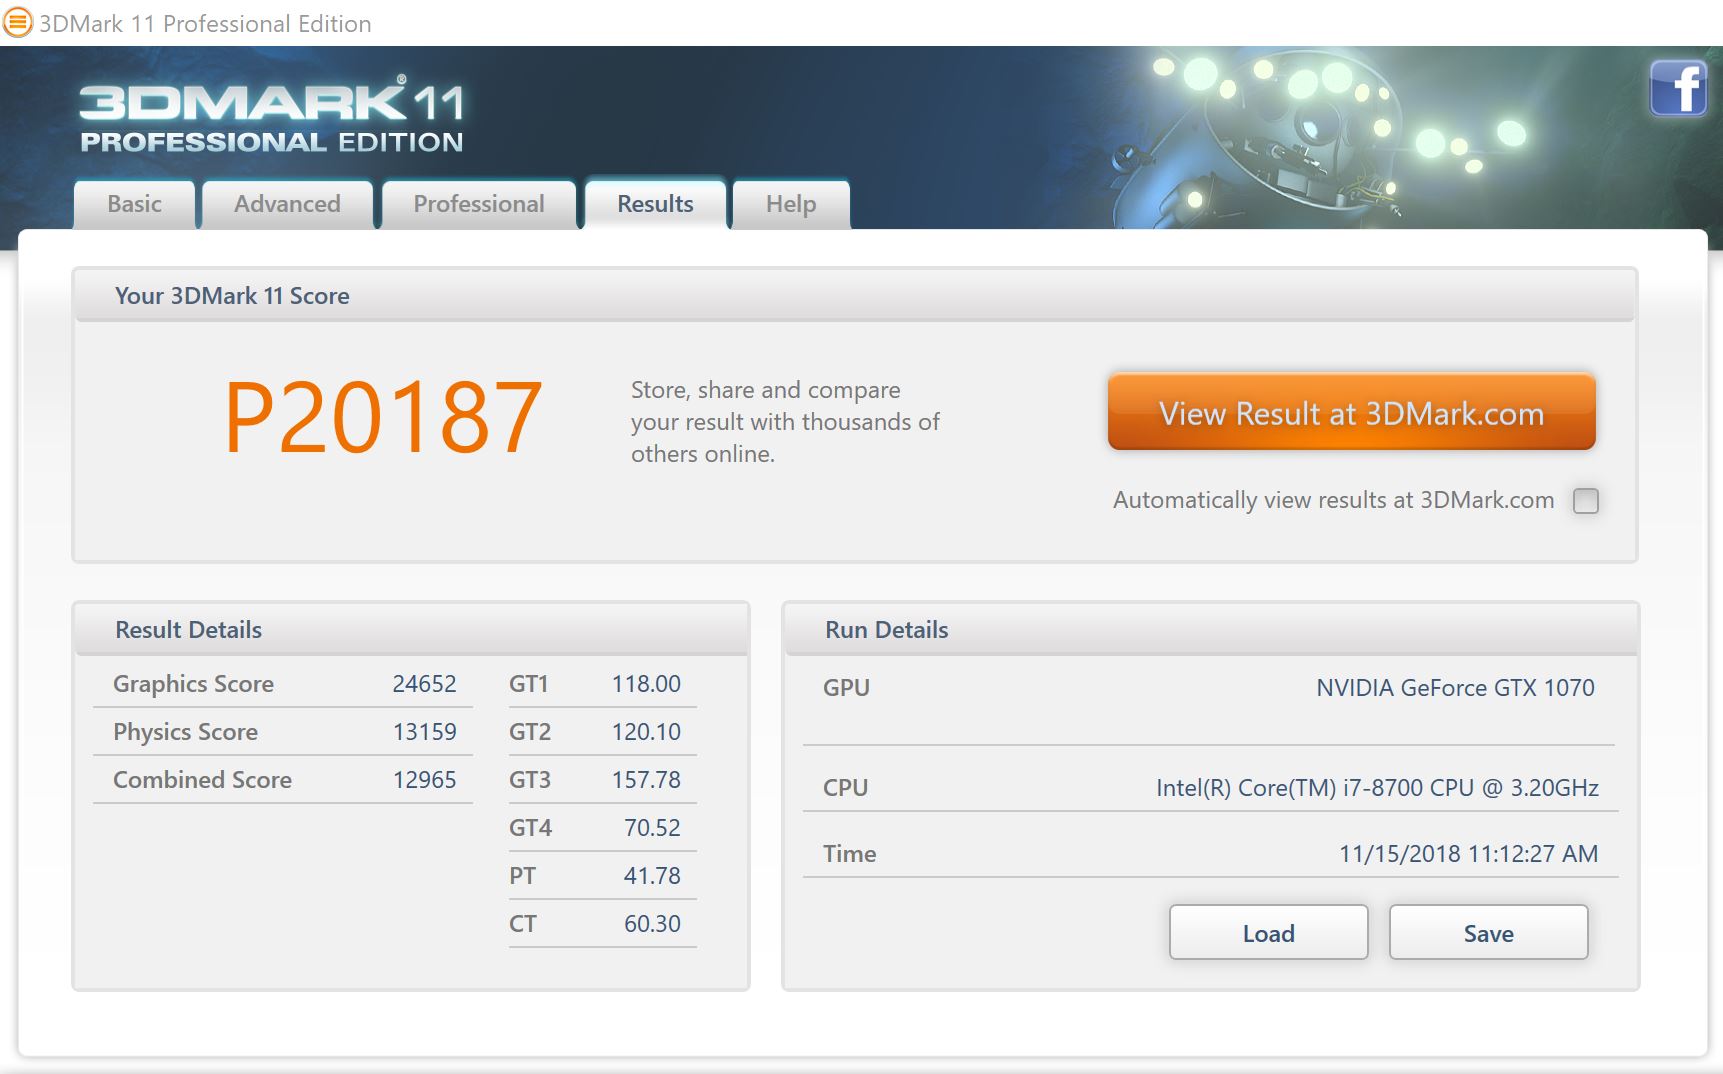
| 3DMark 11 Performance | 20187 points | |
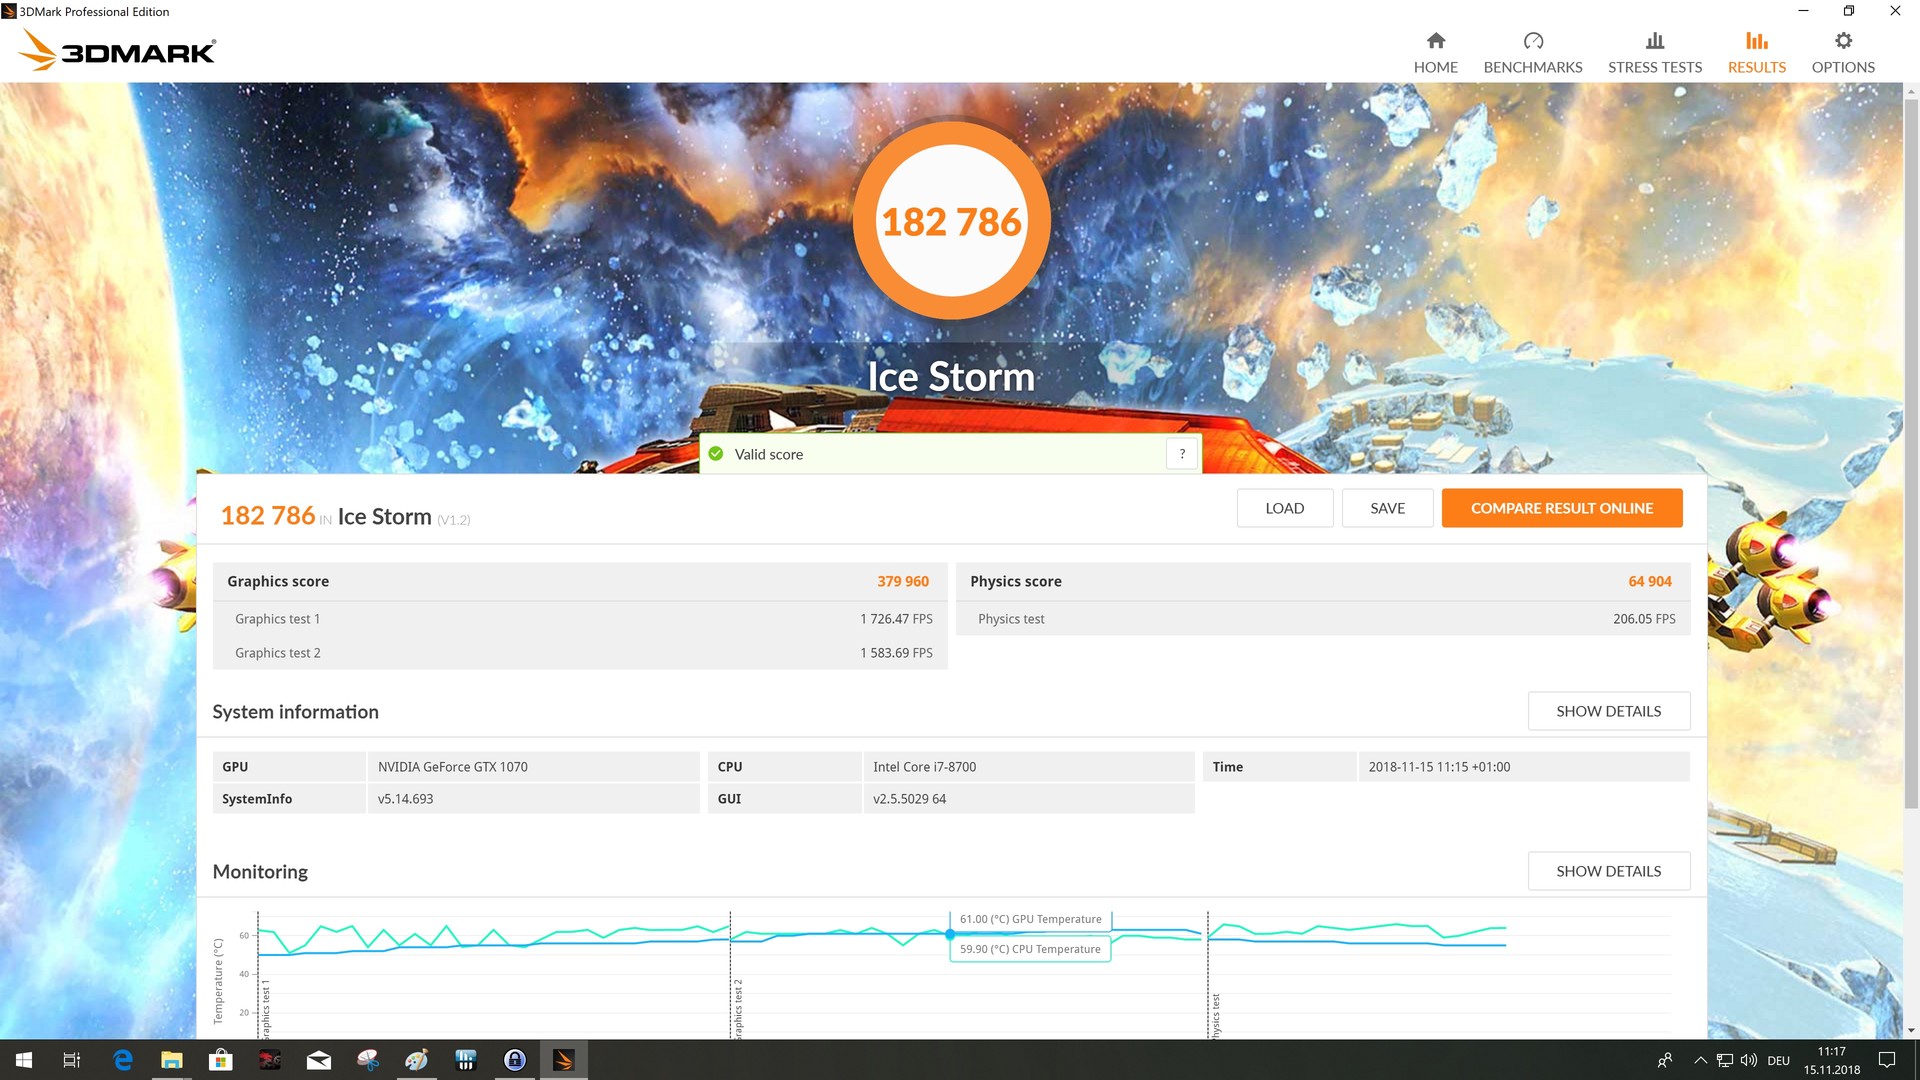
| 3DMark Ice Storm Standard Score | 182786 points | |
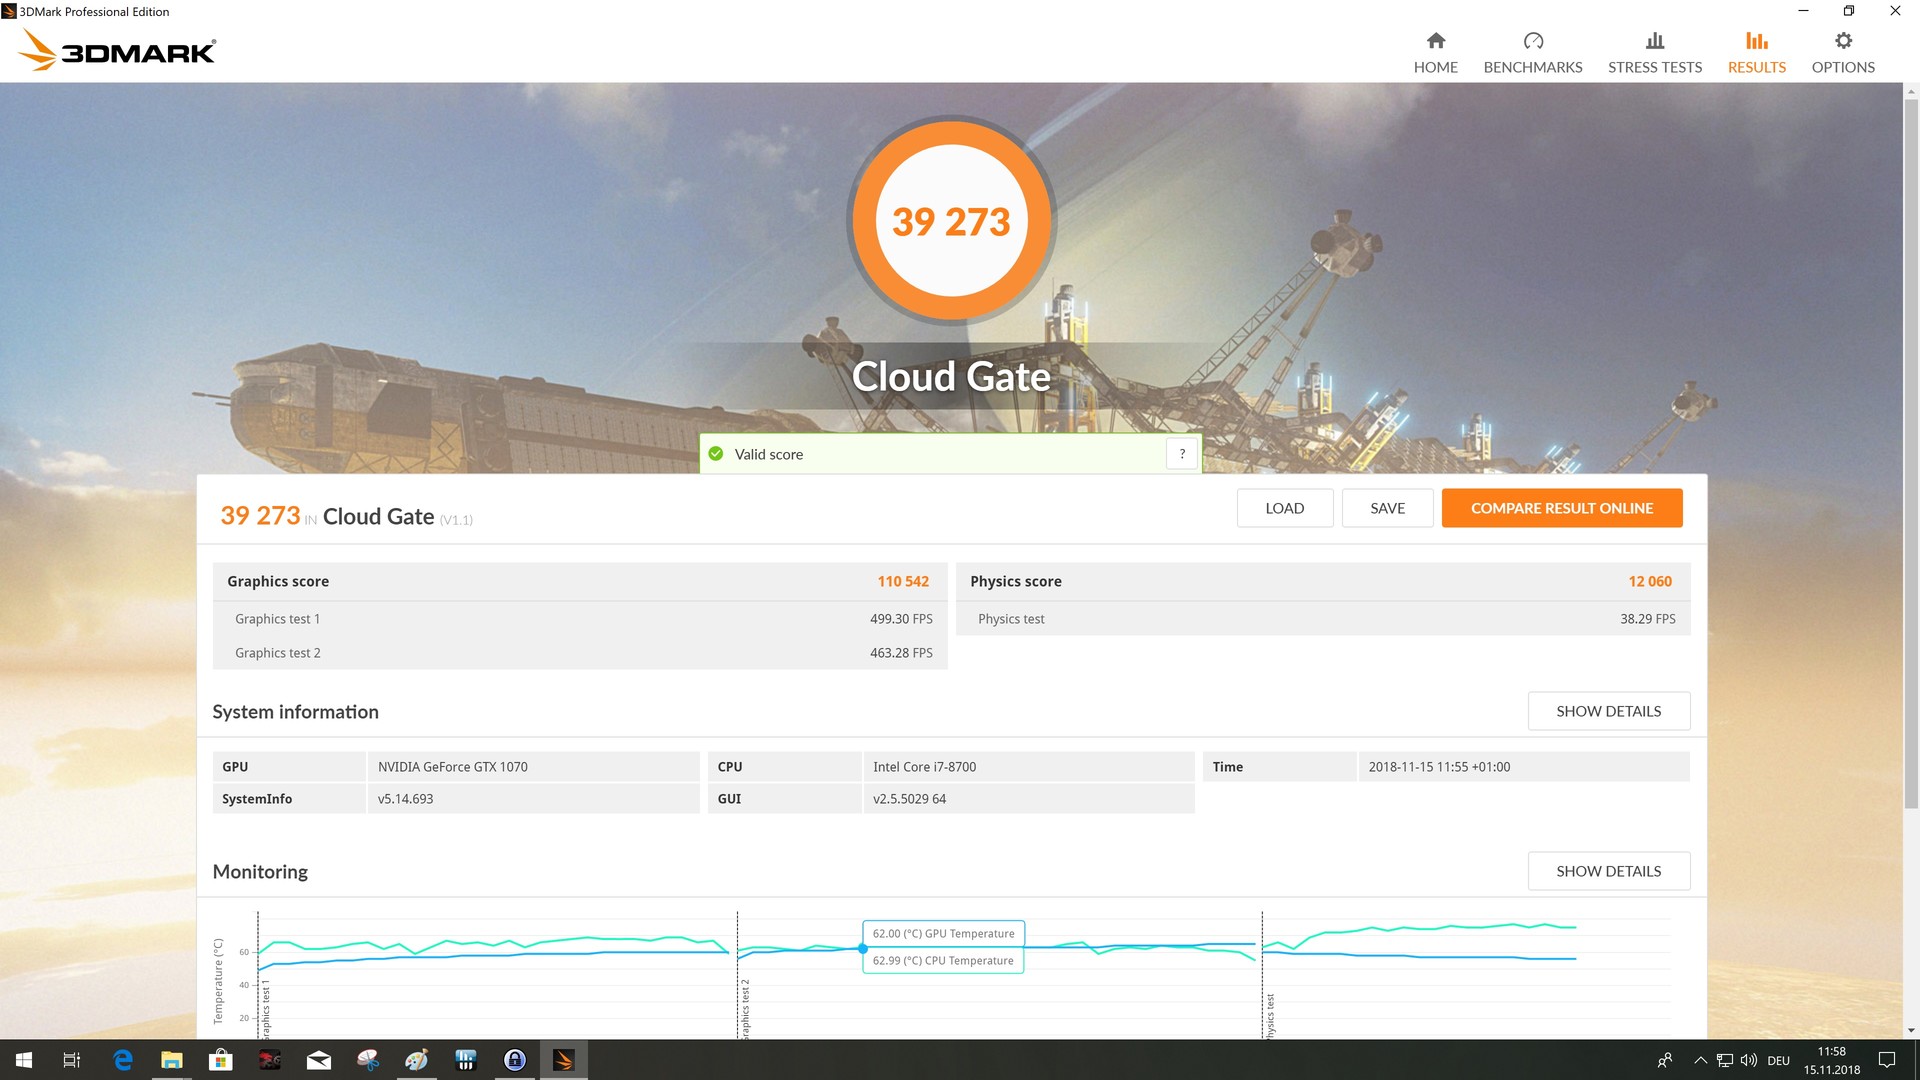
| 3DMark Cloud Gate Standard Score | 39273 points | |
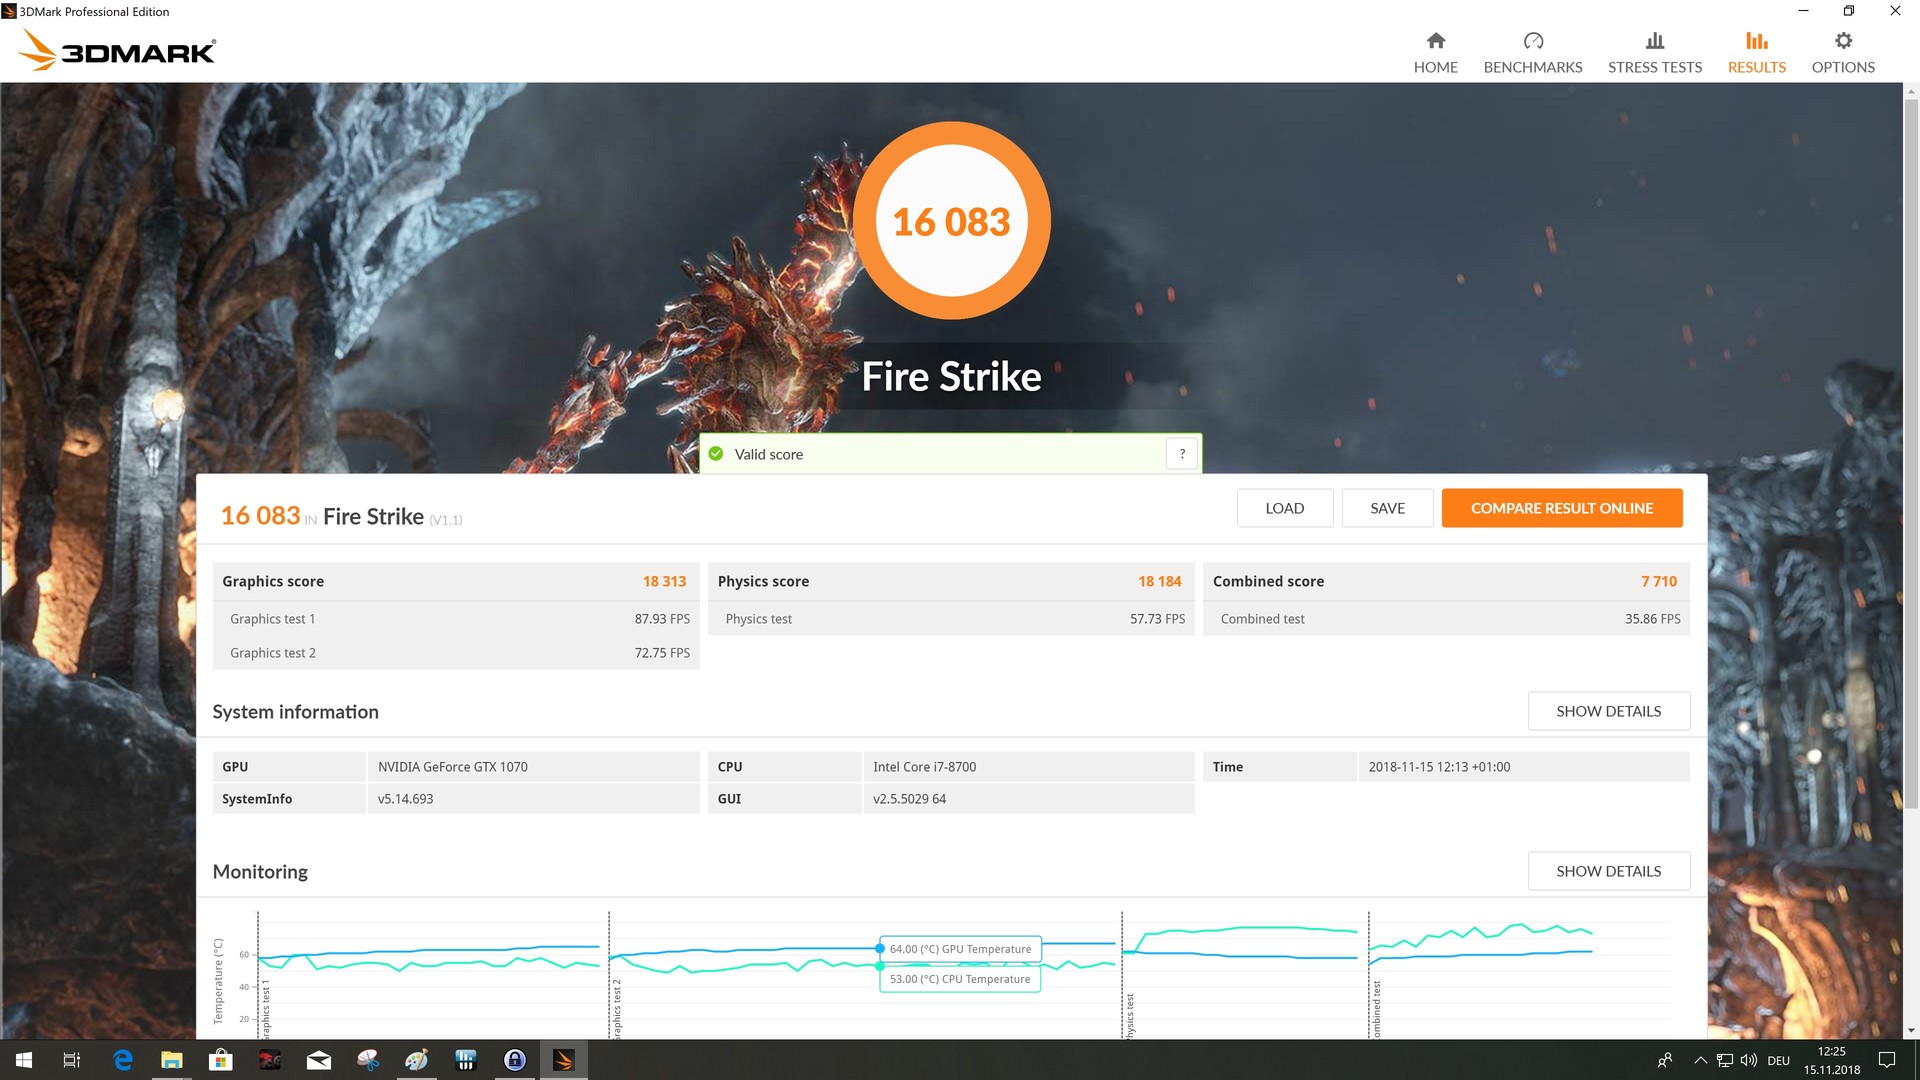
| 3DMark Fire Strike Score | 16083 points | |
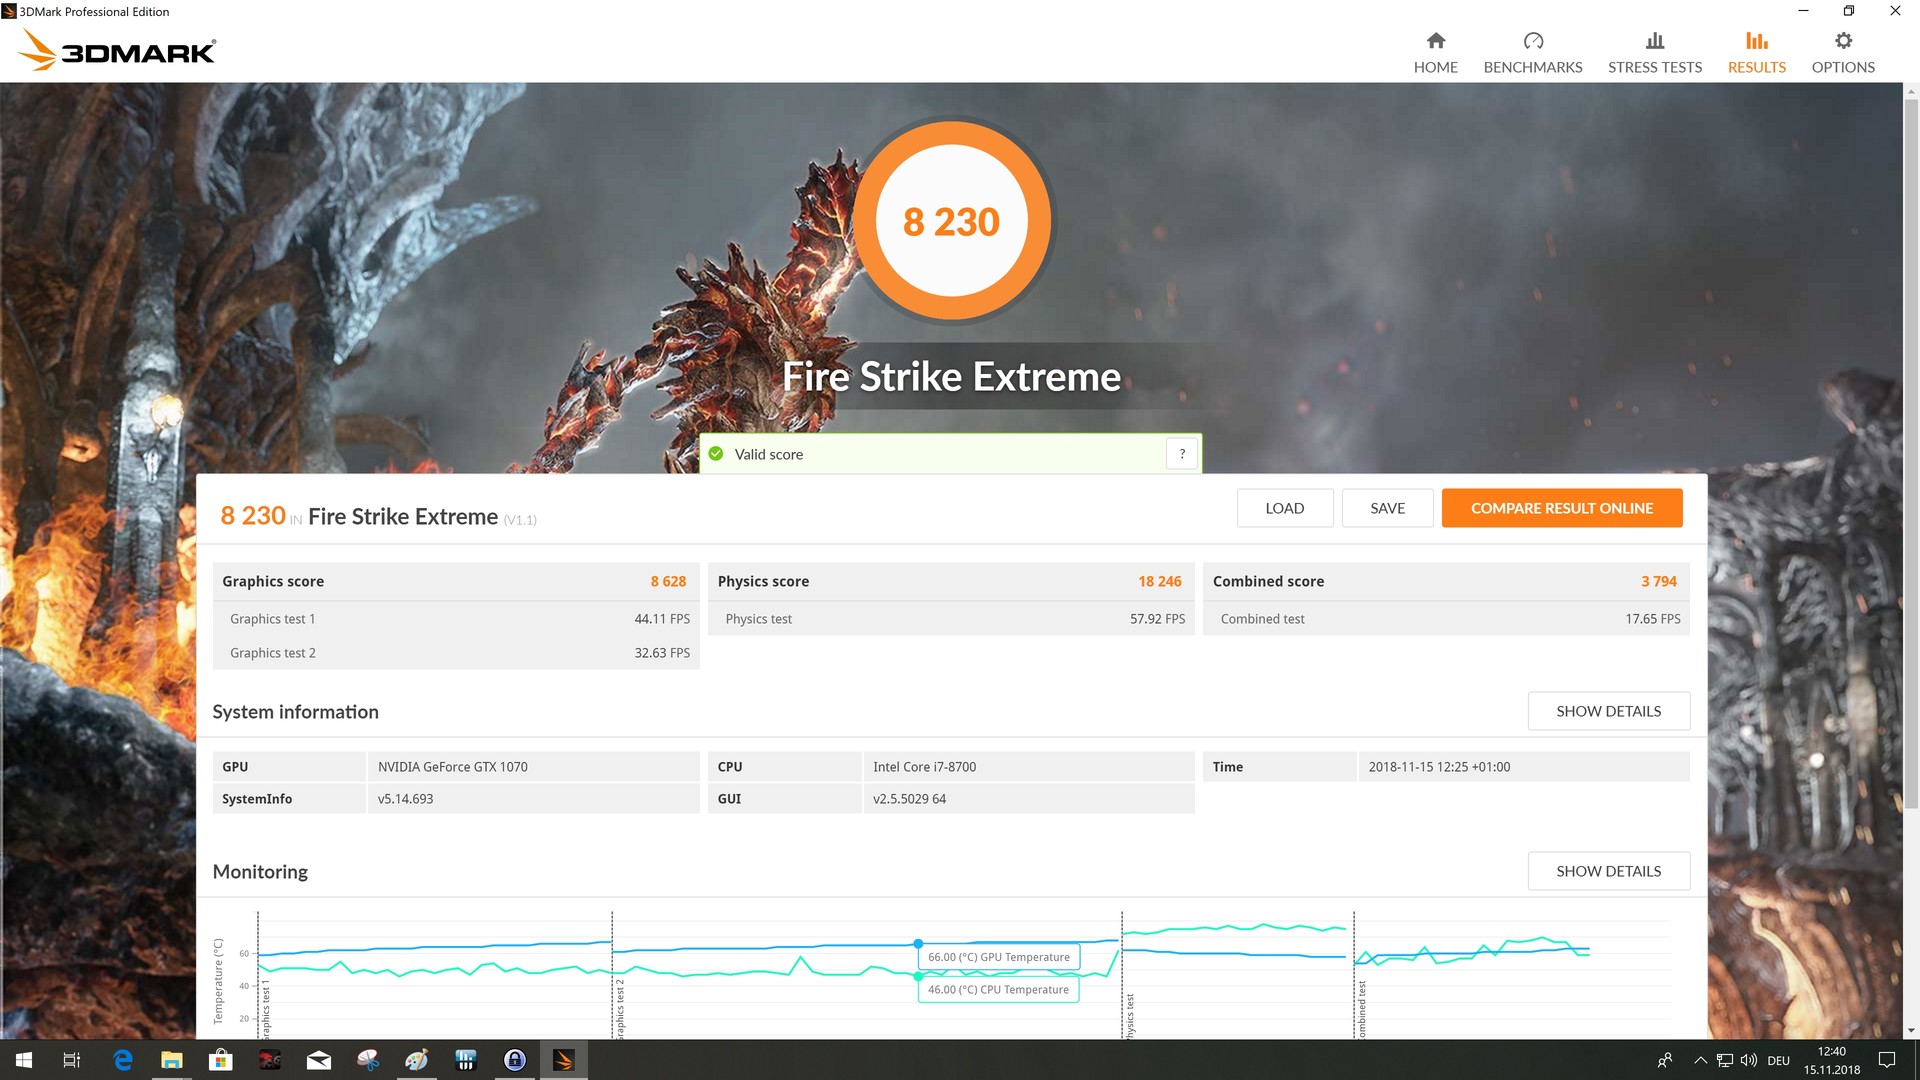
| 3DMark Fire Strike Extreme Score | 8230 points | |
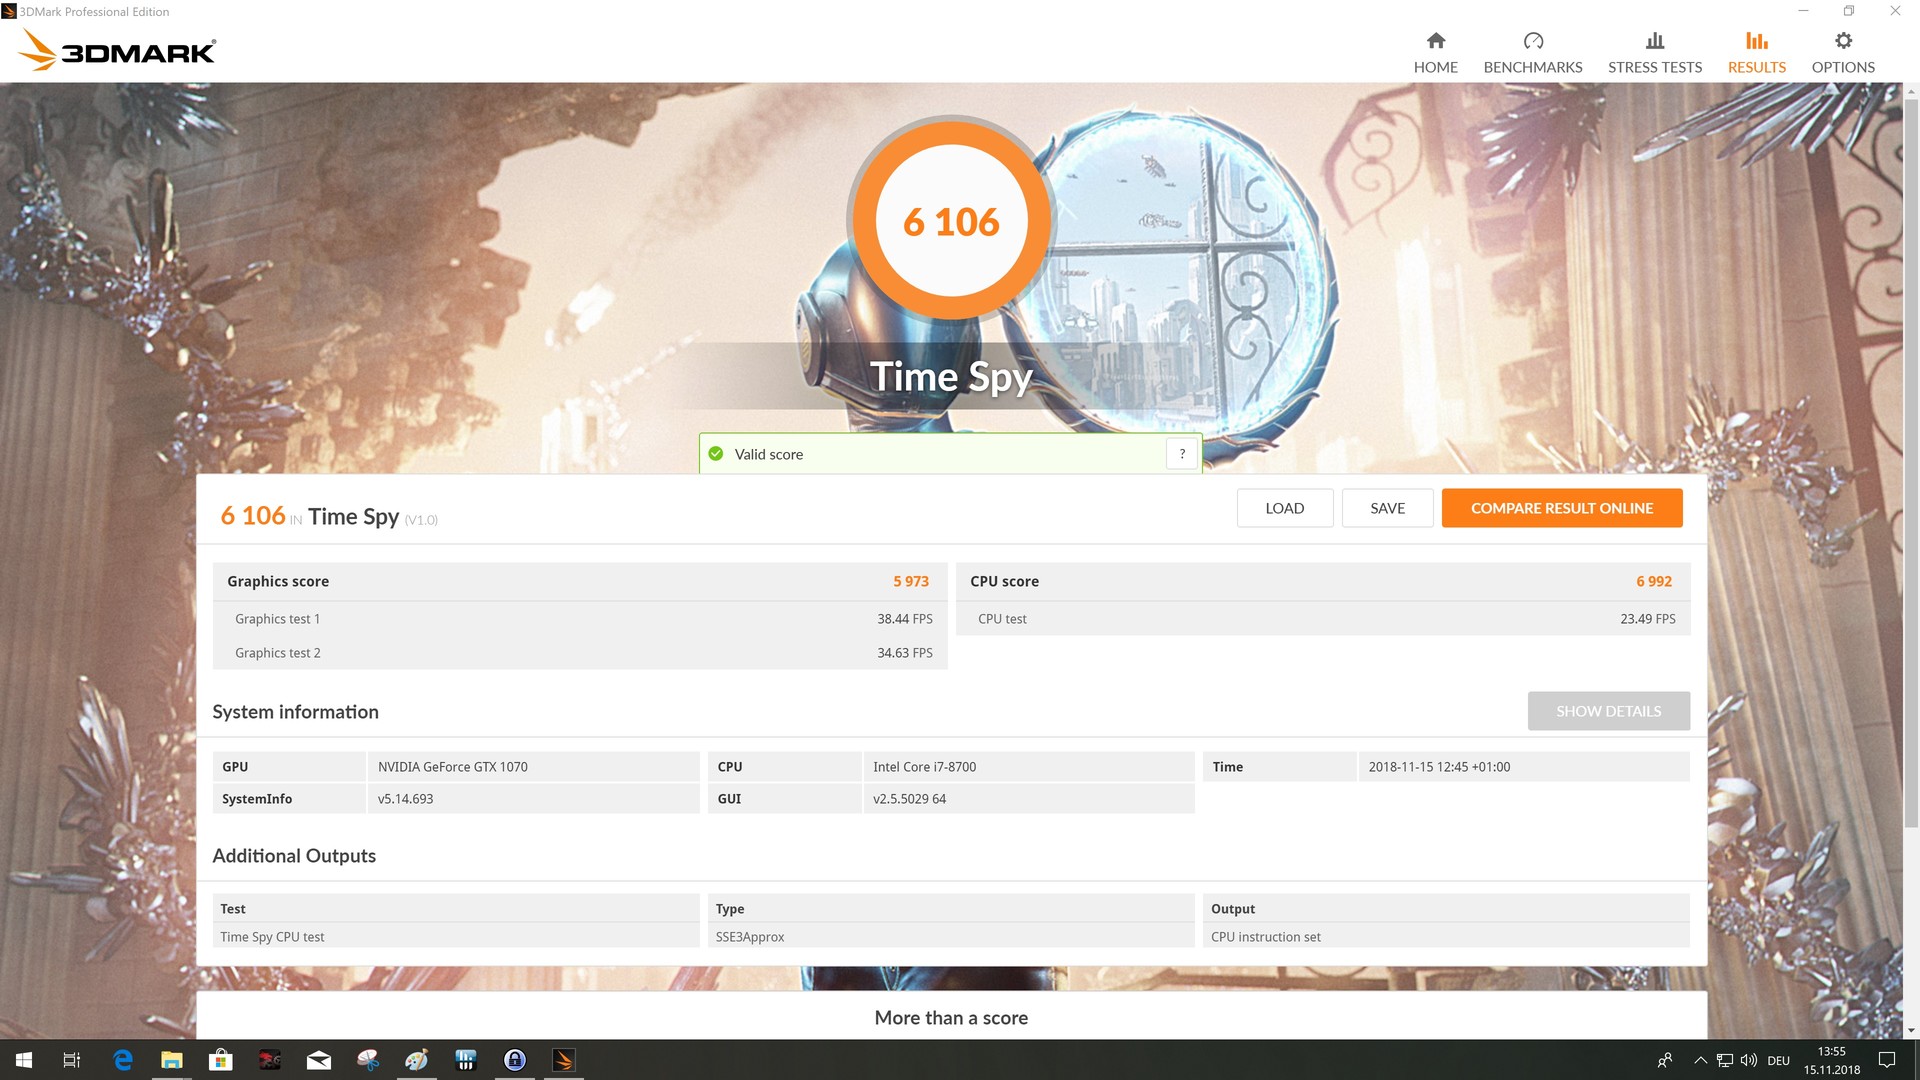
| 3DMark Time Spy Score | 6106 points | |
Help | ||
Gaming Performance
While the Aegis 3 8RD fell behind in synthetic benchmarks, it beats most of our comparison test systems. Our Core i7-8700K-powered system scored consistently higher framerates in the games that we tested, while the AMD Radeon RX Vega 64 generally outperforms the GeForce GTX 1070, although the latter has an advantage in games like Assassin’s Creed Odyssey, Battlefield 4 and Rise of the Tomb Raider.
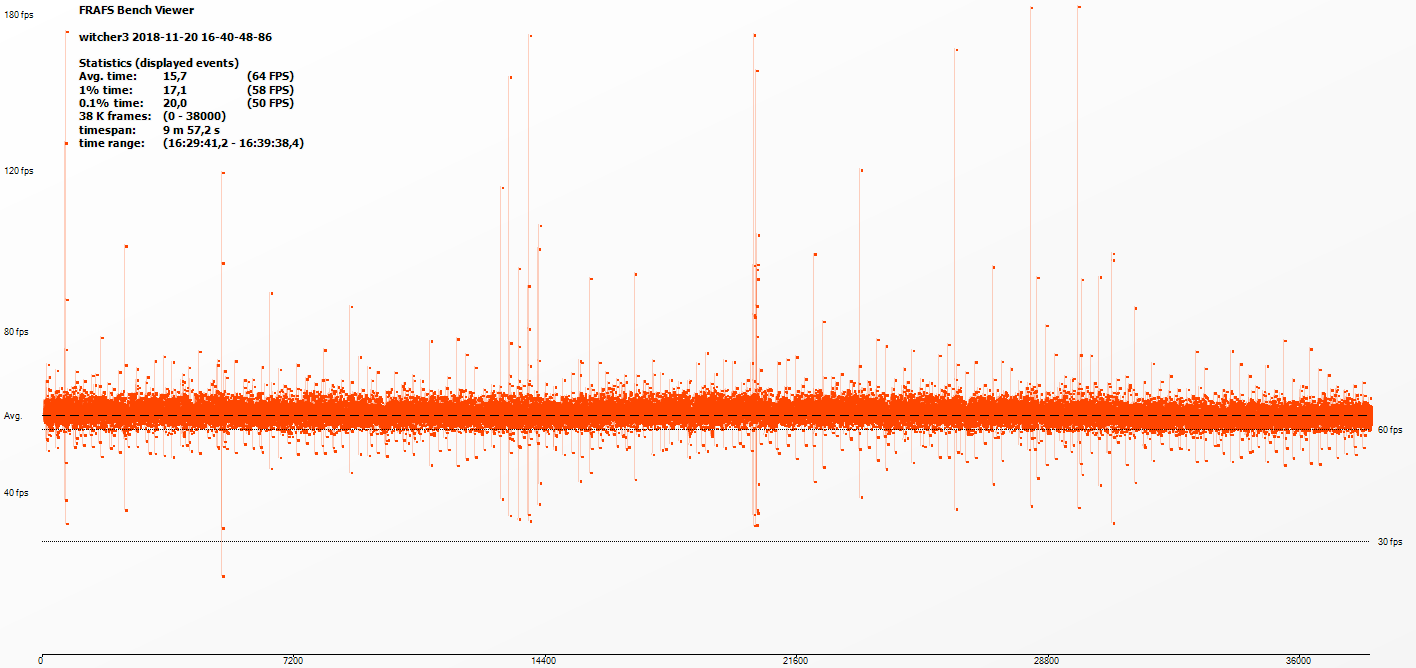
Overall, the Aegis 3 8RD delivered consistently high performance in the games against which we tested it, but it falls just short of being powerful enough for always smooth 4K gaming. Games like FIFA 19 and Call of Duty Black Ops 4 averaged over 100 FPS on our test system at 4K, but others like Kingdom Come: Deliverance, Monster Hunter World and Shadow of the Tomb Raider would not average even 30 FPS. Dropping the graphics preset or the resolution to 1,440p fixes these low frame rates though. We also noticed no performance spikes during a stress test, which we conducted with The Witcher 3 set to the ultra preset.
| Performance Rating - Percent | |
| AMD Radeon RX Vega 64 -2! | |
| NVIDIA GeForce GTX 1070 (Desktop) | |
| AMD Radeon RX Vega 64 -6! | |
| AMD Radeon RX Vega 64 -6! | |
| AMD Radeon RX Vega 64 -6! | |
| AMD Radeon RX Vega 64 | |
| AMD Radeon RX Vega 64 -6! | |
| AMD Radeon RX Vega 64 -2! | |
| NVIDIA Titan X Pascal -12! | |
| The Witcher 3 | |
| 1024x768 Low Graphics & Postprocessing | |
| AMD Radeon RX Vega 64 | |
| AMD Radeon RX Vega 64 | |
| AMD Radeon RX Vega 64 | |
| AMD Radeon RX Vega 64 | |
| AMD Radeon RX Vega 64 | |
| NVIDIA GeForce GTX 1070 (Desktop) | |
| AMD Radeon RX Vega 64 | |
| AMD Radeon RX Vega 64 | |
| 1920x1080 Ultra Graphics & Postprocessing (HBAO+) | |
| AMD Radeon RX Vega 64 | |
| AMD Radeon RX Vega 64 | |
| AMD Radeon RX Vega 64 | |
| AMD Radeon RX Vega 64 | |
| AMD Radeon RX Vega 64 | |
| AMD Radeon RX Vega 64 | |
| AMD Radeon RX Vega 64 | |
| NVIDIA GeForce GTX 1070 (Desktop) | |
| Rise of the Tomb Raider | |
| 1024x768 Lowest Preset | |
| AMD Radeon RX Vega 64 | |
| NVIDIA GeForce GTX 1070 (Desktop) | |
| AMD Radeon RX Vega 64 | |
| AMD Radeon RX Vega 64 | |
| AMD Radeon RX Vega 64 | |
| AMD Radeon RX Vega 64 | |
| AMD Radeon RX Vega 64 | |
| AMD Radeon RX Vega 64 | |
| 1920x1080 Very High Preset AA:FX AF:16x | |
| AMD Radeon RX Vega 64 | |
| NVIDIA GeForce GTX 1070 (Desktop) | |
| AMD Radeon RX Vega 64 | |
| AMD Radeon RX Vega 64 | |
| AMD Radeon RX Vega 64 | |
| AMD Radeon RX Vega 64 | |
| AMD Radeon RX Vega 64 | |
| AMD Radeon RX Vega 64 | |
| Battlefield 1 | |
| 1280x720 Low Preset | |
| AMD Radeon RX Vega 64 | |
| AMD Radeon RX Vega 64 | |
| AMD Radeon RX Vega 64 | |
| AMD Radeon RX Vega 64 | |
| AMD Radeon RX Vega 64 | |
| NVIDIA GeForce GTX 1070 (Desktop) | |
| AMD Radeon RX Vega 64 | |
| AMD Radeon RX Vega 64 | |
| 1920x1080 Ultra Preset AA:T | |
| AMD Radeon RX Vega 64 | |
| AMD Radeon RX Vega 64 | |
| AMD Radeon RX Vega 64 | |
| AMD Radeon RX Vega 64 | |
| AMD Radeon RX Vega 64 | |
| AMD Radeon RX Vega 64 | |
| AMD Radeon RX Vega 64 | |
| NVIDIA GeForce GTX 1070 (Desktop) | |
| Assassin´s Creed Origins | |
| 1280x720 Very Low Preset | |
| NVIDIA GeForce GTX 1070 (Desktop) | |
| AMD Radeon RX Vega 64 | |
| AMD Radeon RX Vega 64 | |
| AMD Radeon RX Vega 64 | |
| AMD Radeon RX Vega 64 | |
| AMD Radeon RX Vega 64 | |
| AMD Radeon RX Vega 64 | |
| AMD Radeon RX Vega 64 | |
| 1920x1080 Ultra High Preset | |
| NVIDIA GeForce GTX 1070 (Desktop) | |
| AMD Radeon RX Vega 64 | |
| AMD Radeon RX Vega 64 | |
| AMD Radeon RX Vega 64 | |
| AMD Radeon RX Vega 64 | |
| AMD Radeon RX Vega 64 | |
| AMD Radeon RX Vega 64 | |
| AMD Radeon RX Vega 64 | |
| Final Fantasy XV Benchmark | |
| 1280x720 Lite Quality | |
| AMD Radeon RX Vega 64 | |
| AMD Radeon RX Vega 64 | |
| NVIDIA GeForce GTX 1070 (Desktop) | |
| AMD Radeon RX Vega 64 | |
| AMD Radeon RX Vega 64 | |
| AMD Radeon RX Vega 64 | |
| AMD Radeon RX Vega 64 | |
| AMD Radeon RX Vega 64 | |
| 1920x1080 High Quality | |
| AMD Radeon RX Vega 64 | |
| AMD Radeon RX Vega 64 | |
| NVIDIA GeForce GTX 1070 (Desktop) | |
| AMD Radeon RX Vega 64 | |
| AMD Radeon RX Vega 64 | |
| AMD Radeon RX Vega 64 | |
| AMD Radeon RX Vega 64 | |
| AMD Radeon RX Vega 64 | |
| AMD Radeon RX Vega 64 | |
| Far Cry 5 | |
| 1280x720 Low Preset AA:T | |
| AMD Radeon RX Vega 64 | |
| NVIDIA GeForce GTX 1070 (Desktop) | |
| AMD Radeon RX Vega 64 | |
| AMD Radeon RX Vega 64 | |
| AMD Radeon RX Vega 64 | |
| AMD Radeon RX Vega 64 | |
| AMD Radeon RX Vega 64 | |
| AMD Radeon RX Vega 64 | |
| NVIDIA Titan X Pascal | |
| 1920x1080 Ultra Preset AA:T | |
| AMD Radeon RX Vega 64 | |
| AMD Radeon RX Vega 64 | |
| AMD Radeon RX Vega 64 | |
| AMD Radeon RX Vega 64 | |
| AMD Radeon RX Vega 64 | |
| AMD Radeon RX Vega 64 | |
| NVIDIA GeForce GTX 1070 (Desktop) | |
| NVIDIA Titan X Pascal | |
| AMD Radeon RX Vega 64 | |
| Shadow of the Tomb Raider | |
| 1280x720 Lowest Preset | |
| AMD Radeon RX Vega 64 | |
| AMD Radeon RX Vega 64 | |
| NVIDIA GeForce GTX 1070 (Desktop) | |
| NVIDIA Titan X Pascal | |
| AMD Radeon RX Vega 64 | |
| 1920x1080 Highest Preset AA:T | |
| NVIDIA Titan X Pascal | |
| AMD Radeon RX Vega 64 | |
| AMD Radeon RX Vega 64 | |
| AMD Radeon RX Vega 64 | |
| NVIDIA GeForce GTX 1070 (Desktop) | |
| Forza Horizon 4 | |
| 1280x720 Very Low Preset | |
| AMD Radeon RX Vega 64 | |
| AMD Radeon RX Vega 64 | |
| AMD Radeon RX Vega 64 | |
| NVIDIA GeForce GTX 1070 (Desktop) | |
| NVIDIA Titan X Pascal | |
| 1920x1080 Ultra Preset AA:2xMS | |
| AMD Radeon RX Vega 64 | |
| AMD Radeon RX Vega 64 | |
| AMD Radeon RX Vega 64 | |
| NVIDIA Titan X Pascal | |
| NVIDIA GeForce GTX 1070 (Desktop) | |
| Assassin´s Creed Odyssey | |
| 1280x720 Low Preset | |
| NVIDIA Titan X Pascal | |
| NVIDIA GeForce GTX 1070 (Desktop) | |
| AMD Radeon RX Vega 64 | |
| AMD Radeon RX Vega 64 | |
| AMD Radeon RX Vega 64 | |
| 1920x1080 Ultra High Preset | |
| NVIDIA Titan X Pascal | |
| NVIDIA GeForce GTX 1070 (Desktop) | |
| AMD Radeon RX Vega 64 | |
| AMD Radeon RX Vega 64 | |
| AMD Radeon RX Vega 64 | |
| low | med. | high | ultra | 4K | |
| Battlefield 4 (2013) | 200 | 200 | 200 | 158.4 | 78 |
| GTA V (2015) | 174.1 | 168.6 | 148 | 101.4 | 89.5 |
| The Witcher 3 (2015) | 273.3 | 194.4 | 116 | 63.2 | 42.3 |
| Rainbow Six Siege (2015) | 322.9 | 279.7 | 207.2 | 189 | 74.9 |
| Rise of the Tomb Raider (2016) | 271.4 | 195.4 | 119 | 99.7 | 42 |
| Far Cry Primal (2016) | 154 | 131 | 116 | 94 | 41 |
| The Division (2016) | 245.9 | 192.1 | 109.3 | 86.5 | 42.2 |
| Overwatch (2016) | 300 | 297.2 | 279.7 | 176.8 | 60.8 |
| Deus Ex Mankind Divided (2016) | 160.7 | 144 | 87.2 | 62.9 | 29.6 |
| Battlefield 1 (2016) | 184.2 | 164.2 | 134.5 | 122.1 | 47.7 |
| Dishonored 2 (2016) | 118.8 | 118.4 | 111.4 | 102.1 | 45.2 |
| Watch Dogs 2 (2016) | 166.5 | 120.8 | 88.1 | 64 | 33.8 |
| For Honor (2017) | 298.6 | 151.7 | 143.4 | 115.7 | 47 |
| Ghost Recon Wildlands (2017) | 174.1 | 99.8 | 92 | 53.2 | 34.4 |
| Rocket League (2017) | 242.5 | 248 | 205.9 | 96.1 | |
| Dirt 4 (2017) | 308.9 | 234.5 | 171 | 95.9 | 56.3 |
| Playerunknown's Battlegrounds (PUBG) (2017) | 182.8 | 153.3 | 136.9 | 110.6 | 41.8 |
| Destiny 2 (2017) | 183.5 | 156.8 | 148.7 | 129.2 | 45.8 |
| Assassin´s Creed Origins (2017) | 111 | 94 | 86 | 72 | 32 |
| Call of Duty WWII (2017) | 256.8 | 249 | 156 | 120.2 | 60.4 |
| Fortnite (2018) | 247 | 226.5 | 169.2 | 124.9 | 38.4 |
| Final Fantasy XV Benchmark (2018) | 145.4 | 85 | 59.6 | 27 | |
| Kingdom Come: Deliverance (2018) | 138.8 | 103.2 | 82.8 | 63.2 | 22 |
| Far Cry 5 (2018) | 141 | 103 | 96 | 90 | 35 |
| The Crew 2 (2018) | 60 | 60 | 60 | 60 | 41.3 |
| Monster Hunter World (2018) | 166.8 | 102.3 | 93.5 | 72.2 | 22.4 |
| F1 2018 (2018) | 249 | 177 | 142 | 95 | 47 |
| Shadow of the Tomb Raider (2018) | 155 | 93 | 86 | 75 | 25 |
| FIFA 19 (2018) | 273.3 | 248.7 | 232.1 | 229.3 | 117.4 |
| Forza Horizon 4 (2018) | 180 | 127 | 118 | 94 | 52 |
| Assassin´s Creed Odyssey (2018) | 113 | 89 | 76 | 55 | 26 |
| Call of Duty Black Ops 4 (2018) | 224.7 | 199.5 | 196.7 | 184.5 | 64.6 |
| Hitman 2 (2018) | 92.7 | 91.4 | 83.2 | 80.2 | 39.7 |
| Fallout 76 (2018) | 60 | 60 | 59.9 | 59.9 | 43.3 |
| Battlefield V (2018) | 177.3 | 136.6 | 117.5 | 106.7 | 44.9 |
Overclocking
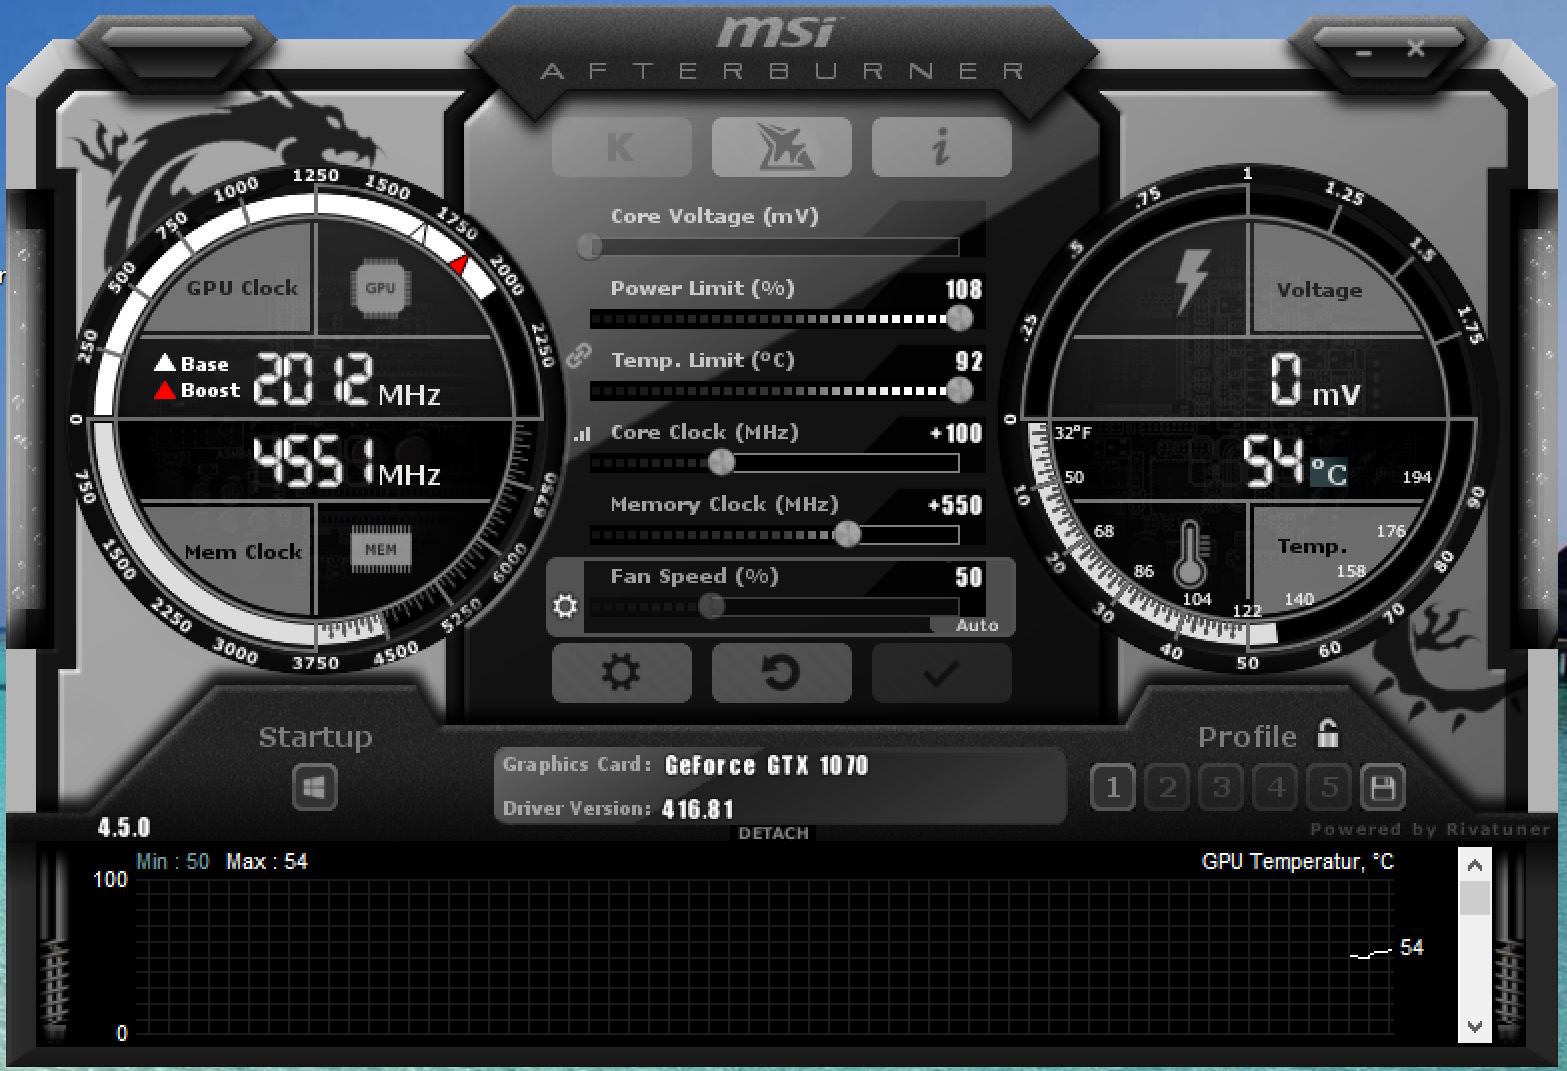
We also tried to overclock our test machine, but the locked multiplier on the Core i7-8700 prevented us from doing so. MSI do sell a version with a Core i7-8700K processor, but the company could prevent the CPU from being overclocked. There are no overclocking-related options within the BIOS on our test device, so we suspect that overclocking is out of the question even with an unlocked CPU. This makes sense though, given the limited cooling within the Aegis 3 8RD’s compact case and that MSI has included a 450 W power supply, which may reach its limits if it were to power an overclocked CPU and GPU.
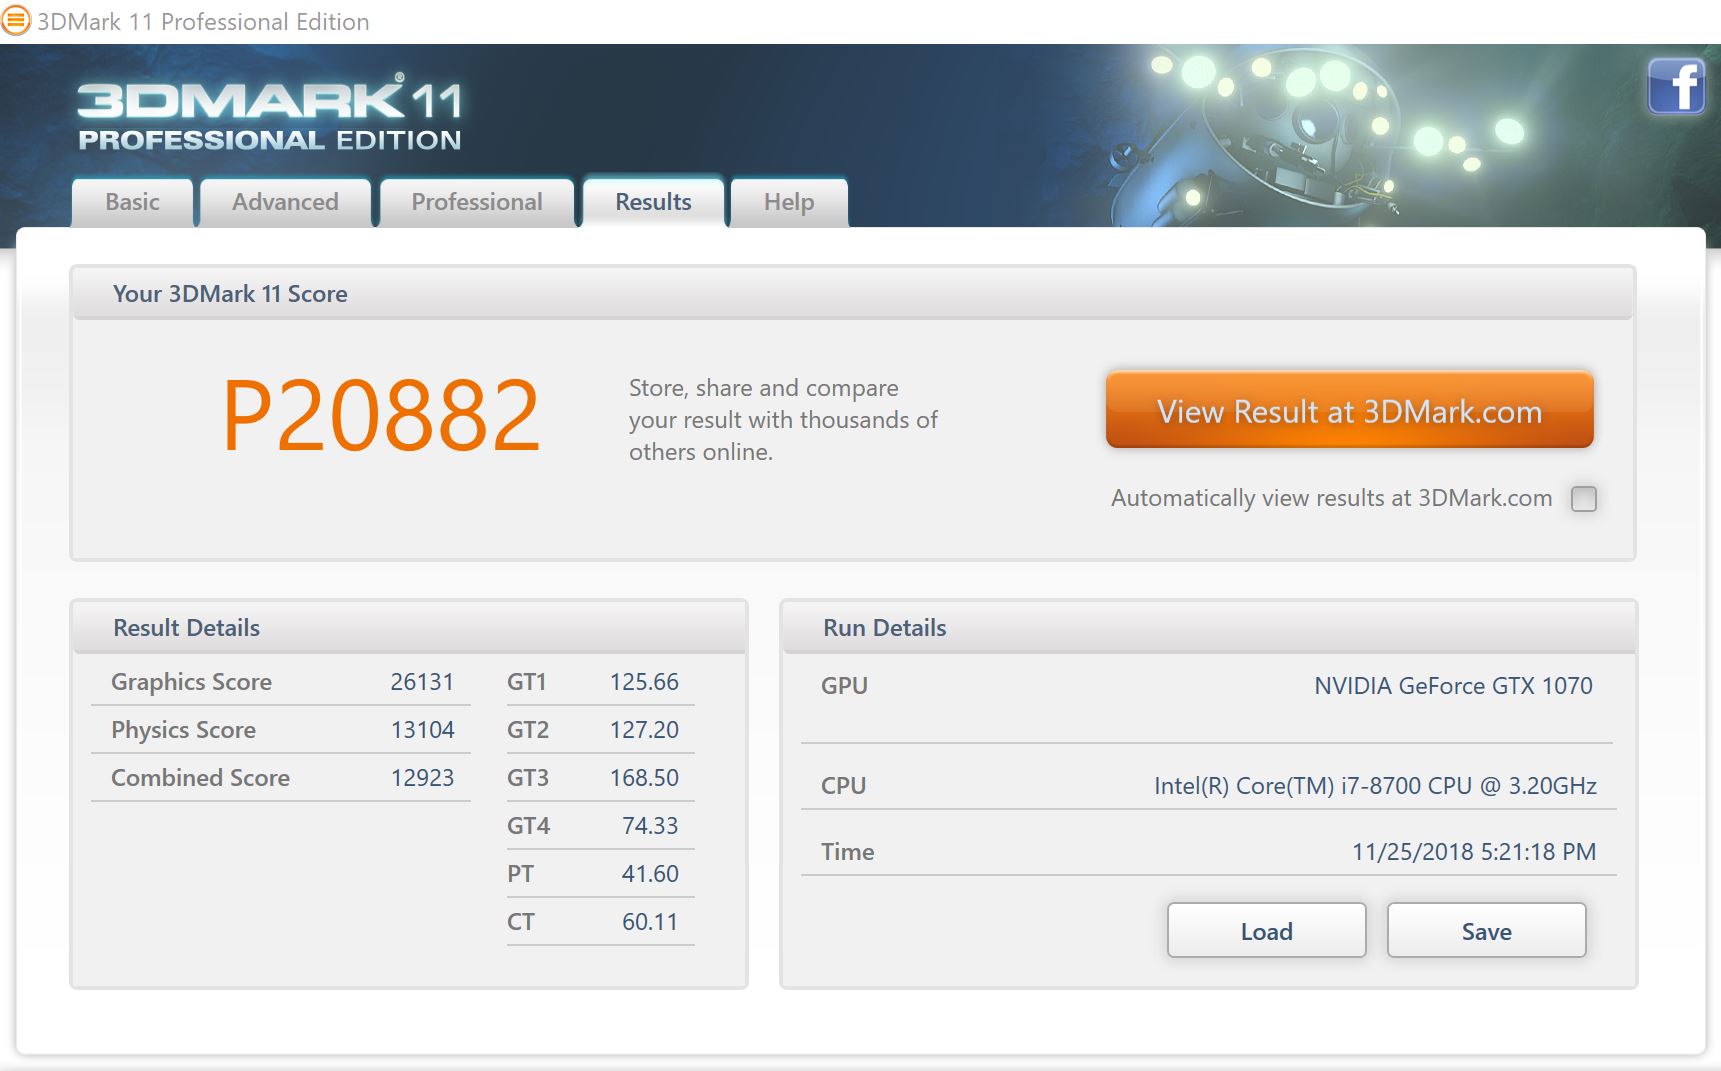
Overclocking the GPU is possible as we mentioned earlier, but we would recommend against doing so permanently. The GeForce GTX 1070 in our test handled a 100 MHz core clock increase and a 550 MHz VRAM boost stably. We also set the power limit to 108% as stated in the Graphics Card section. The changes resulted in a 700-point higher score in 3DMark 11, which represents around a minor 3% performance boost. So, while it is possible to overclock the GPU, the returns are insignificant and are offset by increased power consumption and potential system instability.
Emissions
Fan Noise

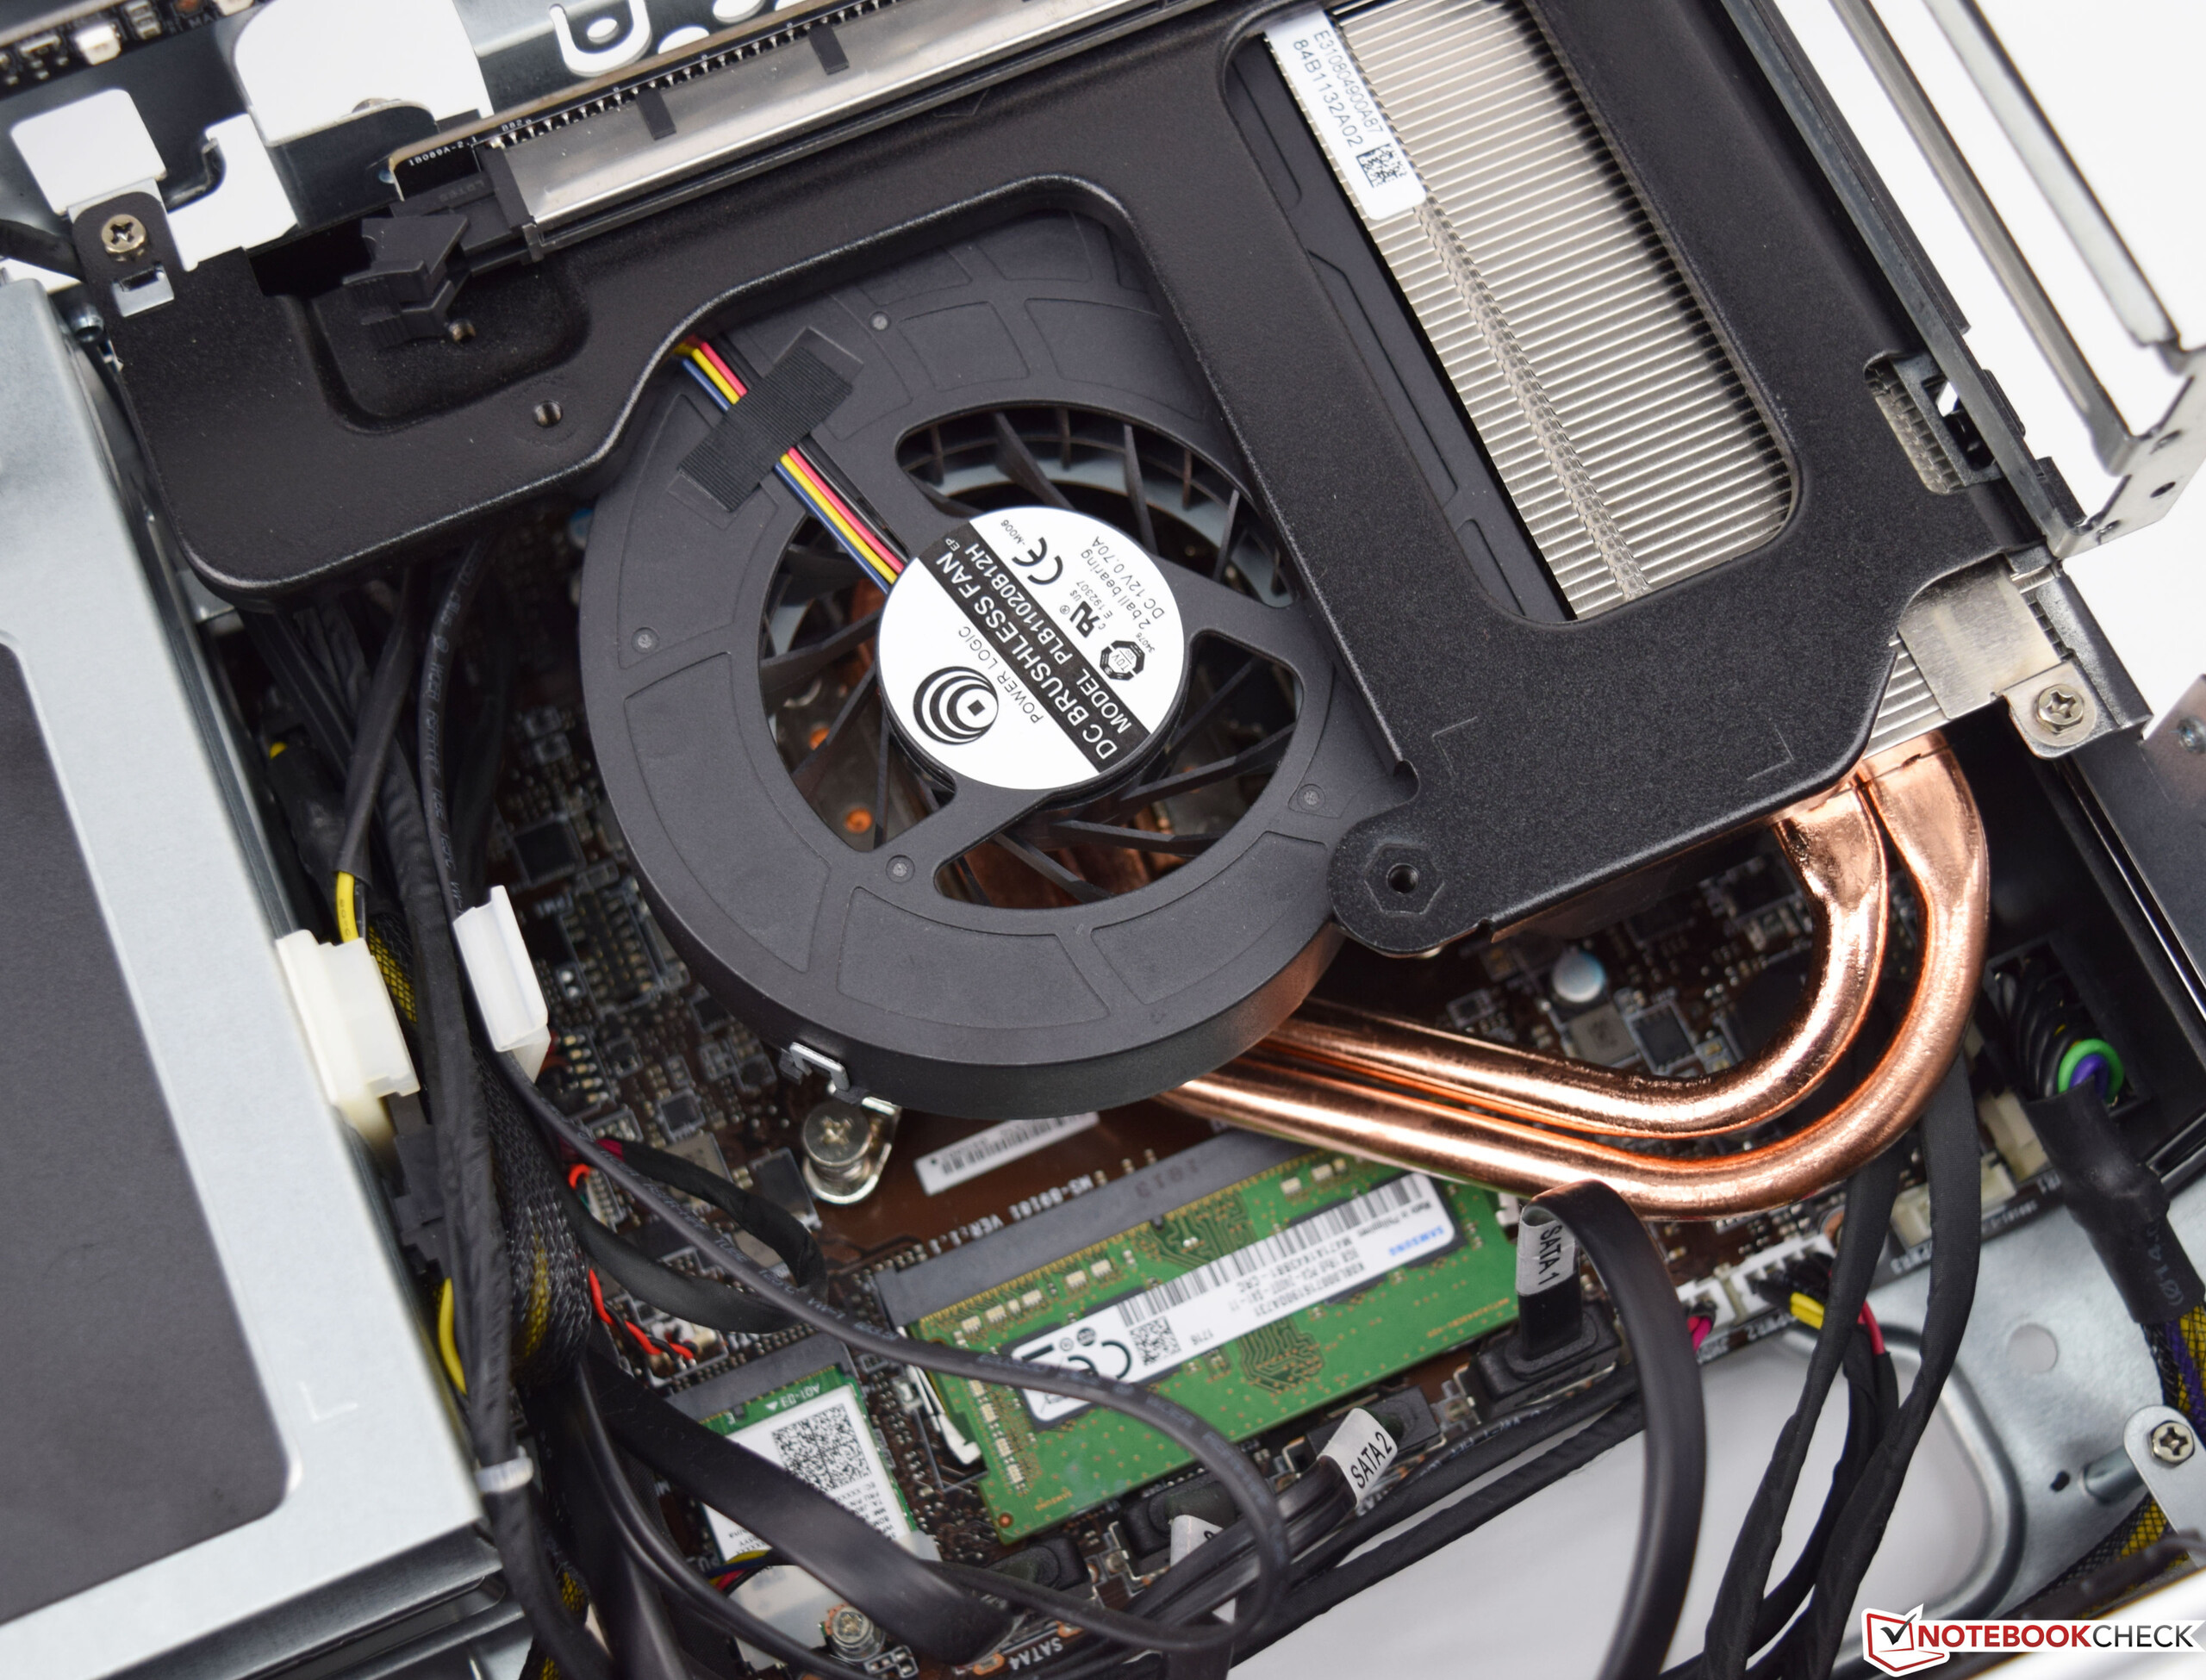
The Aegis 3 8RD is audible at idle mainly because of its 3.5-inch HDD that always whirrs away. The sound is not annoying, but it could be mitigated if you remove the HDD altogether. The CPU cooler has two heat pipes that are cooled by a radial fan. MSI markets its cooling system as Silent Storm Cooling 2 that the company describes as being an:
exclusive, silent and powerful cooling system that embraces several separated chambers for component cooling.
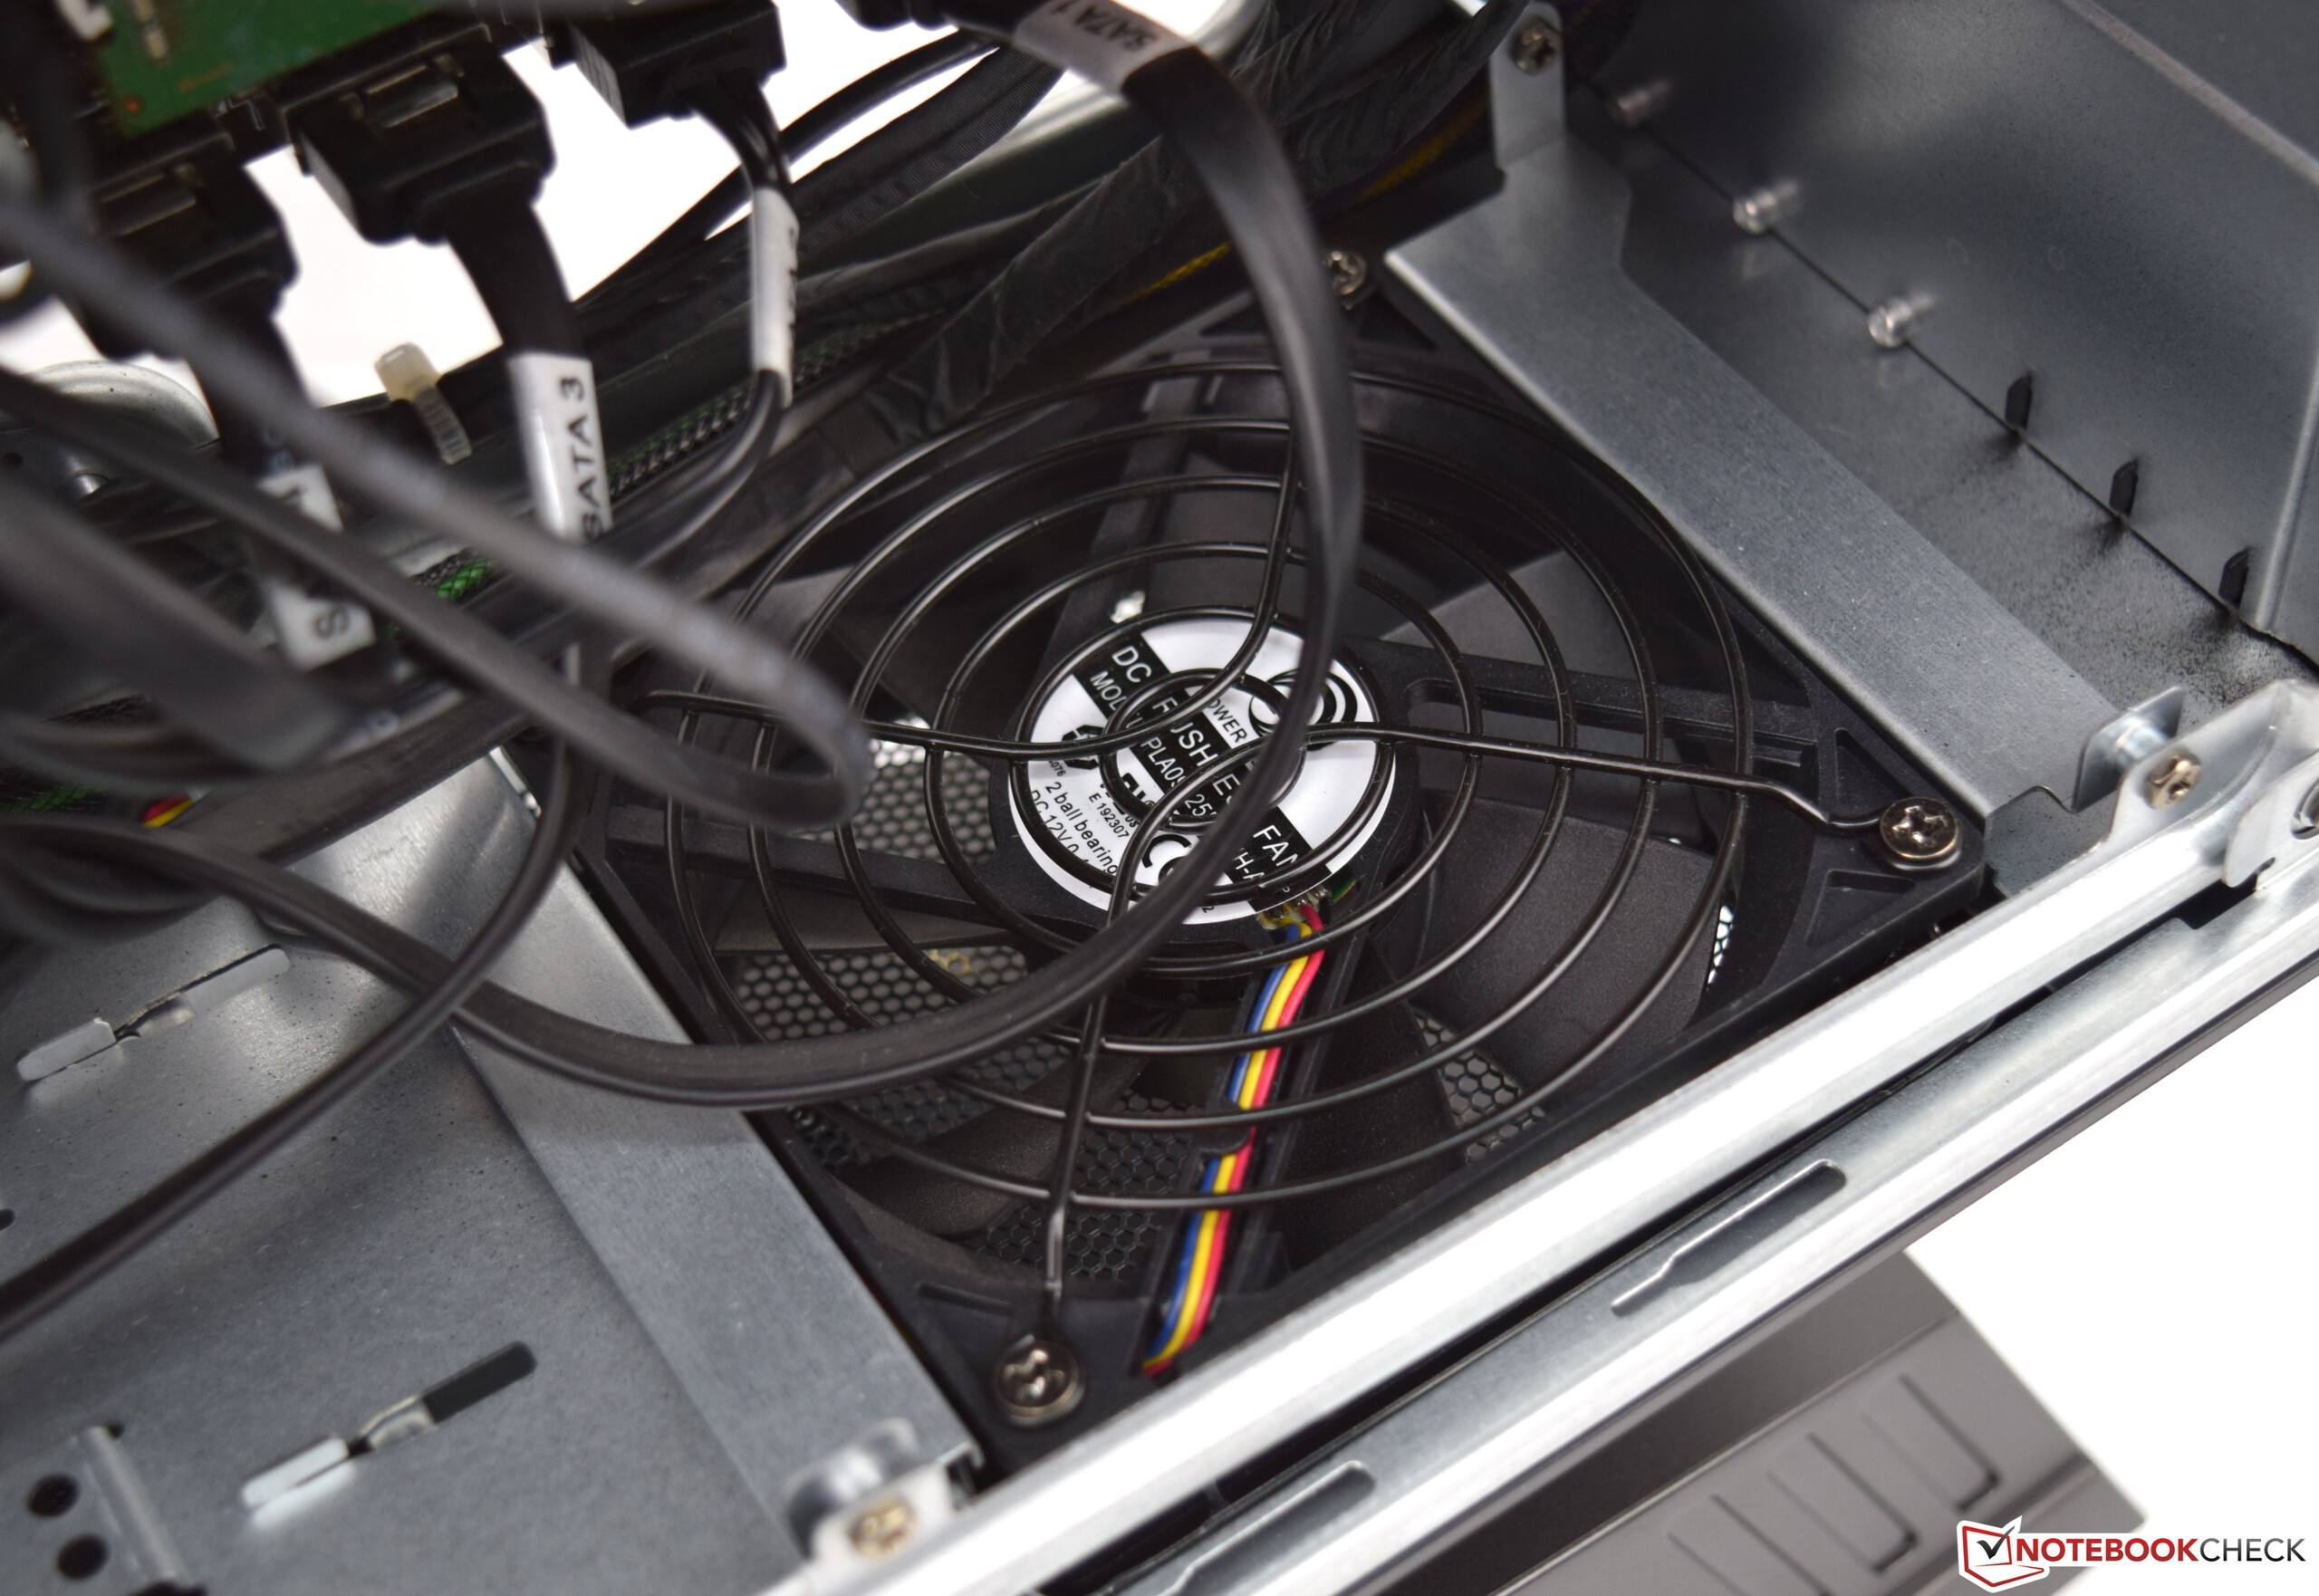
The cooling solution blows warm air out of the back of the case, which is effective but noisy under sustained load. MSI Gaming Center has a manual fan curve option should you wish to adjust the fan speed to your liking. The ‘Silent mode’ preset makes our test system quiet enough under load for our liking, but the system will run hotter. We could not find any performance difference between the different fan profiles though. Please keep in mind that we ran our benchmarks with the Aegis 3 8RD set to ‘Game Mode’. The GPU has two axial fans that work quietly even under prolonged load.
Temperature
The Aegis 3 8RD manages its temperatures well. We did not notice any thermal throttling regardless of how hard we pushed our test machine and no area of the machine got noticeably hot.
The Core i7-8700 reached a maximum of 85 °C during a one-hour stress test, with the GeForce GTX 1070 remaining slightly cooler at a maximum of 72 °C. In short, neither the CPU nor the GPU get worryingly warm and you should not experience any overheating when gaming.
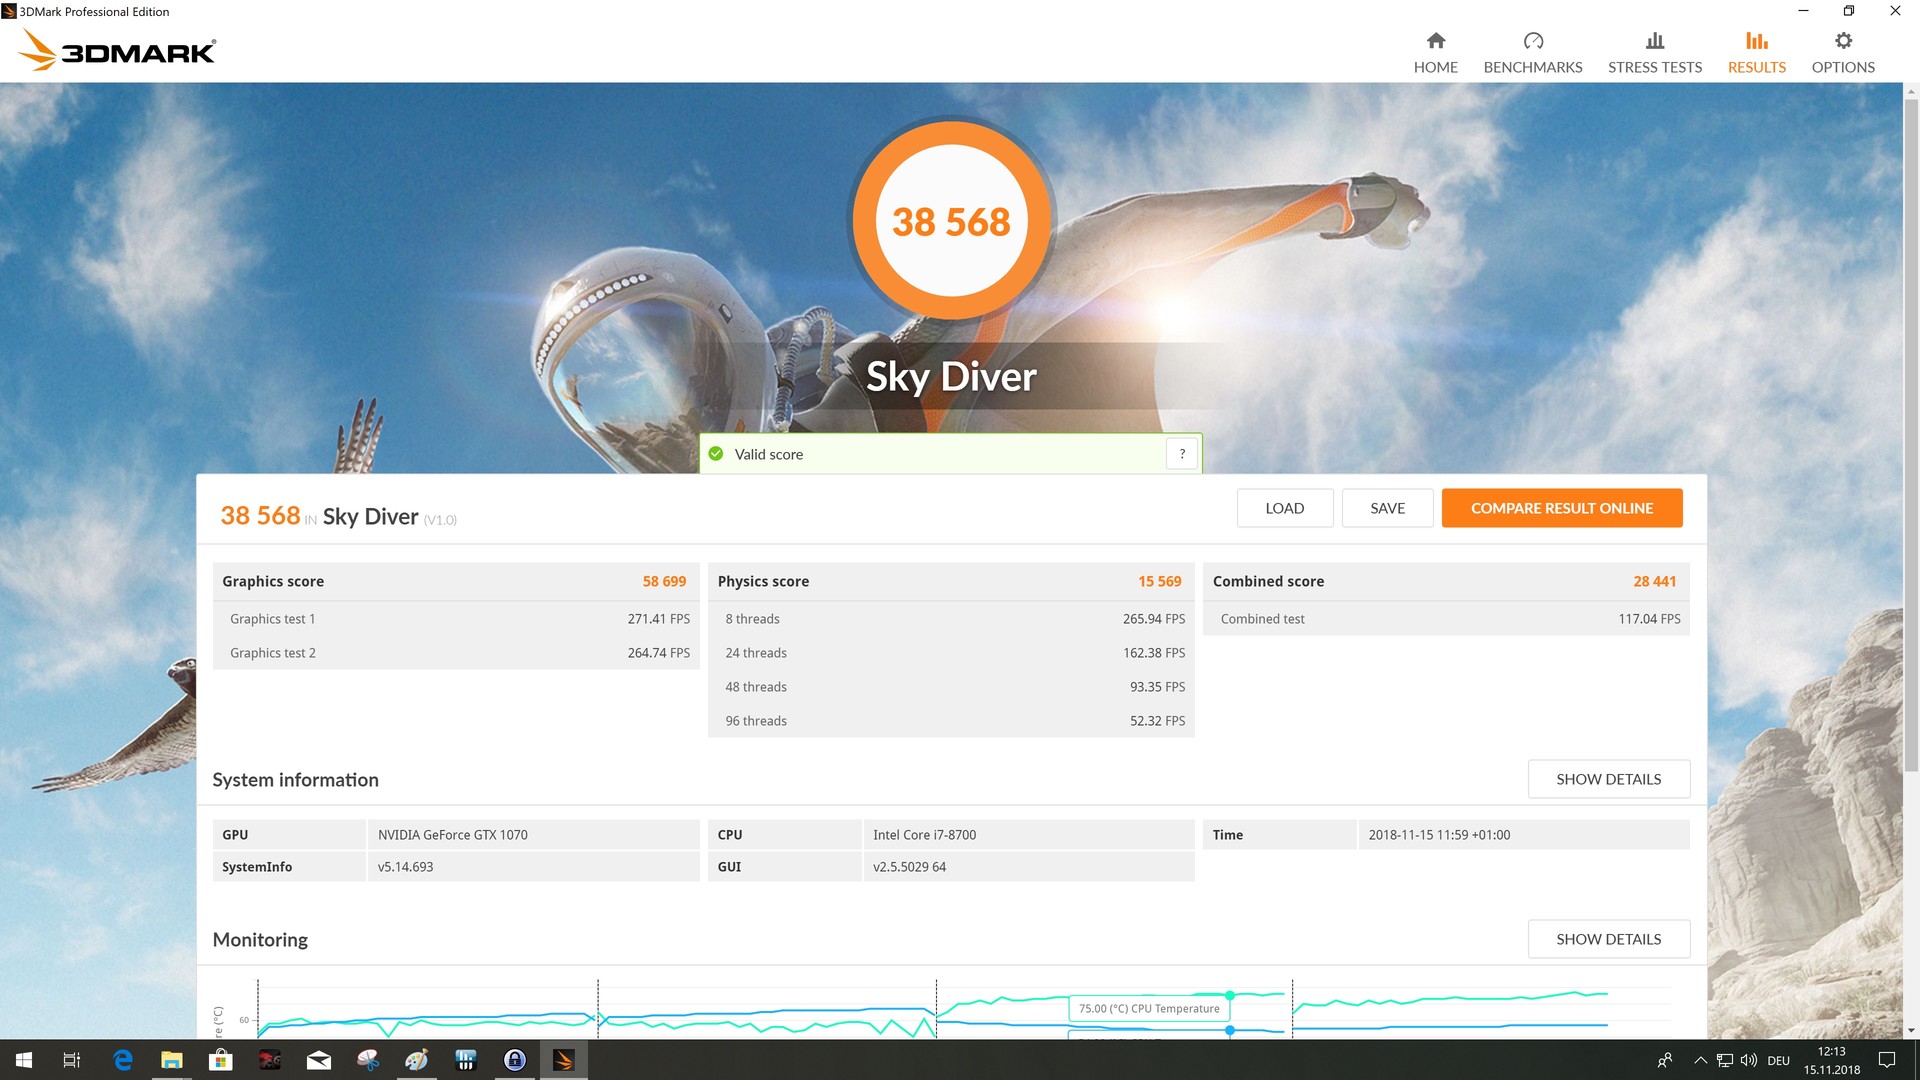
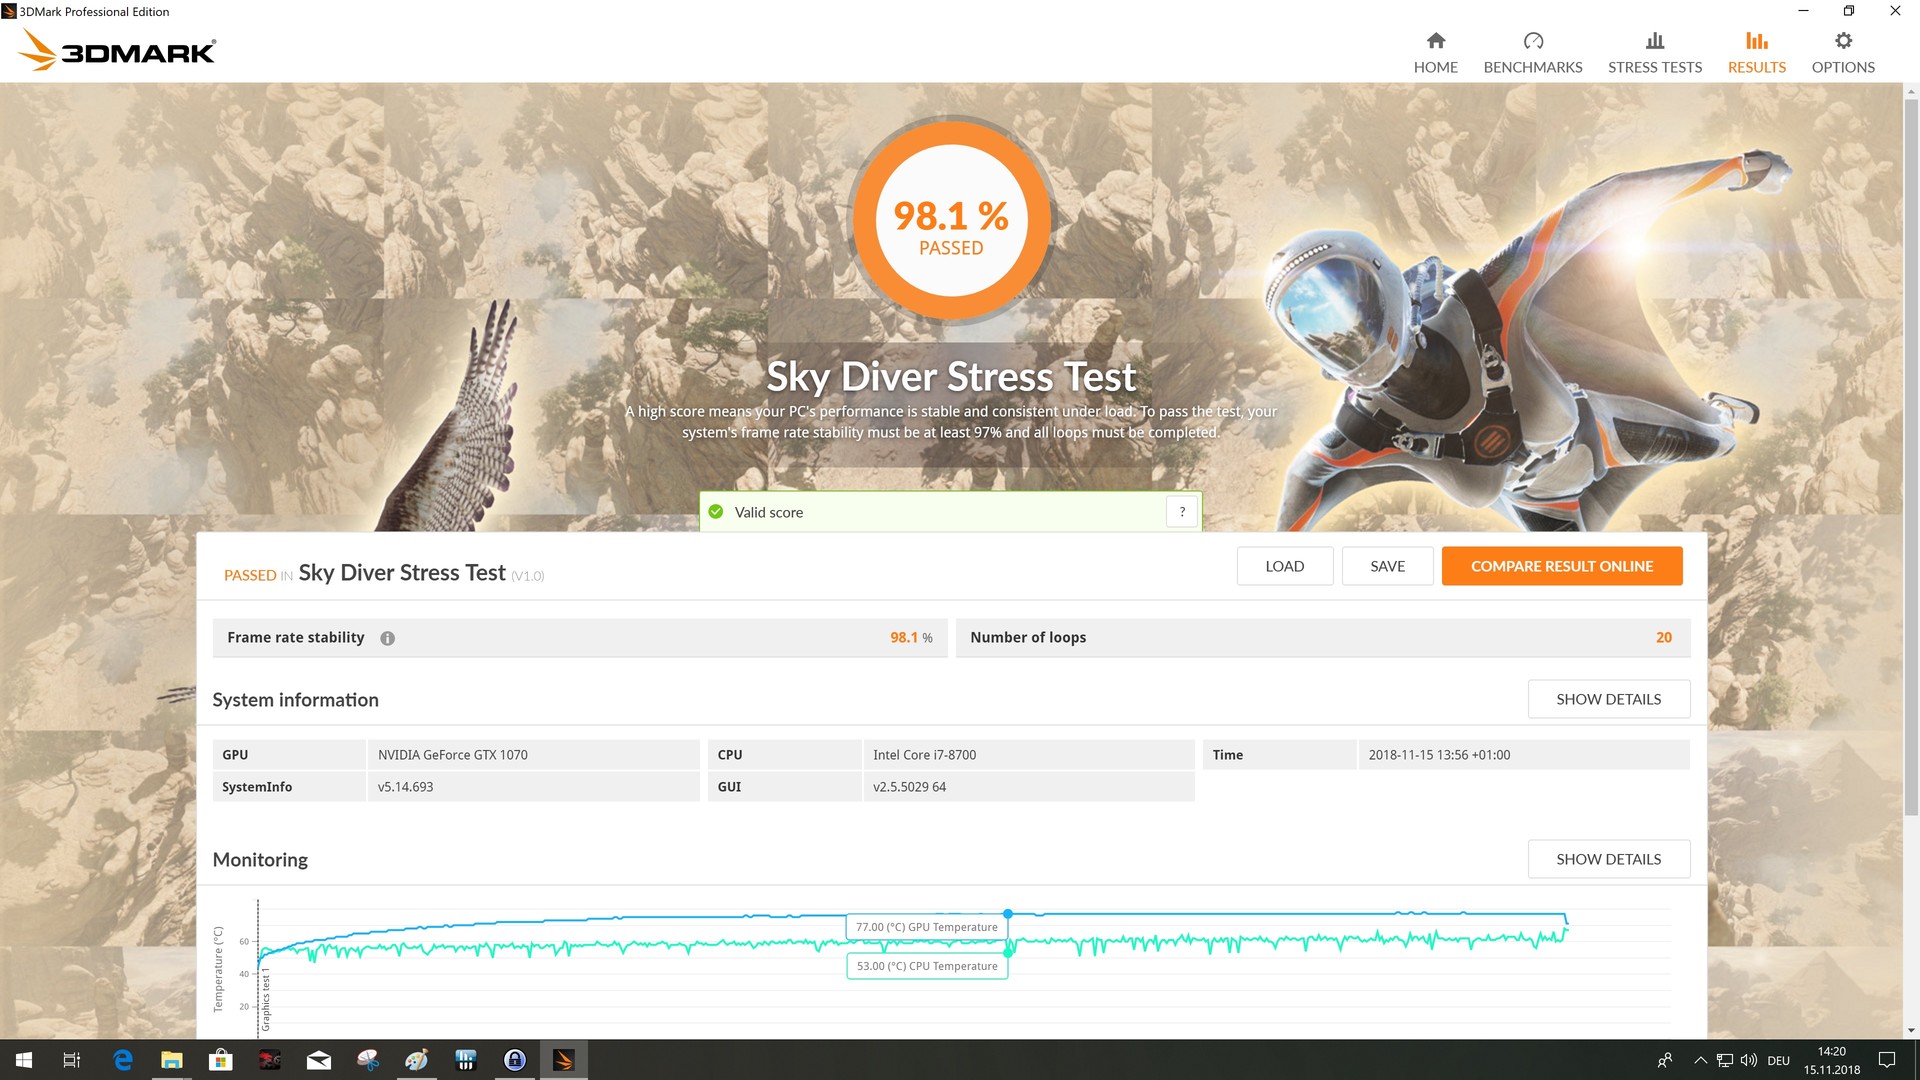
Our test machine also passed the 3DMark Sky Diver stress test with 98.1% peak performance. Moreover, 3DMark 11 demonstrated that the Aegis 3 8RD does not thermal throttle even if pushed to its limits.
Power Management
Power Consumption
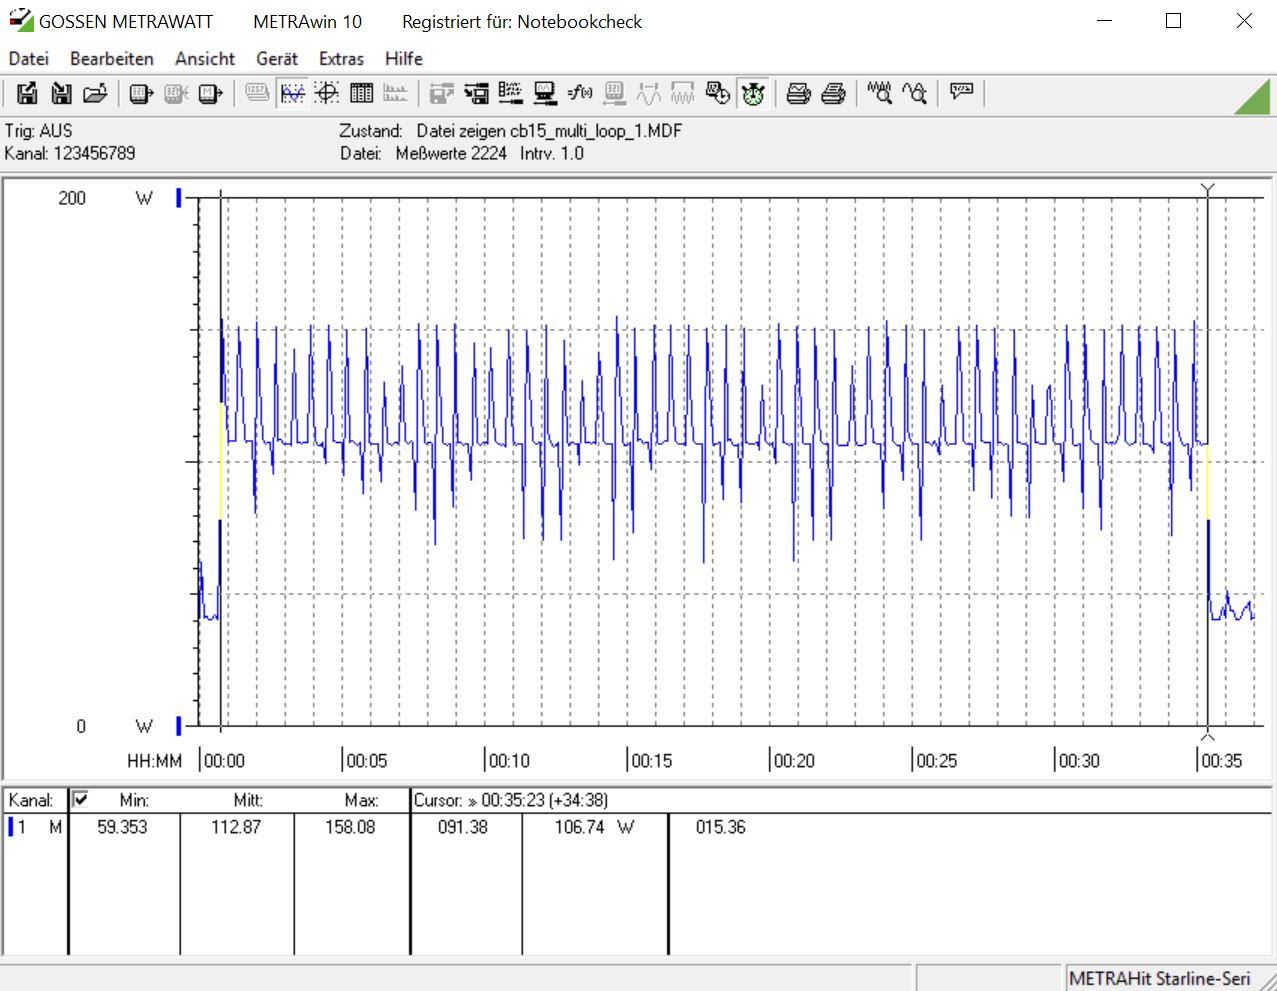
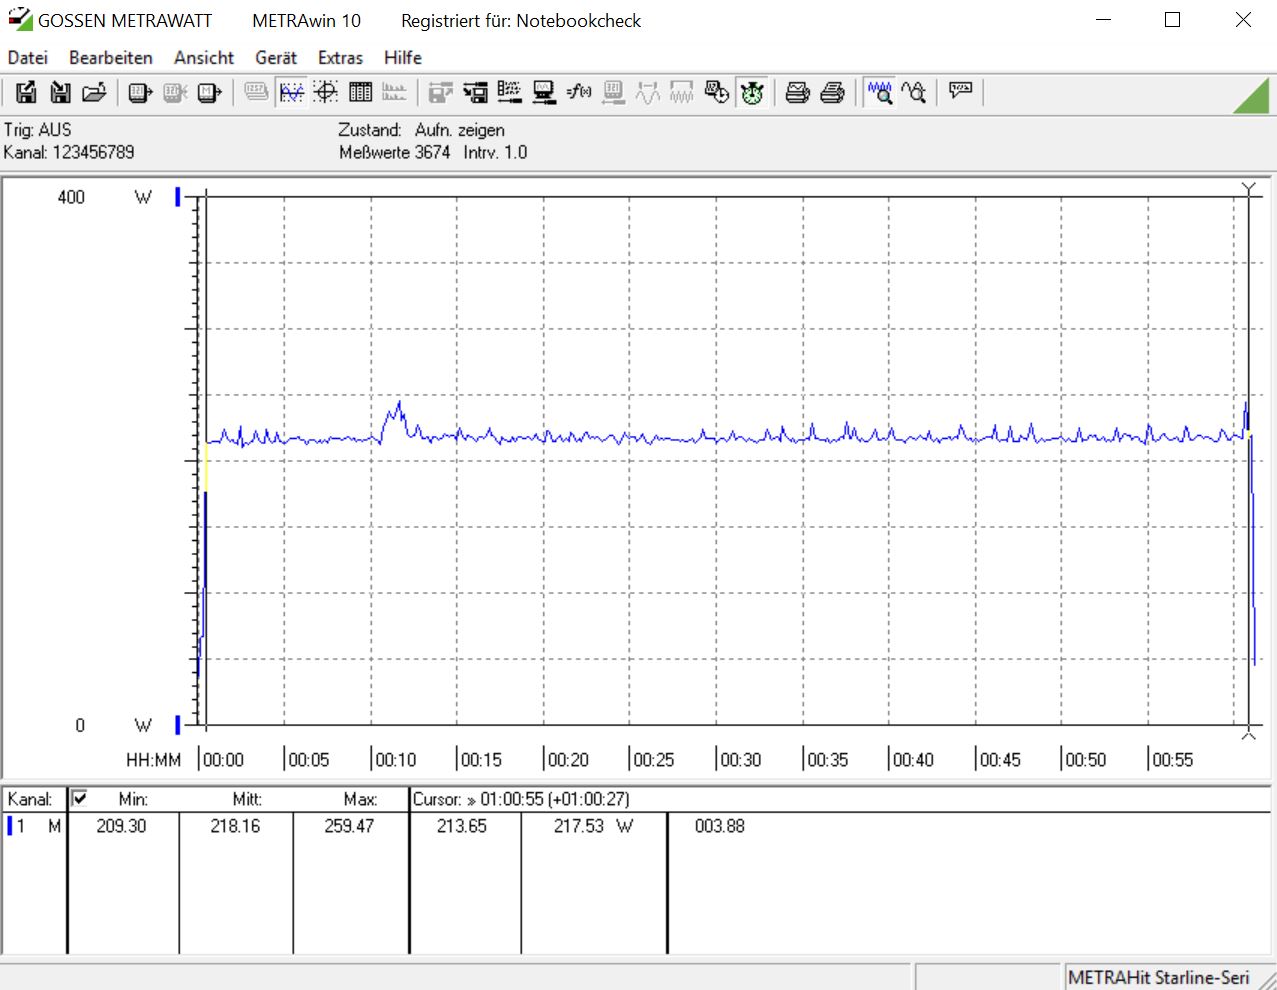
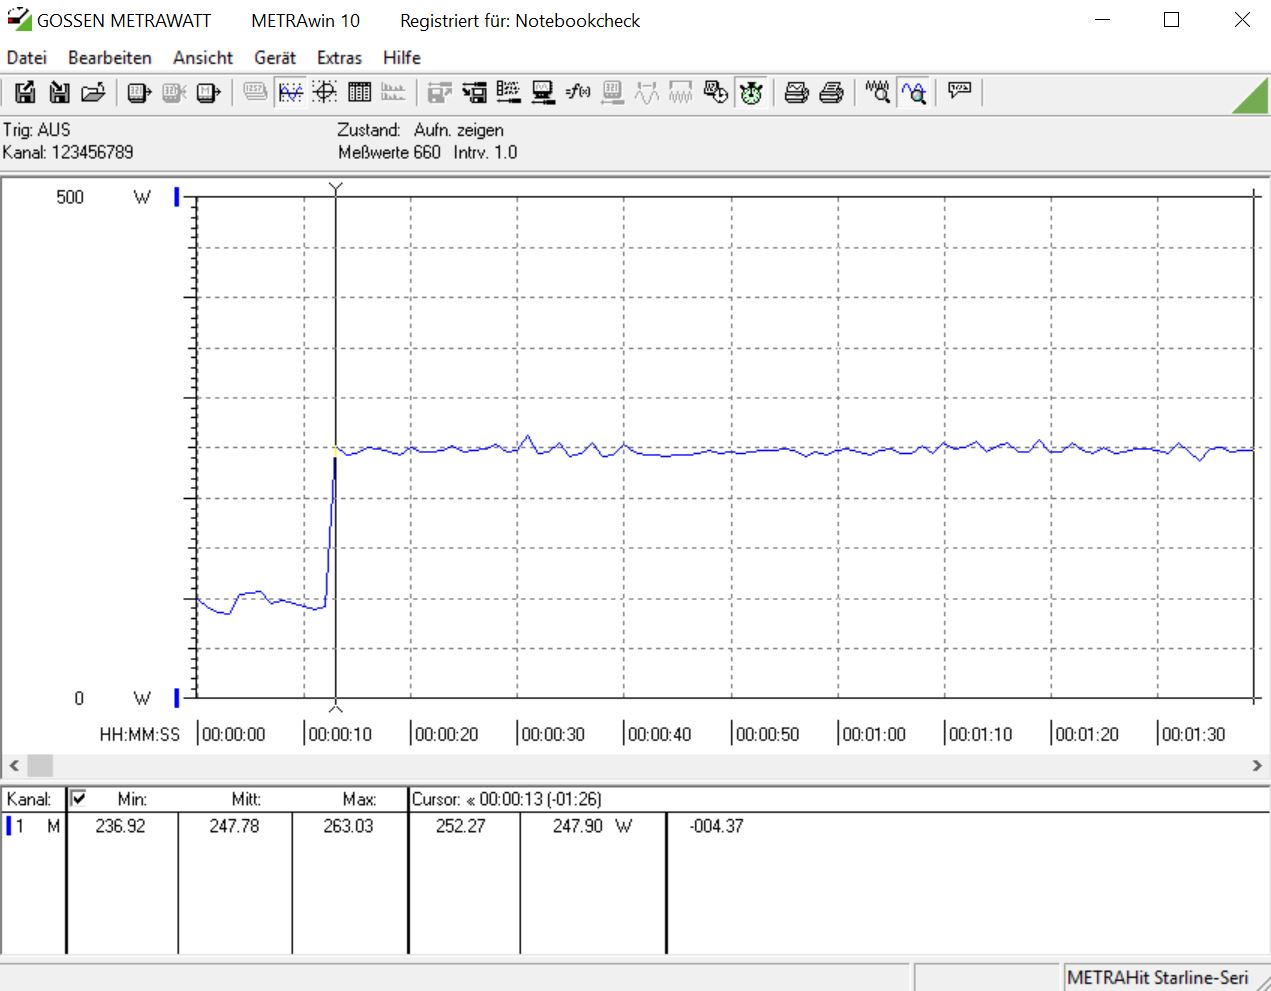
The Aegis 3 8RD has a 450 W power supply that can power the system comfortably even when it is pushed hard. Our test machine achieved a maximum power consumption of 247.8 W when gaming, which is respectable and gives the power supply room to breathe. Please keep in mind that these measurements do not include how much power an external monitor uses.
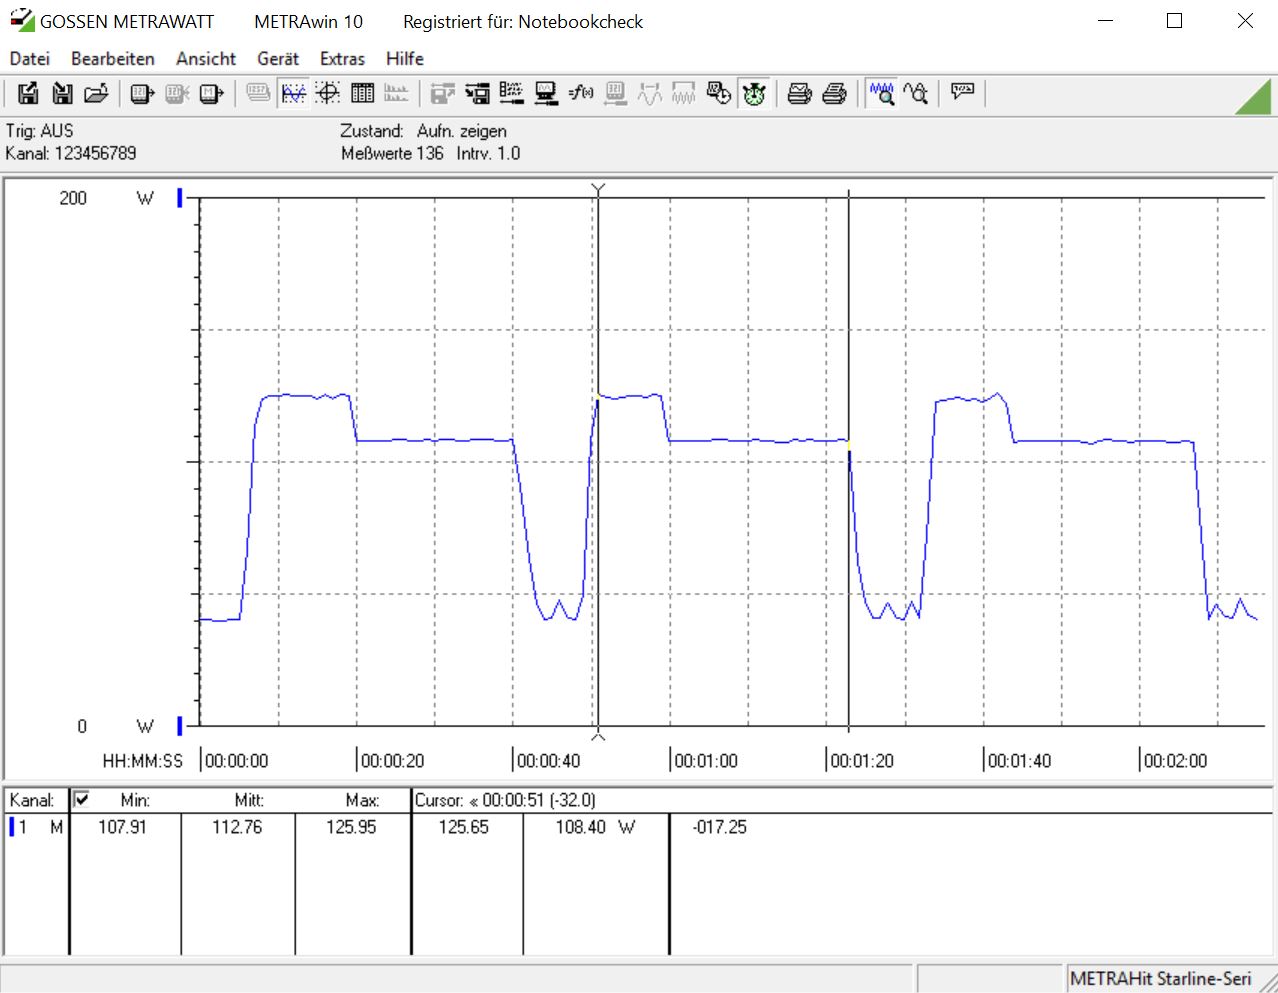
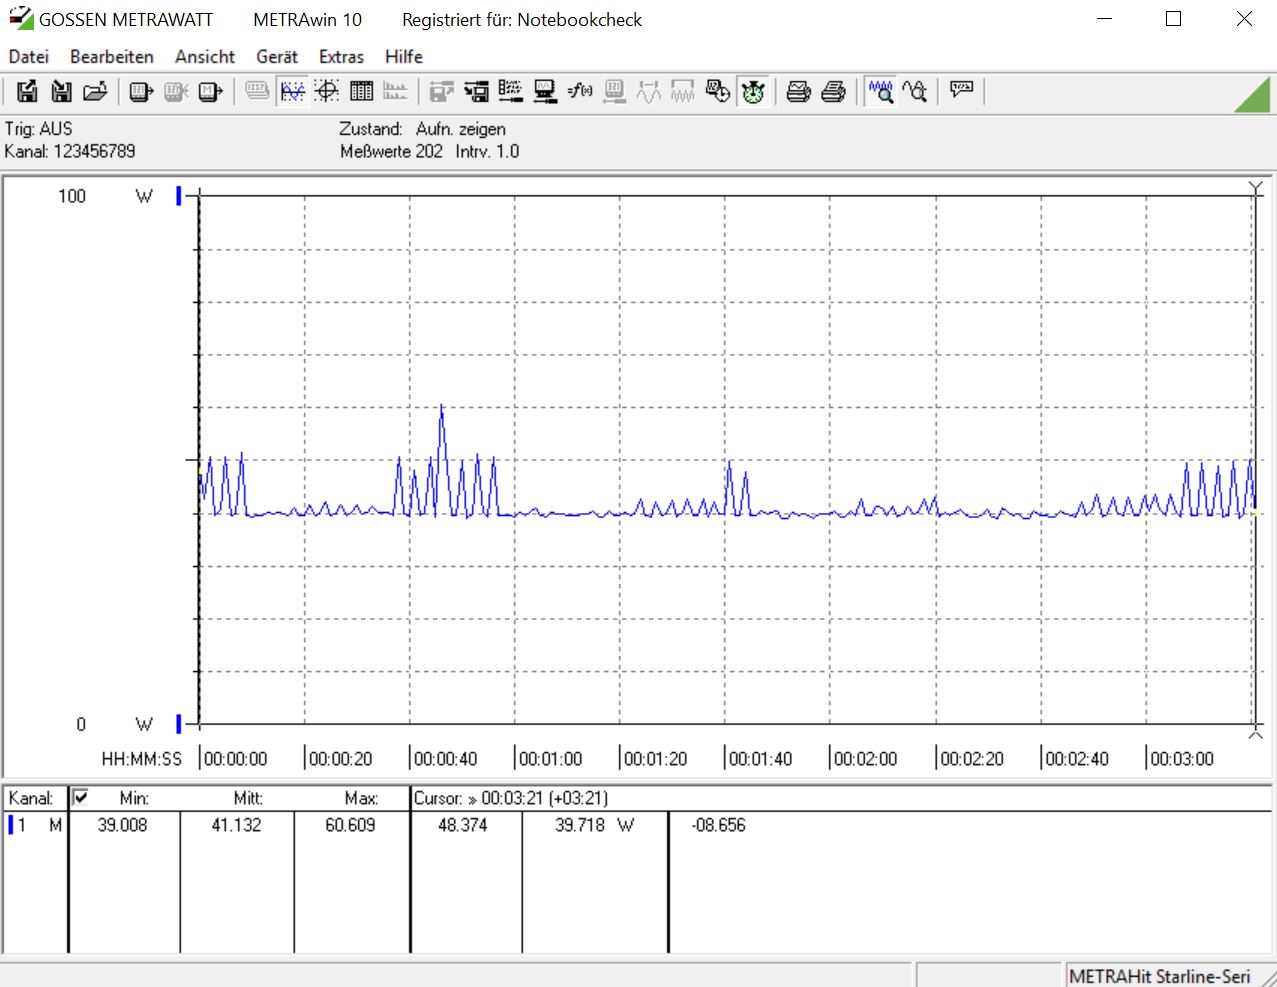
Our test machine consumes an average of 41 W at idle. The limited Turbo Boost time keeps power consumption down too. The Aegis 3 8RD averaged 126 W during the eight-second Turbo Boost window at the start of the Cinebench R15 multi-core looped benchmark. This then drops to an average of 112 W after the Turbo Boost switches off.
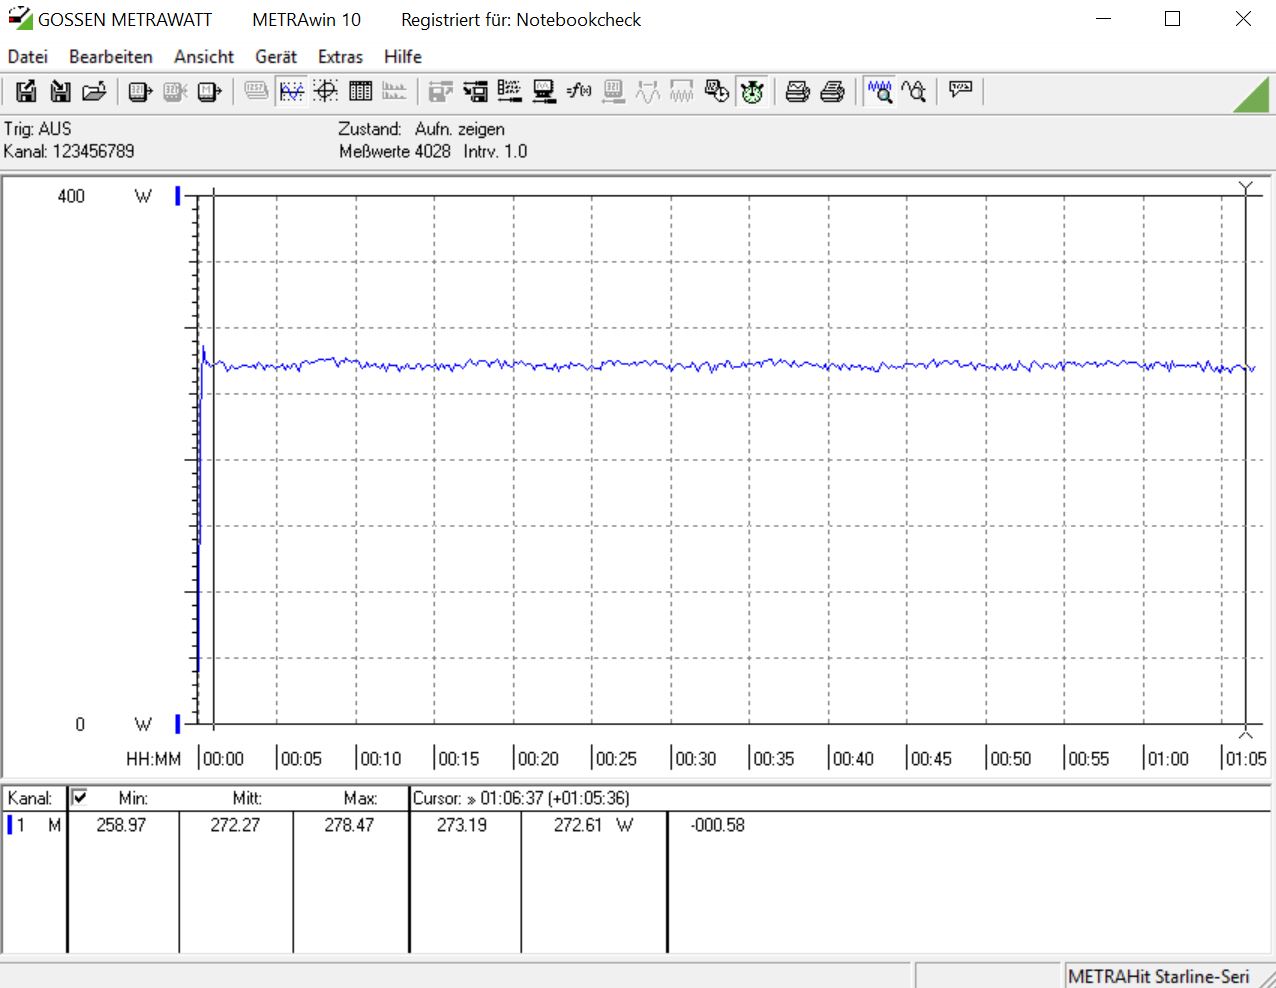
Neither the CPU nor GPU are under 100% load when gaming, so it is worth keeping in mind that the Aegis 3 8RD can consume more than 247.8 W. We established the machine’s maximum power consumption by running a combined FurMark and Prime95 stress test, which returned a maximum power consumption of 278 W.
The GeForce GTX 1070 has a 150 W TDP, which should act as a guide for those who plan on upgrading to a more-powerful GPU. In short, the Aegis 3 8RD has plenty of wattage in reserve for more-powerful components or additional drives, but we would recommend against upgrading the system so that it consumes above 400 W, as this could cause power supply problems.
The power consumption of our test system
| Power Consumption | |
| Prime95 V2810 Stress (external Monitor) | |
| AMD Ryzen Threadripper 2950X | |
| AMD Ryzen 7 2700X (Idle: 74.3 W) | |
| AMD Ryzen 5 2600X (Idle: 71.3 W) | |
| AMD Ryzen 5 2600 | |
| AMD Ryzen 7 2700 | |
| Intel Core i5-8500T | |
| Intel Core i7-8700 | |
| 1920x1080 The Witcher 3 ultra (external Monitor) | |
| AMD Ryzen 5 2600X | |
| AMD Ryzen Threadripper 2950X | |
| AMD Ryzen 7 2700X (Idle: 74.3 W) | |
| AMD Ryzen 5 2600 | |
| AMD Ryzen 7 2700 | |
| Intel Core i5-8500T | |
| Intel Core i7-8700 | |
| 1280x720 FurMark 1.19 GPU Stress Test (external Monitor) | |
| Intel Core i7-8700 | |
| Cinebench R15 Multi (external Monitor) | |
| AMD Ryzen Threadripper 2950X | |
| AMD Ryzen 7 2700X (Idle: 74.3 W) | |
| AMD Ryzen 5 2600X | |
| AMD Ryzen 5 2600 | |
| AMD Ryzen 7 2700 | |
| Intel Core i7-8700 | |
| Intel Core i5-8500T | |
* ... smaller is better
Verdict
Pros
Cons
The MSI Aegis 3 8RD is a compact gaming PC that costs between US$1,500 and US$1,600 at the time of writing. The PC is powered by a fast hexa-core CPU and a decent graphics card. In short, the Aegis 3 8RD can display modern triple-A games smoothly at maximum details.
The Core i7-8700 is not Intel’s latest CPU, which the company launched late last year. However, it is efficient and is great value for money. The same applies to the Nvidia GeForce GTX 1070 GPU but equipping the machine with an AMD Radeon RX Vega 56 would further reduce power consumption when gaming.
The MSI Aegis 3 8RD is a compact gaming desktop PC that can handle modern triple-A games with ease. The machine has great cooling too, which ensures that the system will not thermal throttle even if pushed to its limits. Buyers will not go wrong if they pick up the Aegis 3 8RD instead of creating a system themselves. In short, the MSI Aegis 3 8RD is ideal as a second PC for LAN parties or as a living room gaming PC.
The Aegis 3 8RD has a relatively compact 19.6-litre case, which has been adorned with RGB lighting. People can disable the lighting if they find it distracting or gimmicky though. We would have preferred a more premium looking exterior case though as the plastic panelling looks and feels cheap for a US$1,500/US$1,600 machine.
The case is not all bad though. The carrying and headset handles are useful, while the plastic used keeps the total system weight below 10 kg, which makes the Aegis 3 8RD relatively easy to carry between LAN parties.
The machine has five drive bays and 1.2 TB of storage, which should be enough for most people. There are pre-wired spare 2.5-inch and 3.5-inch drive bays though, so you could simply drop in additional drives without having to reformat your system.


Pricecompare

