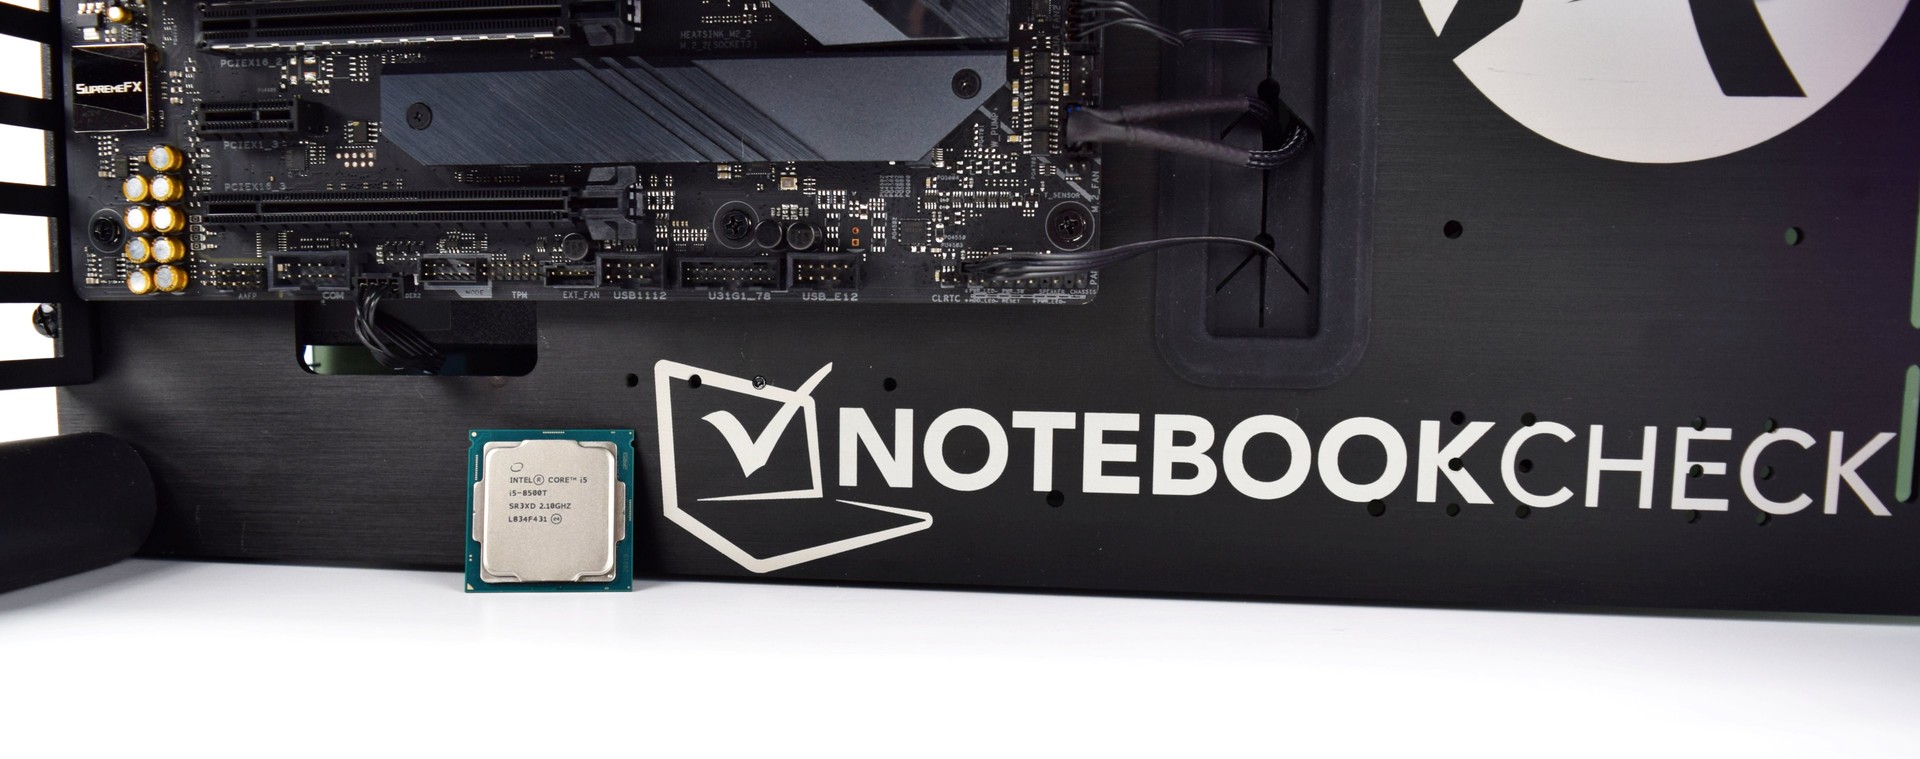
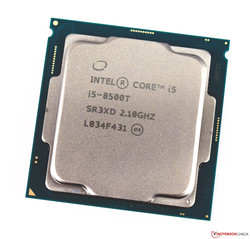
Intel Core i5-8500T (6 cores, 6 Threads, 2.1 GHz, 35 W) Desktop CPU Review
The Intel Coffee Lake T series
The Intel Coffee Lake T series chips have set new standards for energy efficiency with the top model, the Core i7-8700T, being a hexa-core processor that supports twelve simultaneous threads thanks to Intel Hyper-Threading. The CPU manages this with only a 35-W TDP, which is considerably more efficient than the 95-W Core i7-8700K.
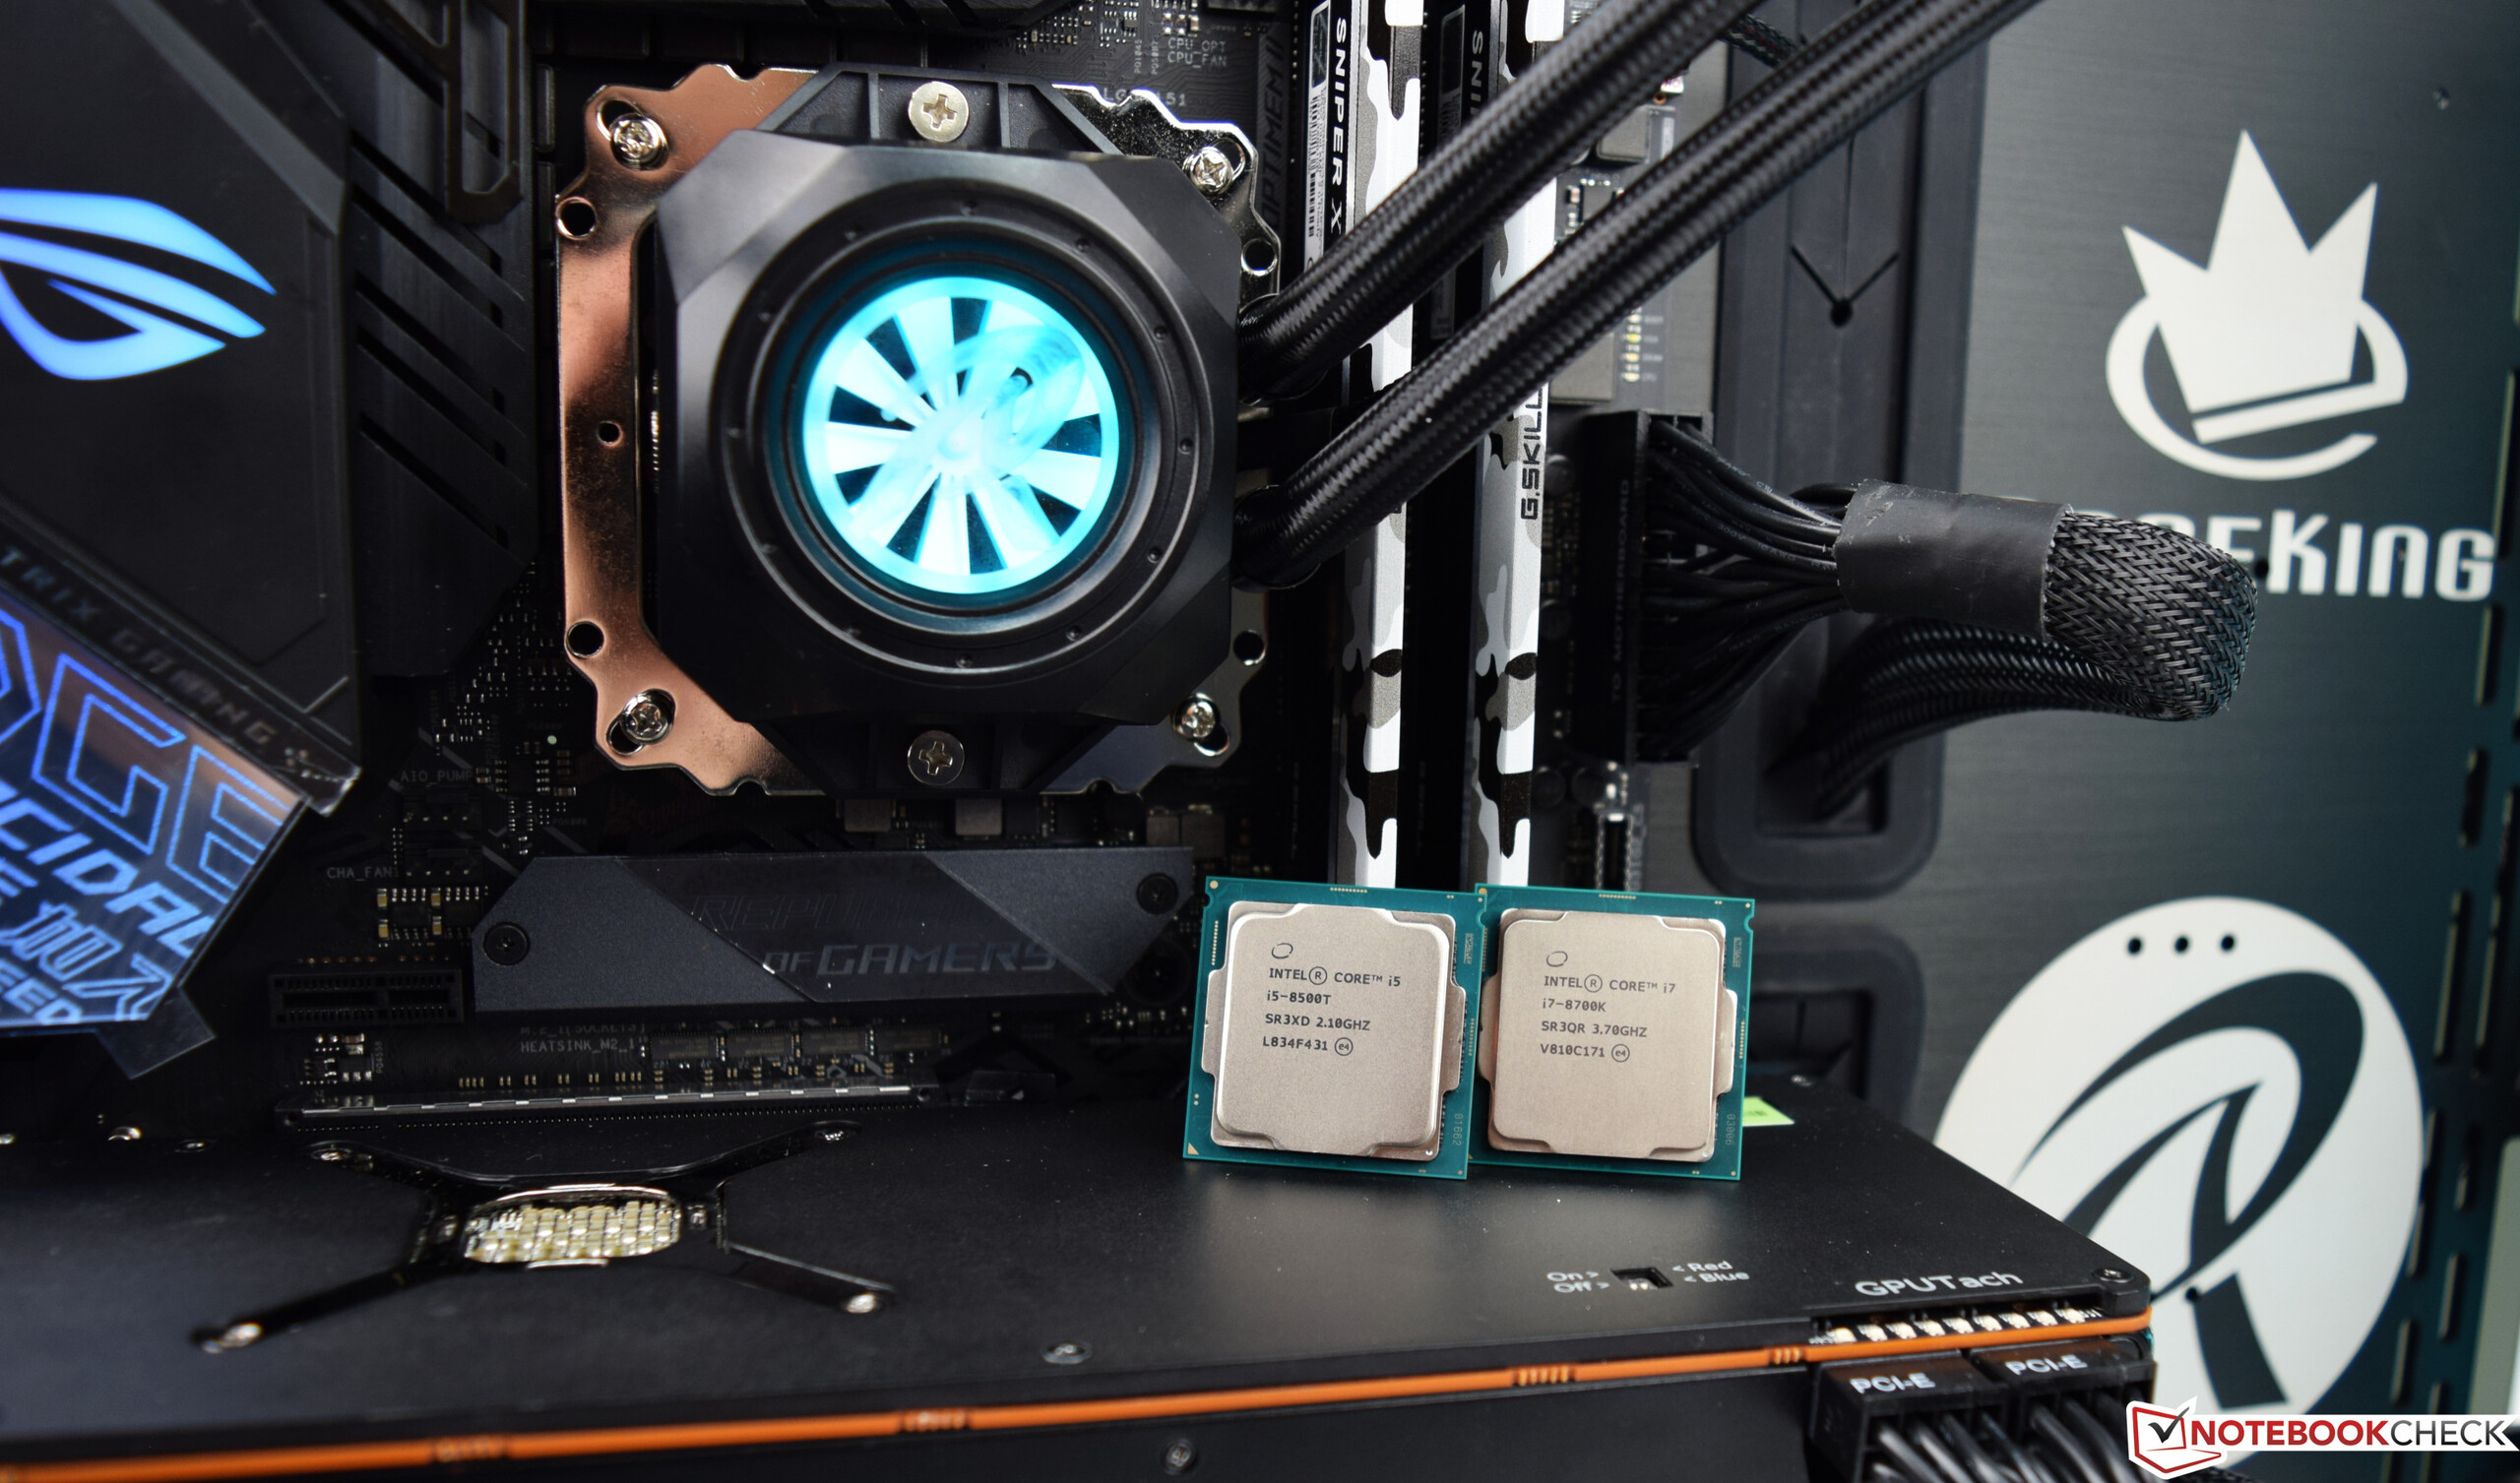
Caseking has kindly supplied us with an Intel Core i5-8500T and a Core i7-8700K for our tests.
An overview of the Coffee Lake T and K processors
| Model | Cores/Threads | Base Clock | Turbo 1/2/4/6 Cores | L3 Cache | Integrated Graphics | TDP |
|---|---|---|---|---|---|---|
| Intel Core i7-8700T | 6-12 | 2.4 GHz | 4.0/3.9/3.9/3.8 GHz | 12 MB | UHD 630 | 35 W |
| Intel Core i5-8600T | 6-6 | 2.3 GHz | 3.7/3.6/3.6/3.5 GHz | 9 MB | UHD 630 | 35 W |
| Intel Core i5-8500T | 6-6 | 2.1 GHz | 3.5/3.4/3.3/3.2 GHz | 9 MB | UHD 630 | 35 W |
| Intel Core i5-8400T | 6-6 | 1.7 GHz | 3.3/3.2/3.1/3.0 GHz | 9 MB | UHD 630 | 35 W |
| Intel Core i3-8300T | 4-4 | 3.2 GHz | - | 8 MB | UHD 630 | 35 W |
| Intel Core i3-8100T | 4-4 | 3.1 GHz | - | 8 MB | UHD 630 | 35 W |
| Intel Core i7-8700K | 6-12 | 3.7 GHz | 4.7/4.6/4.4/4.3 GHz | 12 MB | UHD 630 | 95 W |
| Intel Core i5-8600K | 6-6 | 3.6 GHz | 4.3/4.2/4.2/4.1 GHz | 9 MB | UHD 630 | 95 W |
| Intel Core i5-8500 | 6-6 | 3.0 GHz | 4.1/4.0/4.0/3.9 GHz | 9 MB | UHD 630 | 65 W |
The Intel Core i5-8500T in detail
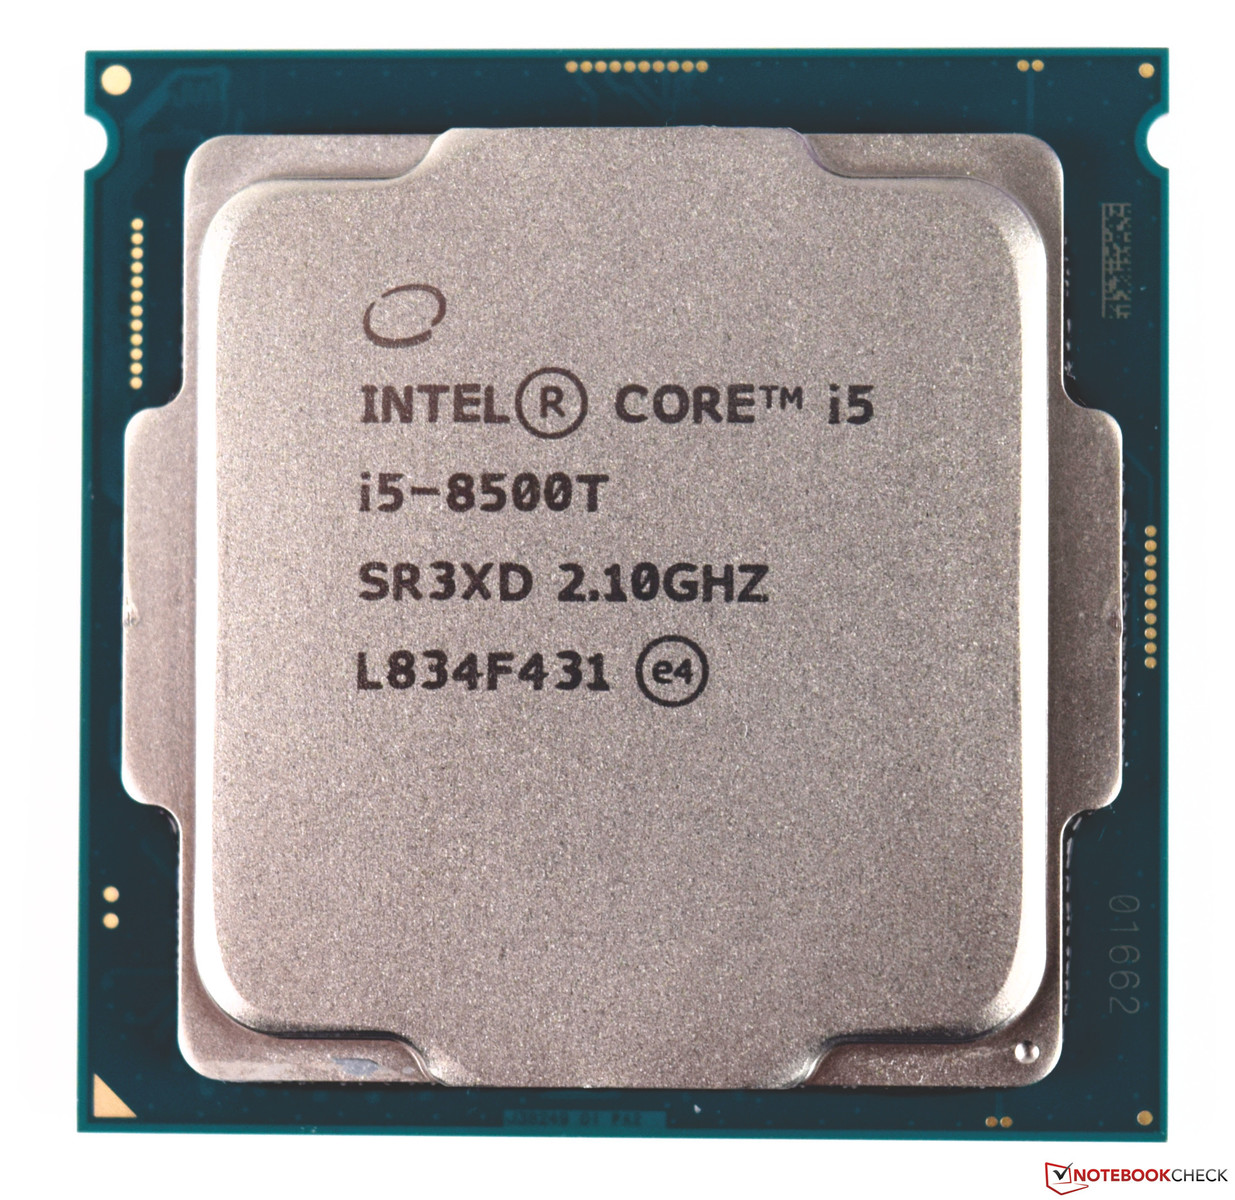
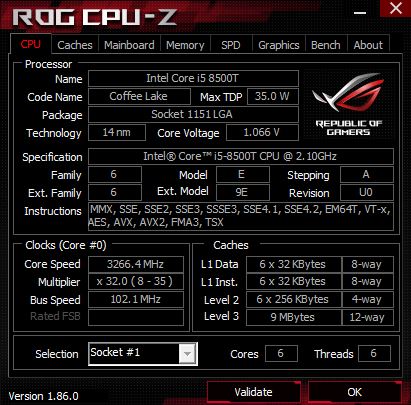
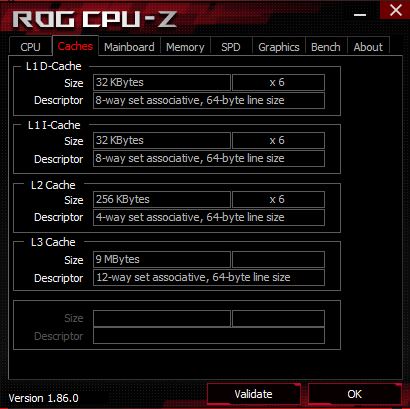
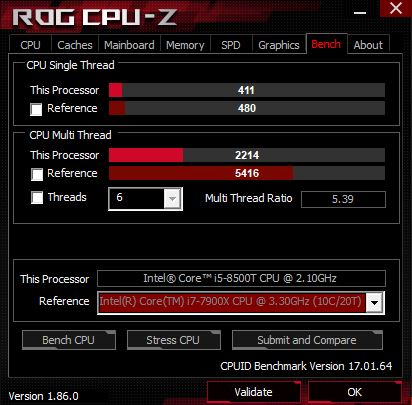
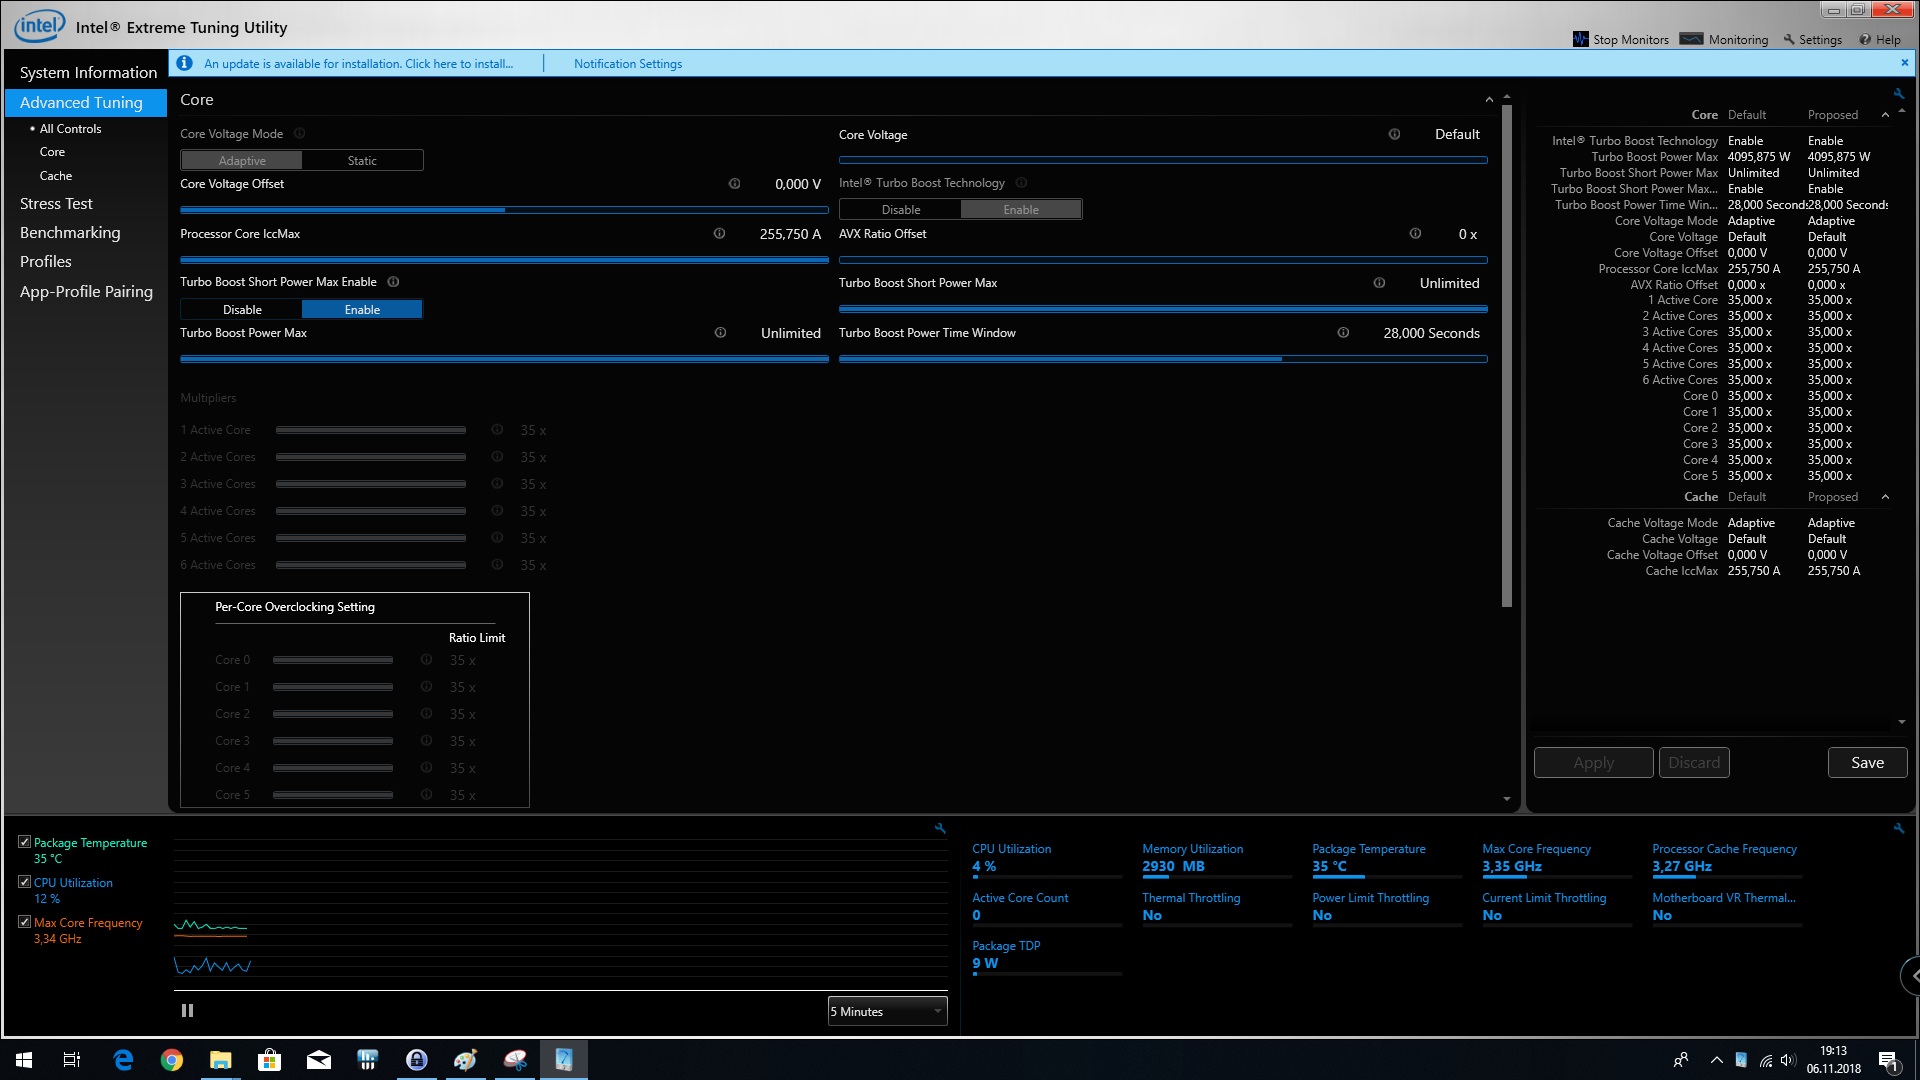
The Intel Core i5-8500T is the fastest Coffee Lake T series Core i5 processor that Intel currently sells. The Core i5-8500T is a hexa-core processor that supports up to six simultaneous threads; it does not support Intel Hyper-Threading. The processor has a 2.1 GHz base clock speed by default, but this could be restricted by the BIOS in some pre-built systems. The Core i5-8500T can also function at a 25-W TDP, but this drops the base clock speed to 1.6 GHz. More information about the Core i5-8500T can be found on the Intel product page. We left all power options on “Auto” in the BIOS for our tests.
The processor can clock up to 3.2 GHz across all cores and 3.5 GHz on a single core thanks to Intel Turbo Boost 2.0 support. By contrast, the Core i5-8500 has a higher maximum clock speed because of its 65-W TDP. Intel does not sell an Intel Core i5-8500K, with its equivalent overclockable CPUs being the Core i5-8600K or the brand-new Core i5-9600K.
The Test System

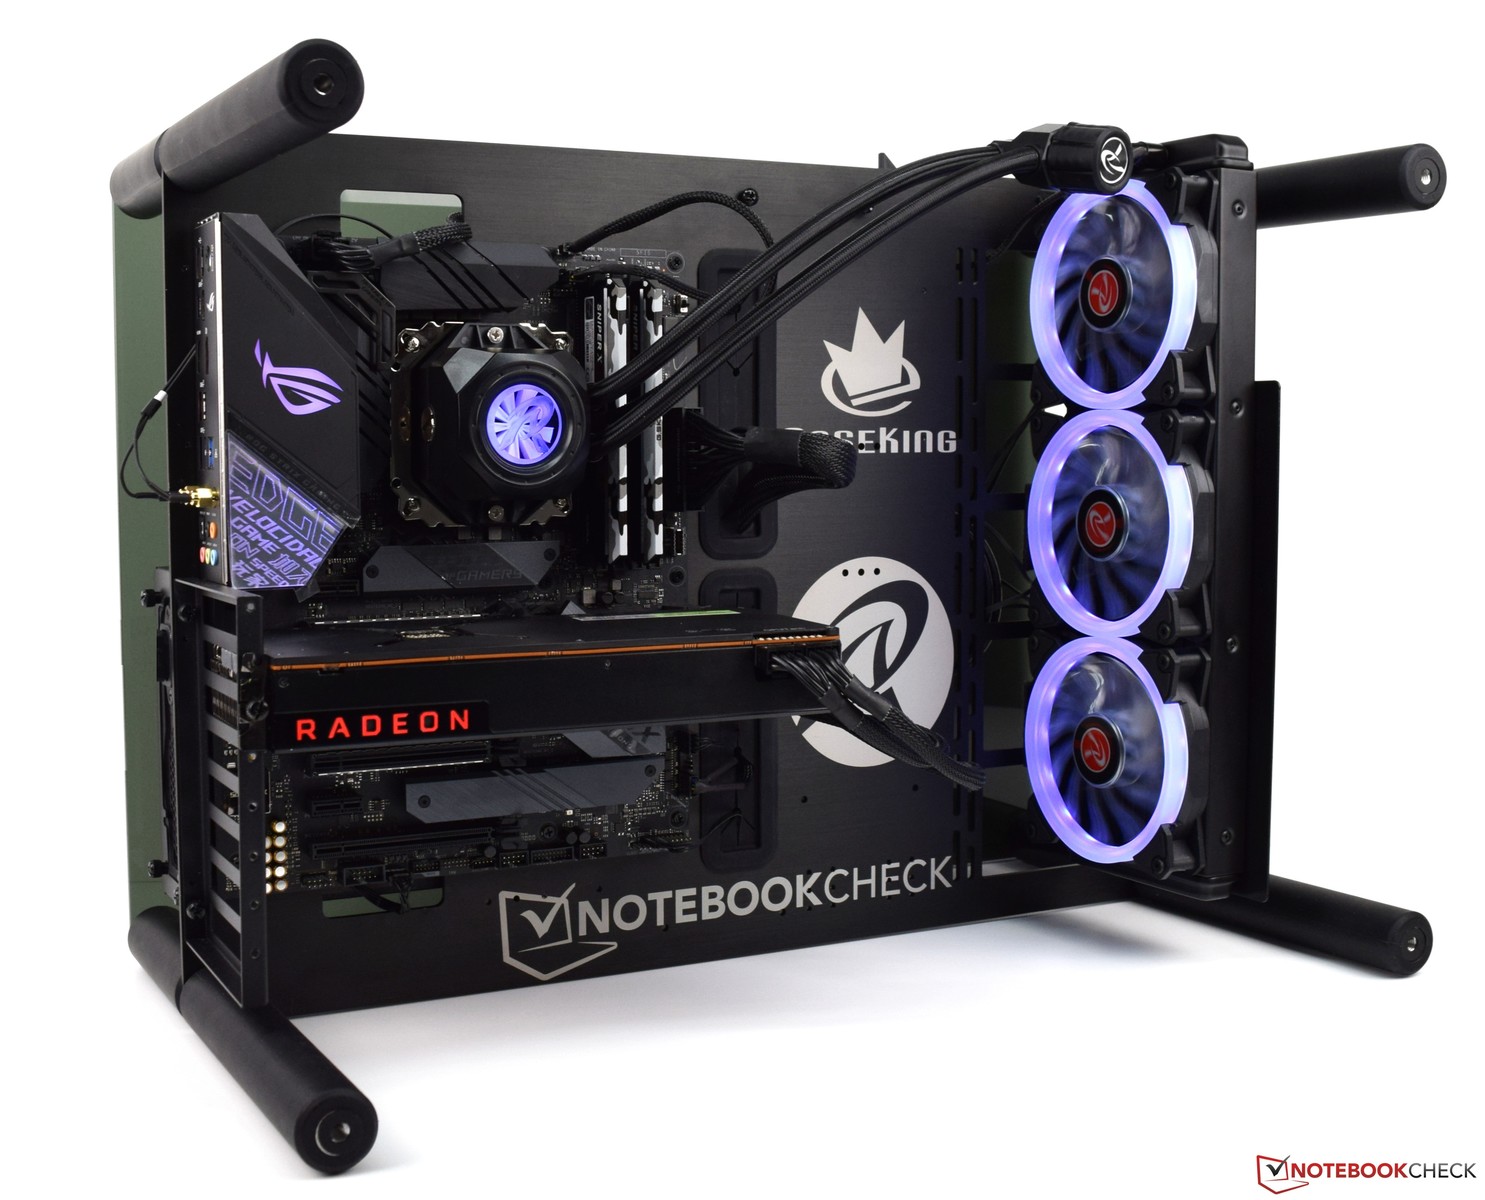
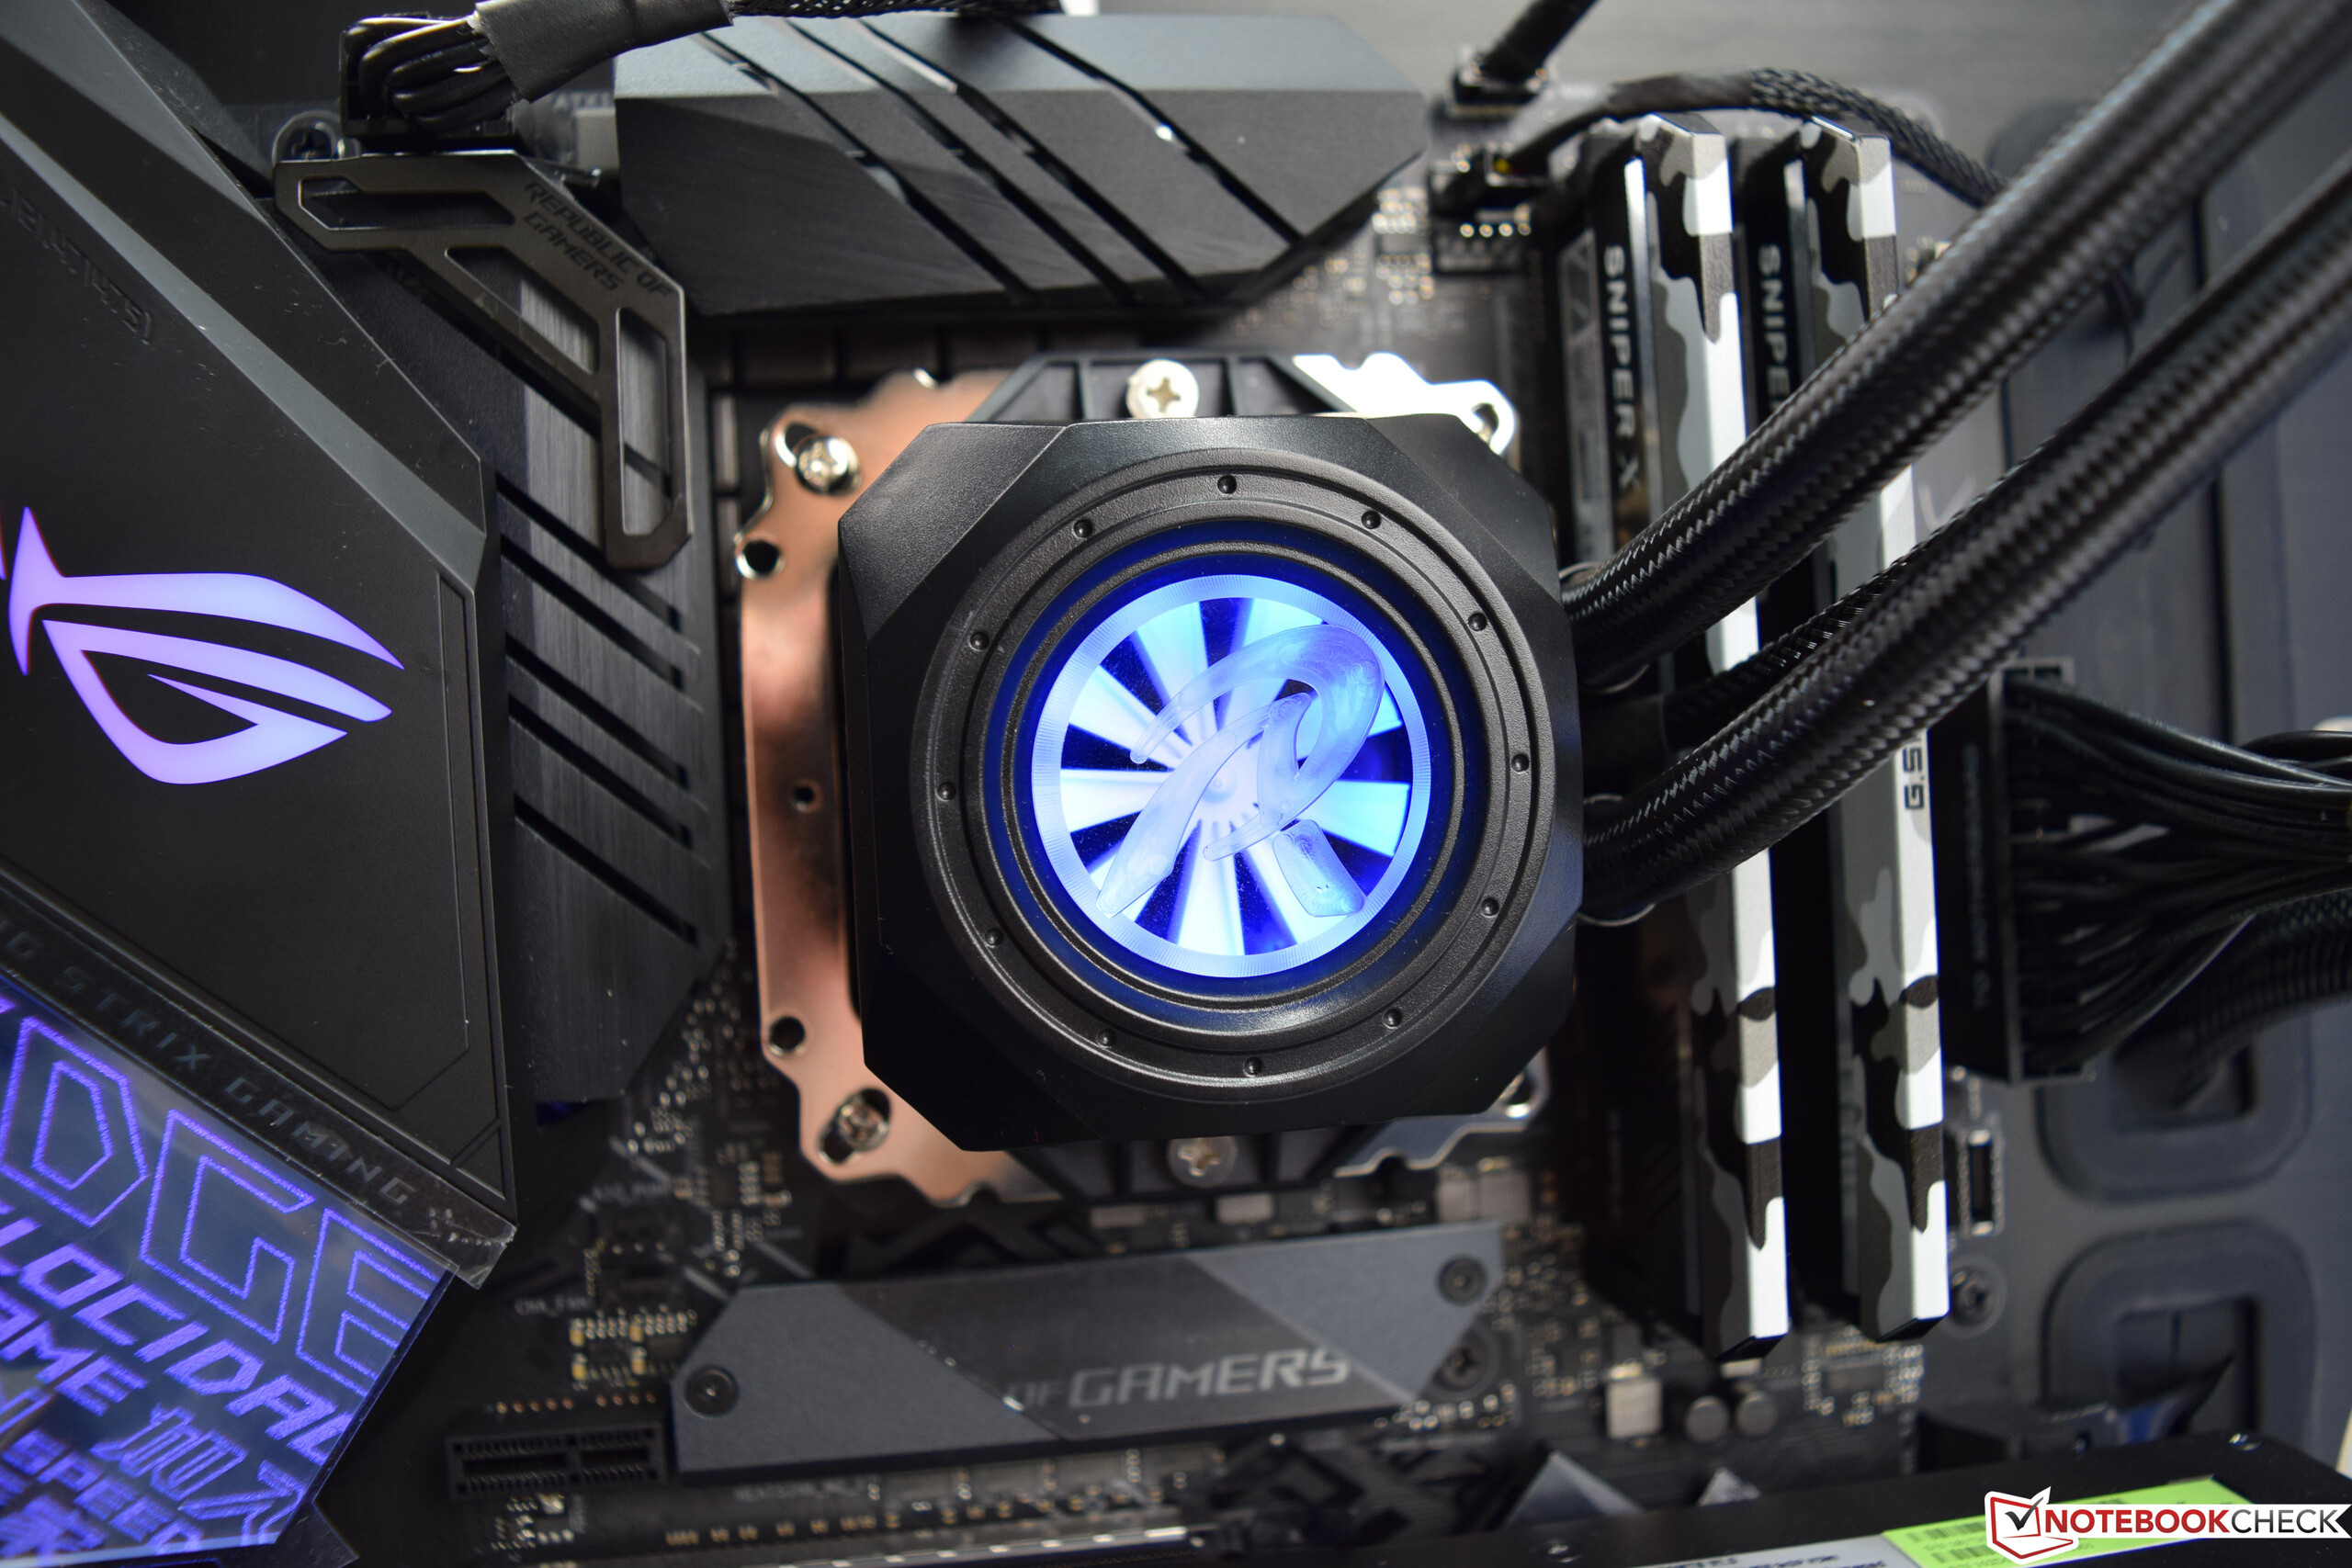
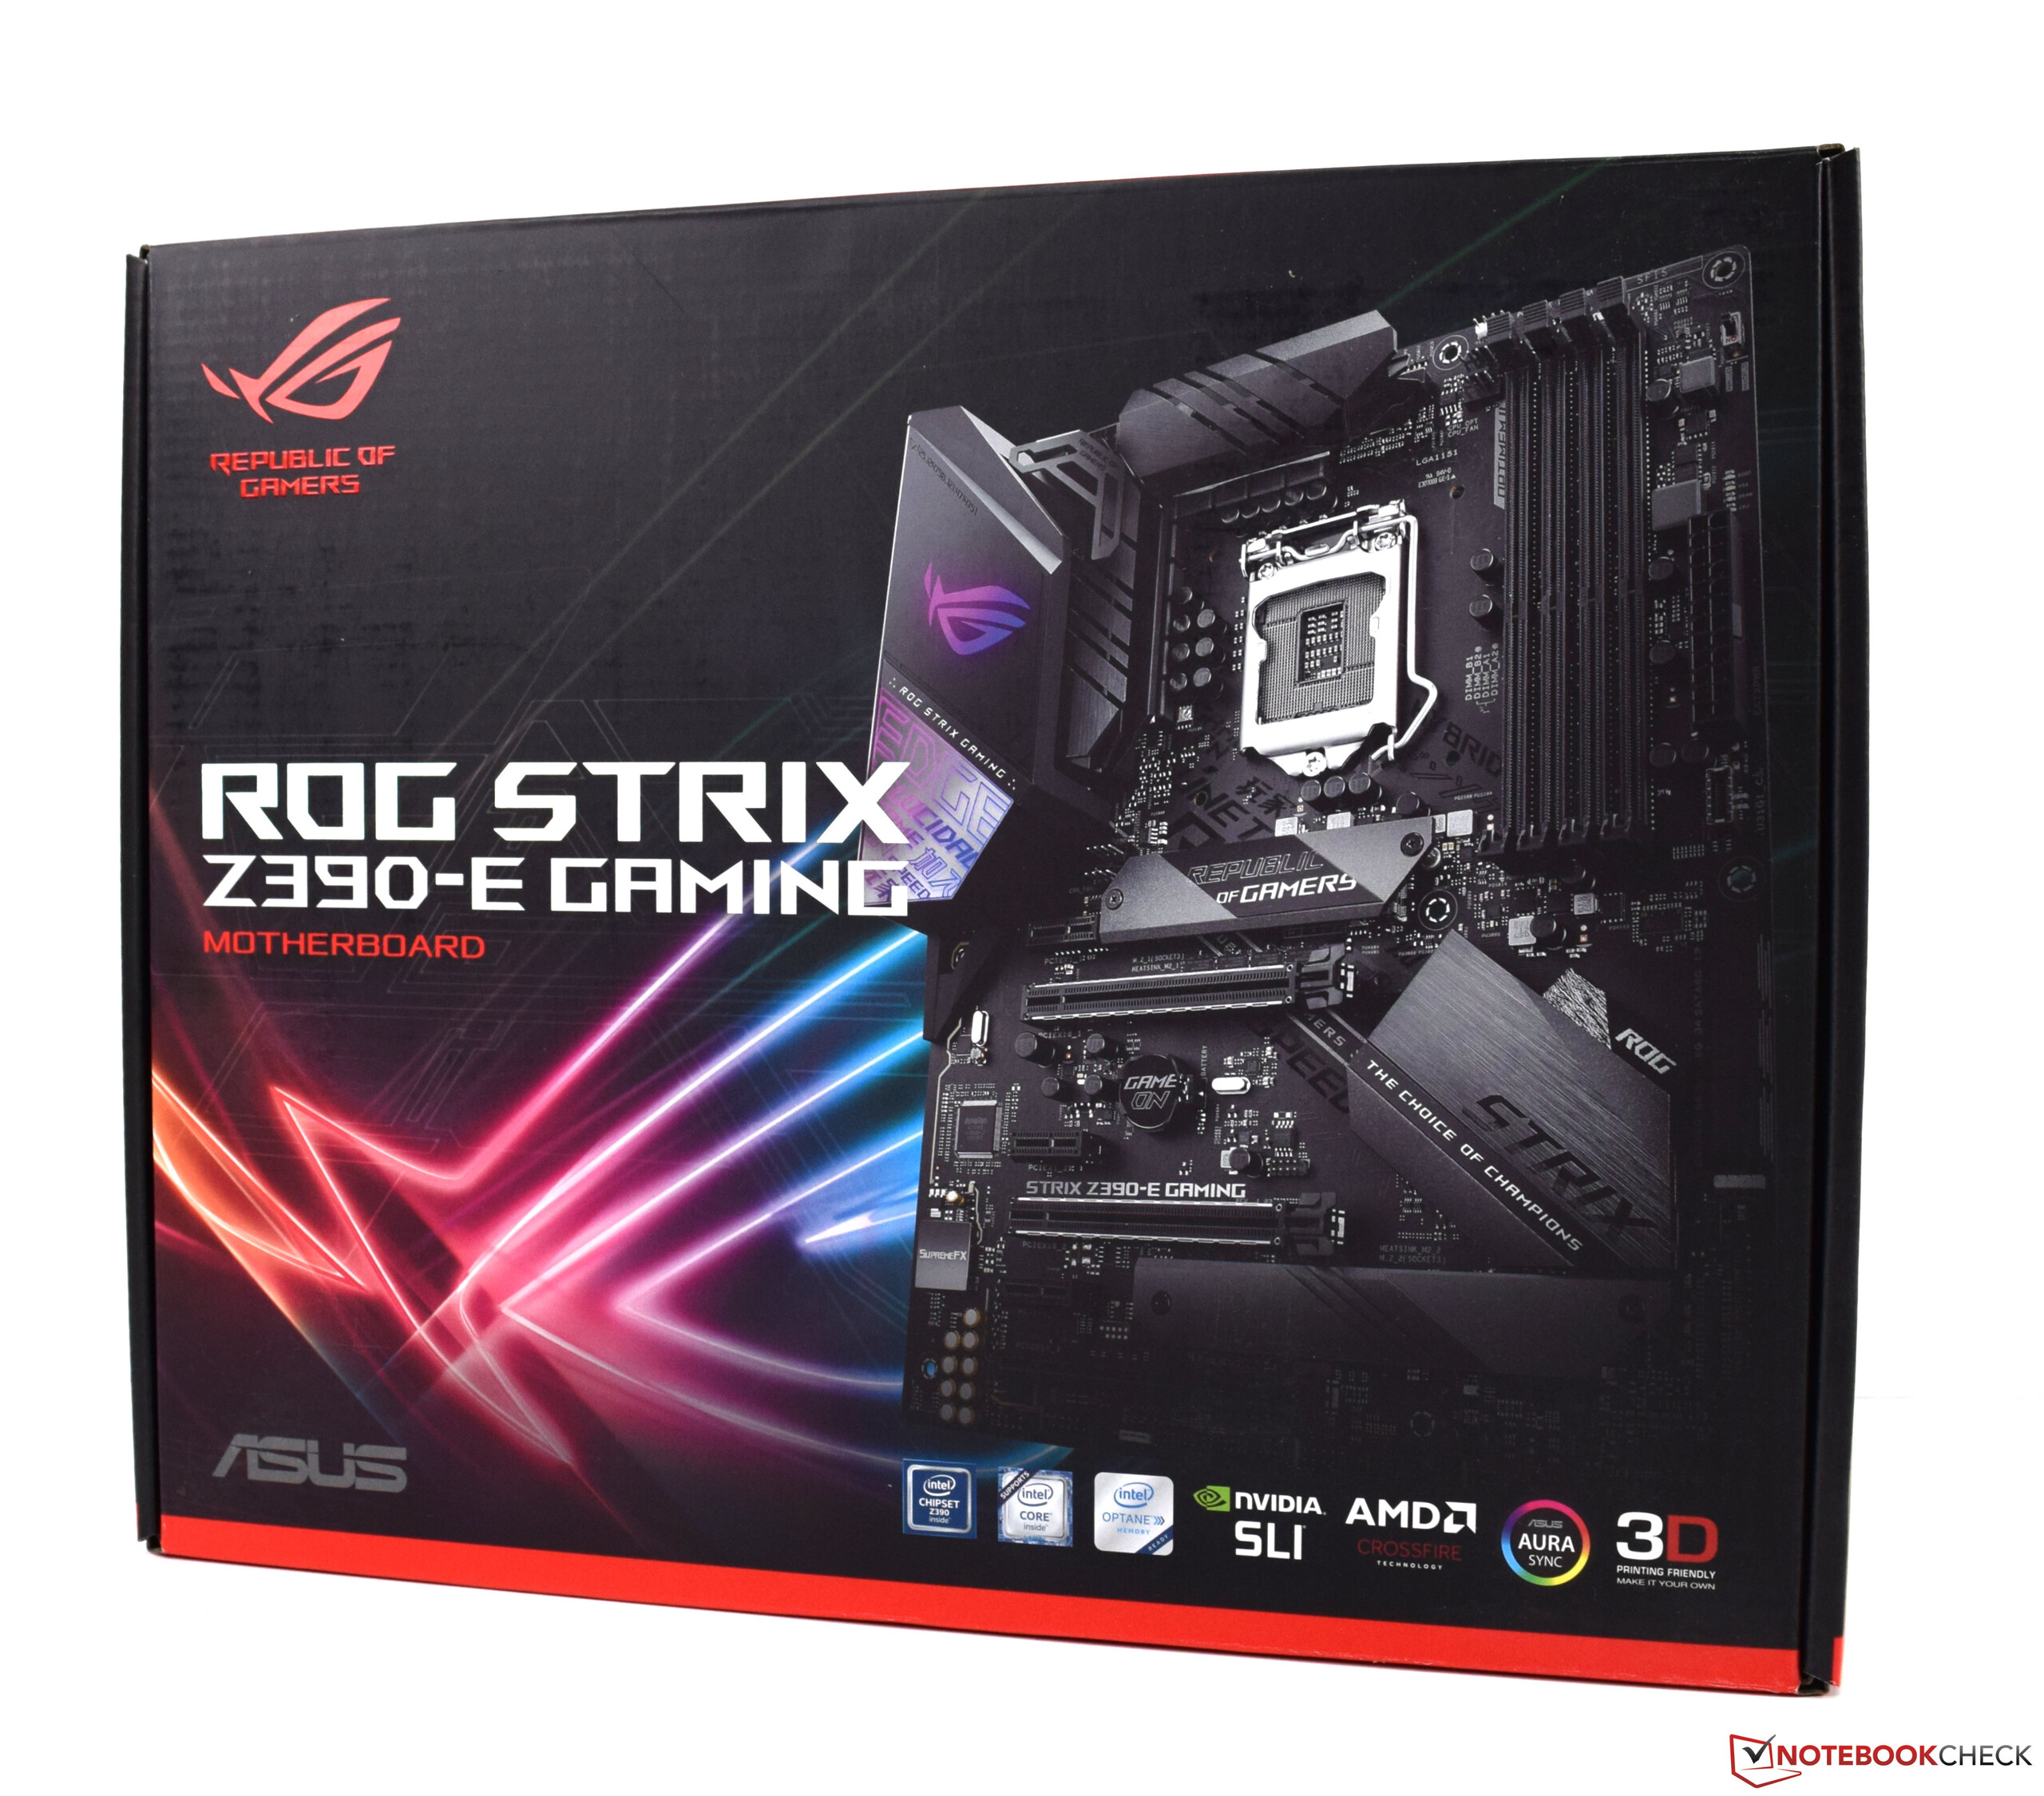
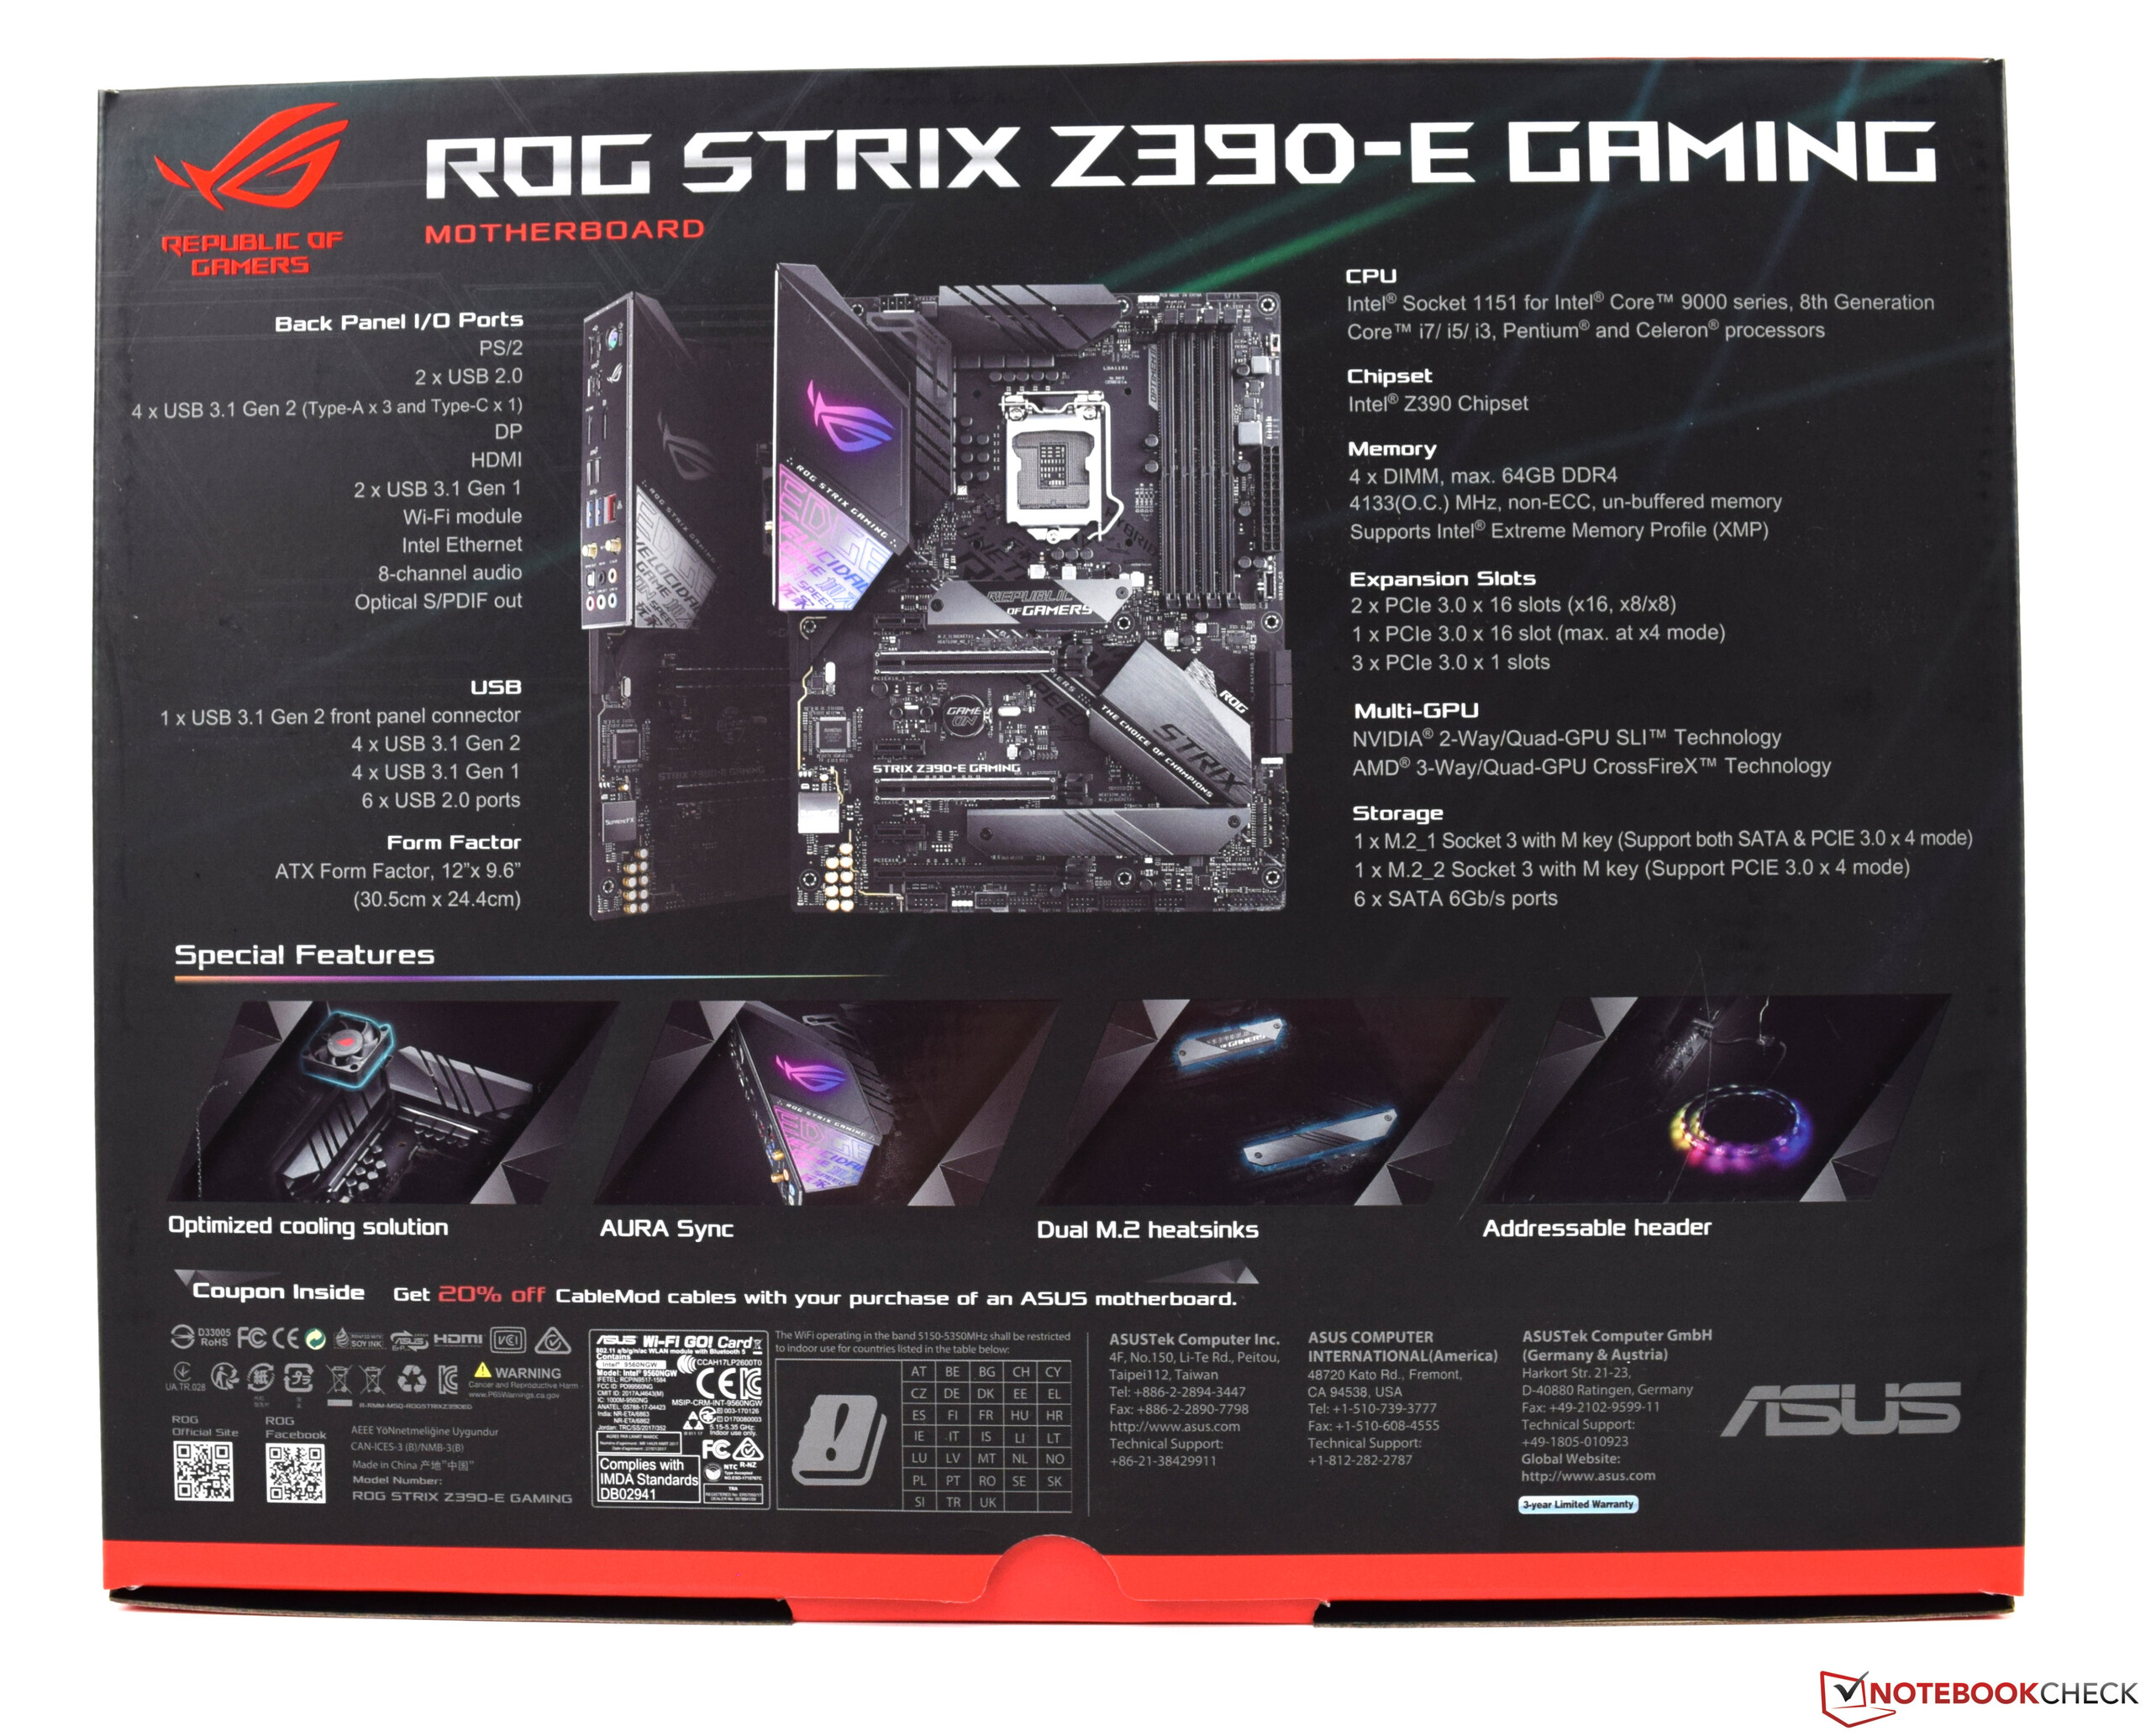
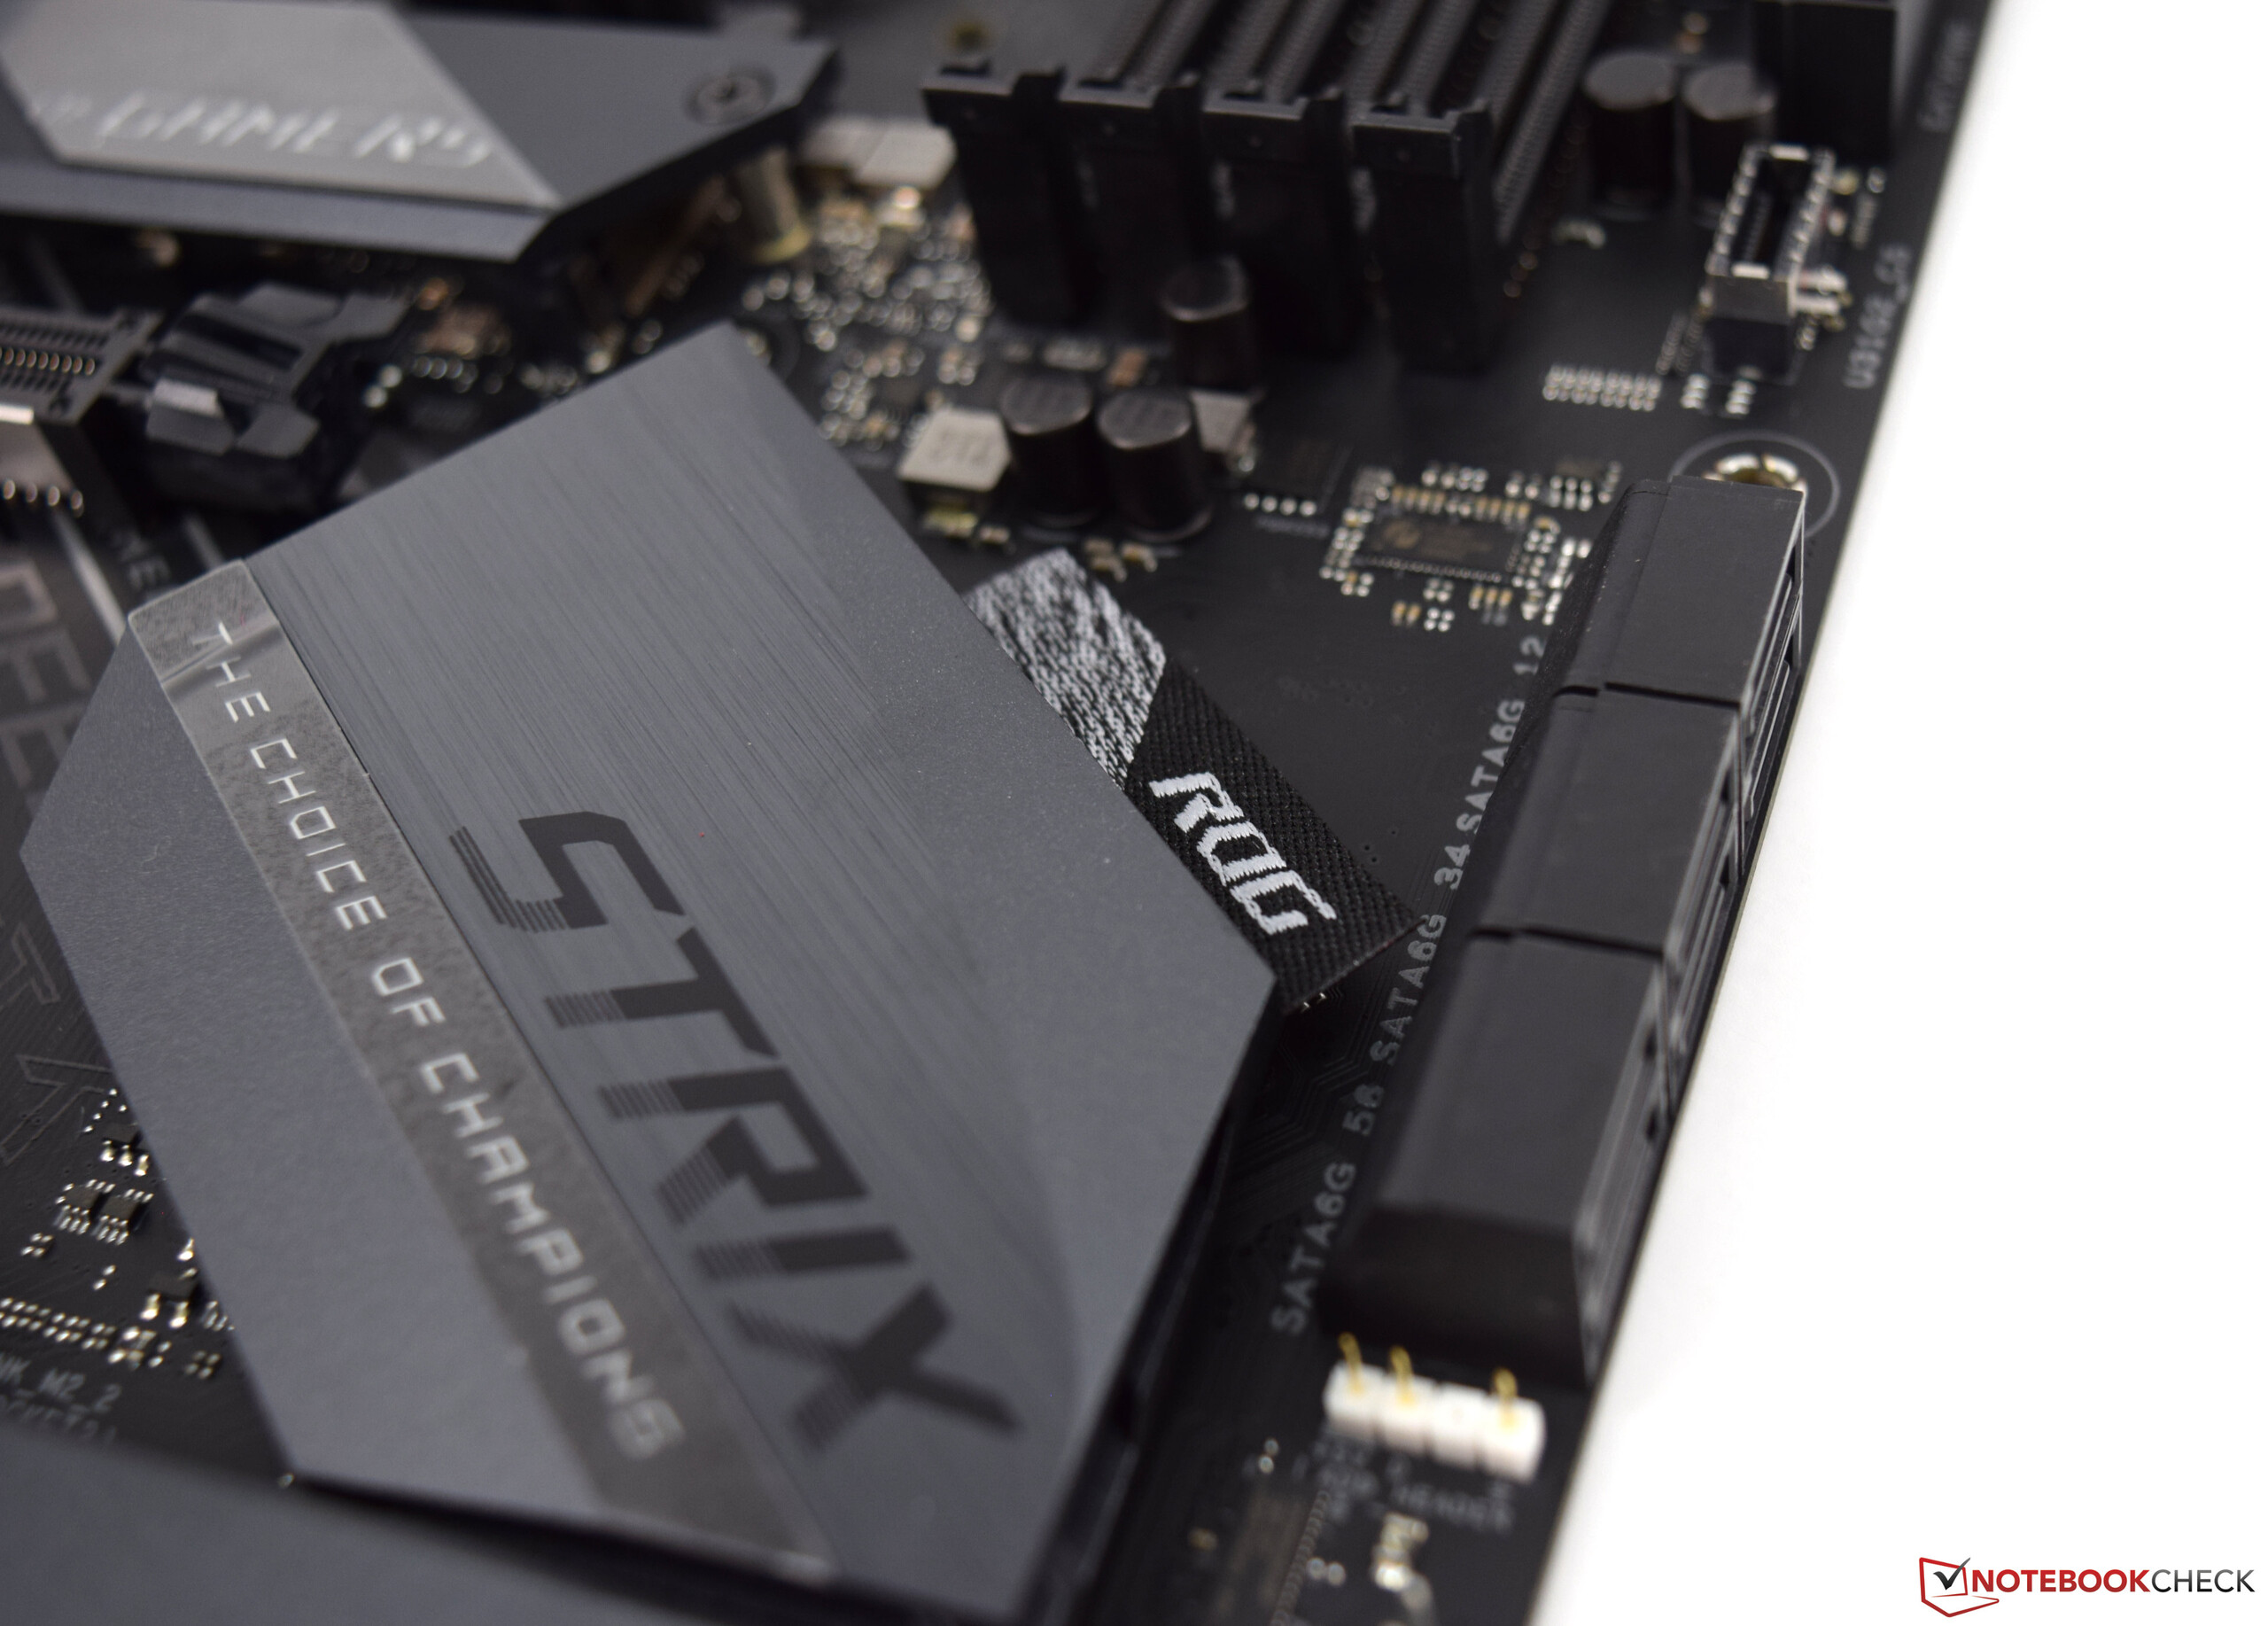
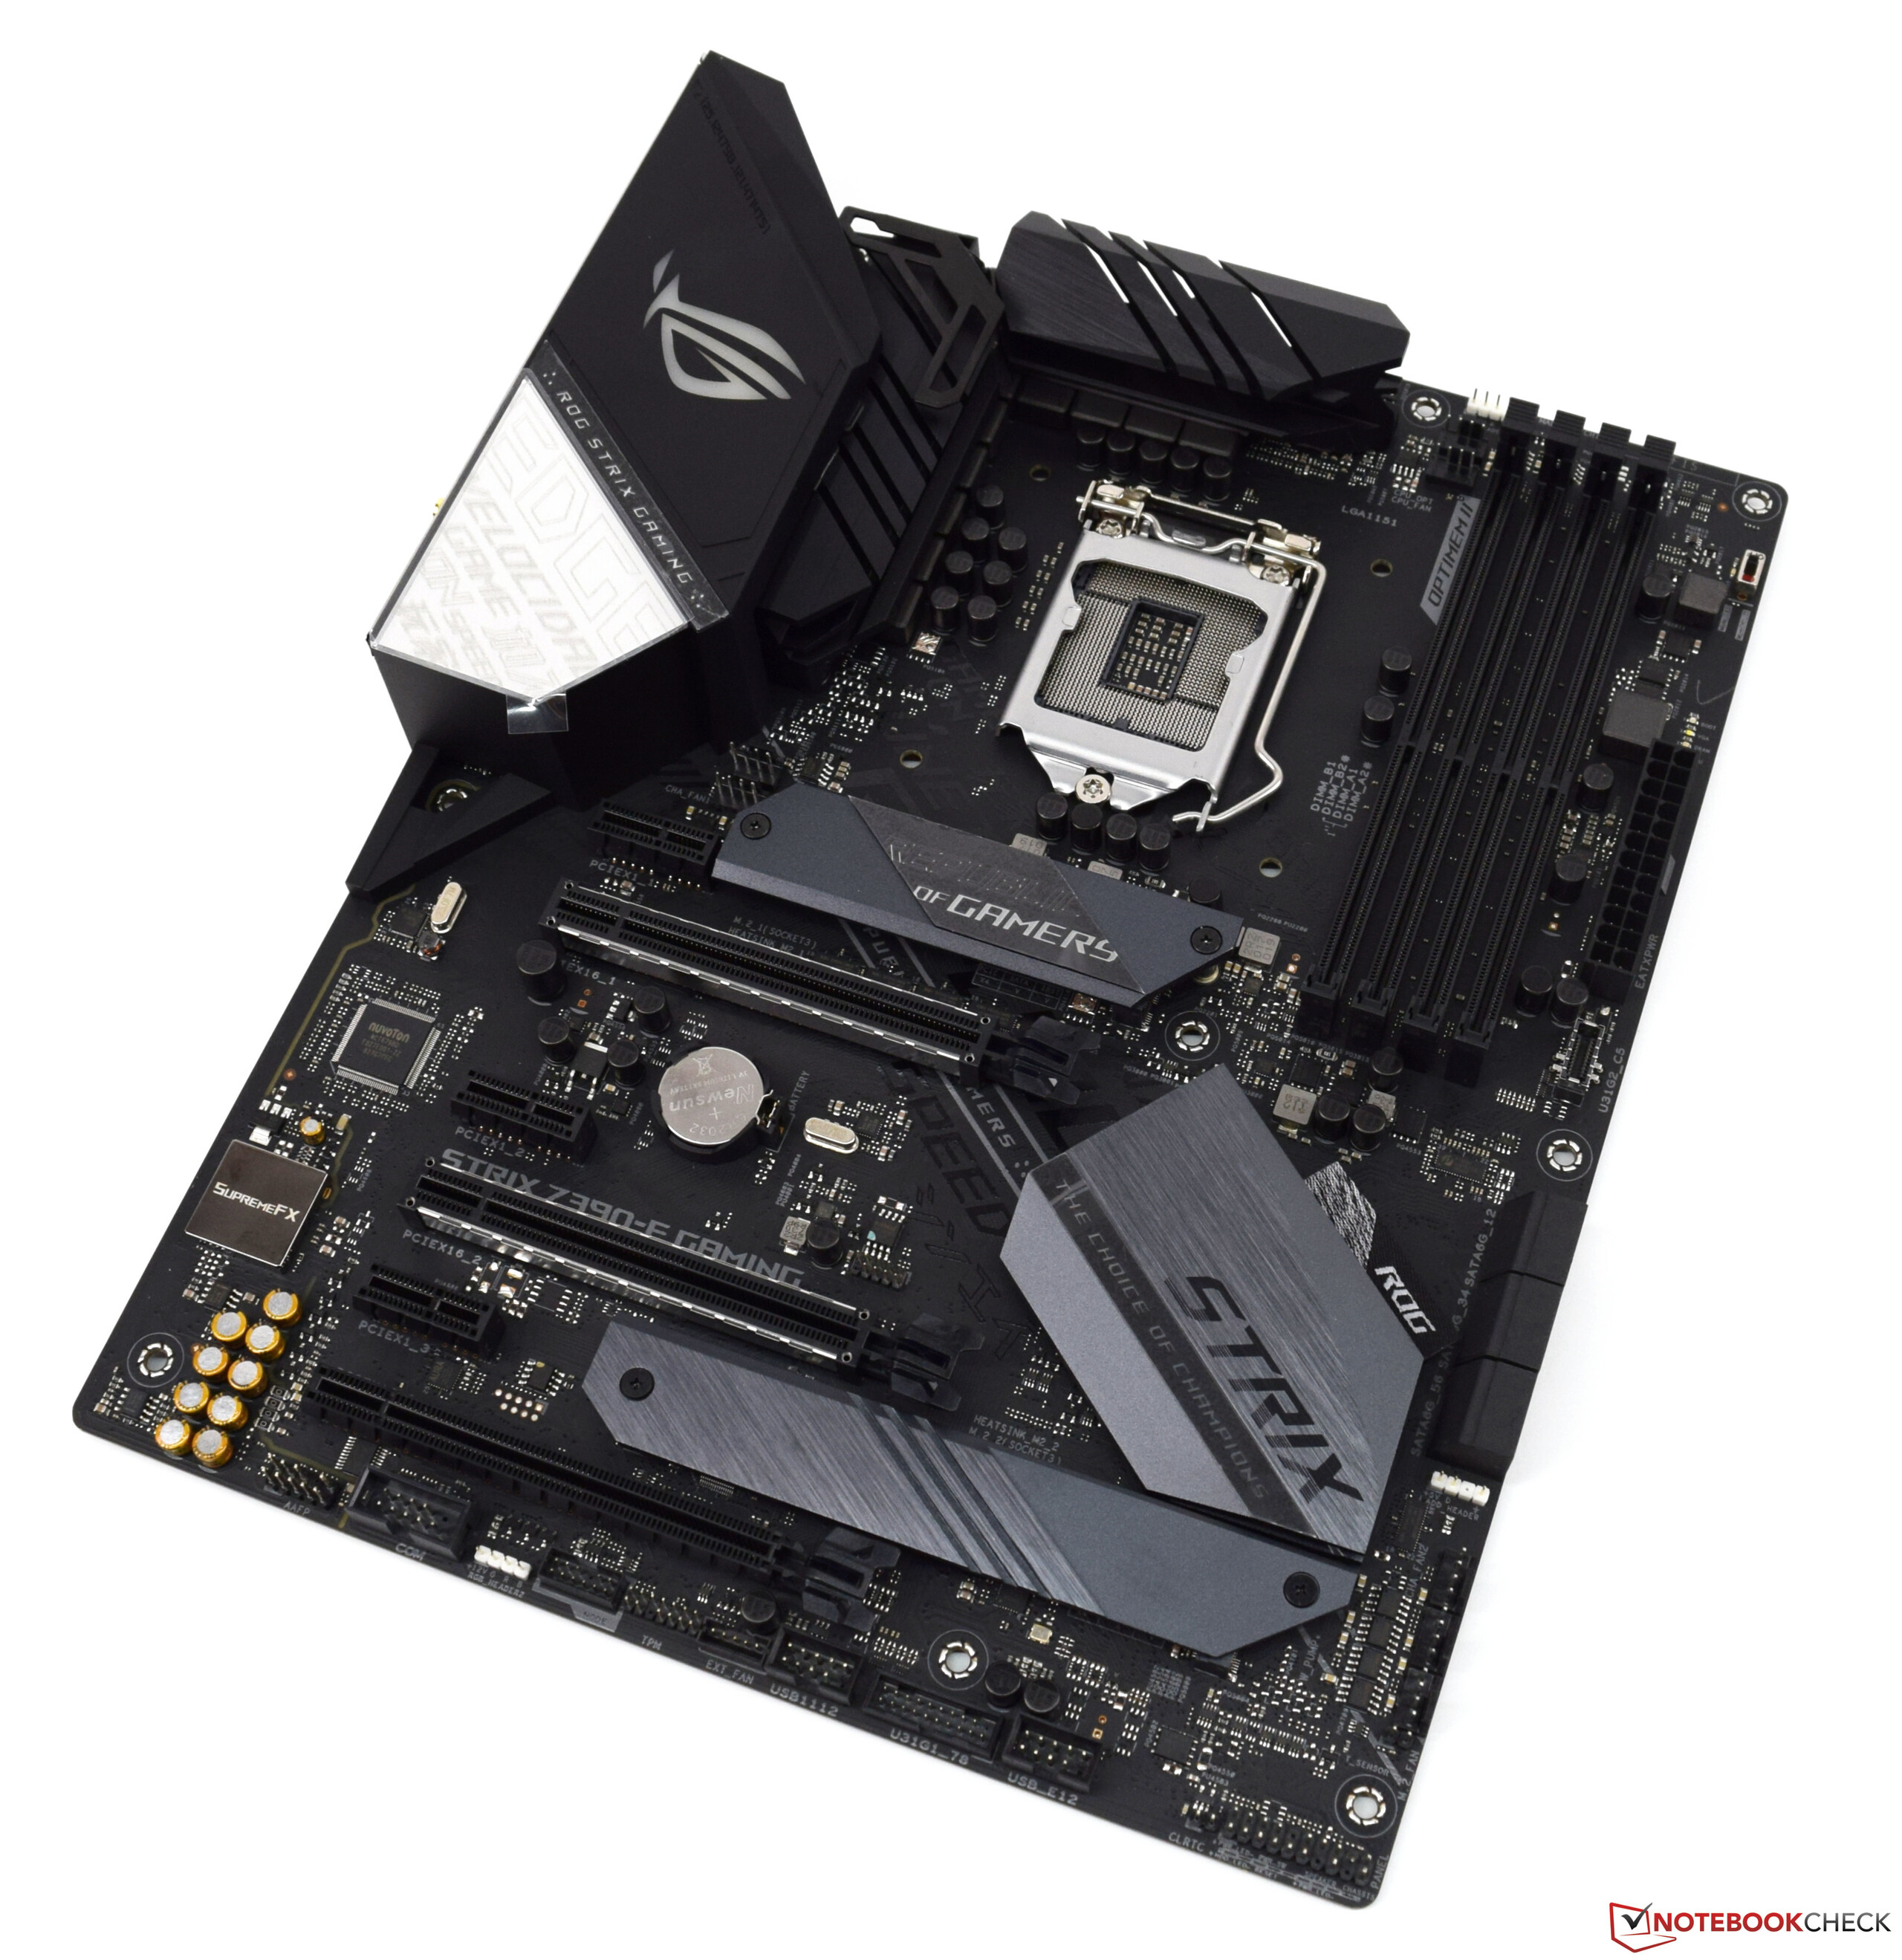
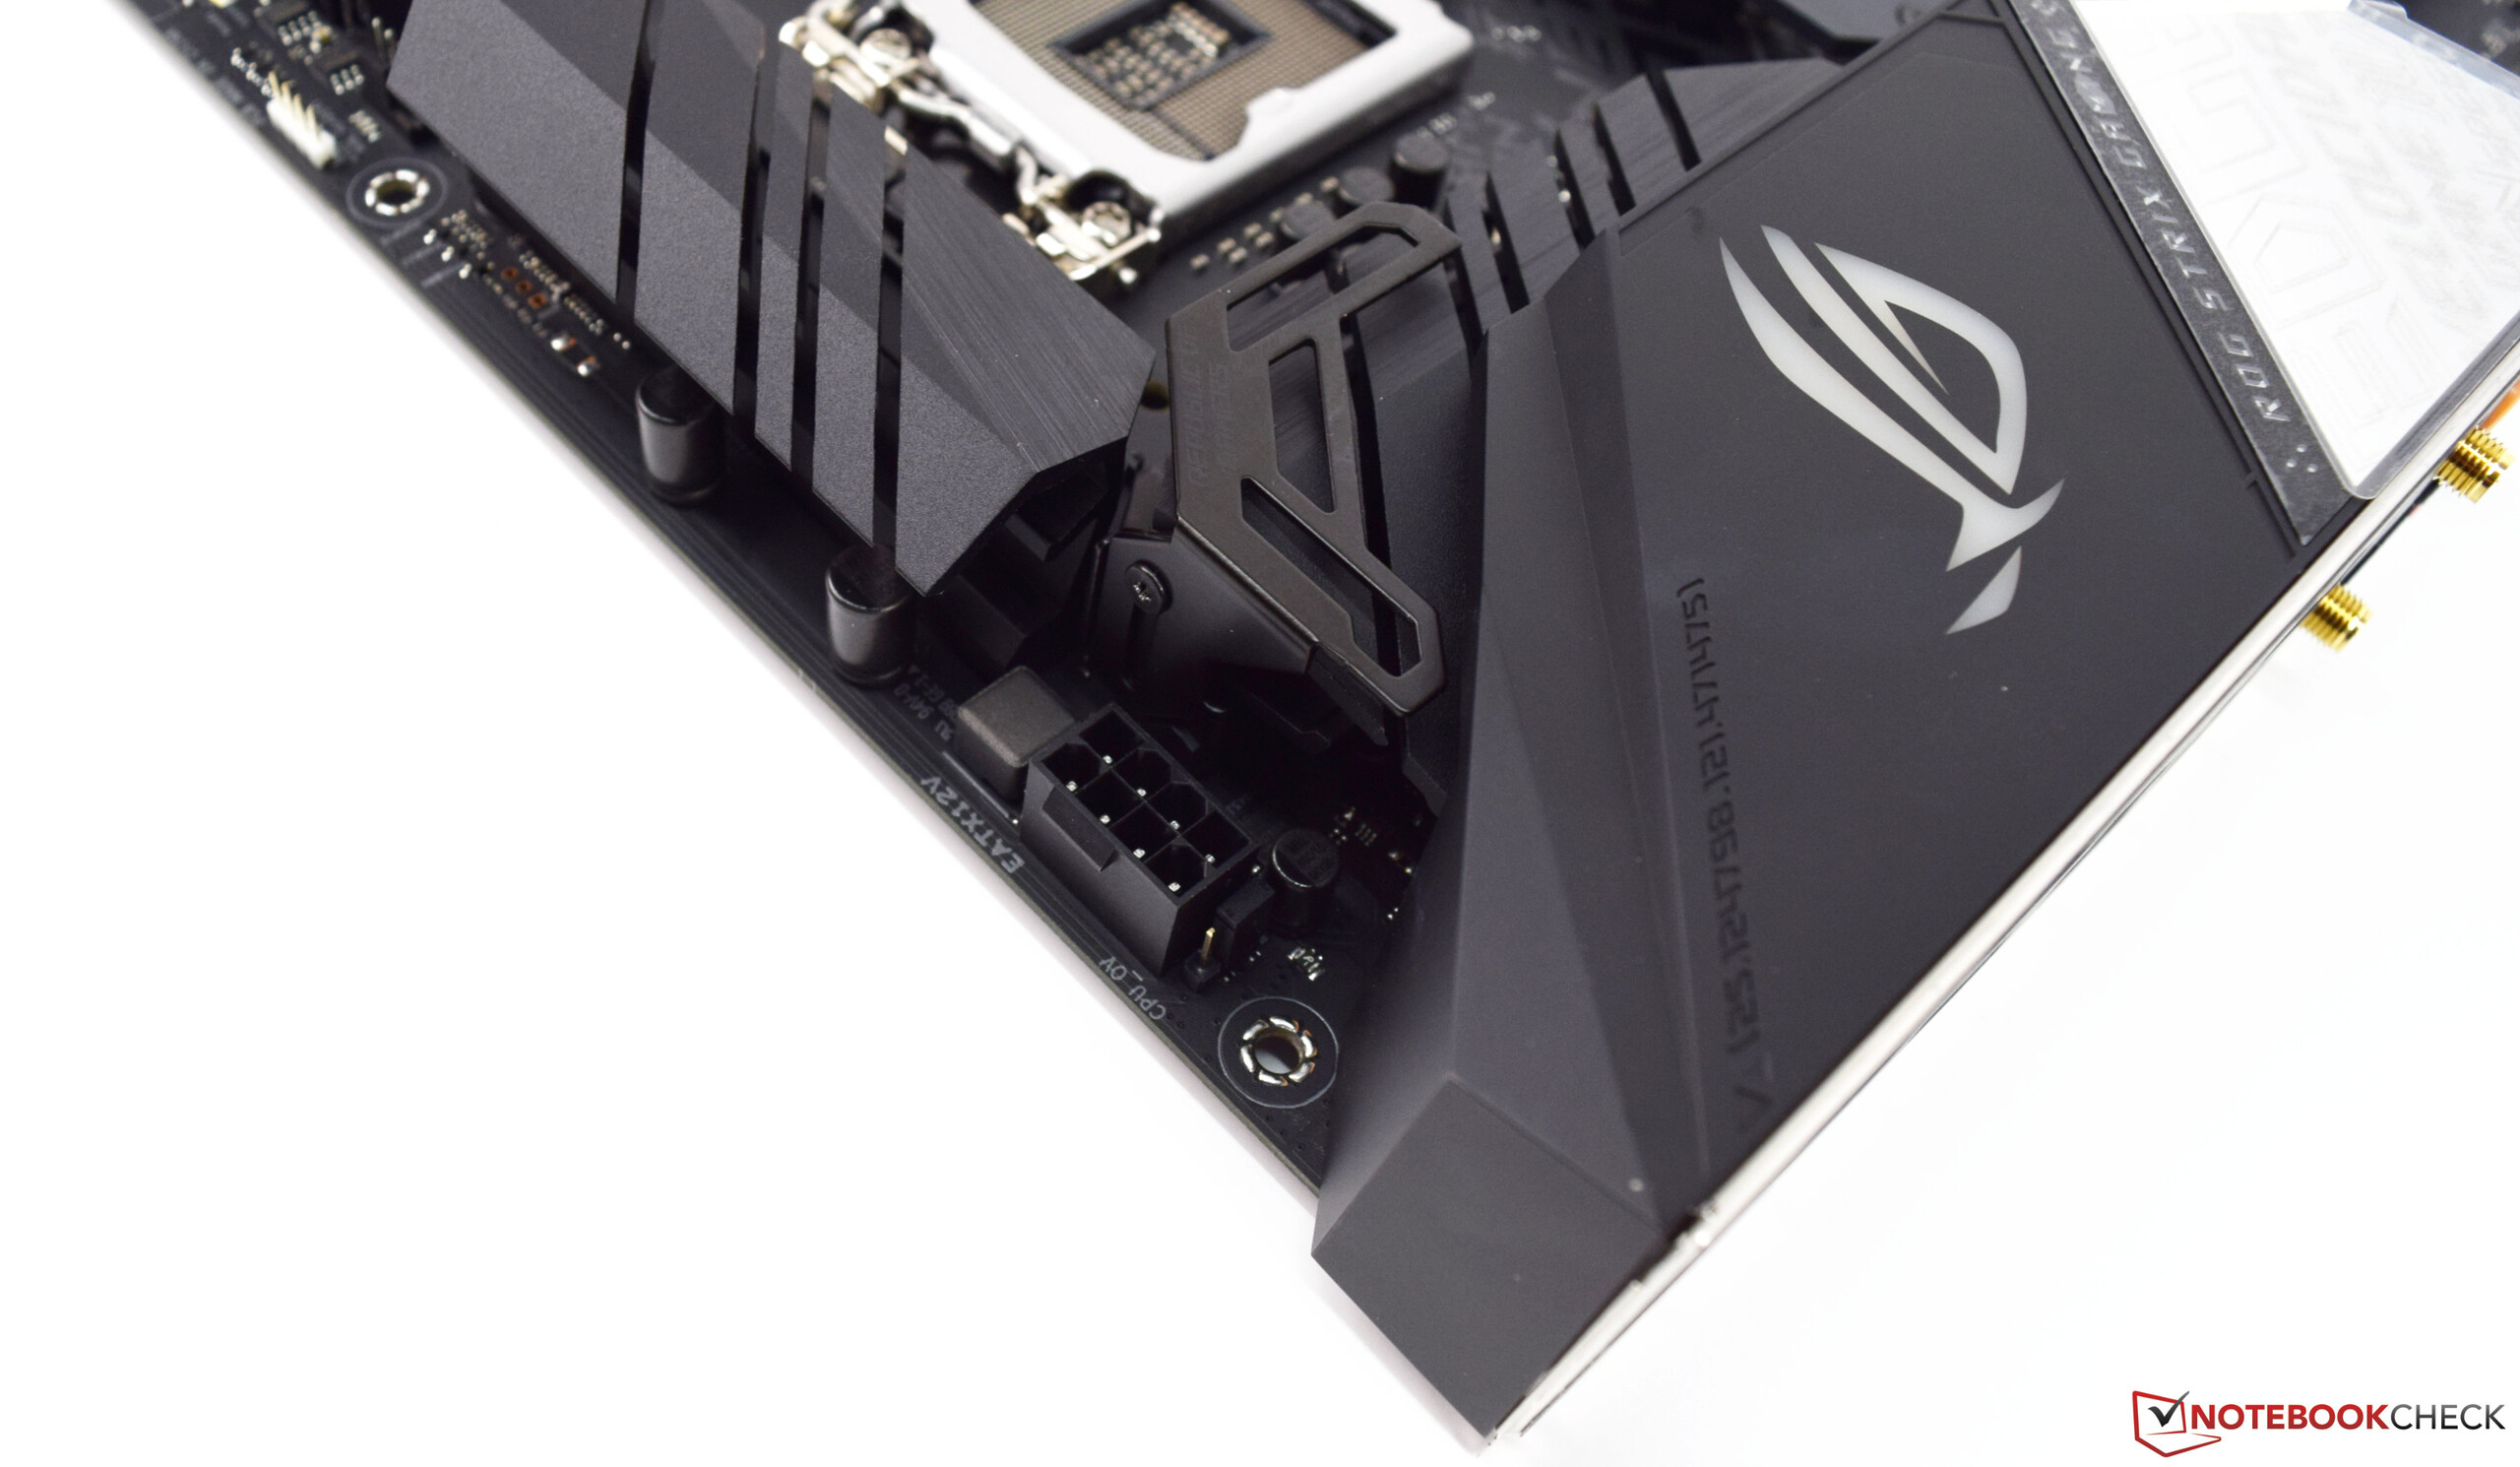
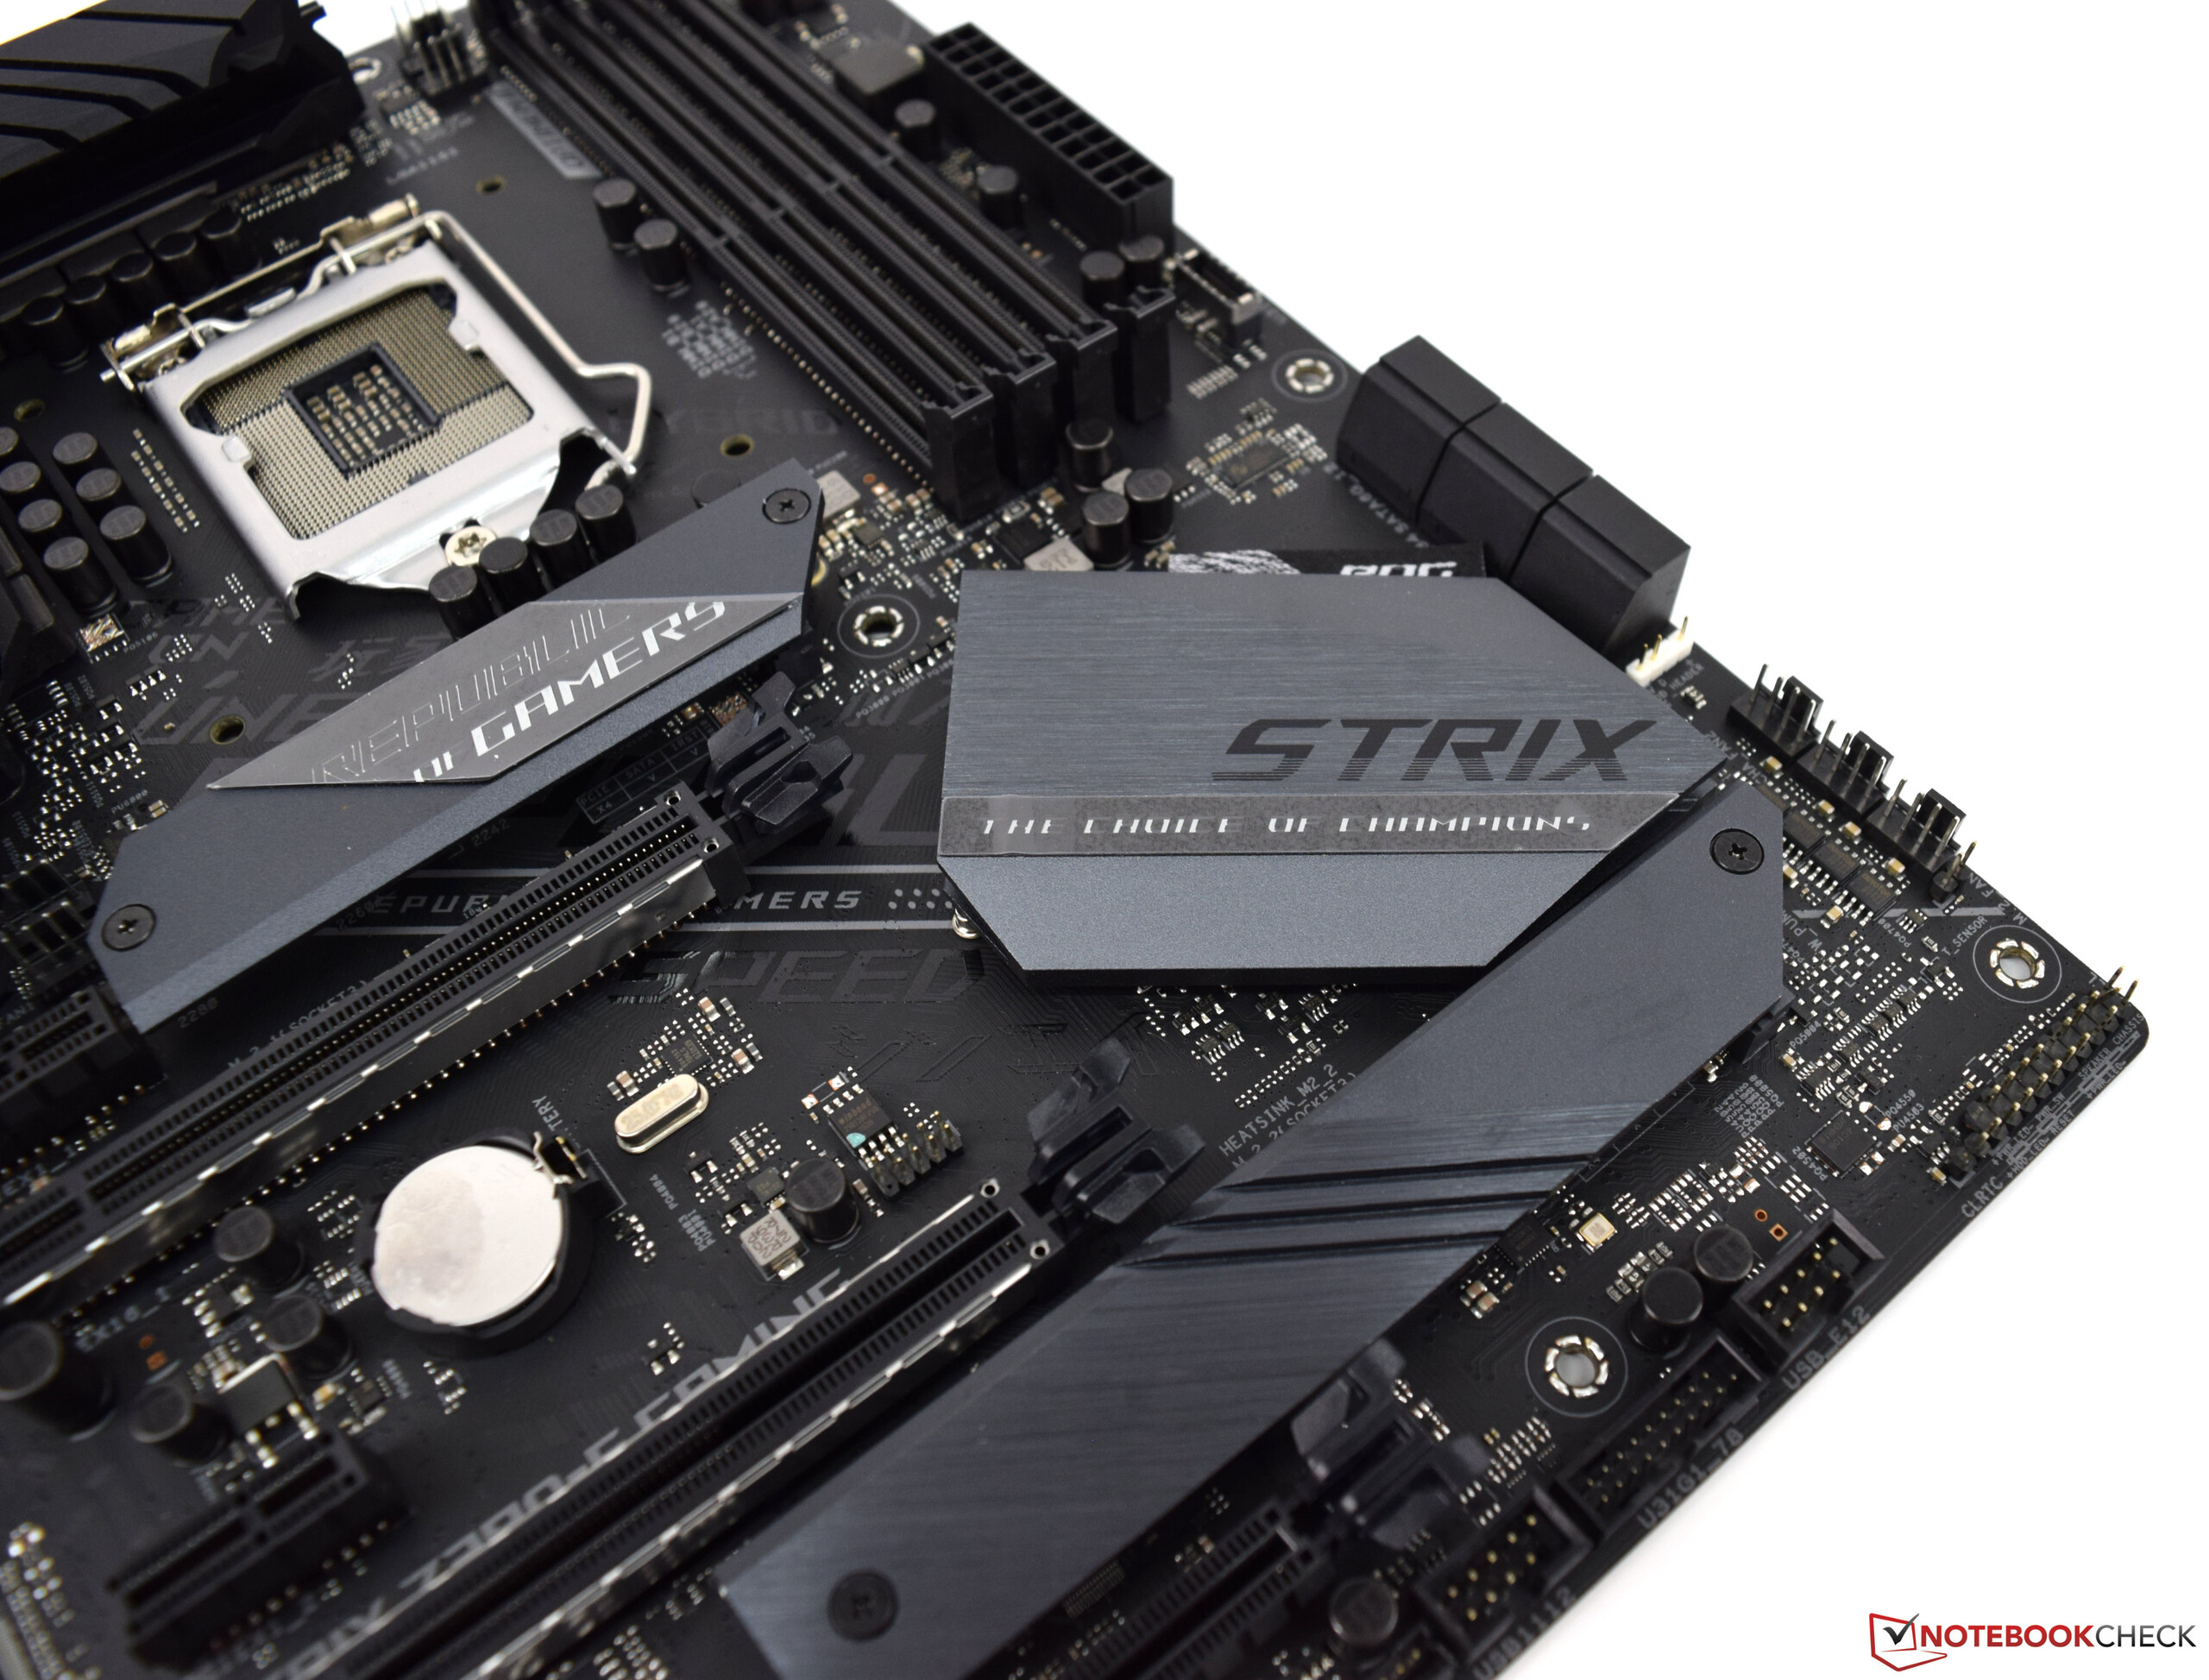
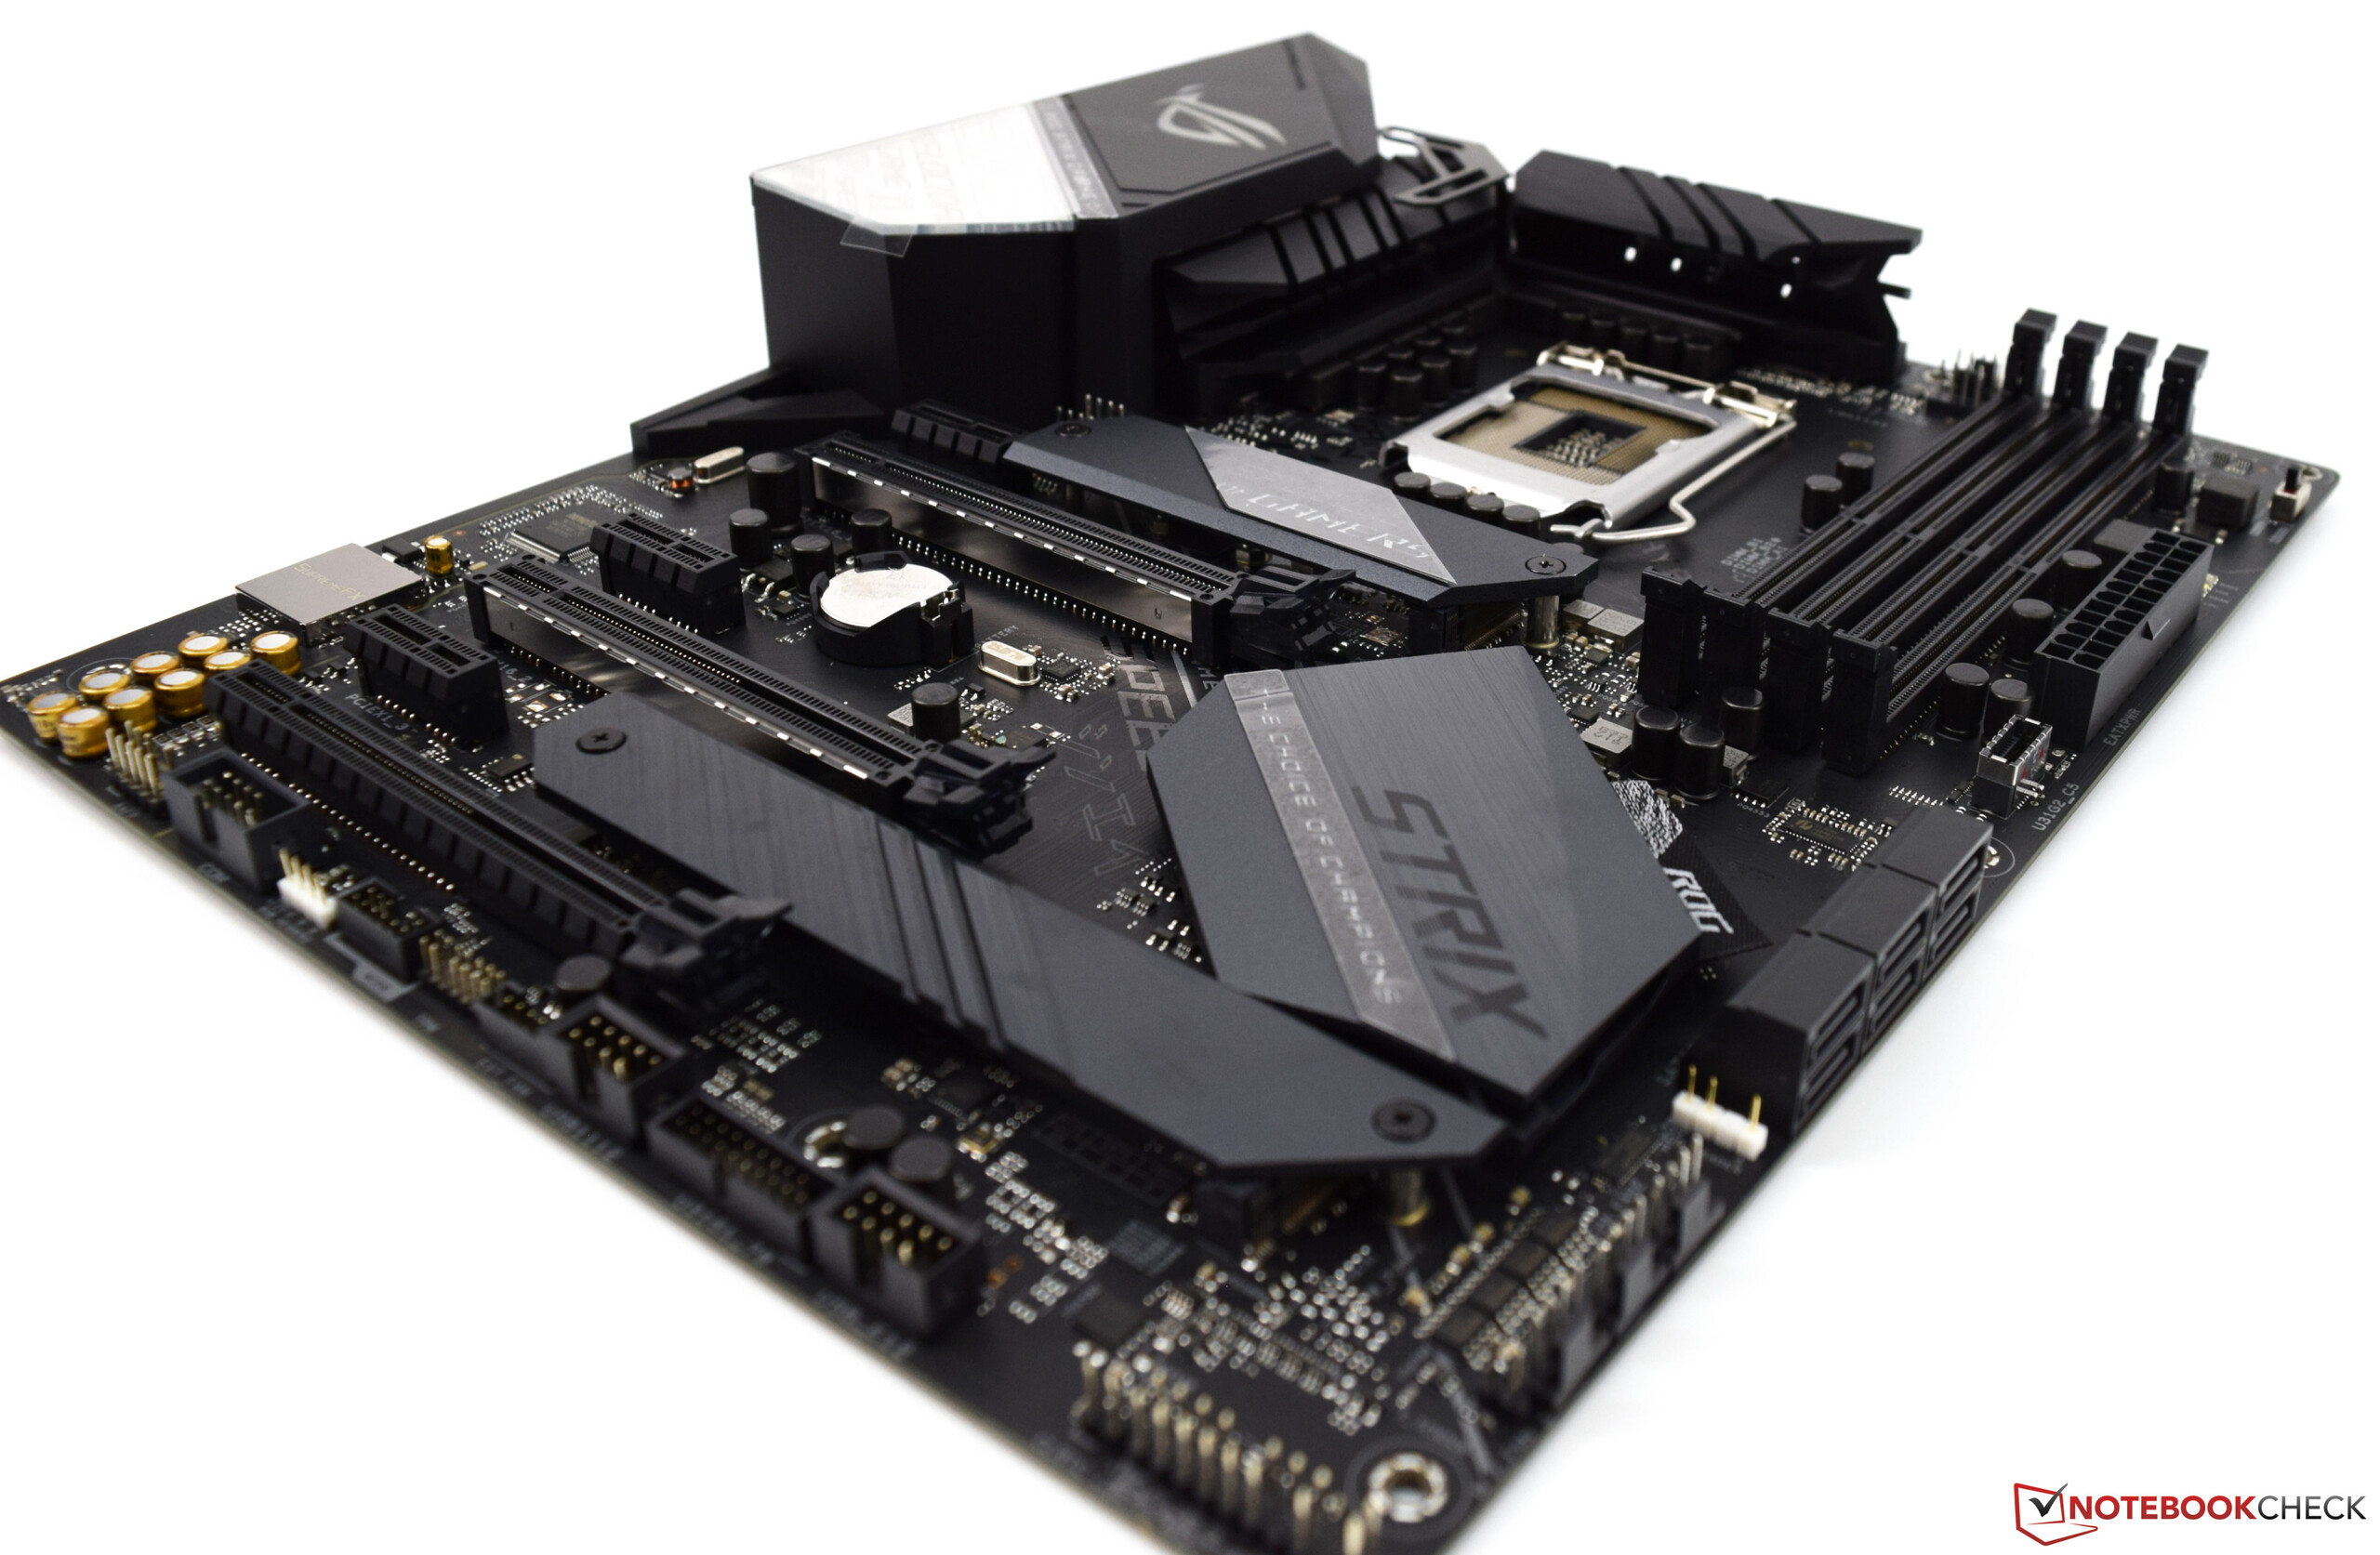
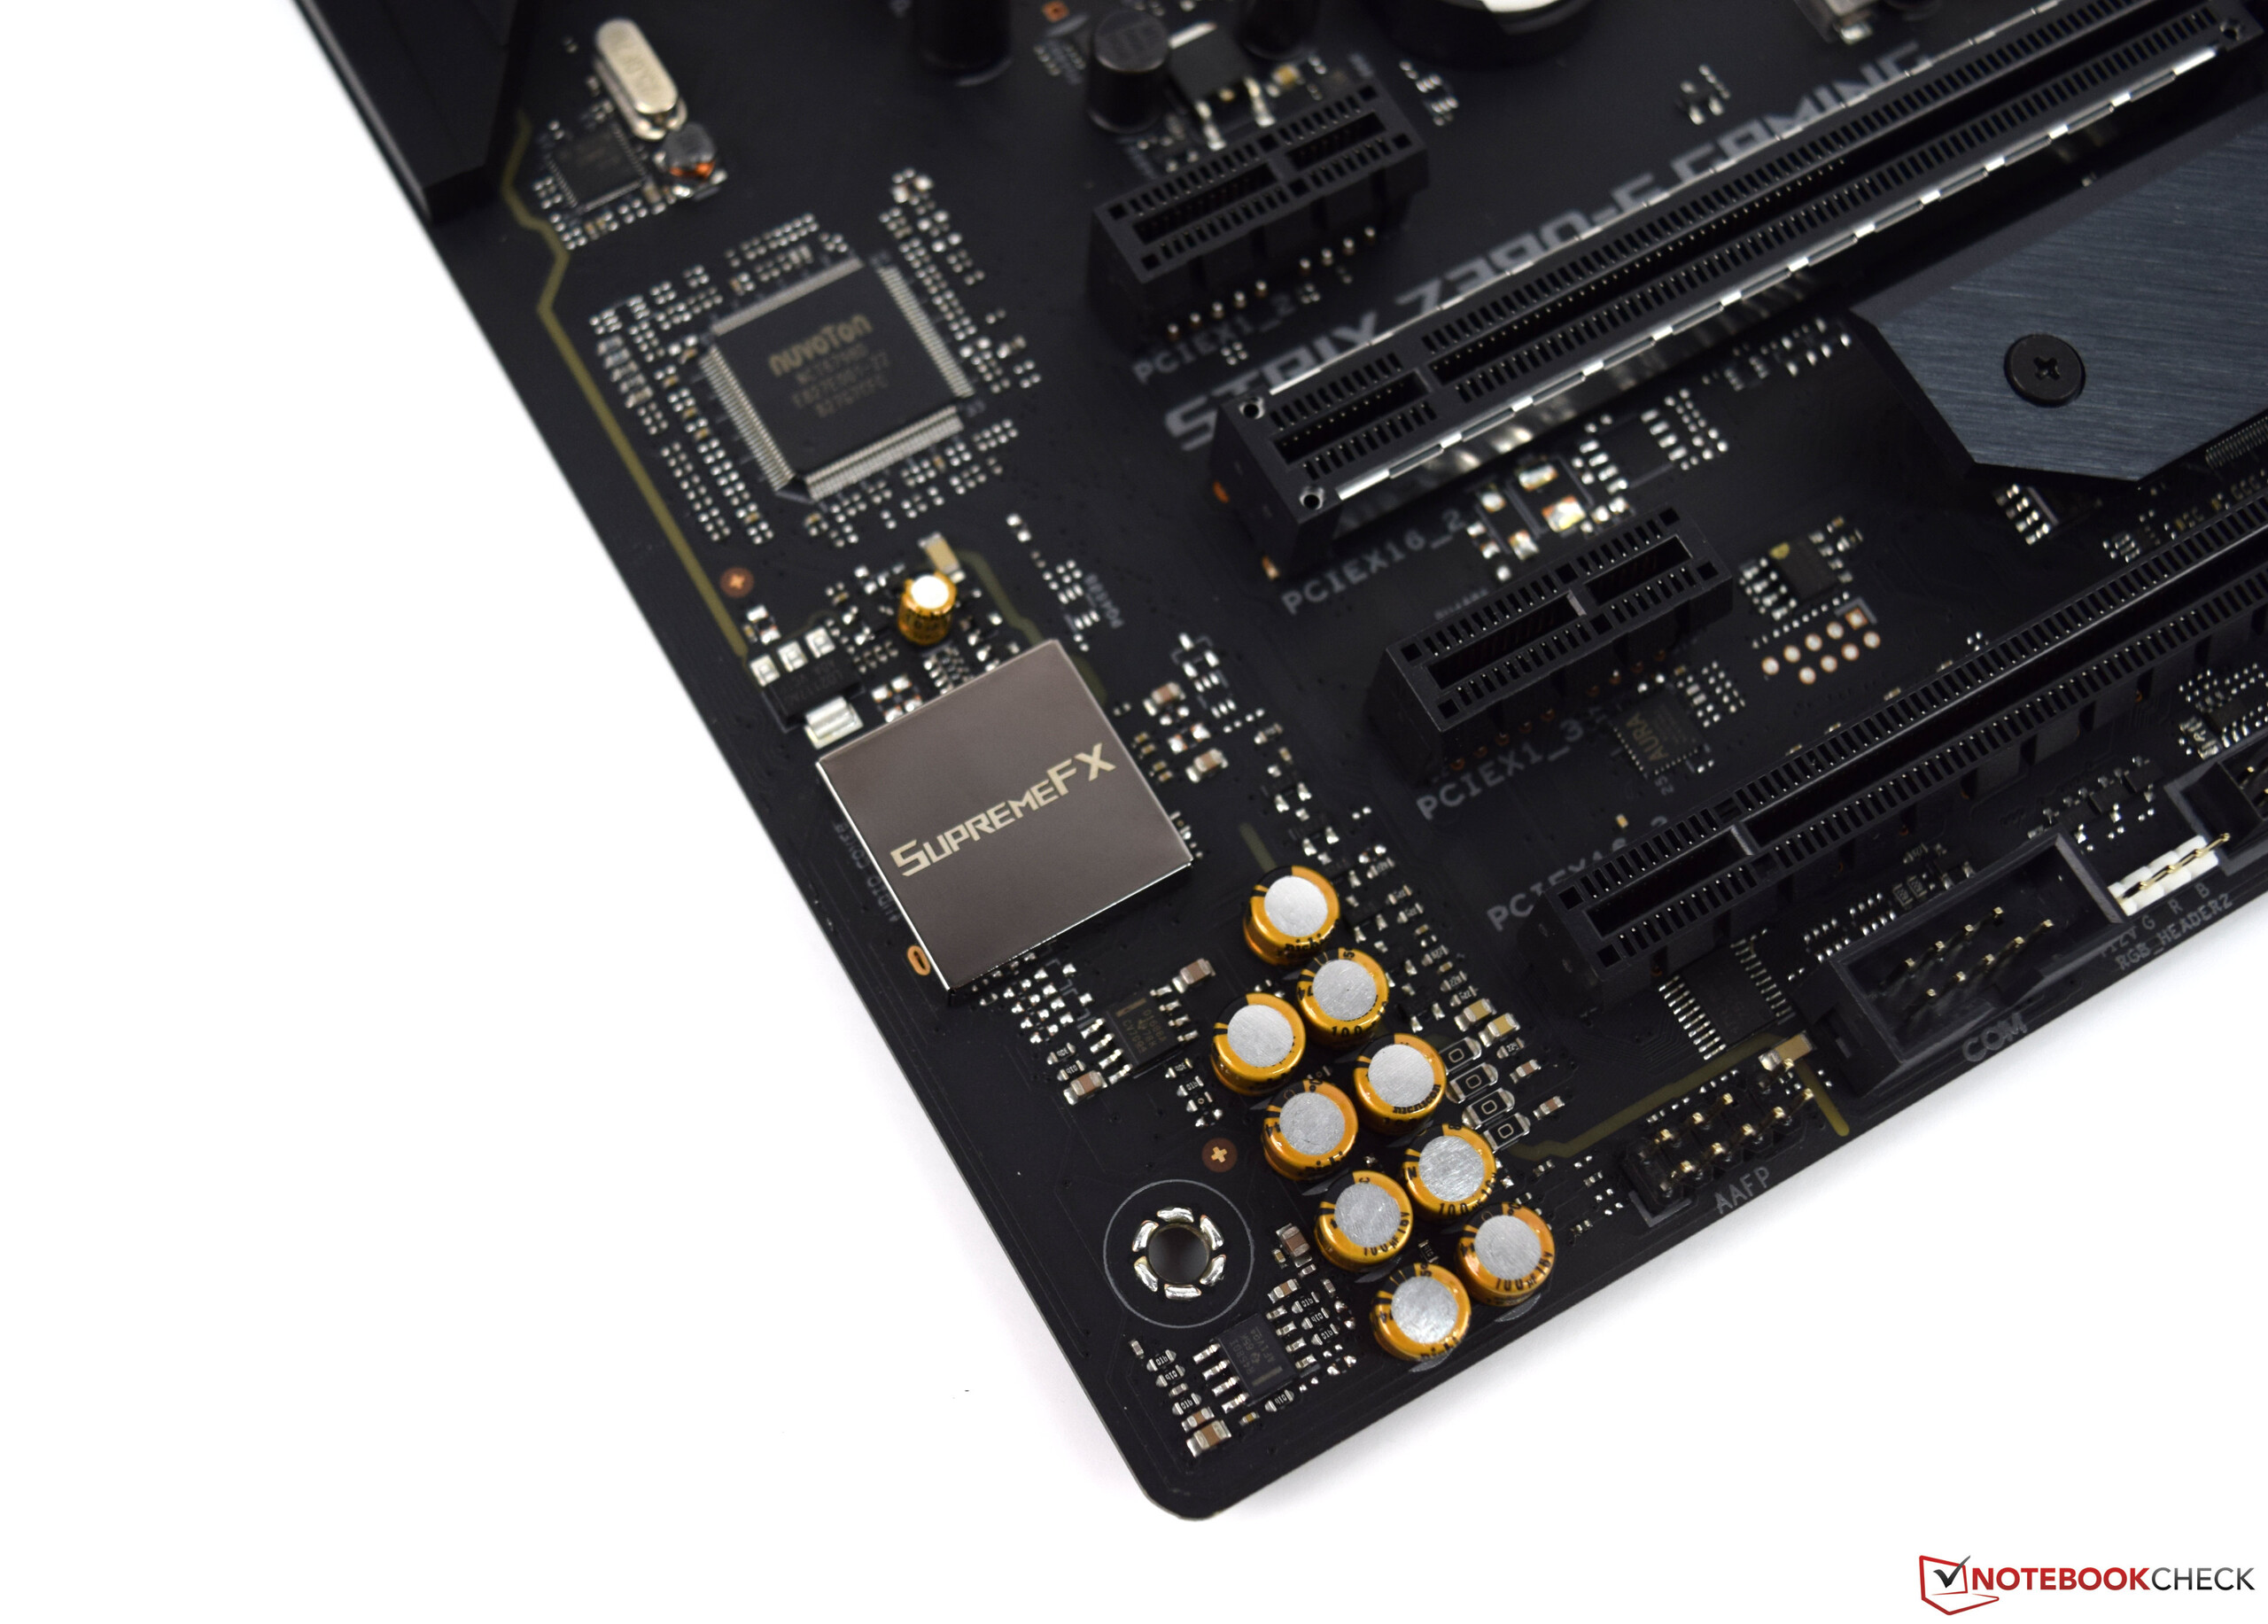
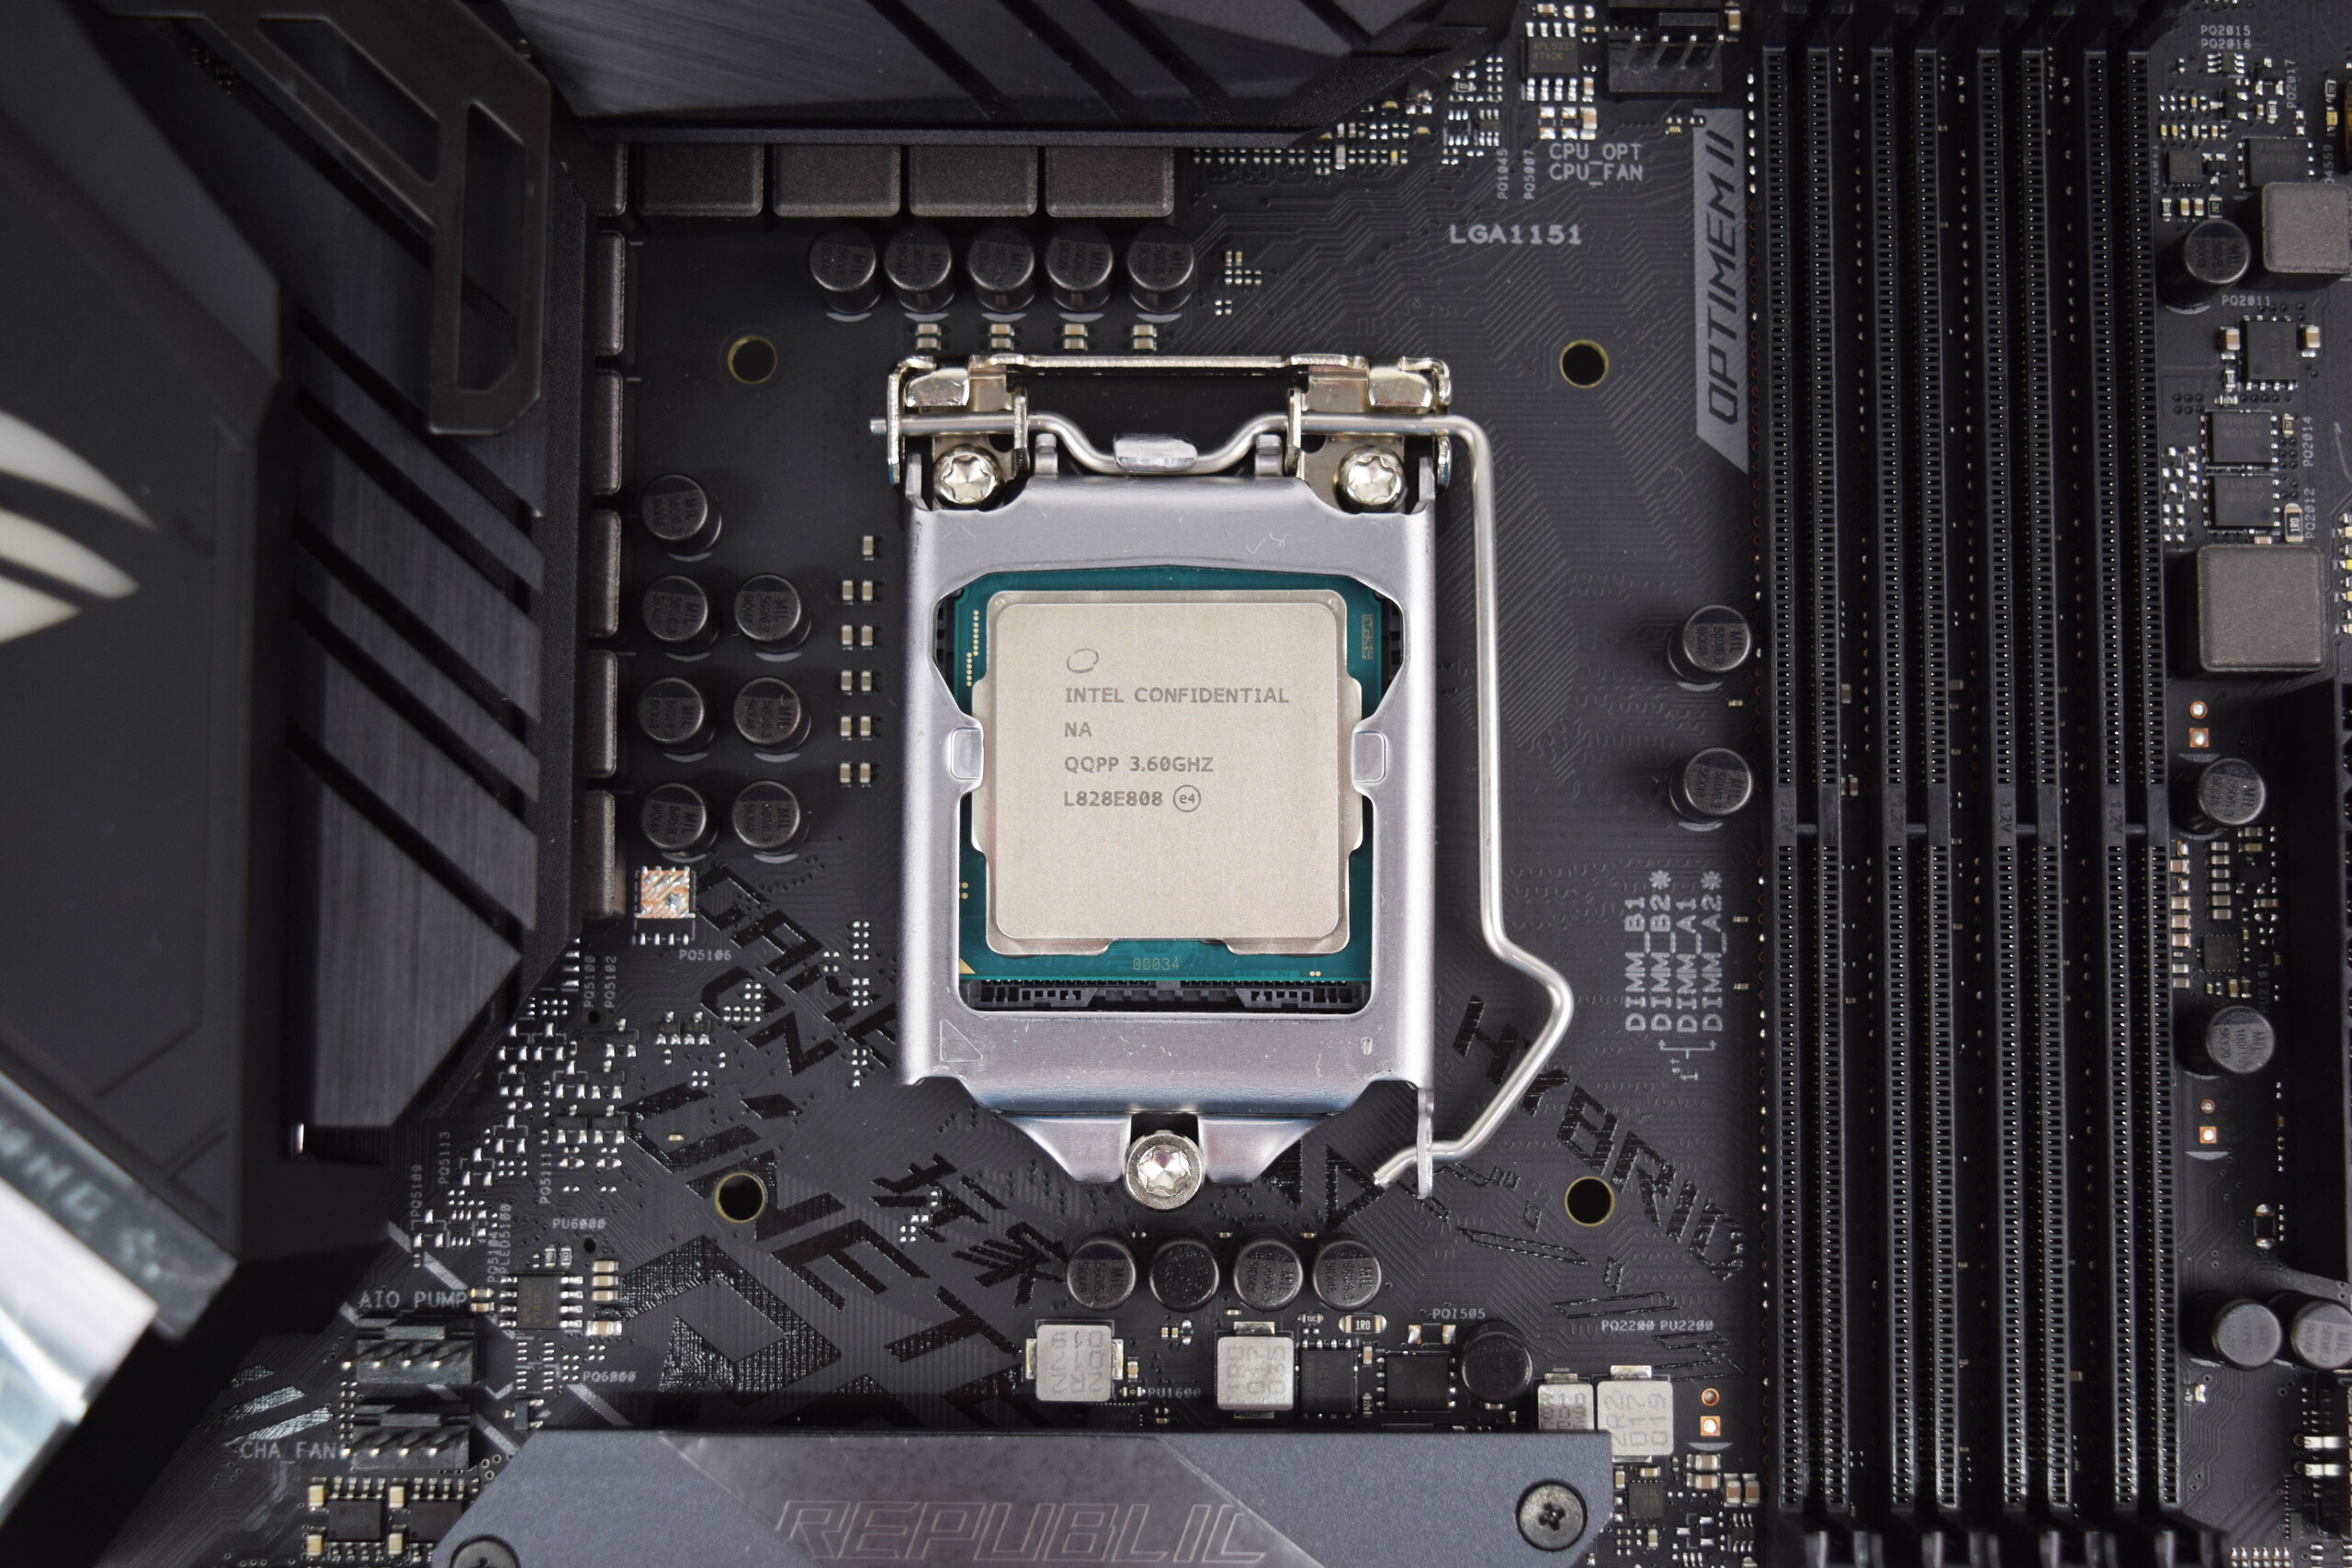
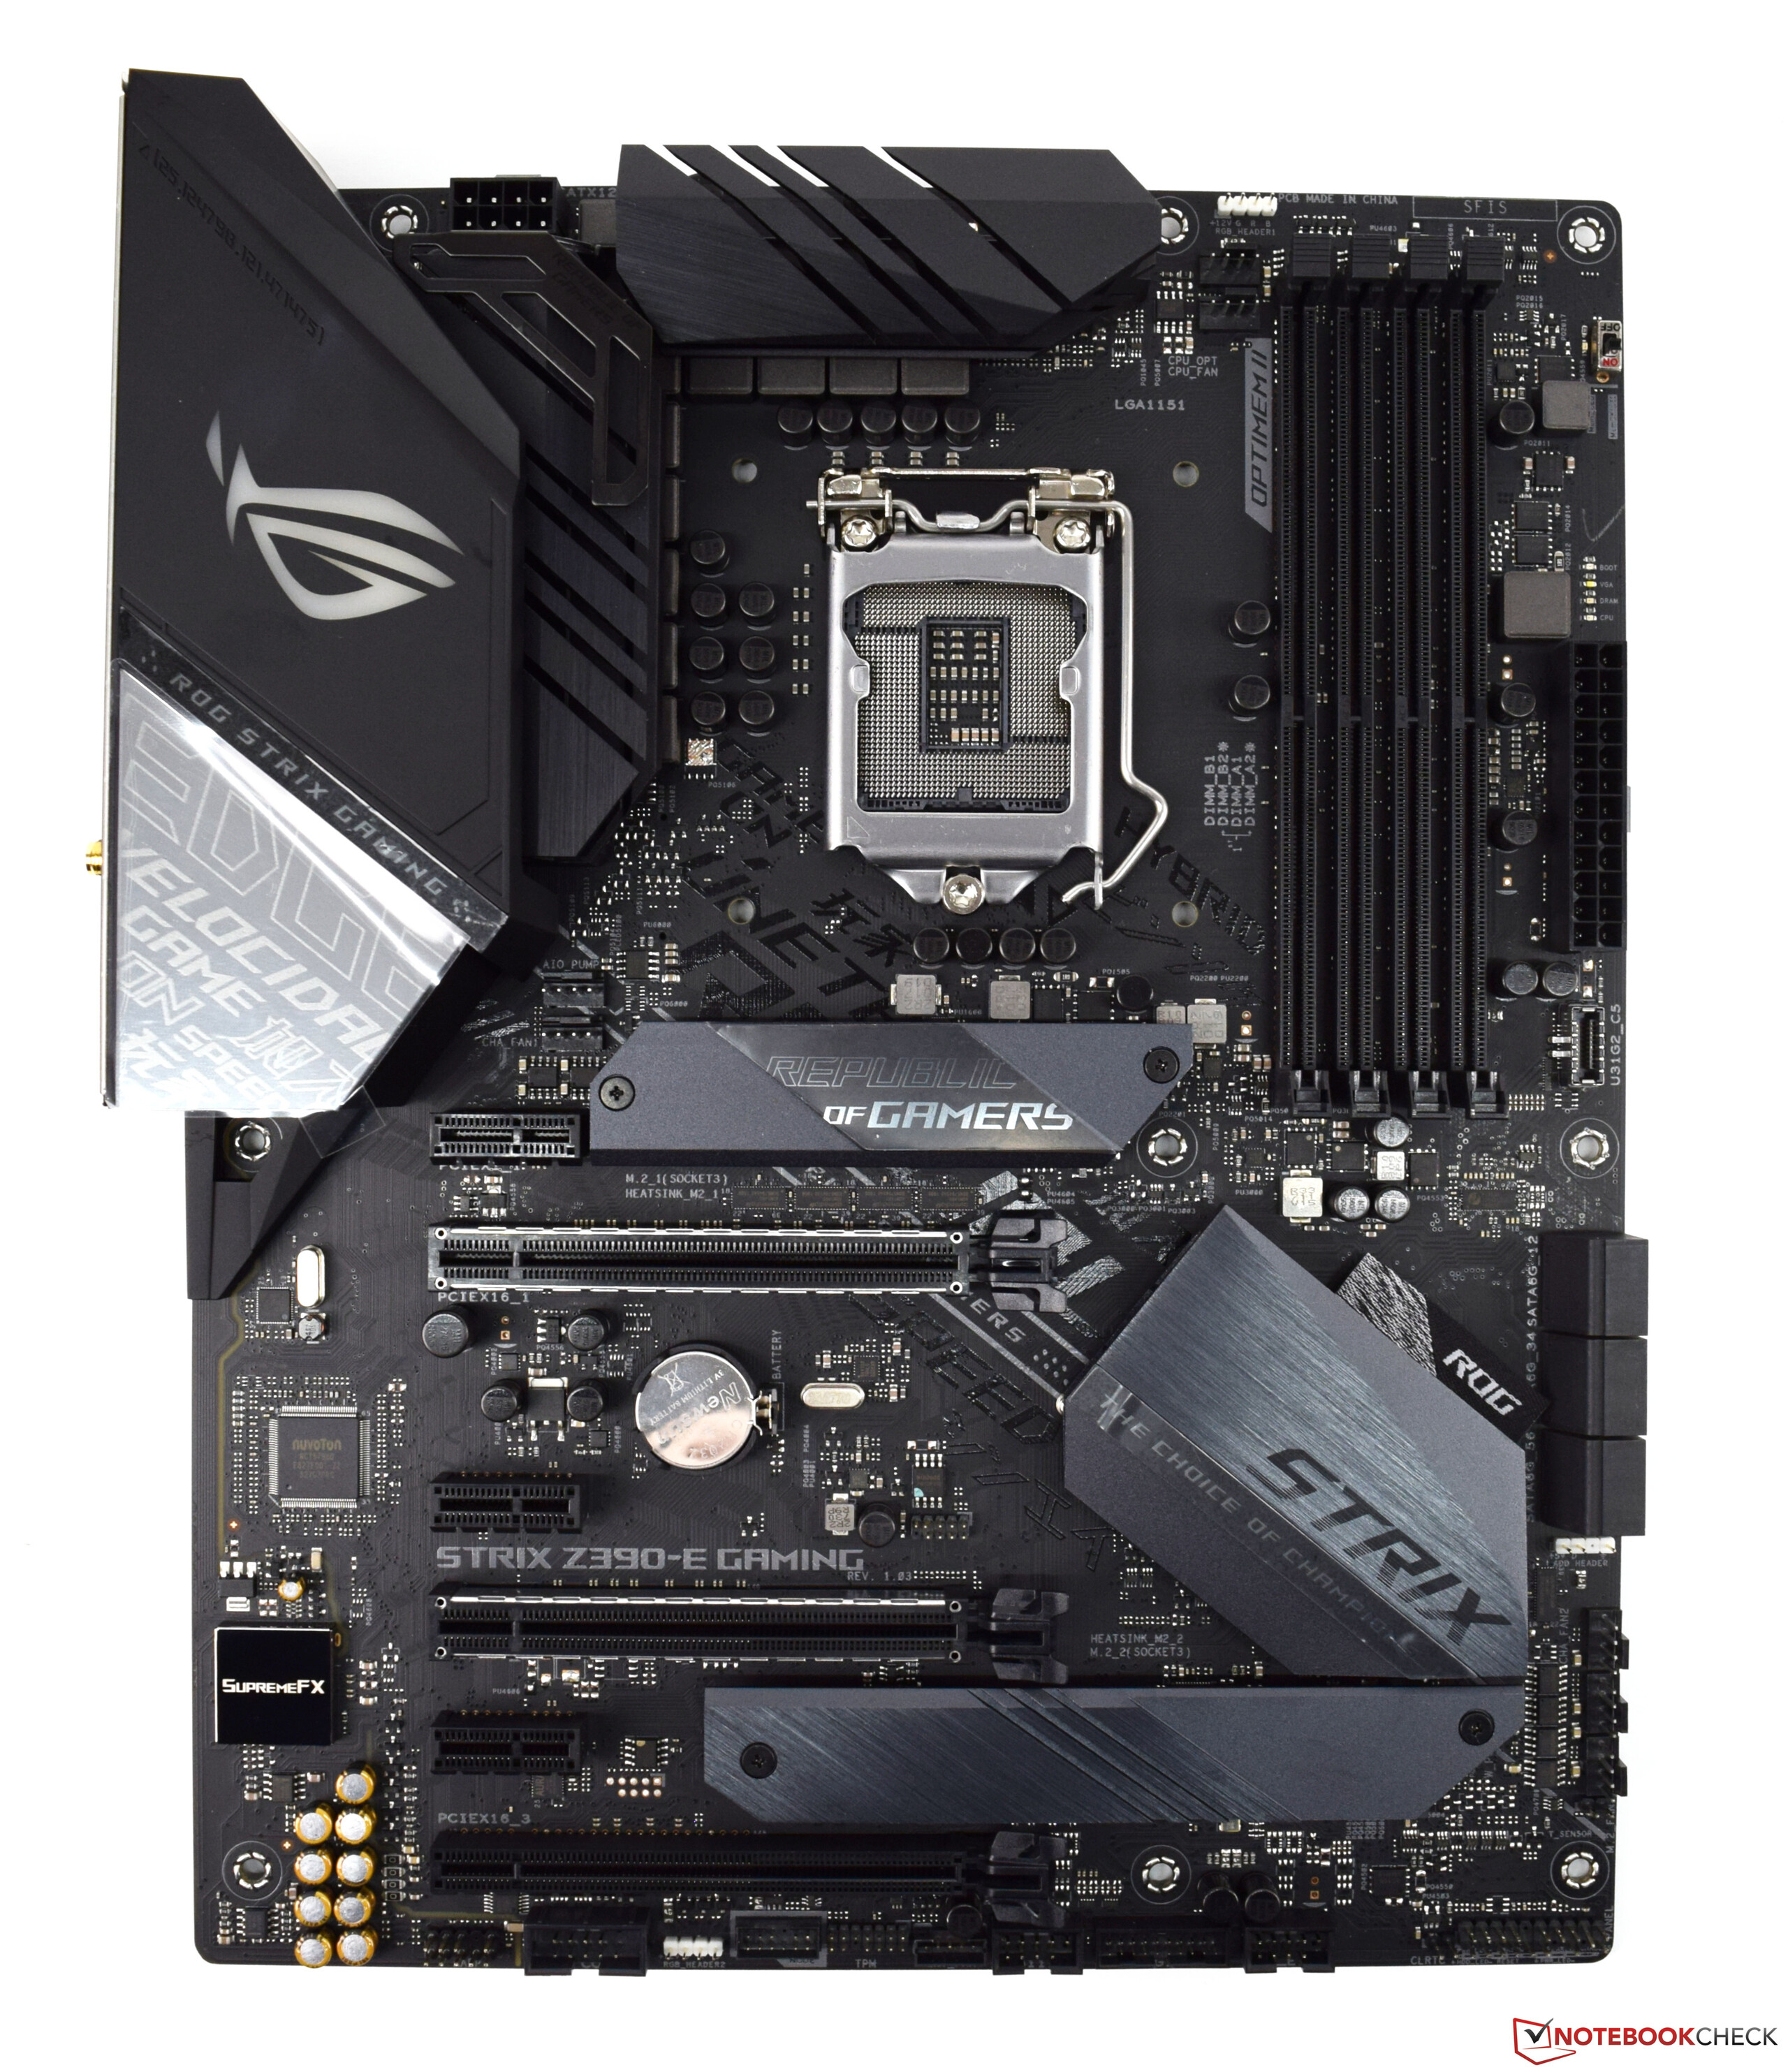
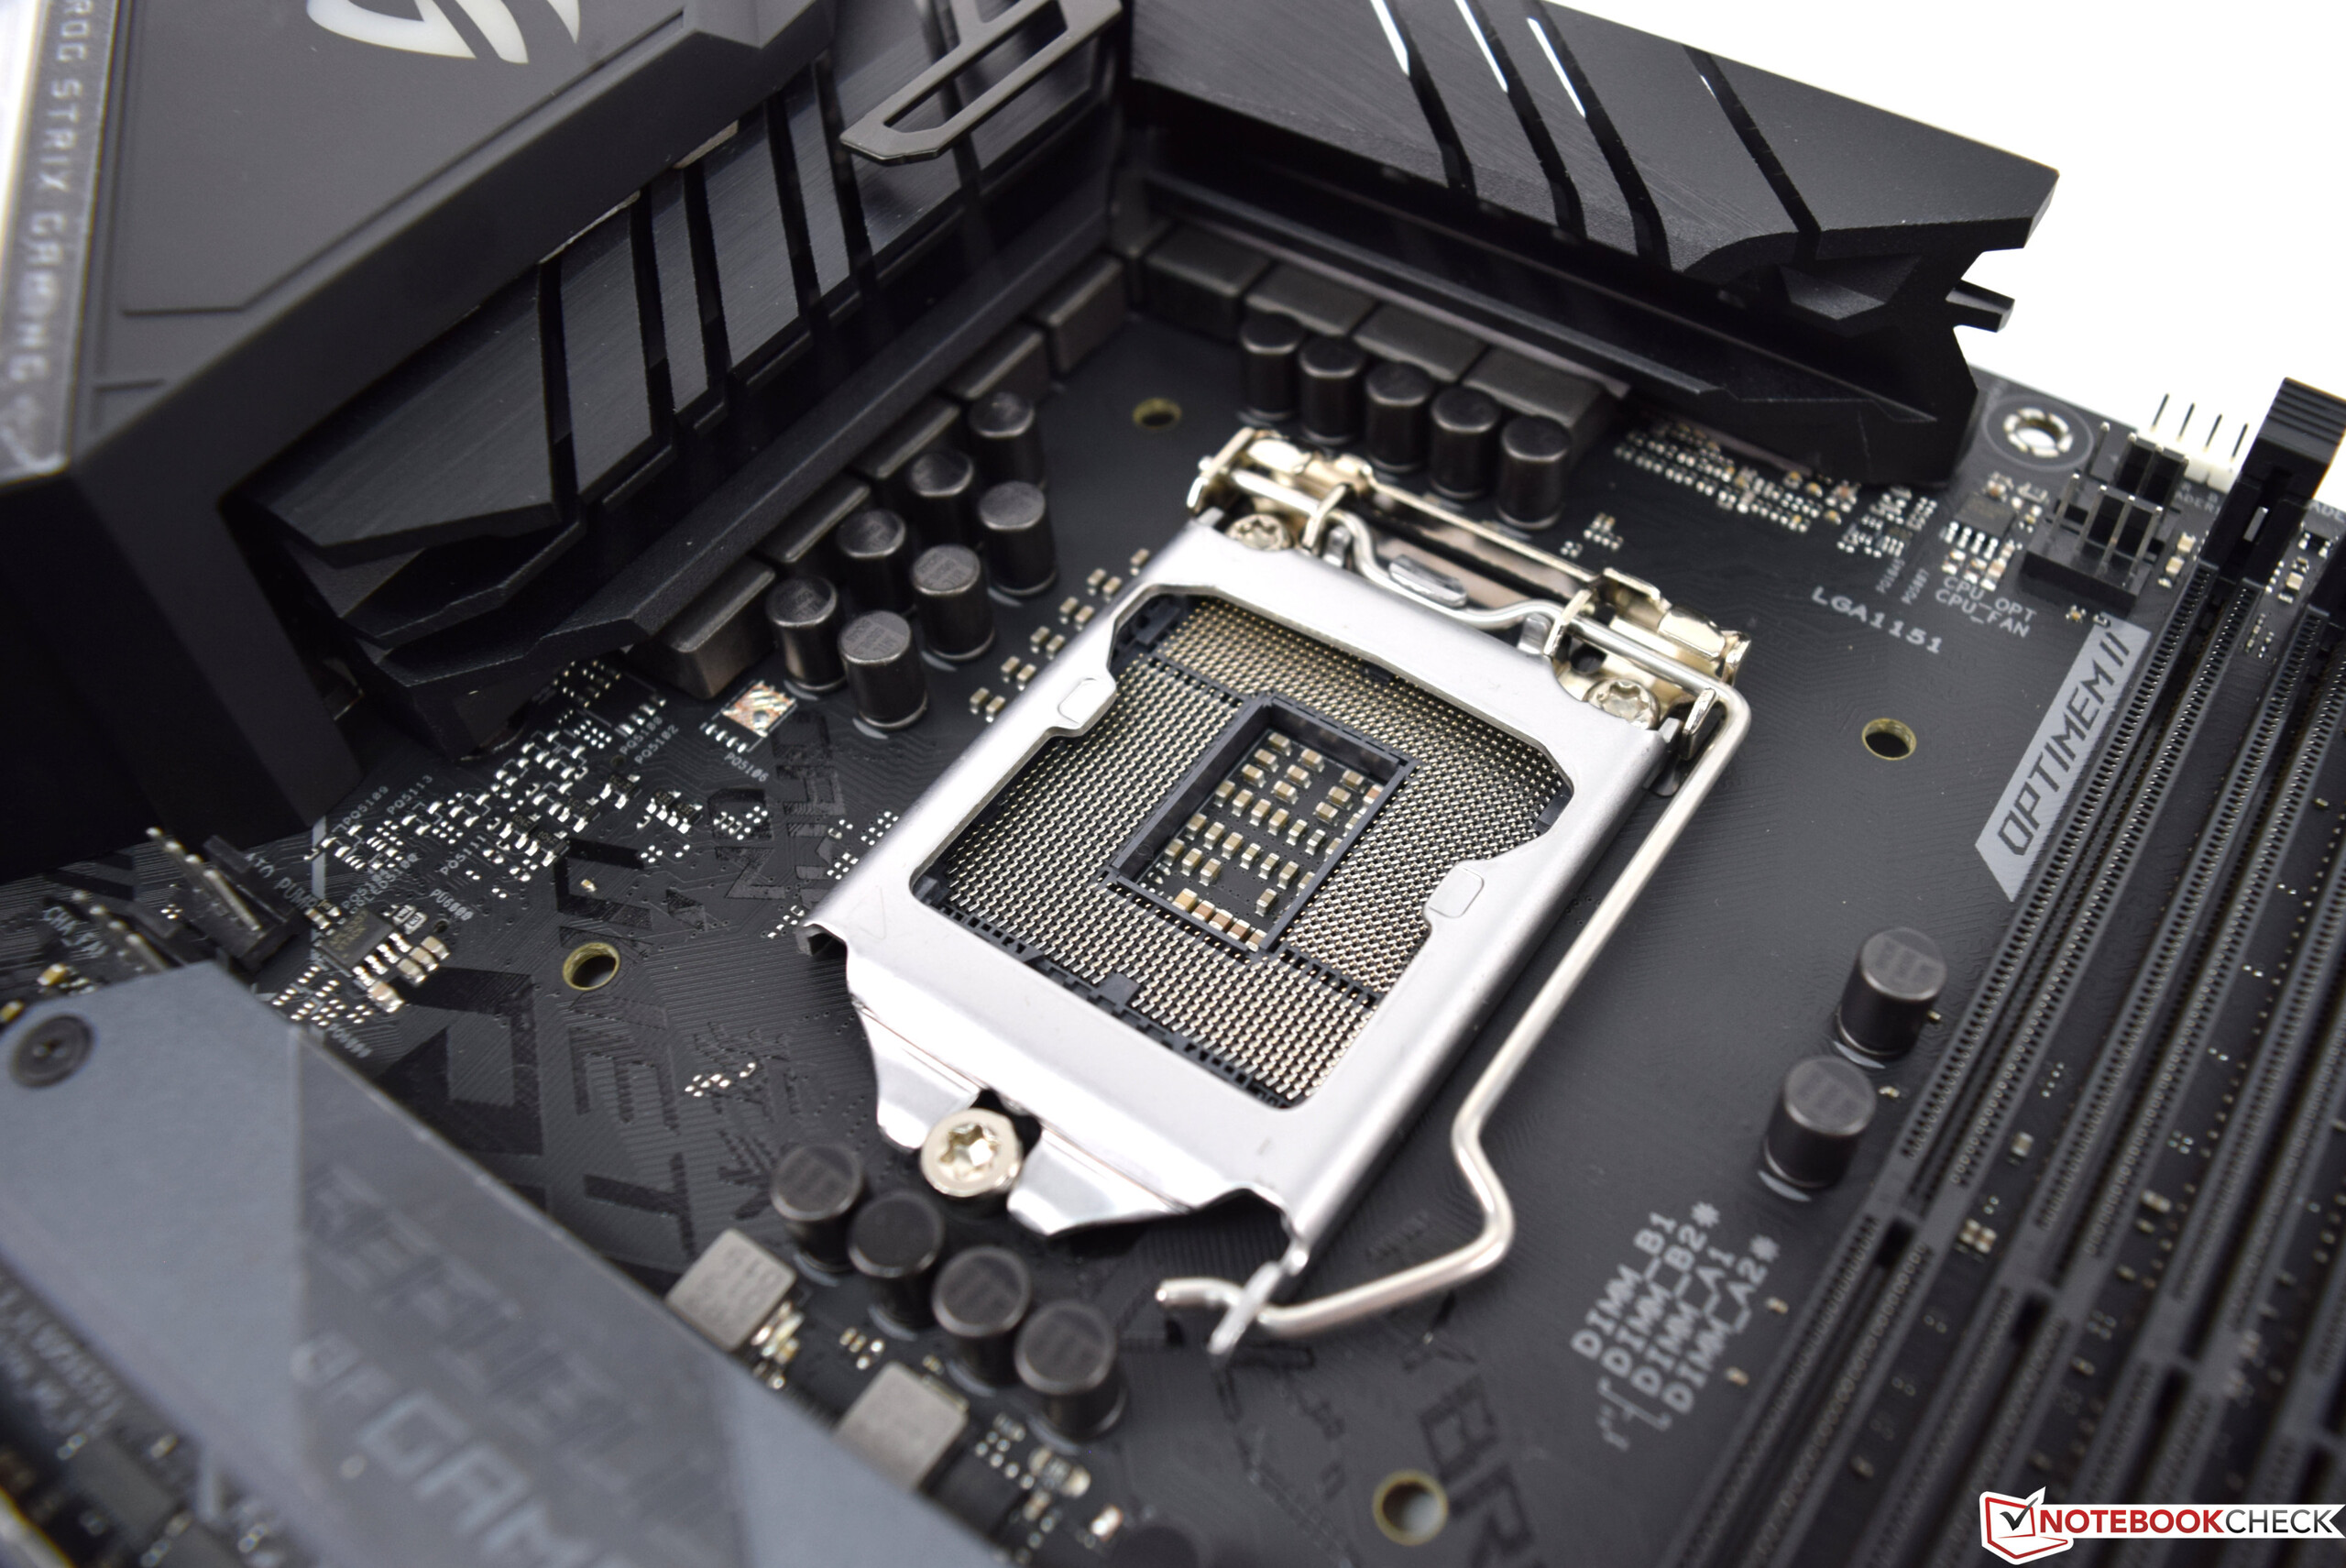
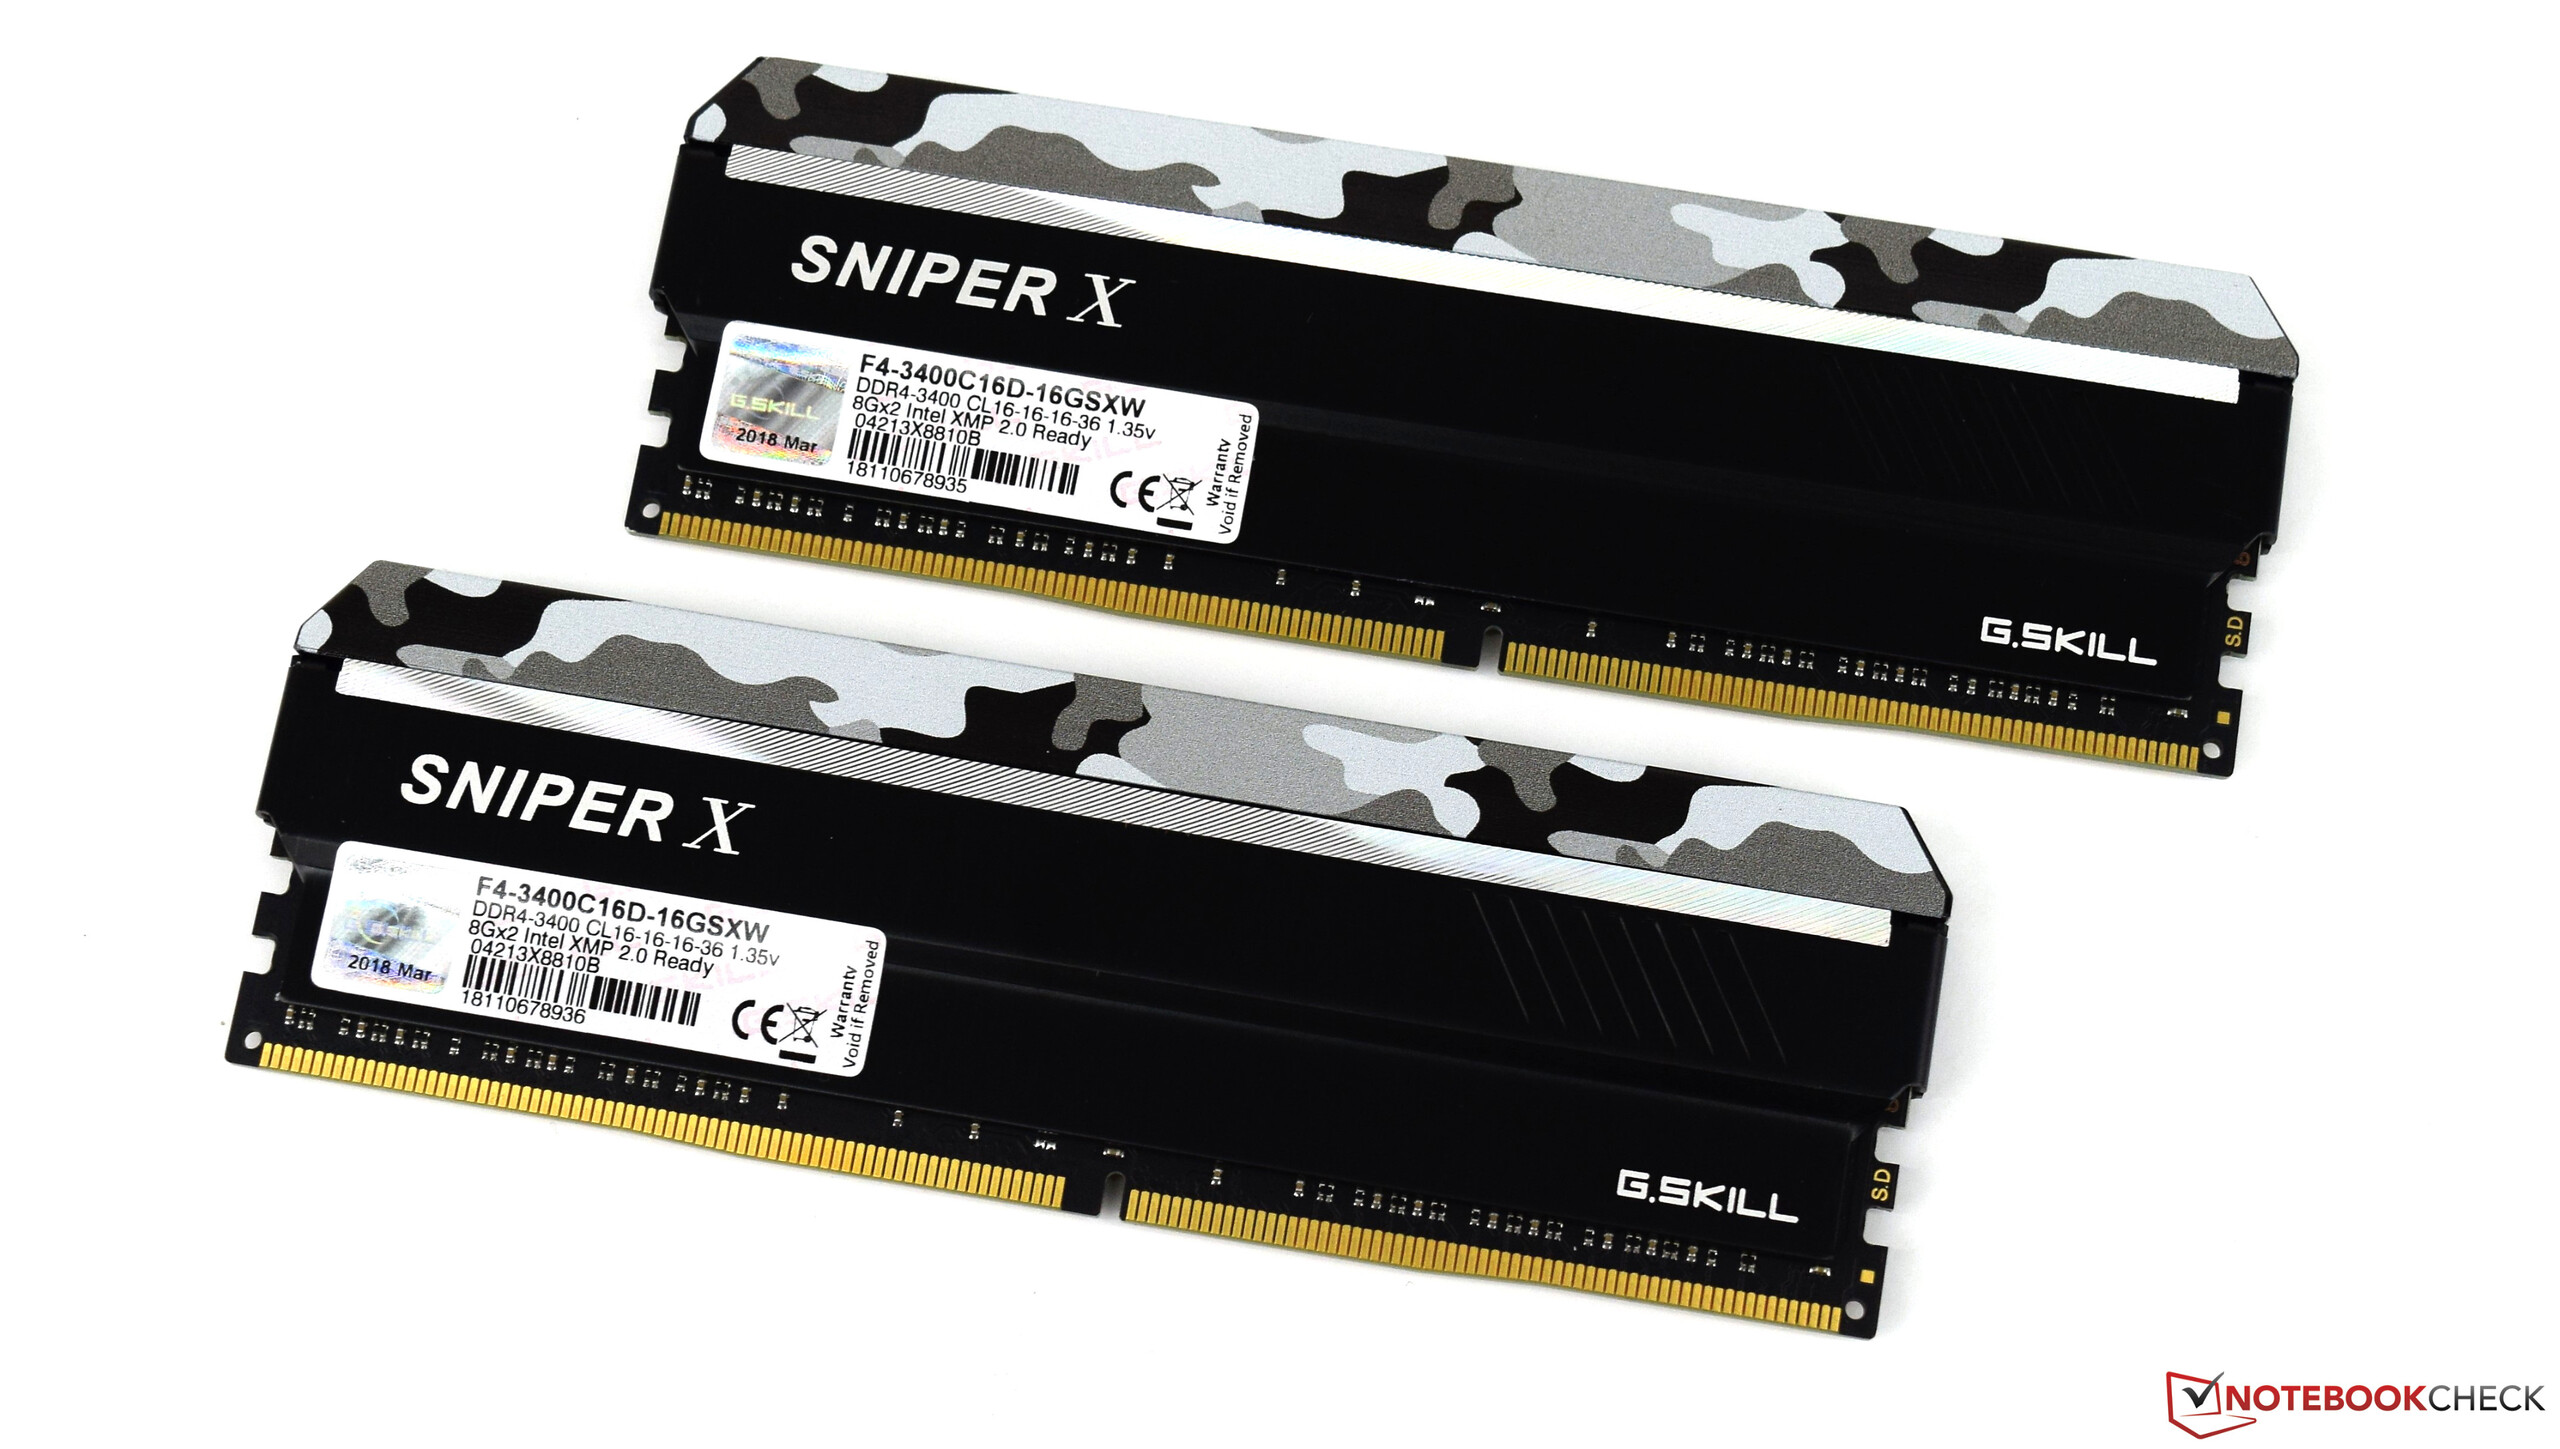
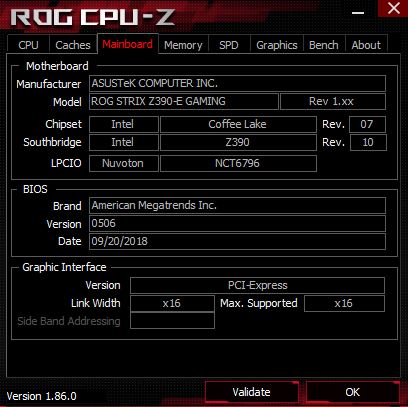
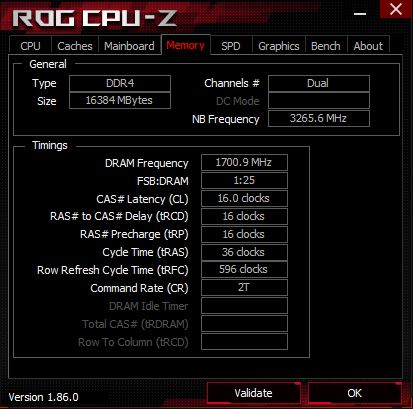
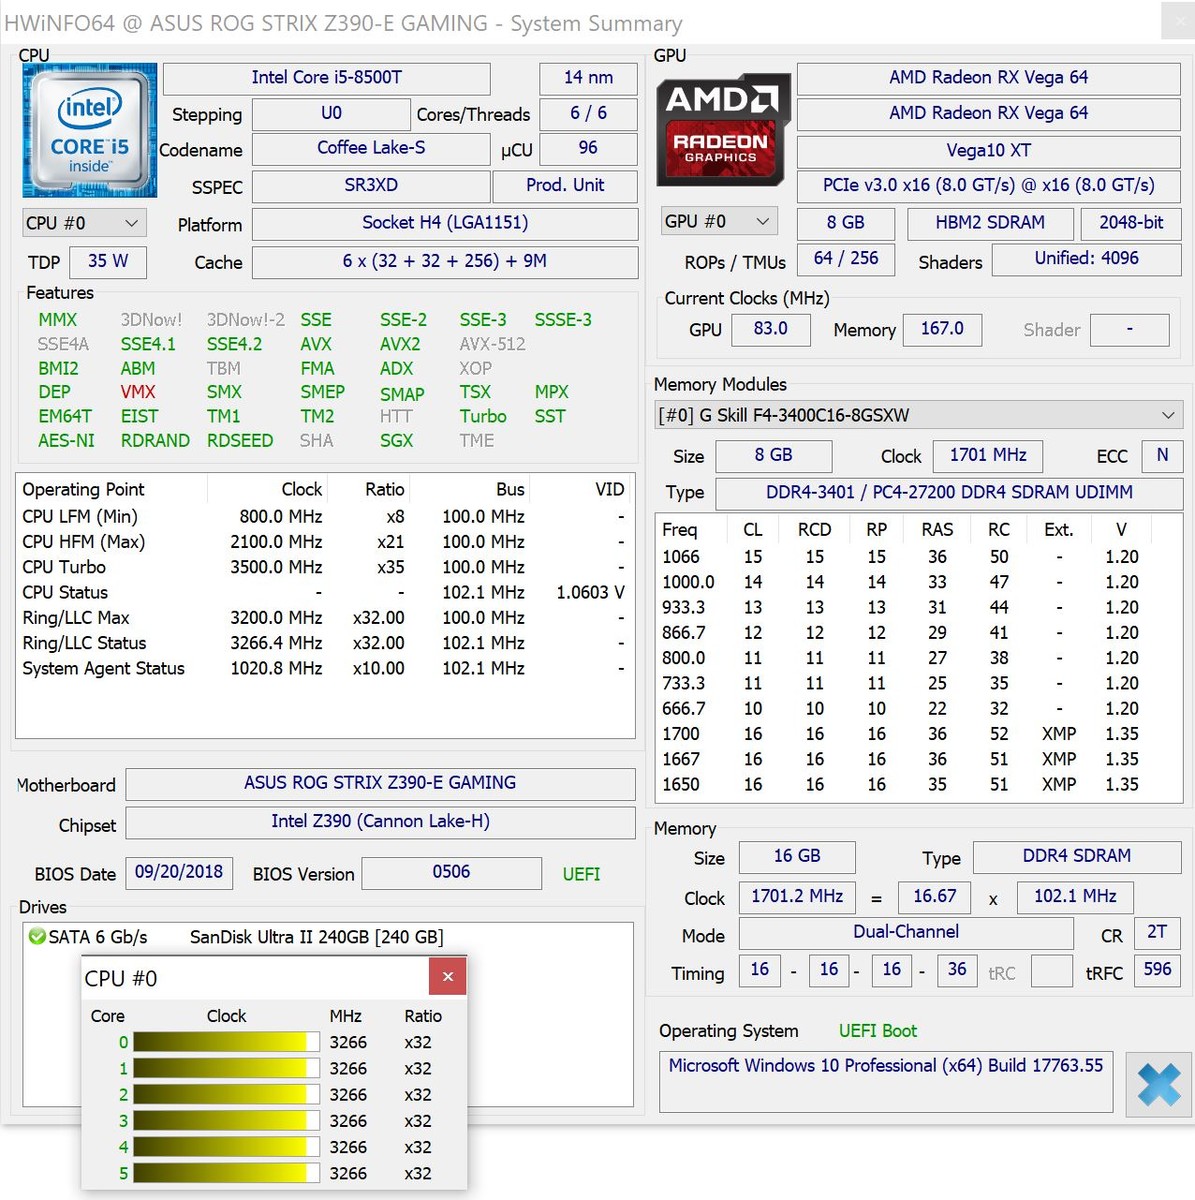
We chose to use an ASUS ROG Strix Z390-E gaming motherboard and 16 GB of G-Skill DDR4 RAM for our test system. The RAM clocks at 3,400 MHz, which we set to an XMP profile in the BIOS. We left everything else in the BIOS at factory settings. We only changed settings when we overclocked our test system.
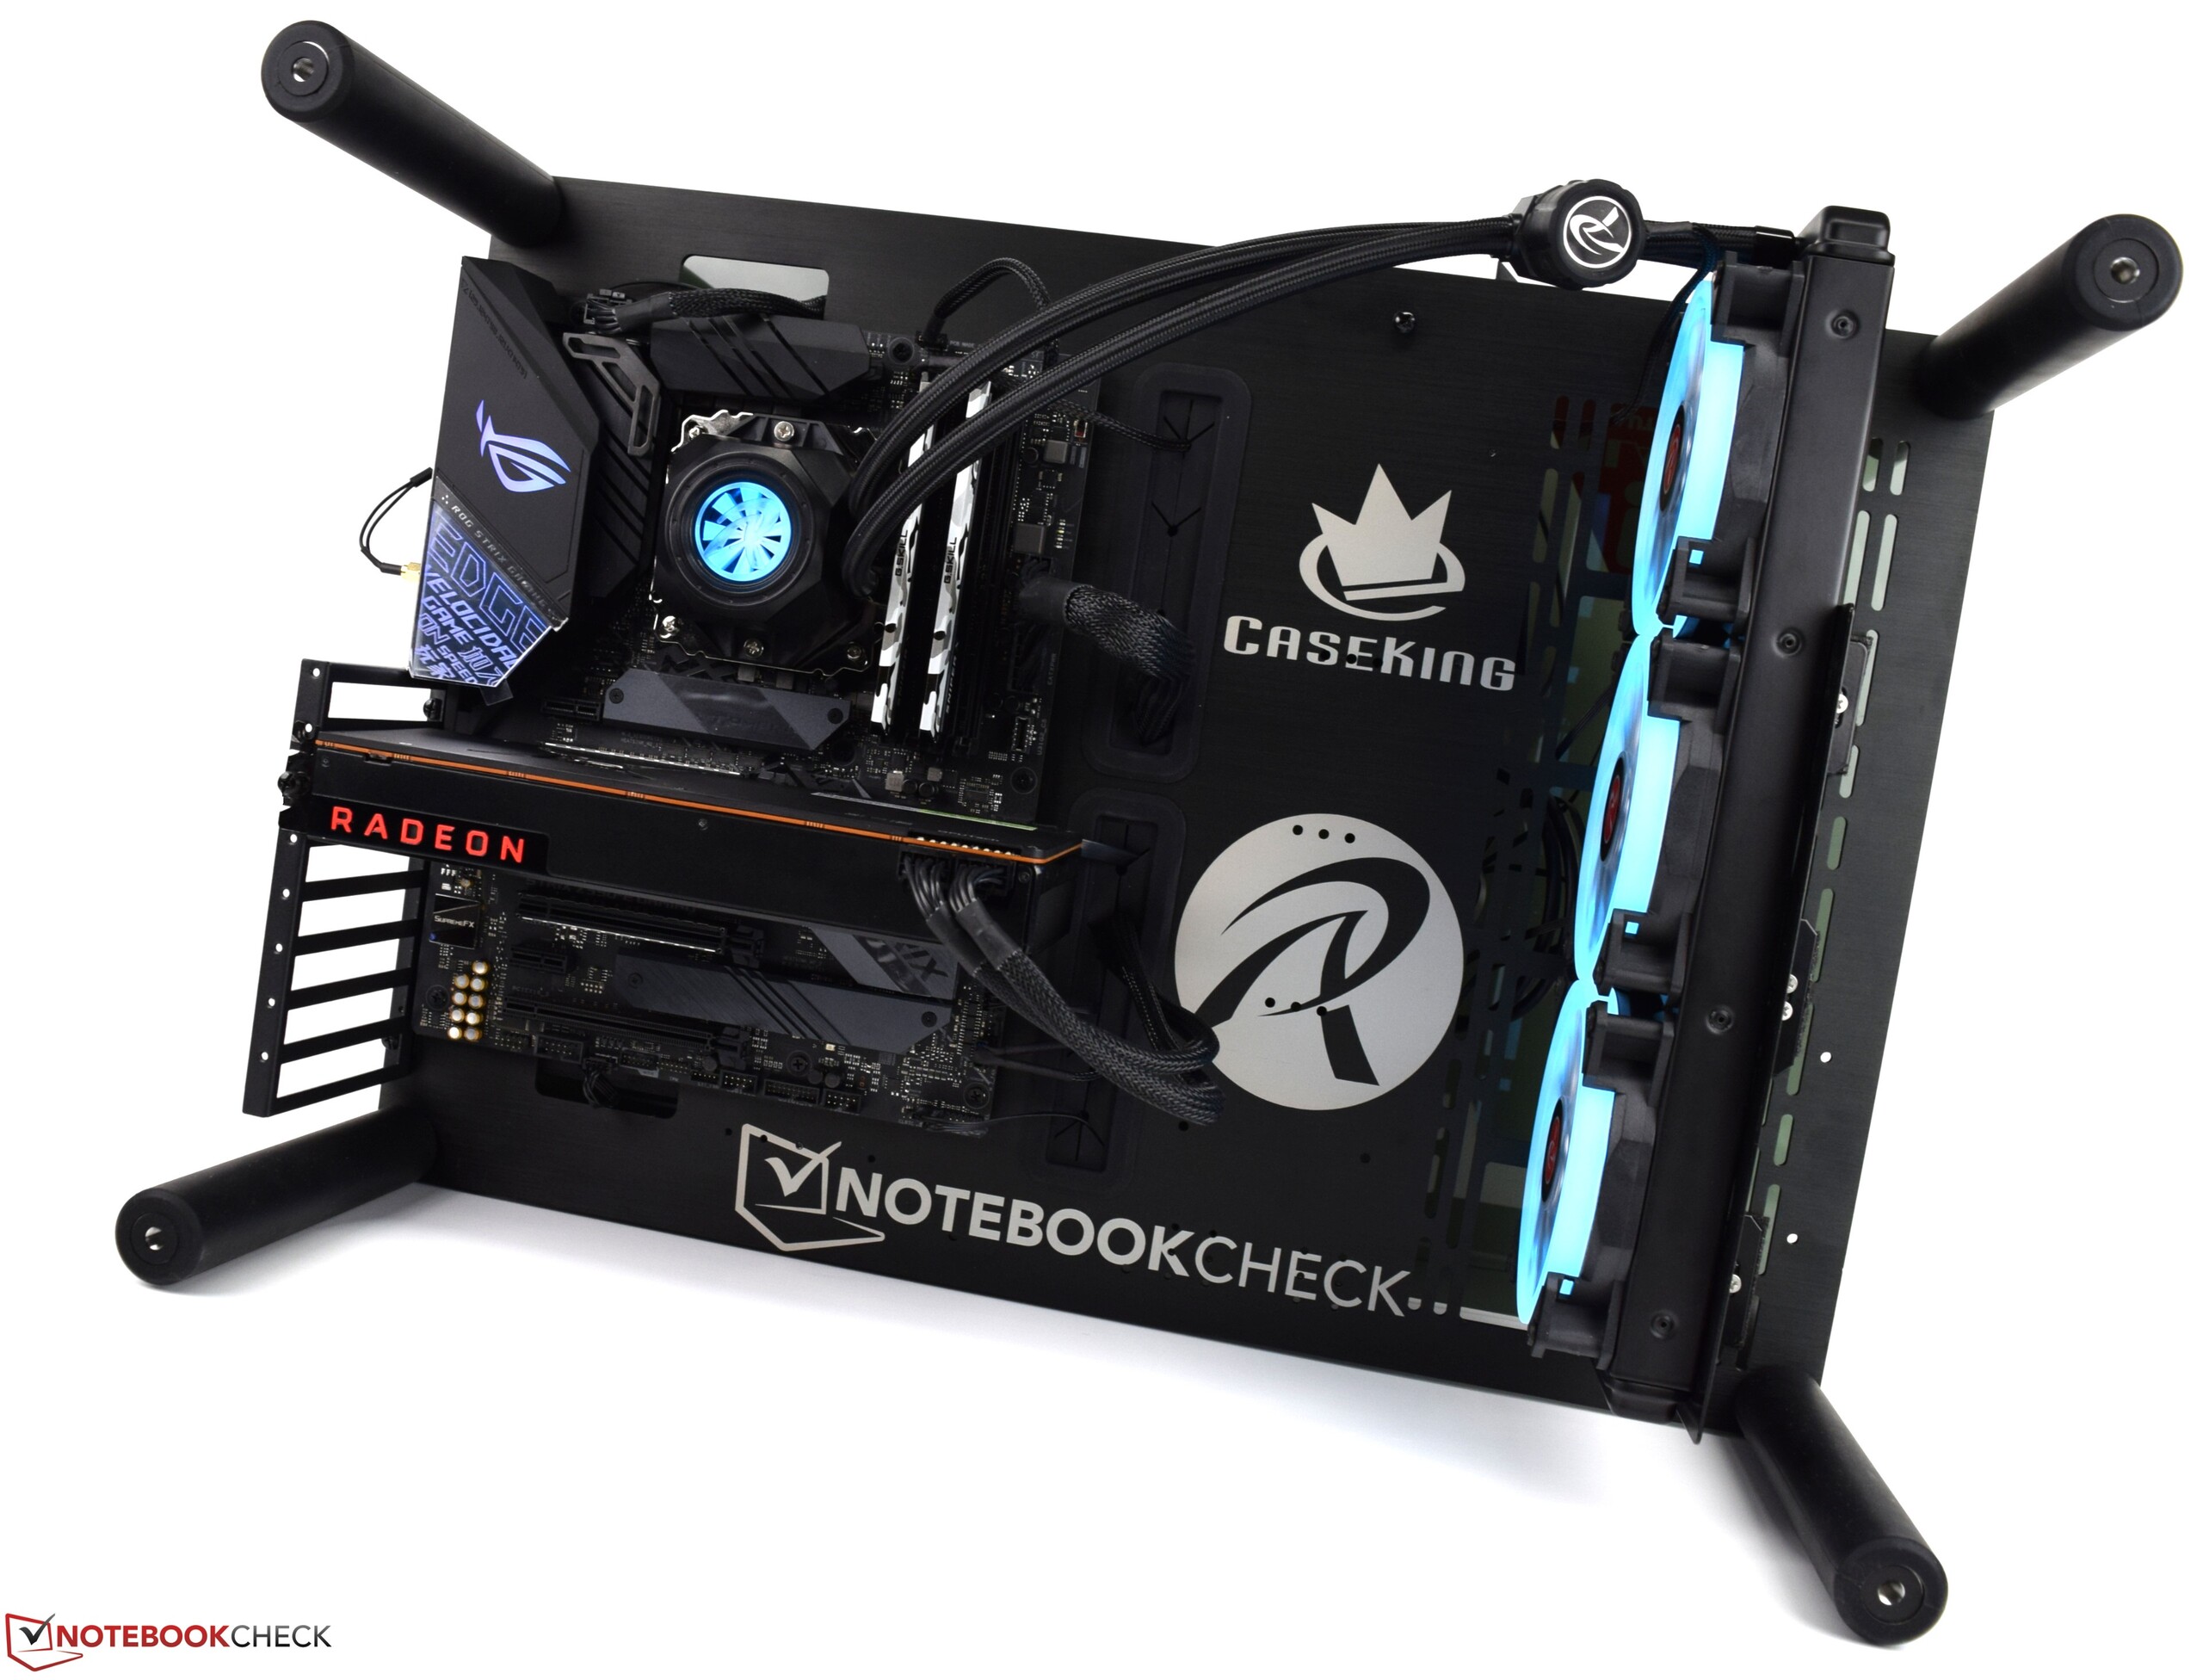
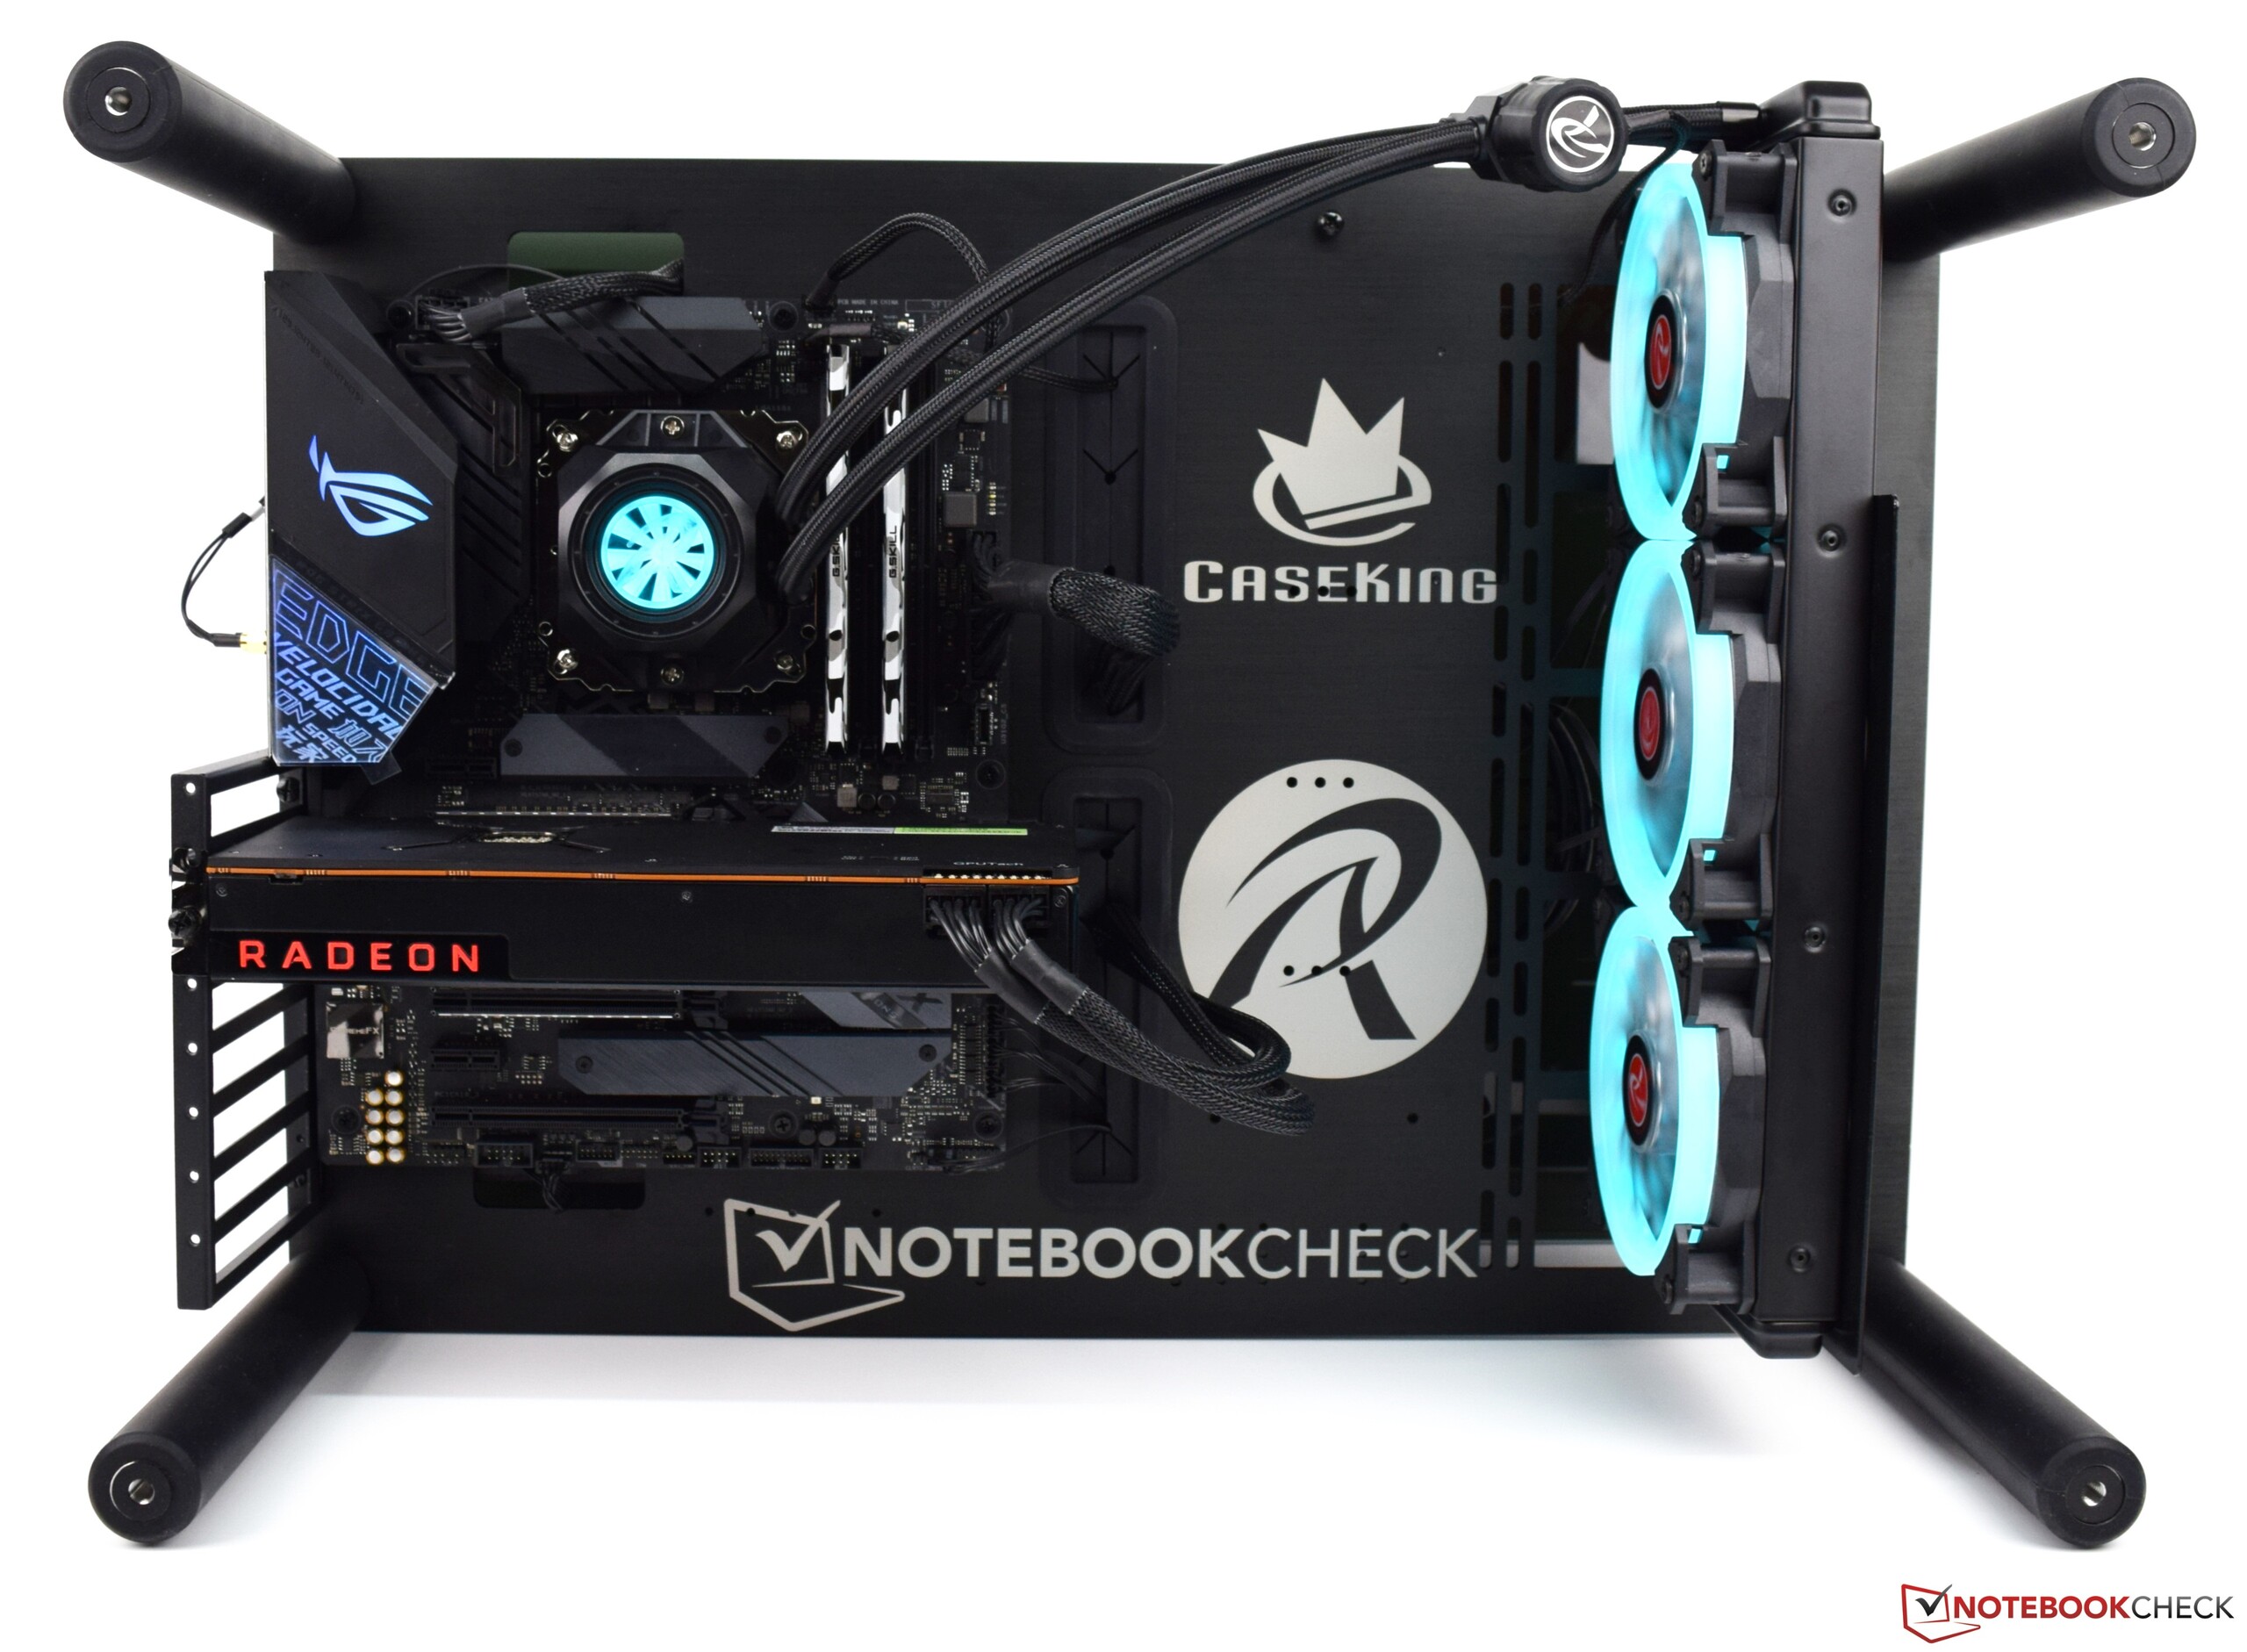
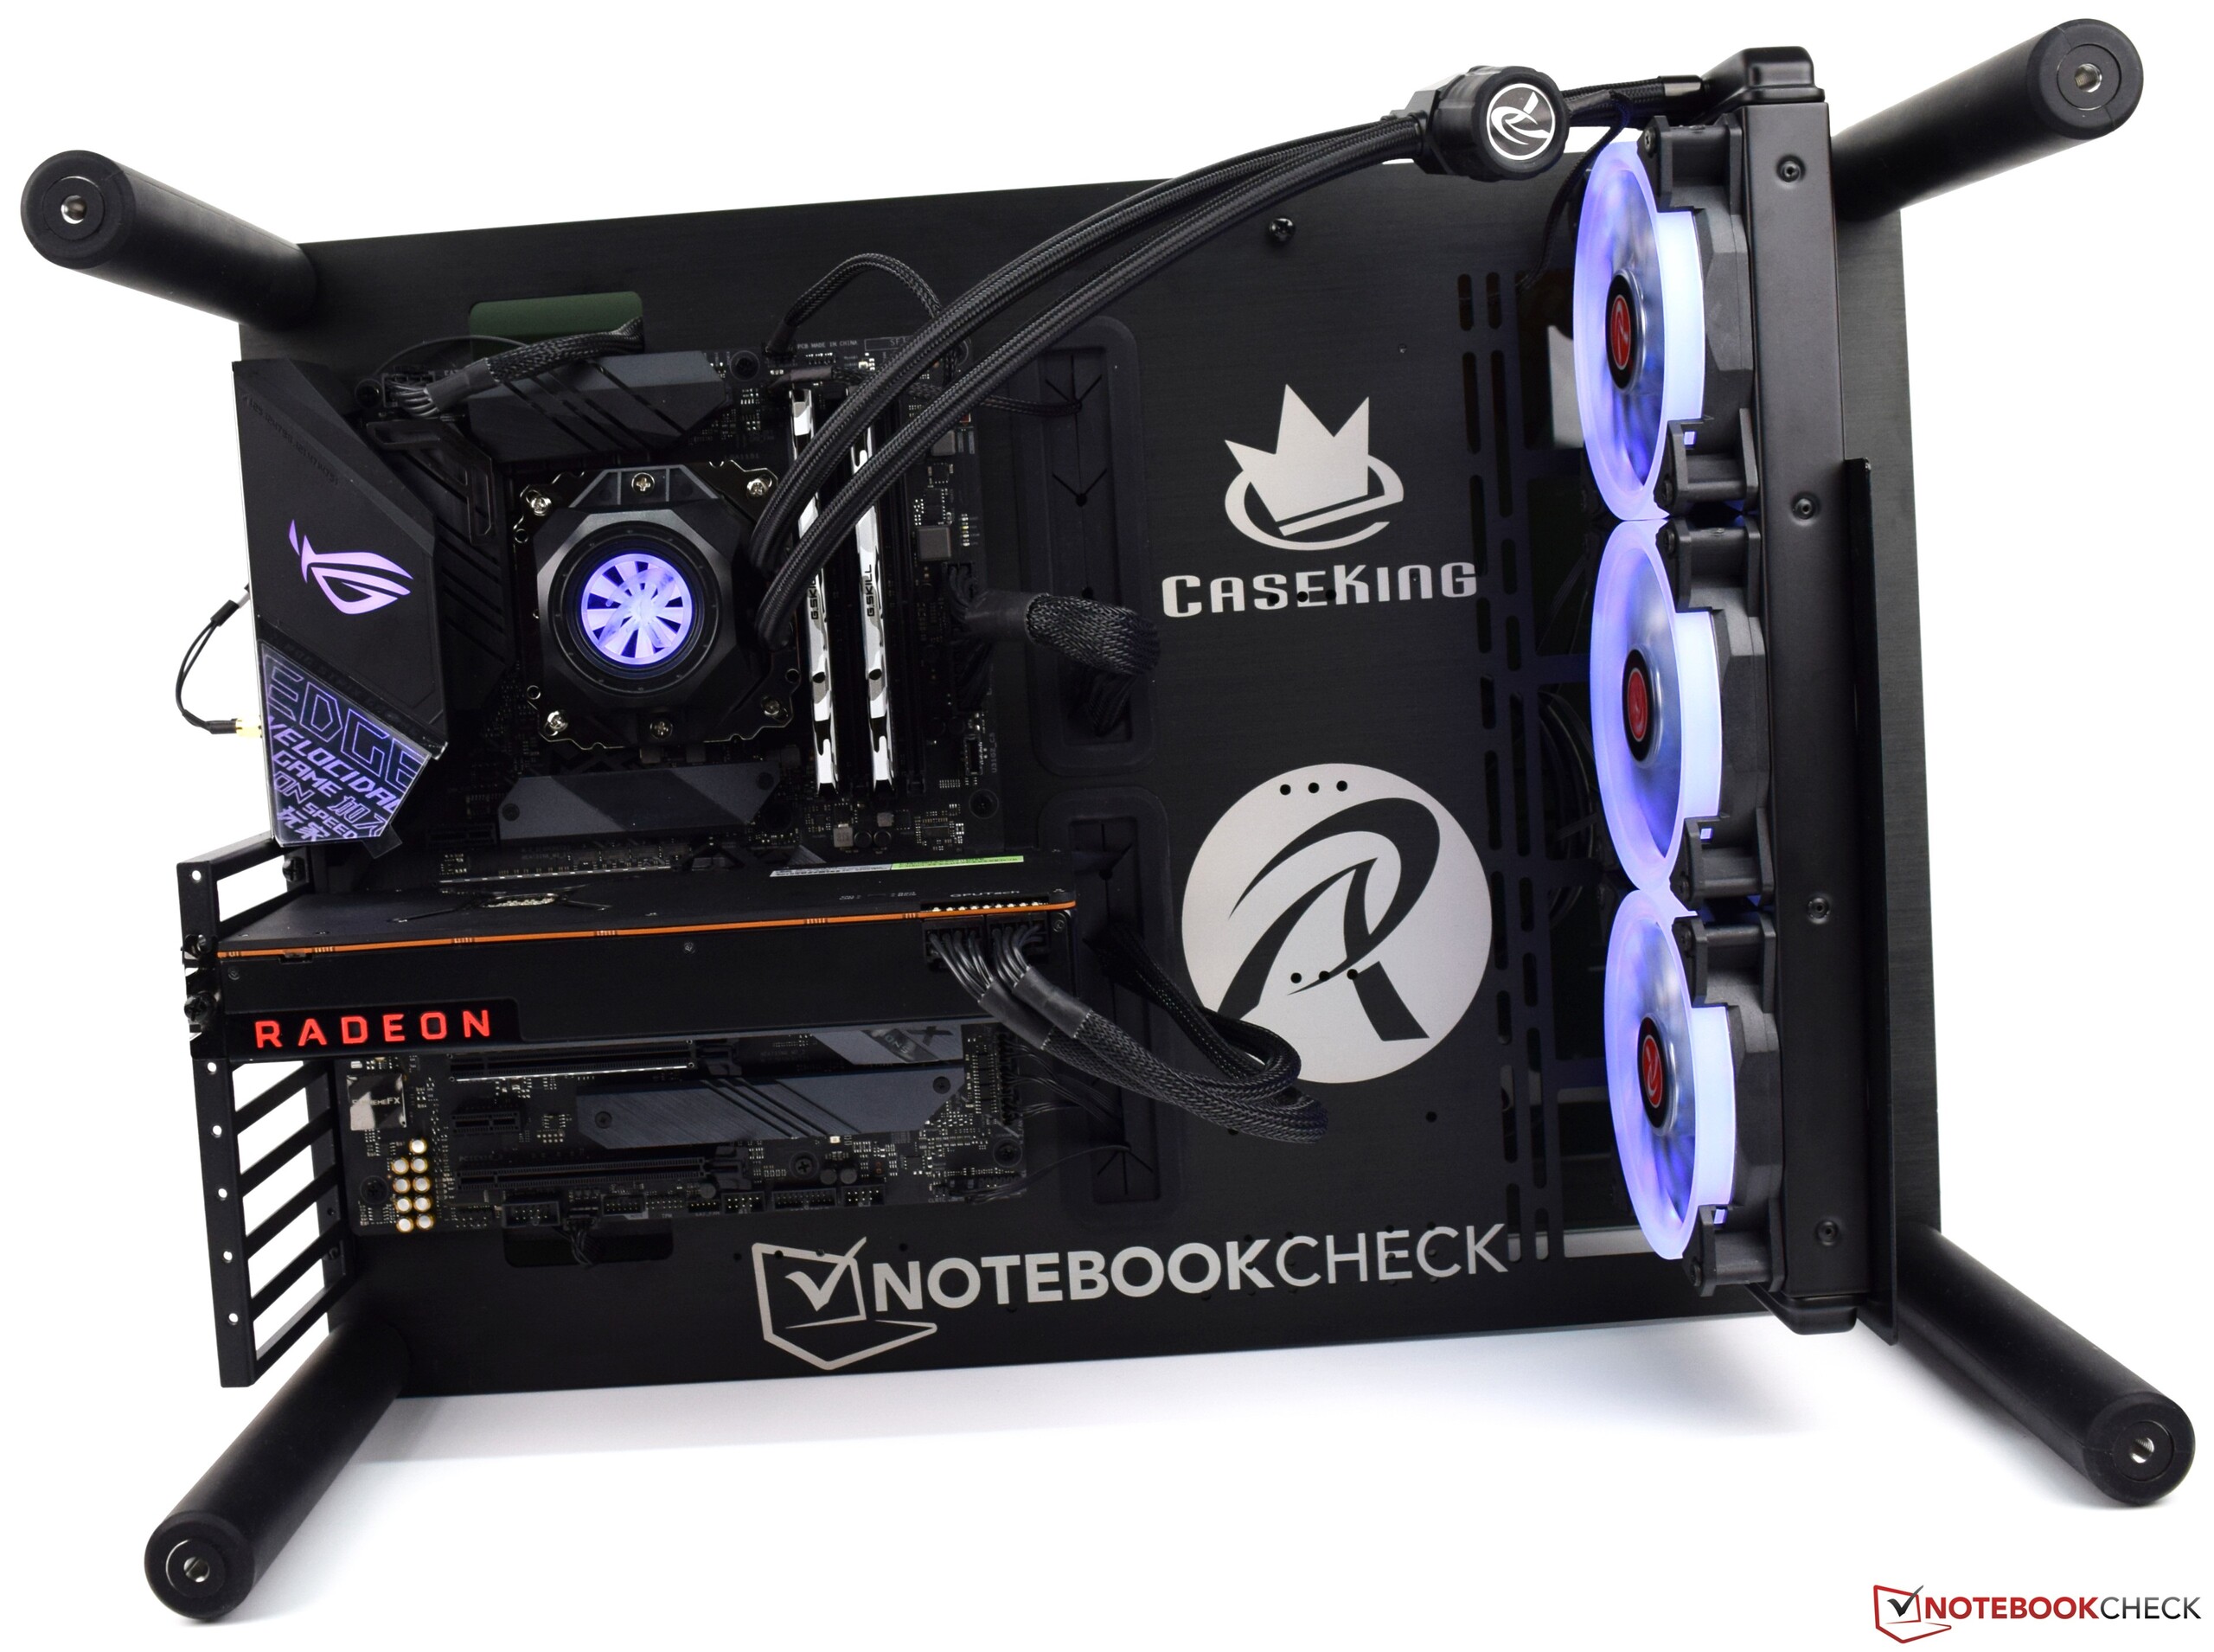
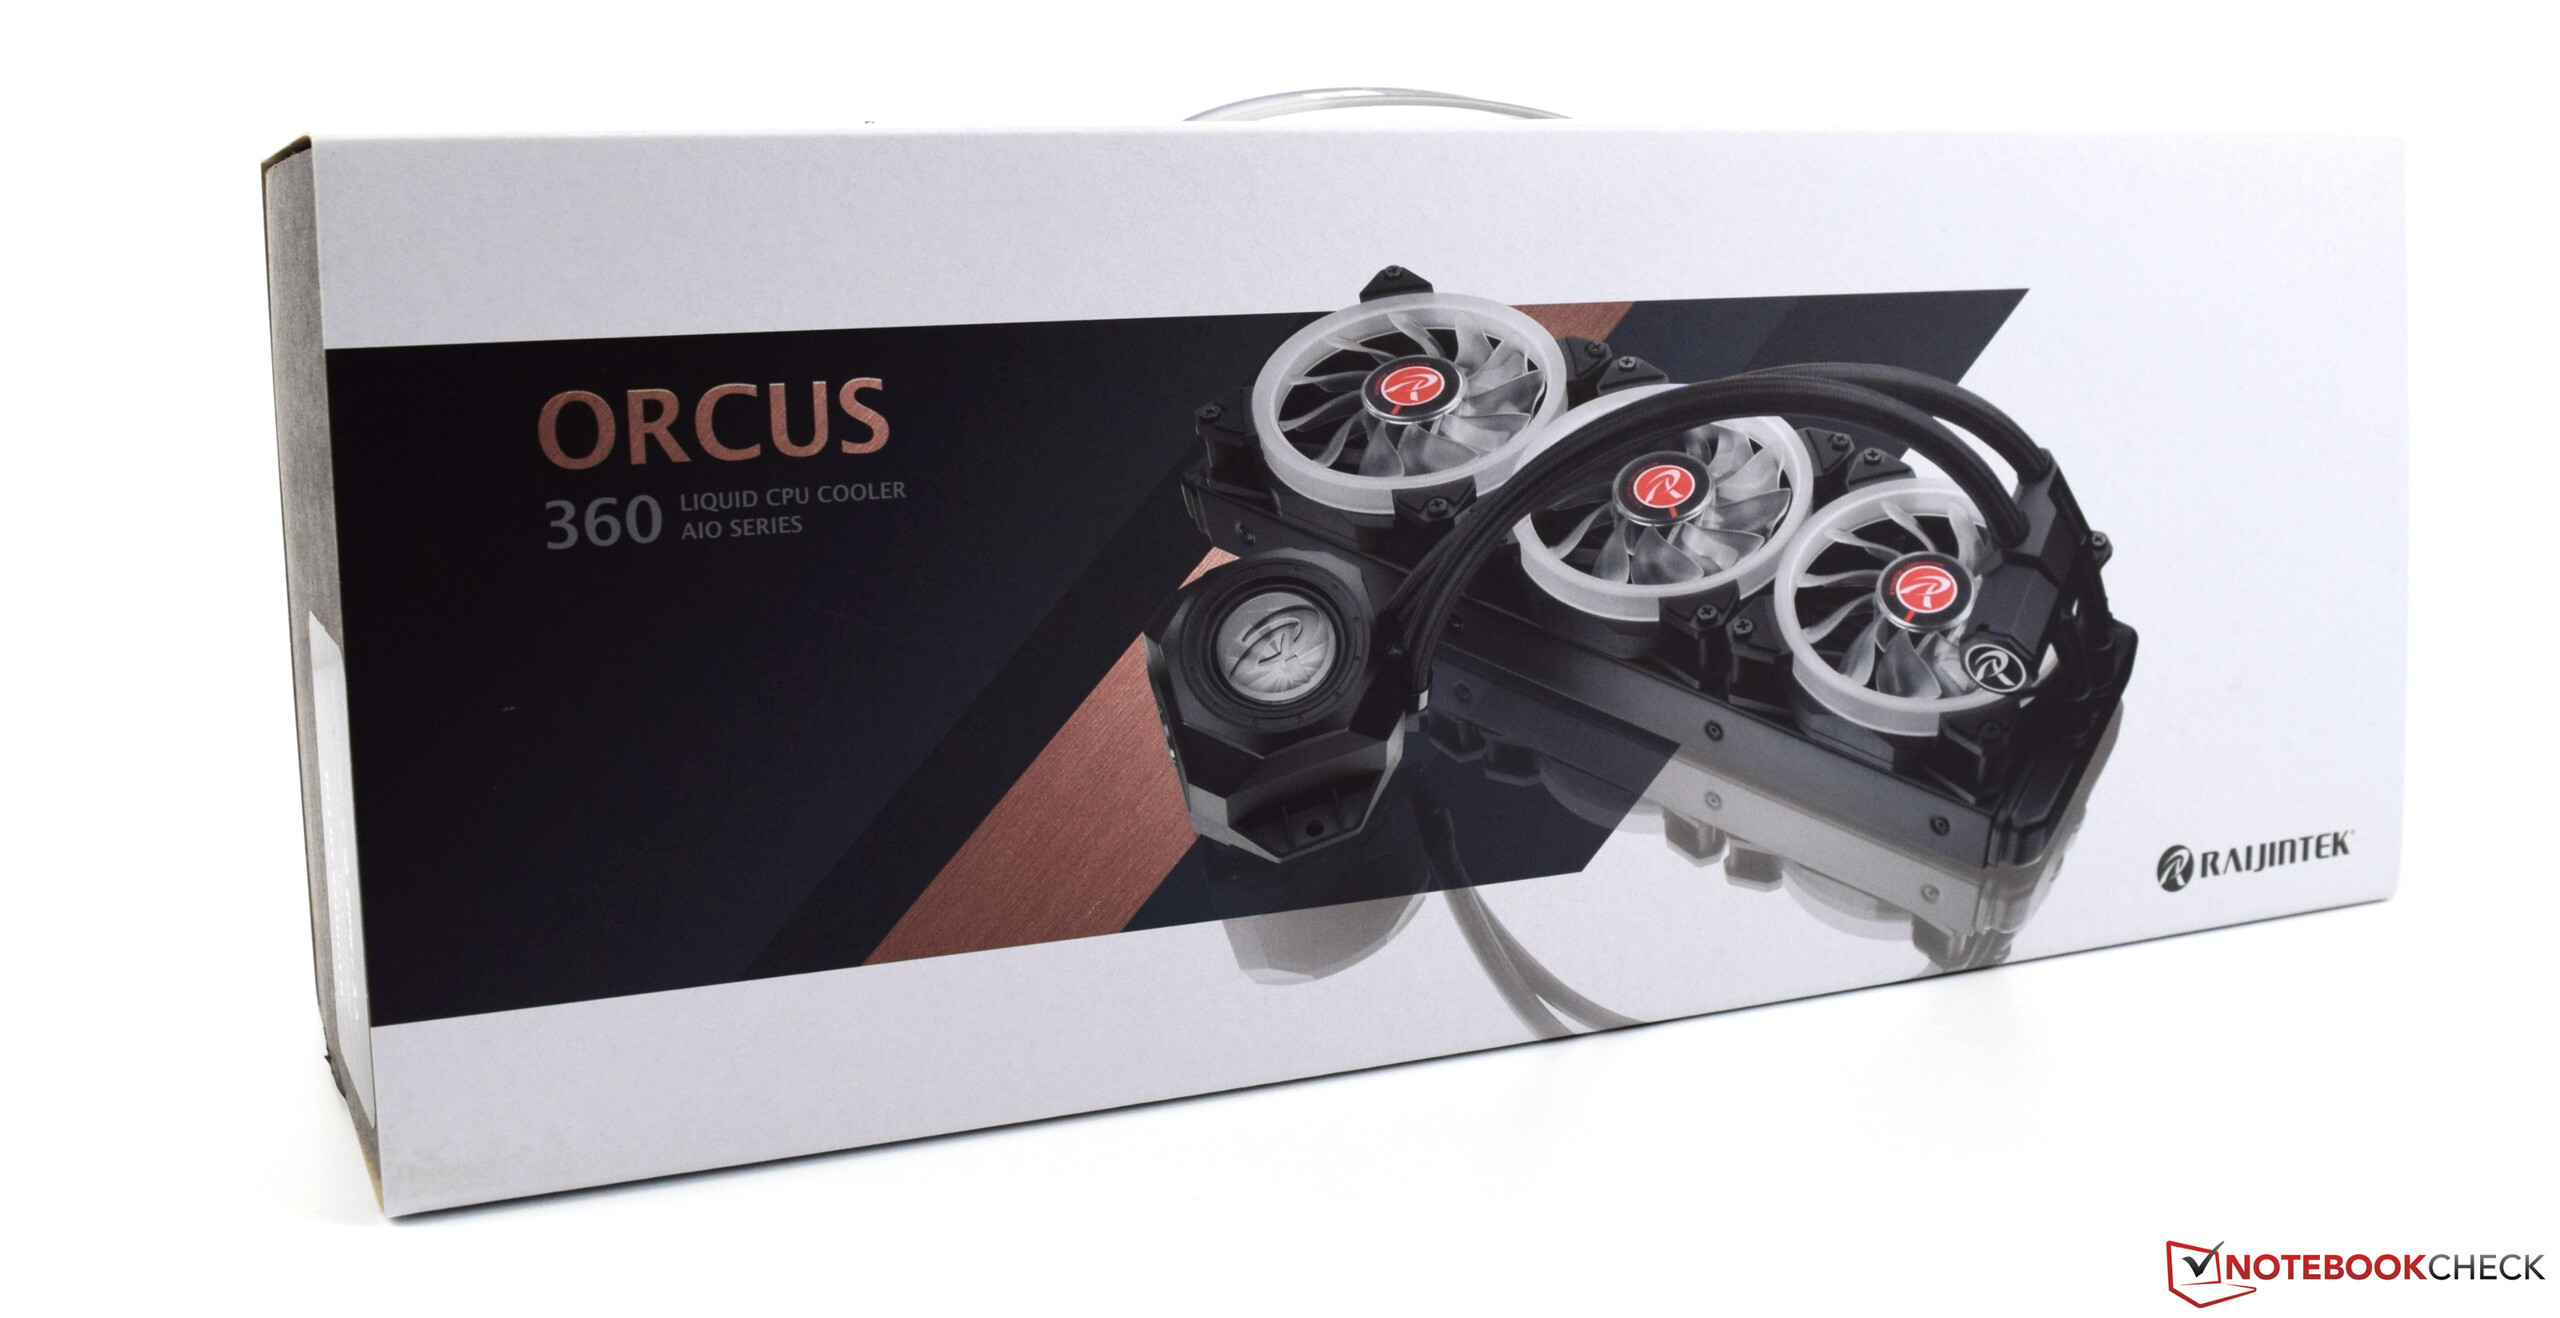
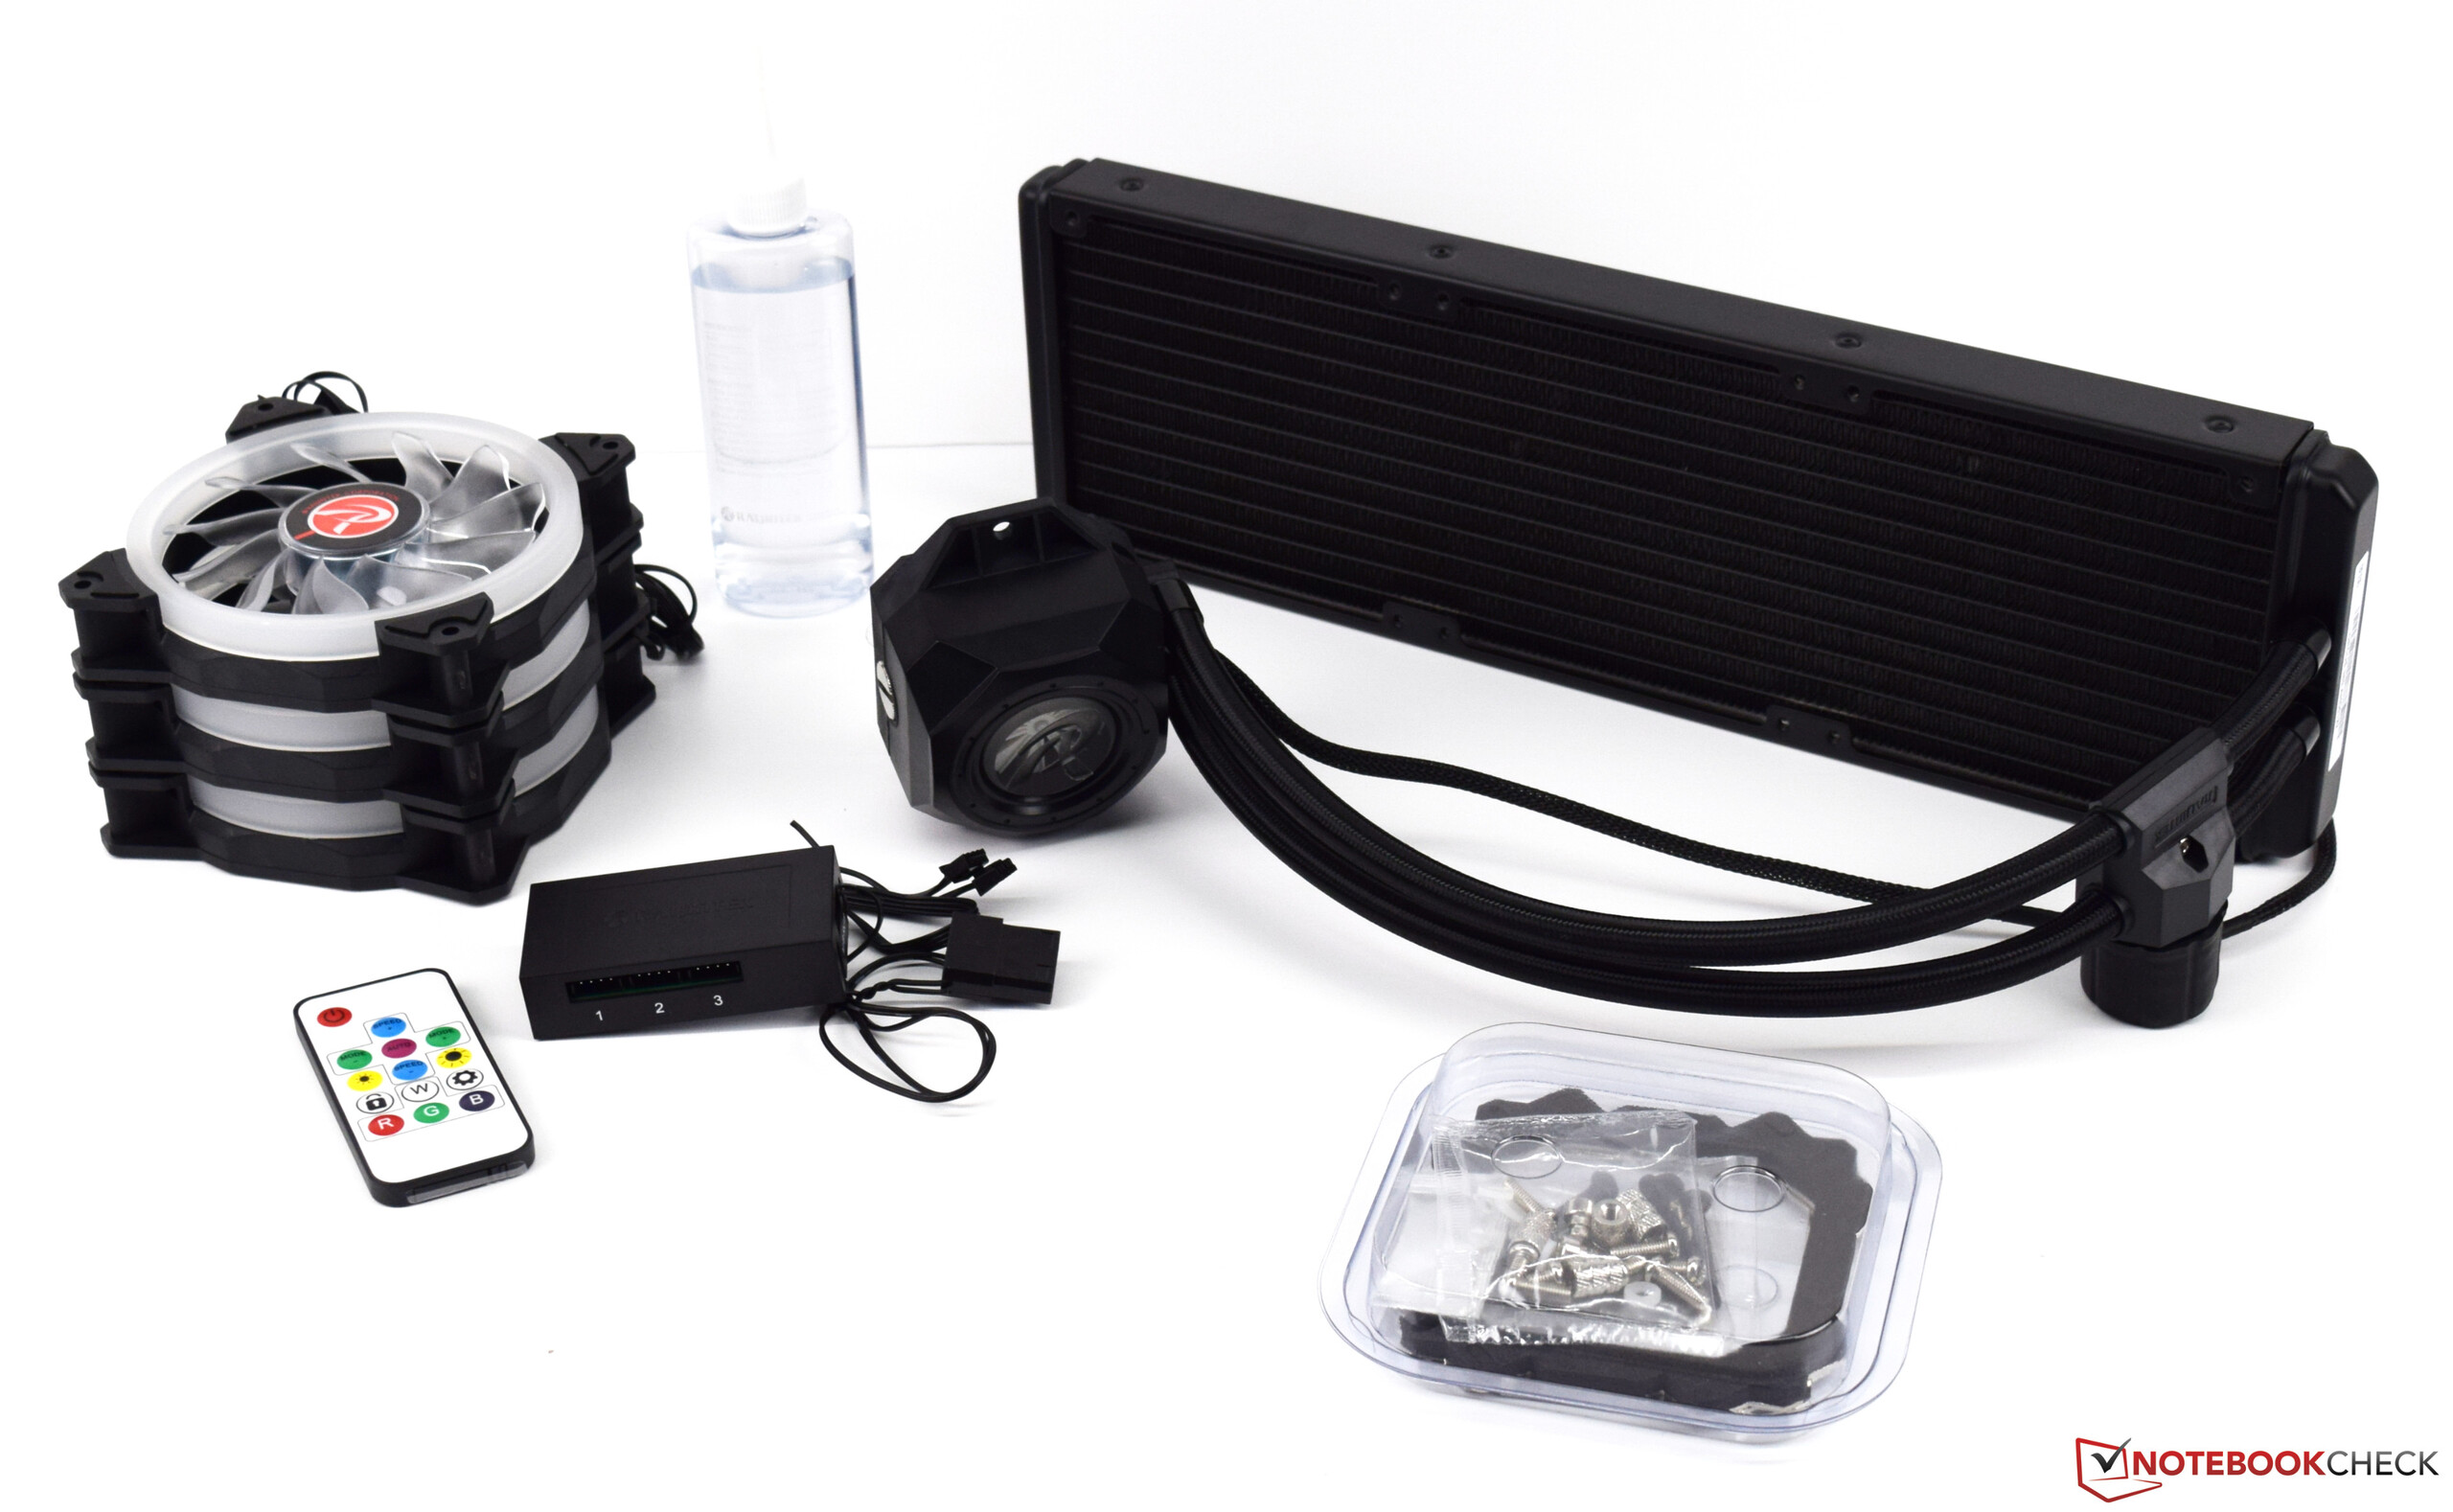
Caseking kindly supplied us with a Raijintek AIO with a 360 ° radiator and a Raijintek test bench that they generously adorned with Notebookcheck branding. The former proved to be oversized for our test system, but we used it nonetheless to make our tests comparable with those that we have conducted with other processors.
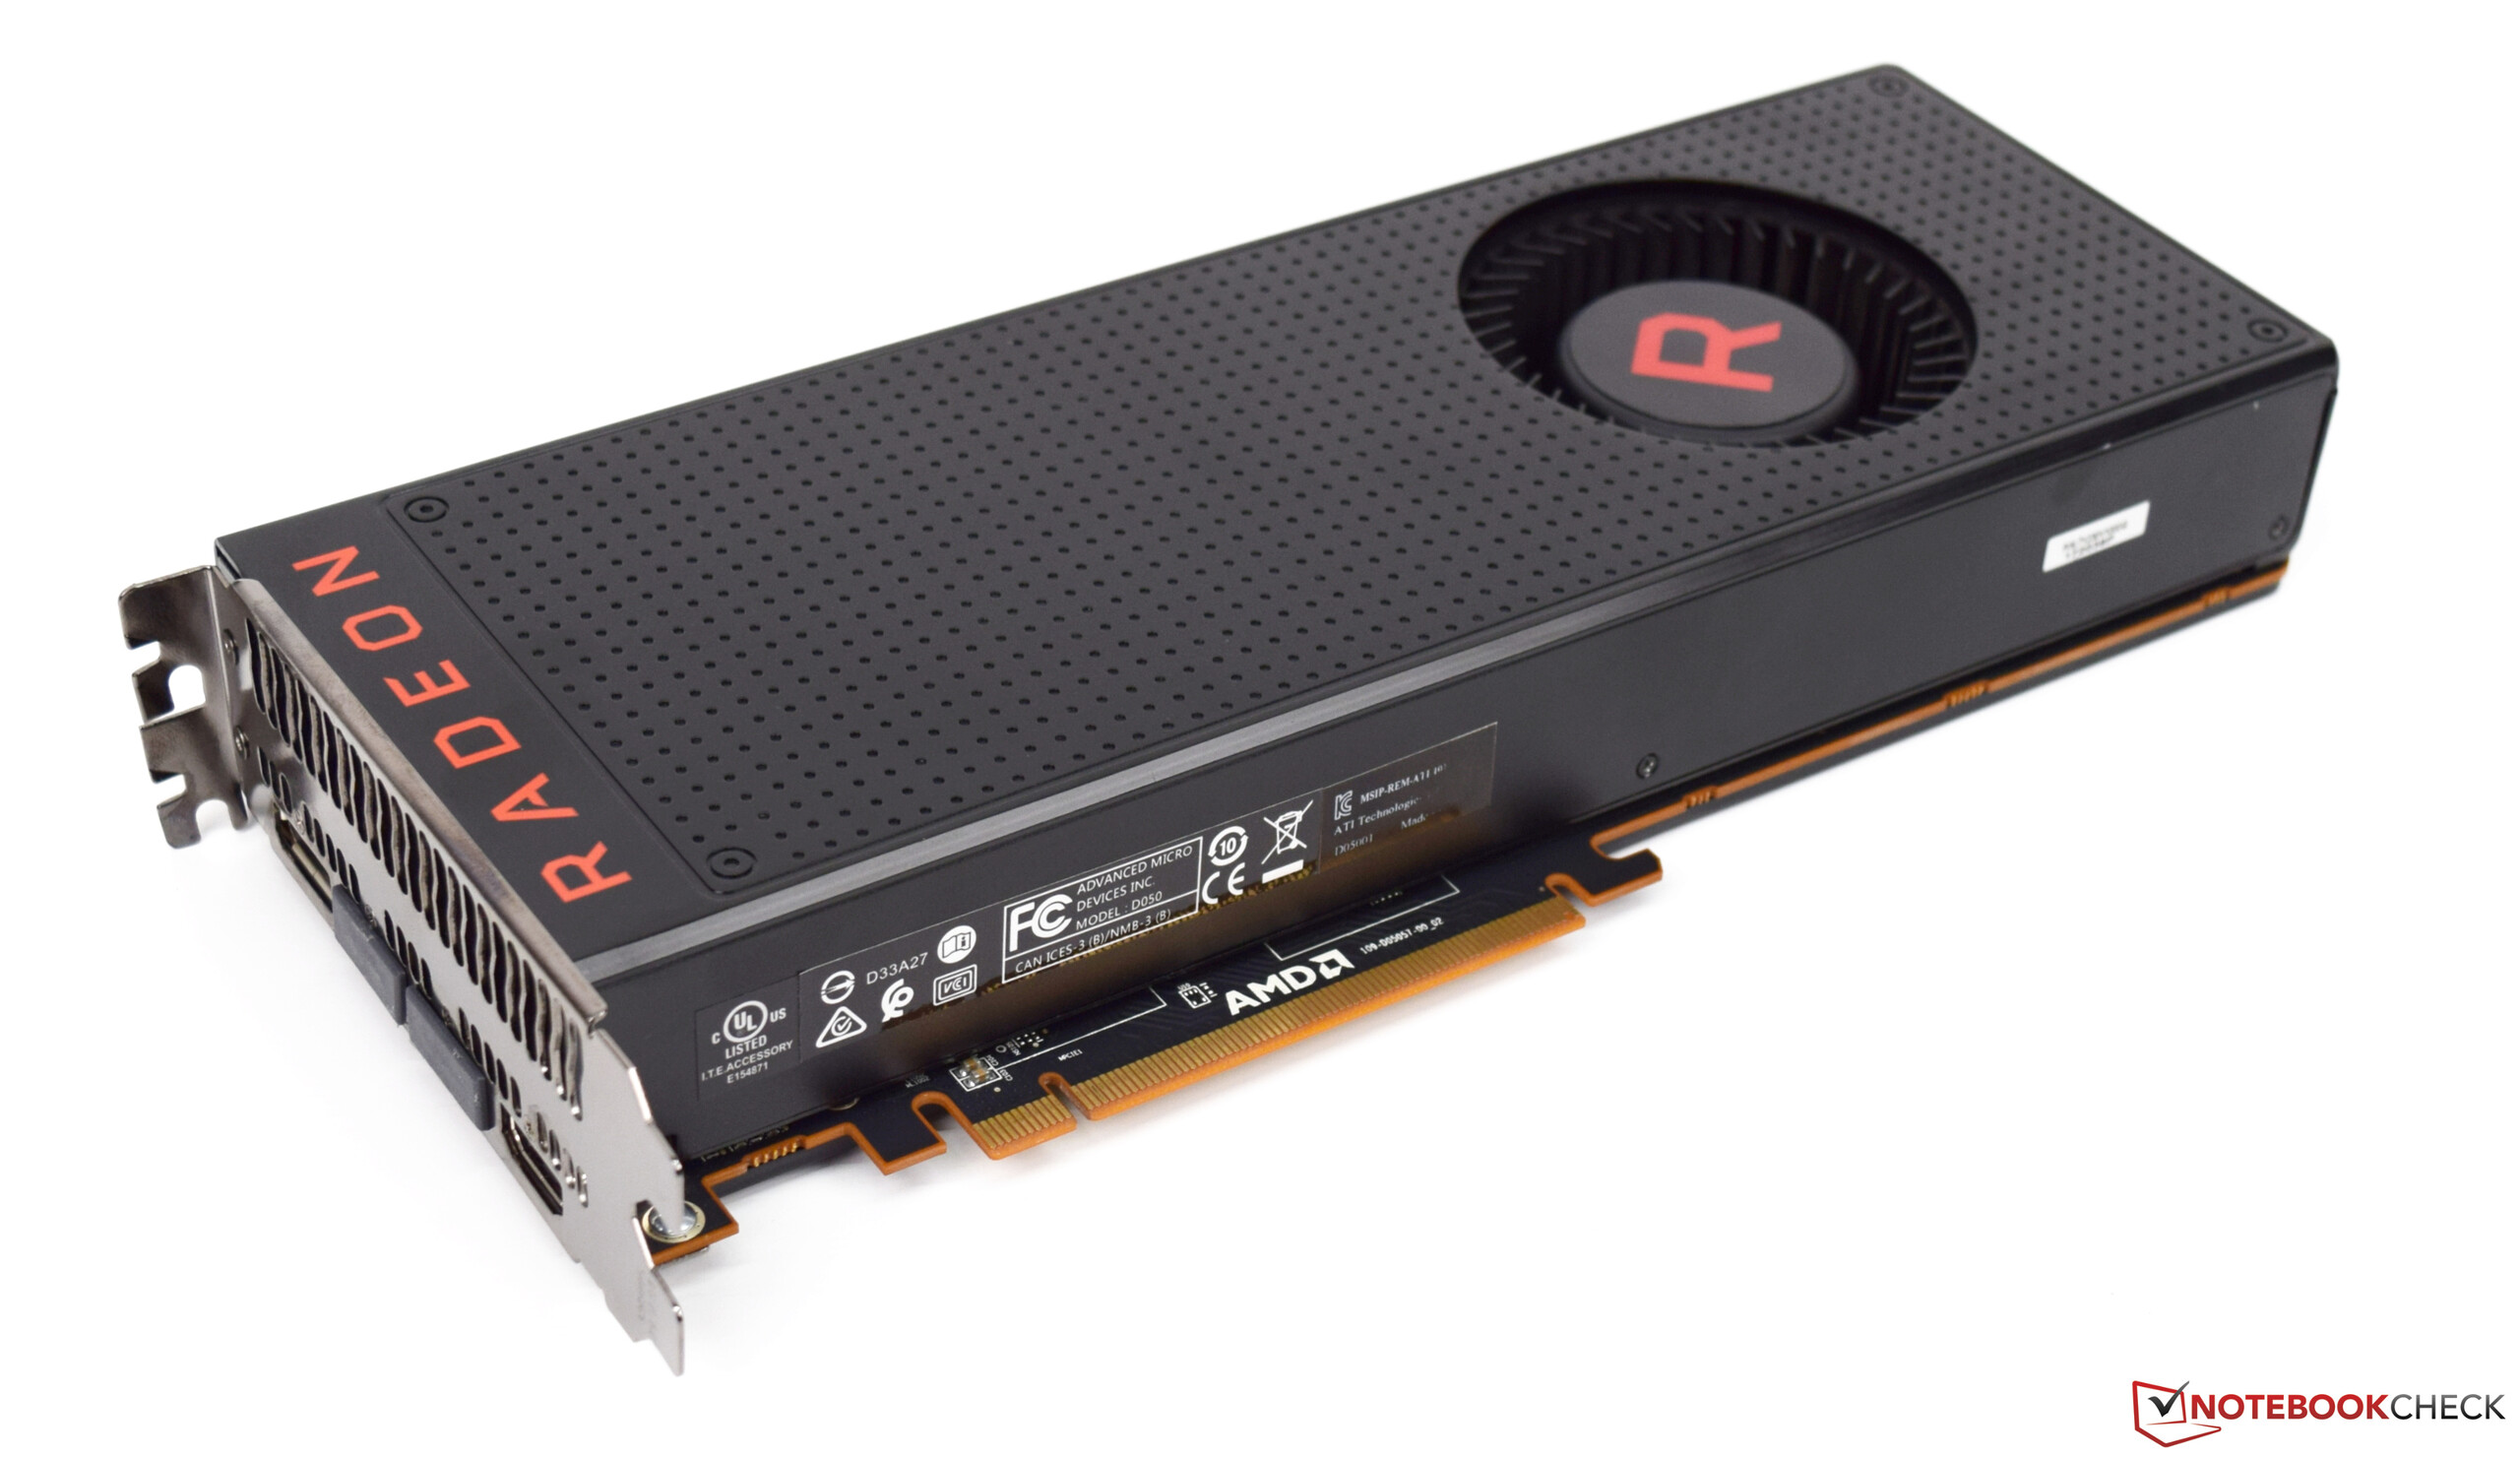
We have also equipped our test system with the same graphics card and RAM that we used in our Ryzen 5 and Ryzen 7 test systems. We have included these components in our power consumption measurements too.
We would have liked to equip our test system with the same ADATA SX910 512 GB drive with which we tested the Intel Core i9-9900K. Unfortunately, a defect caused us to resort to using a 240-GB SanDisk Ultra II SSD instead.
ASUS and Caseking provided us with the following hardware for our test system:
- Intel Core i5-8500T
- ASUS ROG Strix Z390-E Gaming (BIOS 0506, Default Settings, XMP 1 for DDR4-3400)
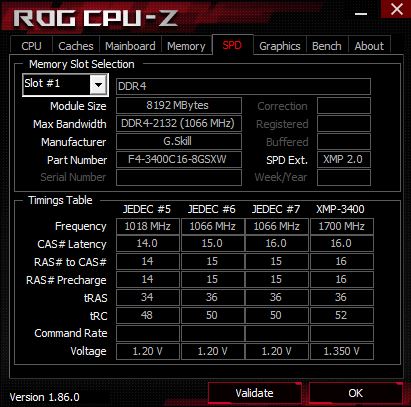
- G-Skill Sniper X DDR4-3400 Storage Kit 2 x 8 GB
- Raijintek Orcus 360 (AIO)
- Case: Raijintek PEAN test bench
Additional hardware that we used for our test system:
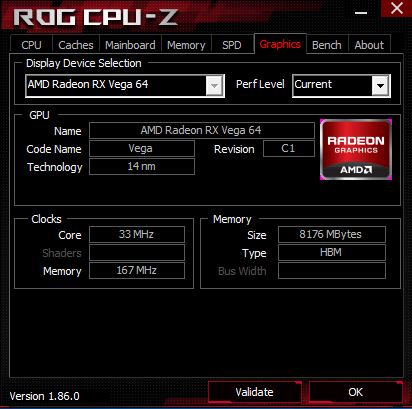
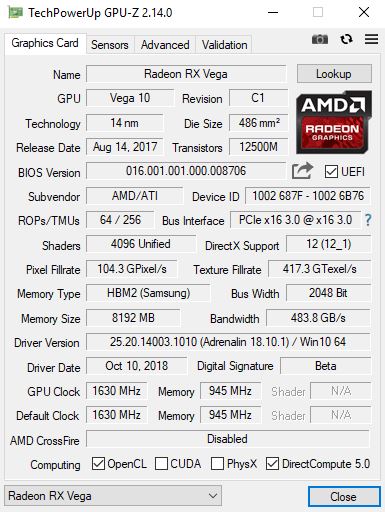
- XFX AMD Radeon RX Vega 64
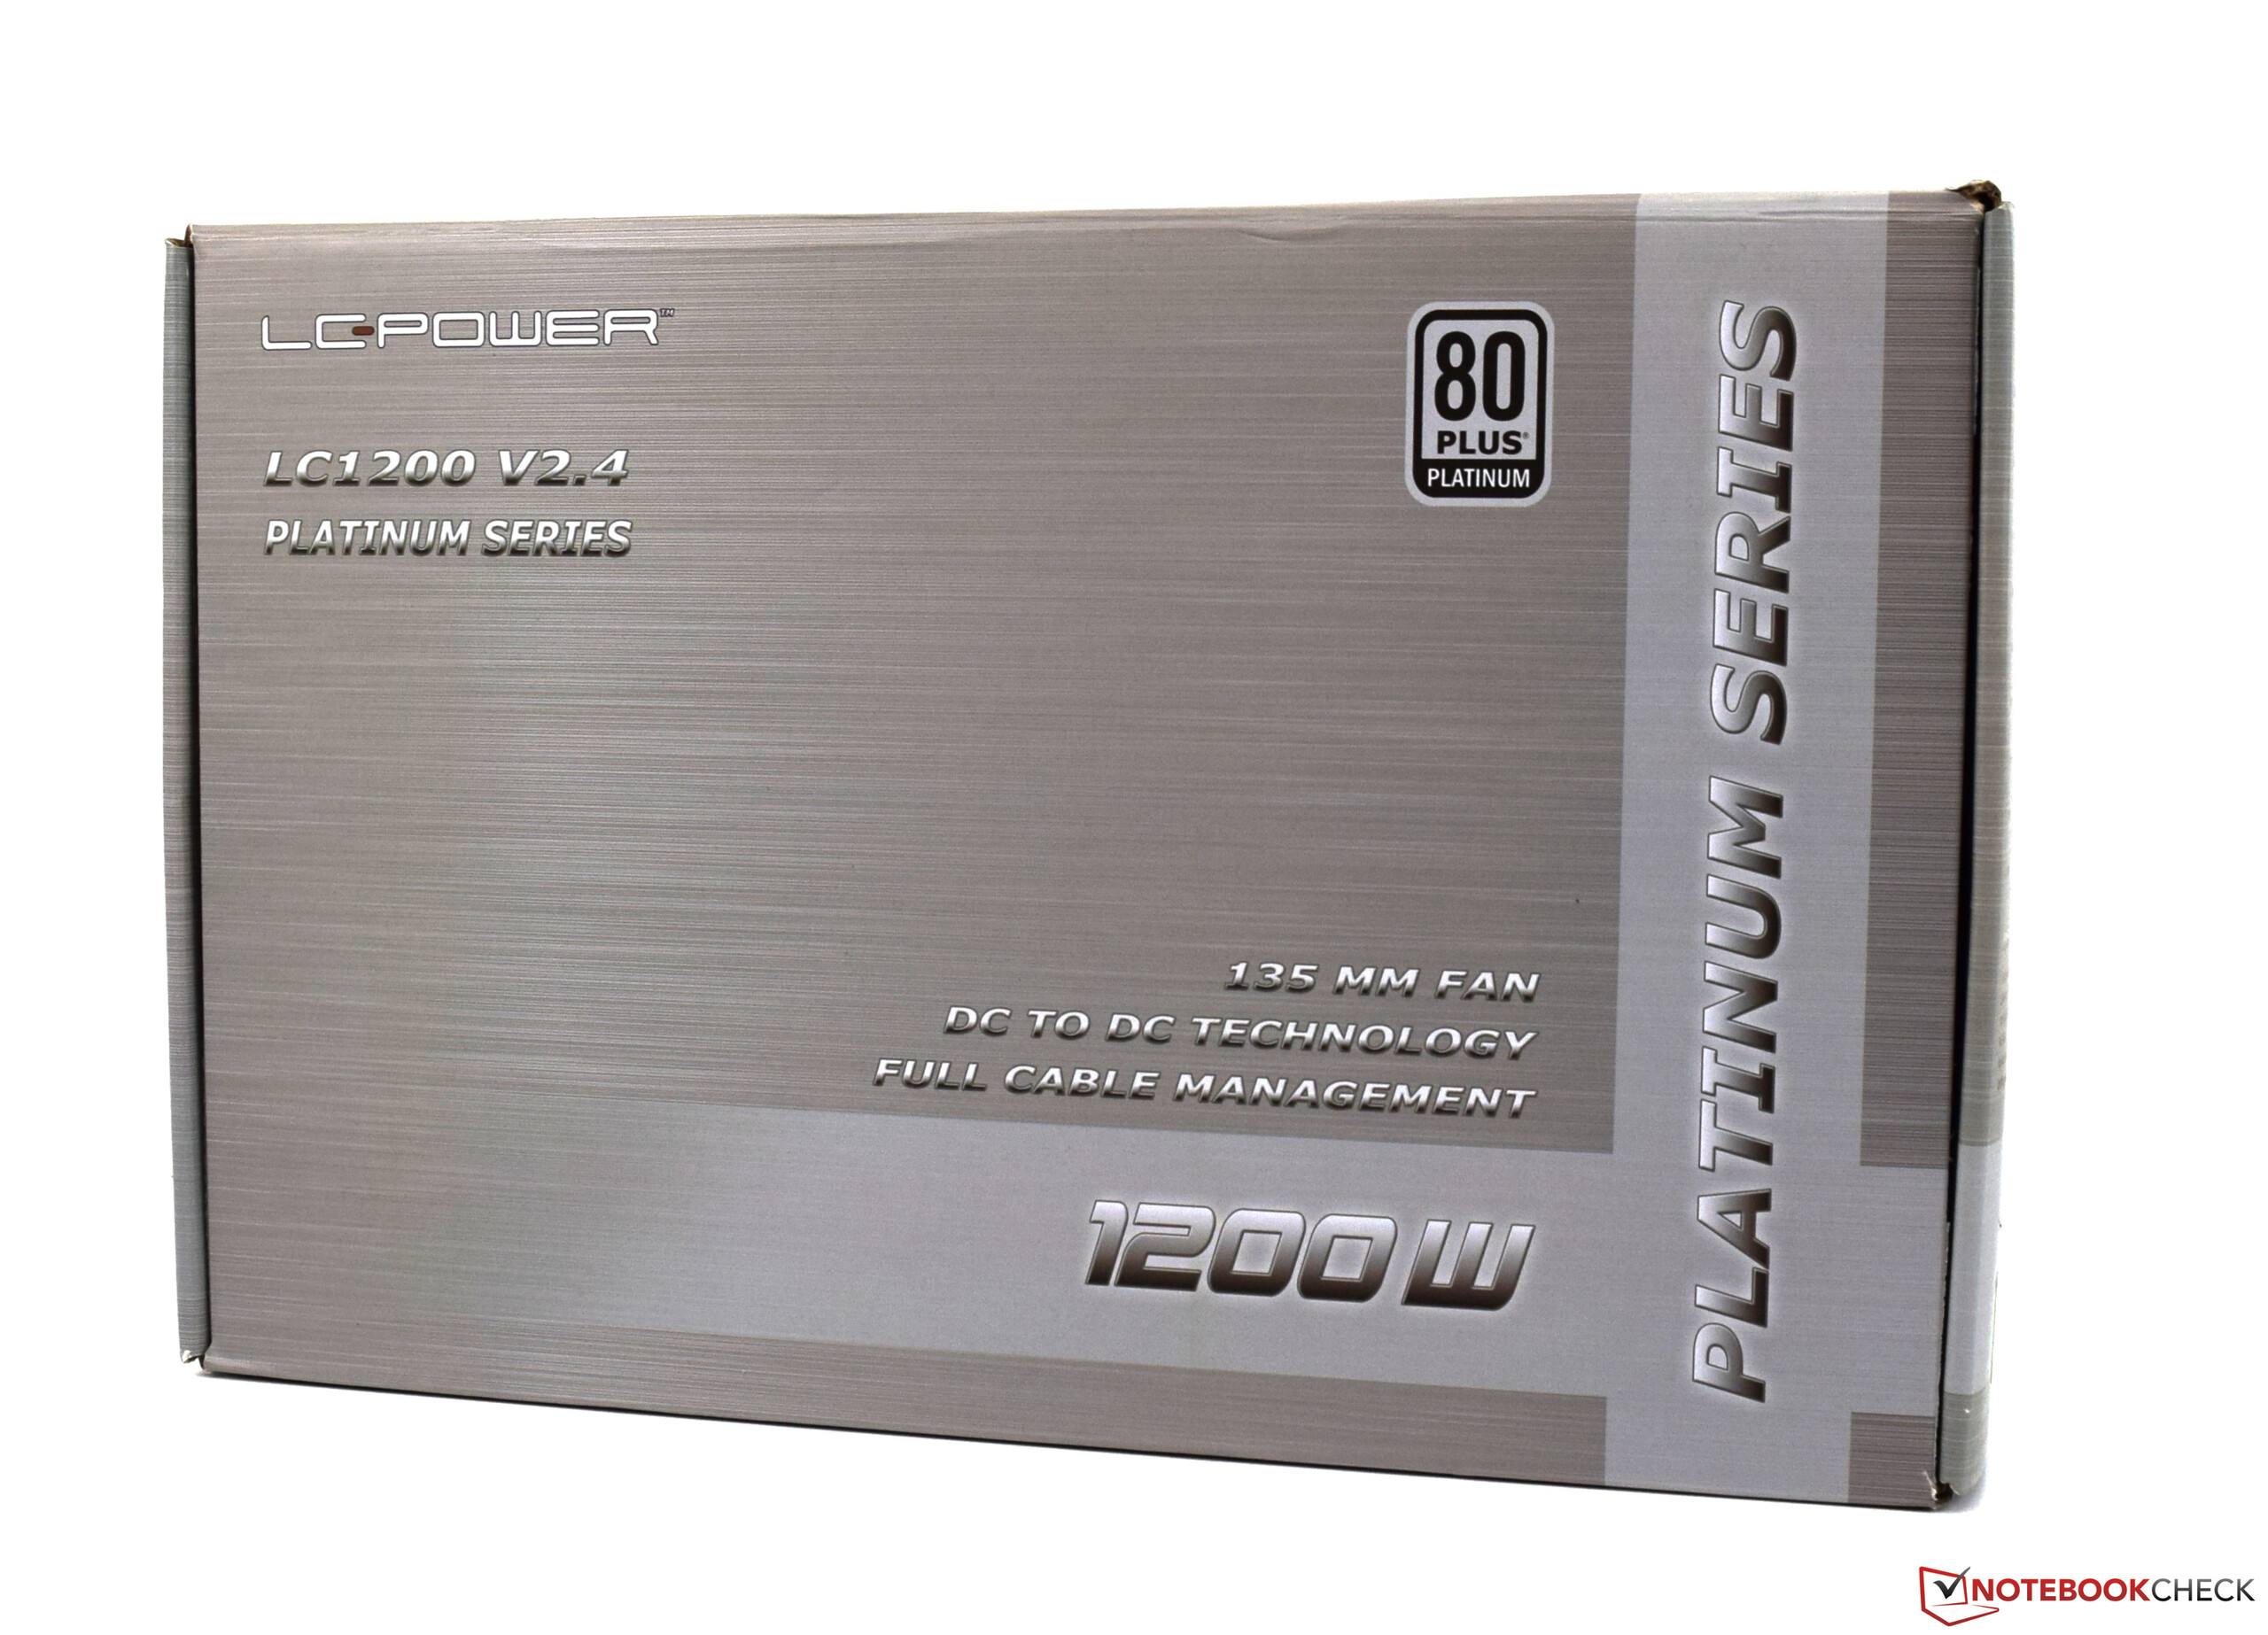
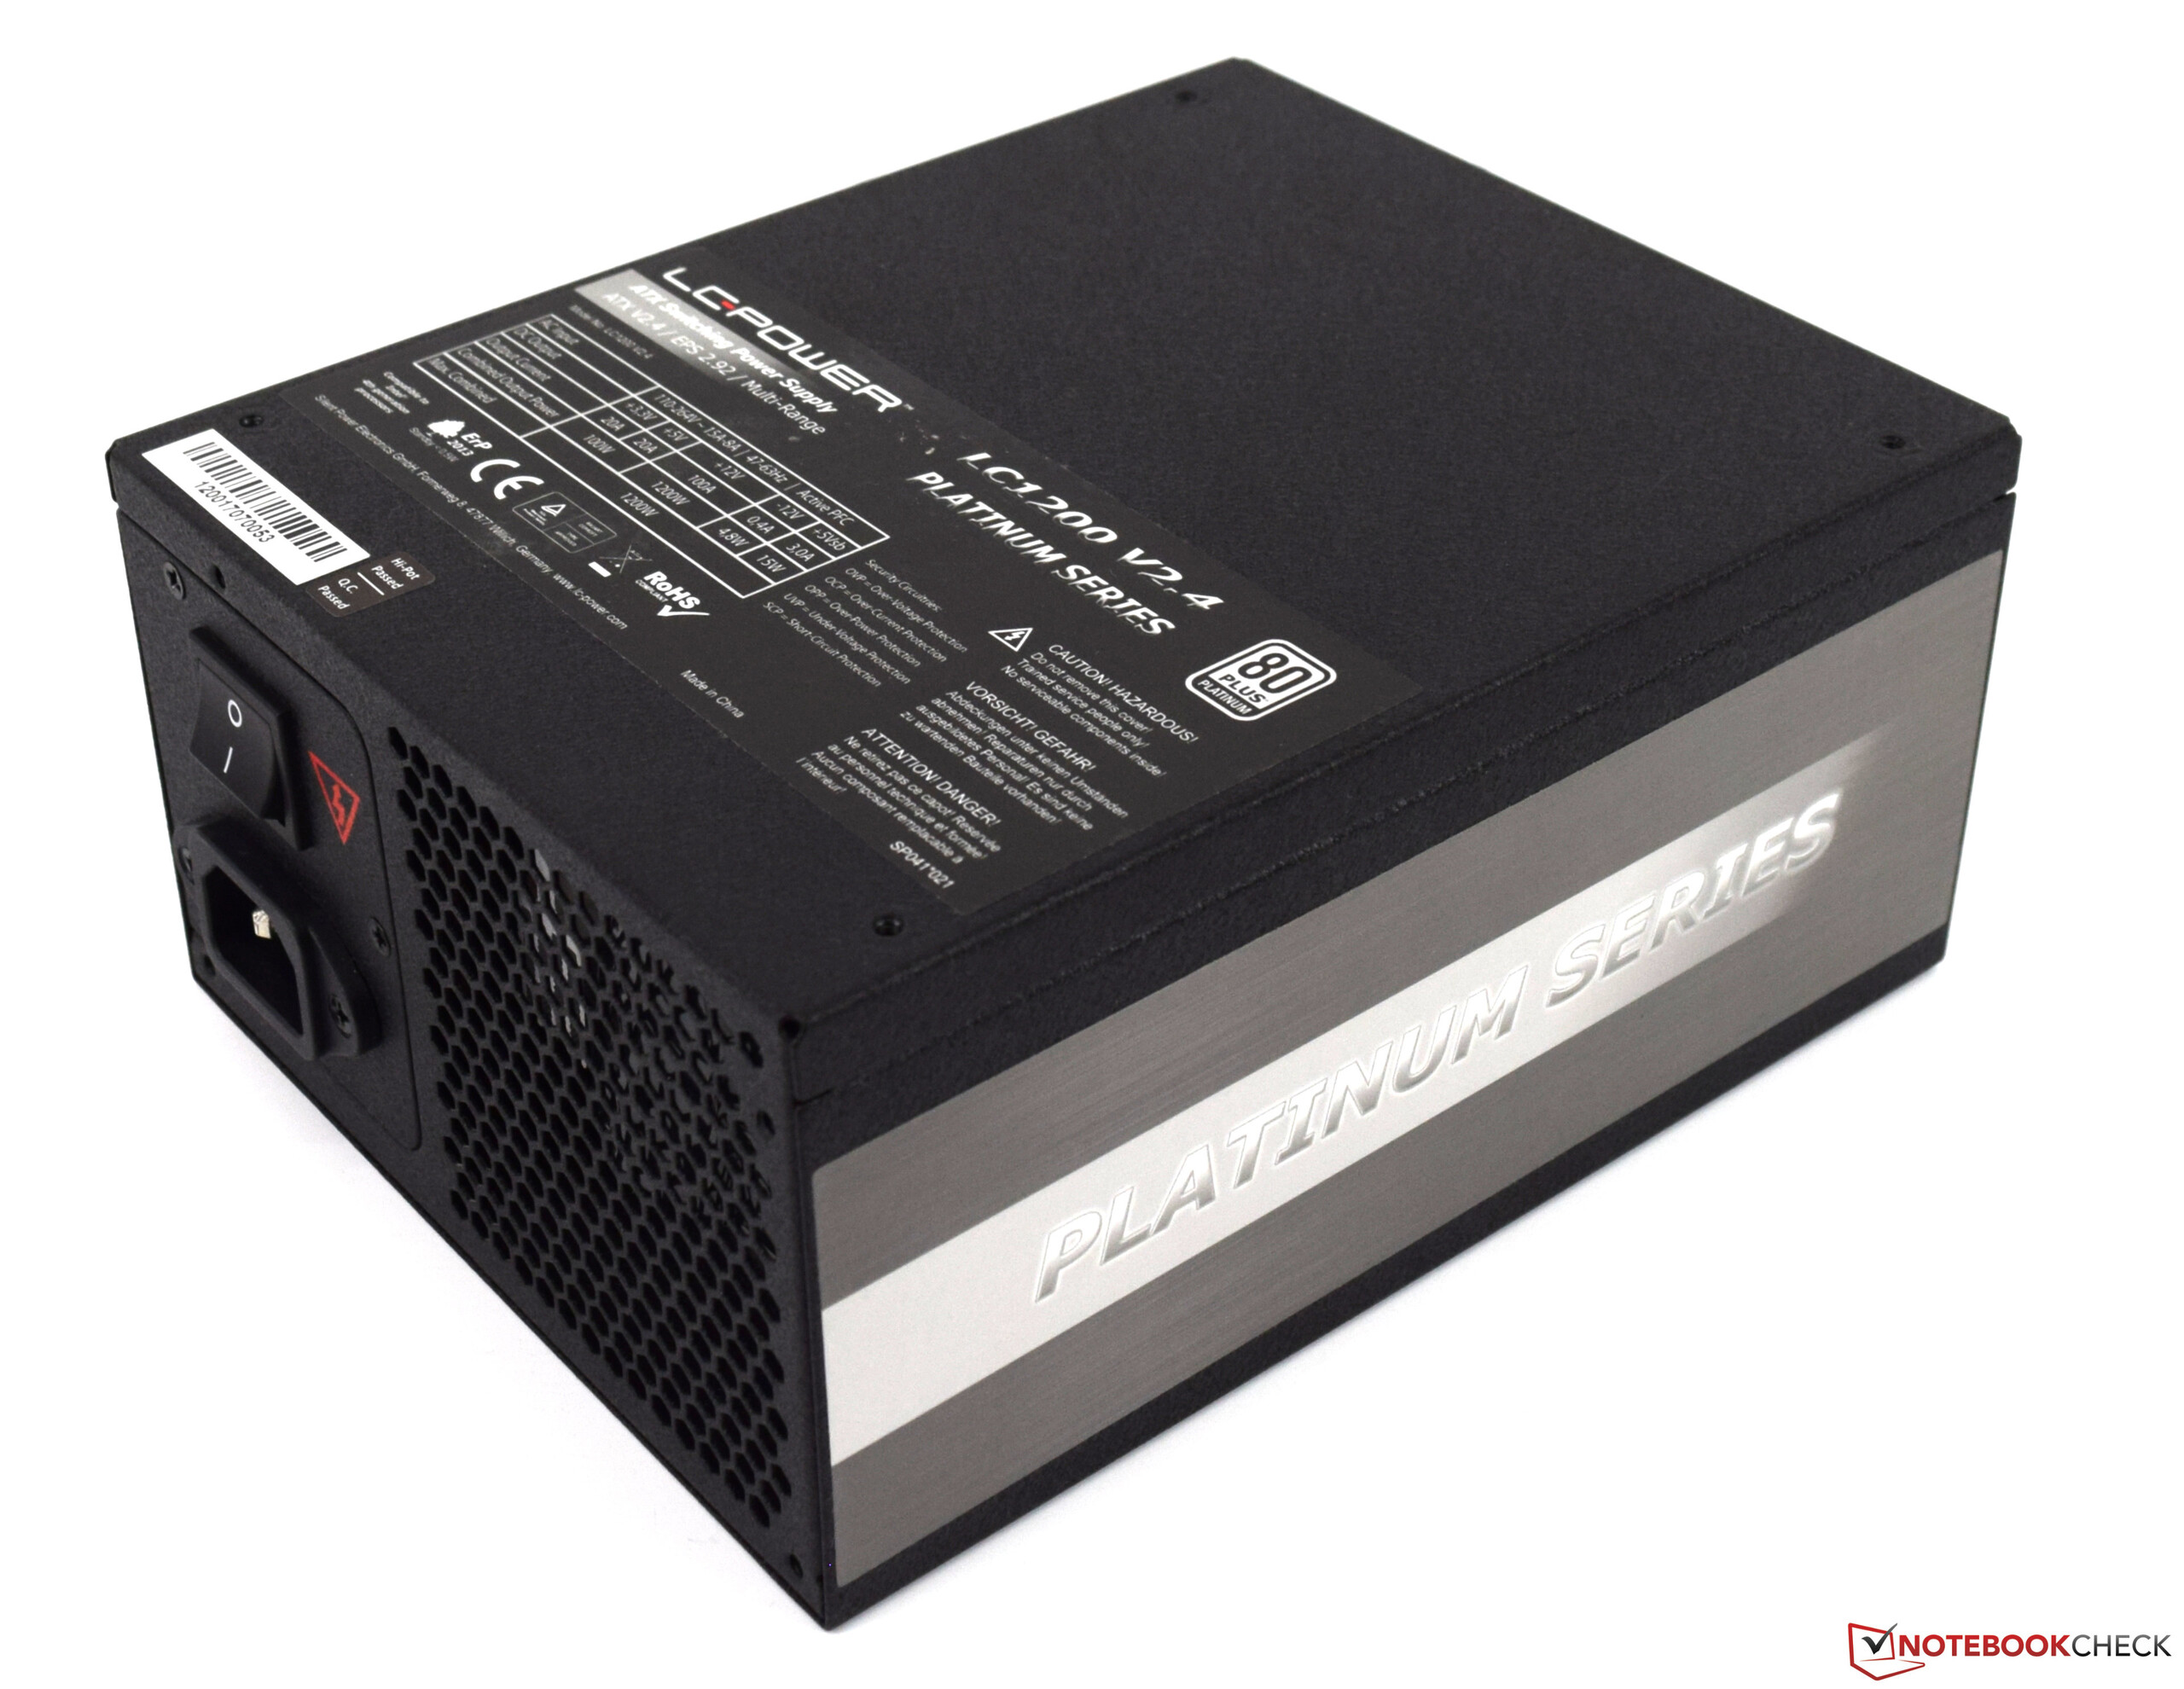
- LC Power 1,200-Watt Power Supply
- SanDisk Ultra II 240 GB
- Samsung Evo 850 500 GB (for games)
- Western Digital 2 TB (for games)
CPU Benchmarks
The Core i5-8500T generally ranks between the AMD Ryzen 5 2400G and the Ryzen 3 2200G APUs in CPU benchmarks, which makes the Core i5-8500T an impressively efficient processor. Every user will have their preference though. The Ryzen 5 2600, for example, is a more powerful hexa-core processor than the Core i5-8500T thanks to AMD’s SMT technology, but the former has a 65-W TDP. The same applies to the two other Ryzen APUs in our comparison table. The AMD processors also integrate Vega GPUs, which are significantly more powerful than the Intel UHD Graphics 630, so there are benefits of using a processor from either AMD or Intel.
In short, the Core i5-8500T is efficient enough for use in an office PC or an HTPC system for use in a living room.
| Performance rating - Percent | |
| Intel Core i9-9900K | |
| AMD Ryzen 7 2700X -1! | |
| AMD Ryzen 5 2600X -1! | |
| Intel Core i7-8700K | |
| AMD Ryzen 7 2700 | |
| AMD Ryzen 5 2600 | |
| AMD Ryzen 5 2400G | |
| Intel Core i5-7500T -7! | |
| Intel Core i5-8500T | |
| AMD Ryzen 3 2200G -1! | |
| Cinebench R15 | |
| CPU Single 64Bit | |
| Intel Core i9-9900K | |
| Intel Core i7-8700K | |
| AMD Ryzen 7 2700X | |
| AMD Ryzen 5 2600X | |
| AMD Ryzen 7 2700 | |
| AMD Ryzen 5 2600 | |
| AMD Ryzen 5 2400G | |
| AMD Ryzen 3 2200G | |
| Intel Core i5-8500T | |
| Intel Core i5-7500T | |
| CPU Multi 64Bit | |
| Intel Core i9-9900K | |
| AMD Ryzen 7 2700X | |
| AMD Ryzen 7 2700 | |
| AMD Ryzen 5 2600X | |
| Intel Core i7-8700K | |
| AMD Ryzen 5 2600 | |
| AMD Ryzen 5 2400G | |
| Intel Core i5-8500T | |
| AMD Ryzen 3 2200G | |
| Intel Core i5-7500T | |
| Cinebench R11.5 | |
| CPU Multi 64Bit | |
| Intel Core i9-9900K | |
| AMD Ryzen 7 2700X | |
| AMD Ryzen 7 2700 | |
| AMD Ryzen 5 2600X | |
| AMD Ryzen 5 2600 | |
| Intel Core i7-8700K | |
| AMD Ryzen 5 2400G | |
| Intel Core i5-8500T | |
| AMD Ryzen 3 2200G | |
| Intel Core i5-7500T | |
| CPU Single 64Bit | |
| Intel Core i9-9900K | |
| Intel Core i7-8700K | |
| AMD Ryzen 7 2700X | |
| AMD Ryzen 5 2600X | |
| AMD Ryzen 7 2700 | |
| AMD Ryzen 5 2400G | |
| AMD Ryzen 5 2600 | |
| AMD Ryzen 3 2200G | |
| Intel Core i5-8500T | |
| Intel Core i5-7500T | |
| Blender - v2.79 BMW27 CPU | |
| AMD Ryzen 3 2200G | |
| Intel Core i5-8500T | |
| AMD Ryzen 5 2400G | |
| AMD Ryzen 5 2600 | |
| Intel Core i7-8700K | |
| AMD Ryzen 5 2600X | |
| AMD Ryzen 7 2700 | |
| AMD Ryzen 7 2700X | |
| Intel Core i9-9900K | |
| HWBOT x265 Benchmark v2.2 - 4k Preset | |
| AMD Ryzen 5 2400G | |
| Intel Core i9-9900K | |
| Intel Core i7-8700K | |
| AMD Ryzen 7 2700 | |
| AMD Ryzen 5 2600 | |
| Intel Core i5-8500T | |
| X264 HD Benchmark 4.0 | |
| Pass 1 | |
| Intel Core i9-9900K | |
| Intel Core i7-8700K | |
| AMD Ryzen 7 2700X | |
| AMD Ryzen 5 2600X | |
| AMD Ryzen 5 2600 | |
| Intel Core i5-8500T | |
| AMD Ryzen 7 2700 | |
| AMD Ryzen 3 2200G | |
| AMD Ryzen 5 2400G | |
| Pass 2 | |
| Intel Core i9-9900K | |
| AMD Ryzen 7 2700X | |
| AMD Ryzen 7 2700 | |
| Intel Core i7-8700K | |
| AMD Ryzen 5 2600X | |
| AMD Ryzen 5 2600 | |
| Intel Core i5-8500T | |
| AMD Ryzen 5 2400G | |
| AMD Ryzen 3 2200G | |
| WinRAR - Result | |
| Intel Core i9-9900K | |
| Intel Core i7-8700K | |
| AMD Ryzen 7 2700X | |
| AMD Ryzen 5 2600X | |
| AMD Ryzen 5 2600 | |
| AMD Ryzen 7 2700 | |
| Intel Core i5-8500T | |
| AMD Ryzen 5 2400G | |
| AMD Ryzen 3 2200G | |
| TrueCrypt | |
| AES Mean 100MB | |
| Intel Core i9-9900K | |
| AMD Ryzen 7 2700X | |
| AMD Ryzen 7 2700 | |
| AMD Ryzen 5 2600X | |
| AMD Ryzen 5 2600 | |
| AMD Ryzen 5 2400G | |
| Intel Core i7-8700K | |
| Intel Core i5-8500T | |
| AMD Ryzen 3 2200G | |
| Intel Core i5-7500T | |
| Twofish Mean 100MB | |
| Intel Core i9-9900K | |
| AMD Ryzen 7 2700X | |
| AMD Ryzen 7 2700 | |
| AMD Ryzen 5 2600X | |
| AMD Ryzen 5 2600 | |
| Intel Core i7-8700K | |
| AMD Ryzen 5 2400G | |
| Intel Core i5-8500T | |
| AMD Ryzen 3 2200G | |
| Intel Core i5-7500T | |
| Serpent Mean 100MB | |
| Intel Core i9-9900K | |
| AMD Ryzen 7 2700X | |
| AMD Ryzen 7 2700 | |
| AMD Ryzen 5 2600X | |
| AMD Ryzen 5 2600 | |
| Intel Core i7-8700K | |
| AMD Ryzen 5 2400G | |
| Intel Core i5-8500T | |
| AMD Ryzen 3 2200G | |
| Intel Core i5-7500T | |
| Geekbench 4.4 | |
| 64 Bit Single-Core Score | |
| Intel Core i9-9900K | |
| Intel Core i7-8700K | |
| AMD Ryzen 7 2700X | |
| AMD Ryzen 5 2600X | |
| AMD Ryzen 7 2700 | |
| AMD Ryzen 5 2600 | |
| Intel Core i5-8500T | |
| AMD Ryzen 5 2400G | |
| AMD Ryzen 3 2200G | |
| 64 Bit Multi-Core Score | |
| Intel Core i9-9900K | |
| AMD Ryzen 7 2700X | |
| Intel Core i7-8700K | |
| AMD Ryzen 7 2700 | |
| AMD Ryzen 5 2600X | |
| AMD Ryzen 5 2600 | |
| Intel Core i5-8500T | |
| AMD Ryzen 5 2400G | |
| AMD Ryzen 3 2200G | |
* ... smaller is better
Cinebench R15 multi-core benchmark loop
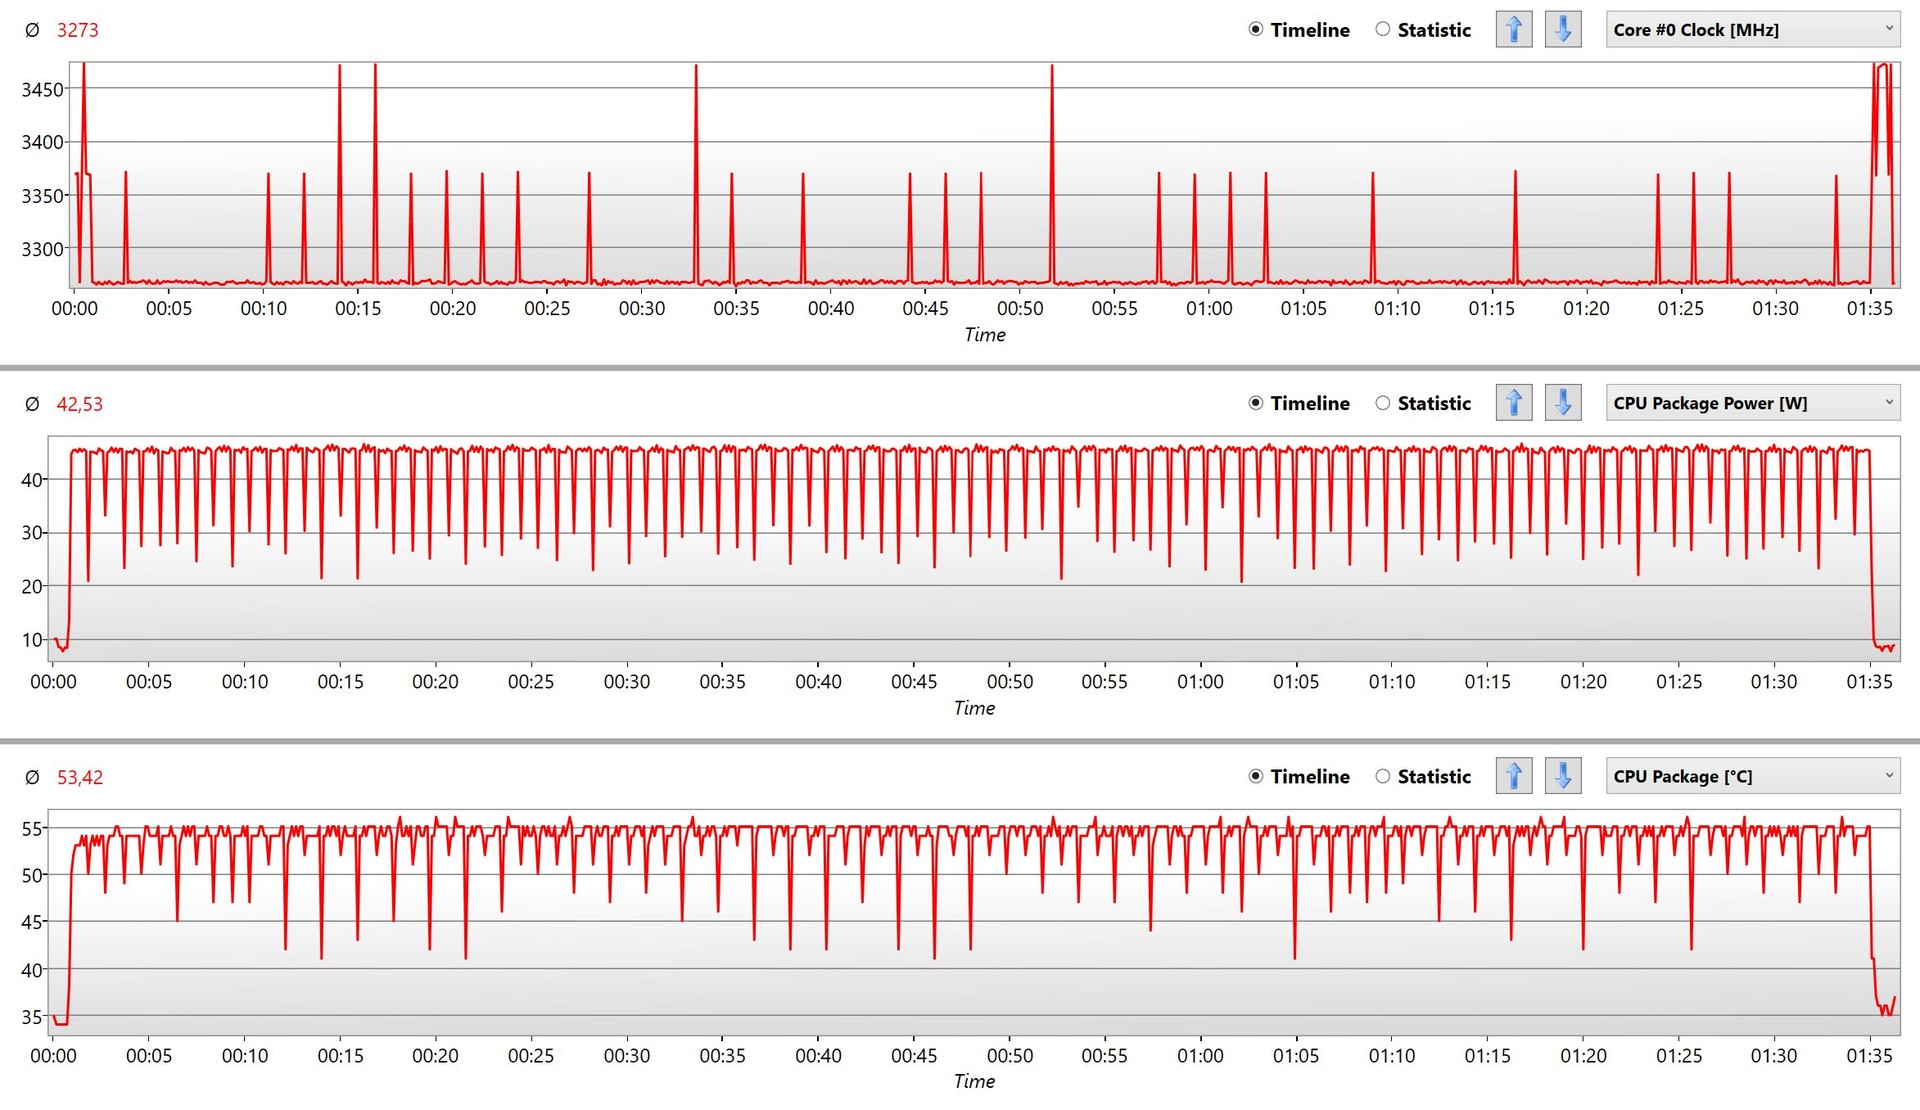
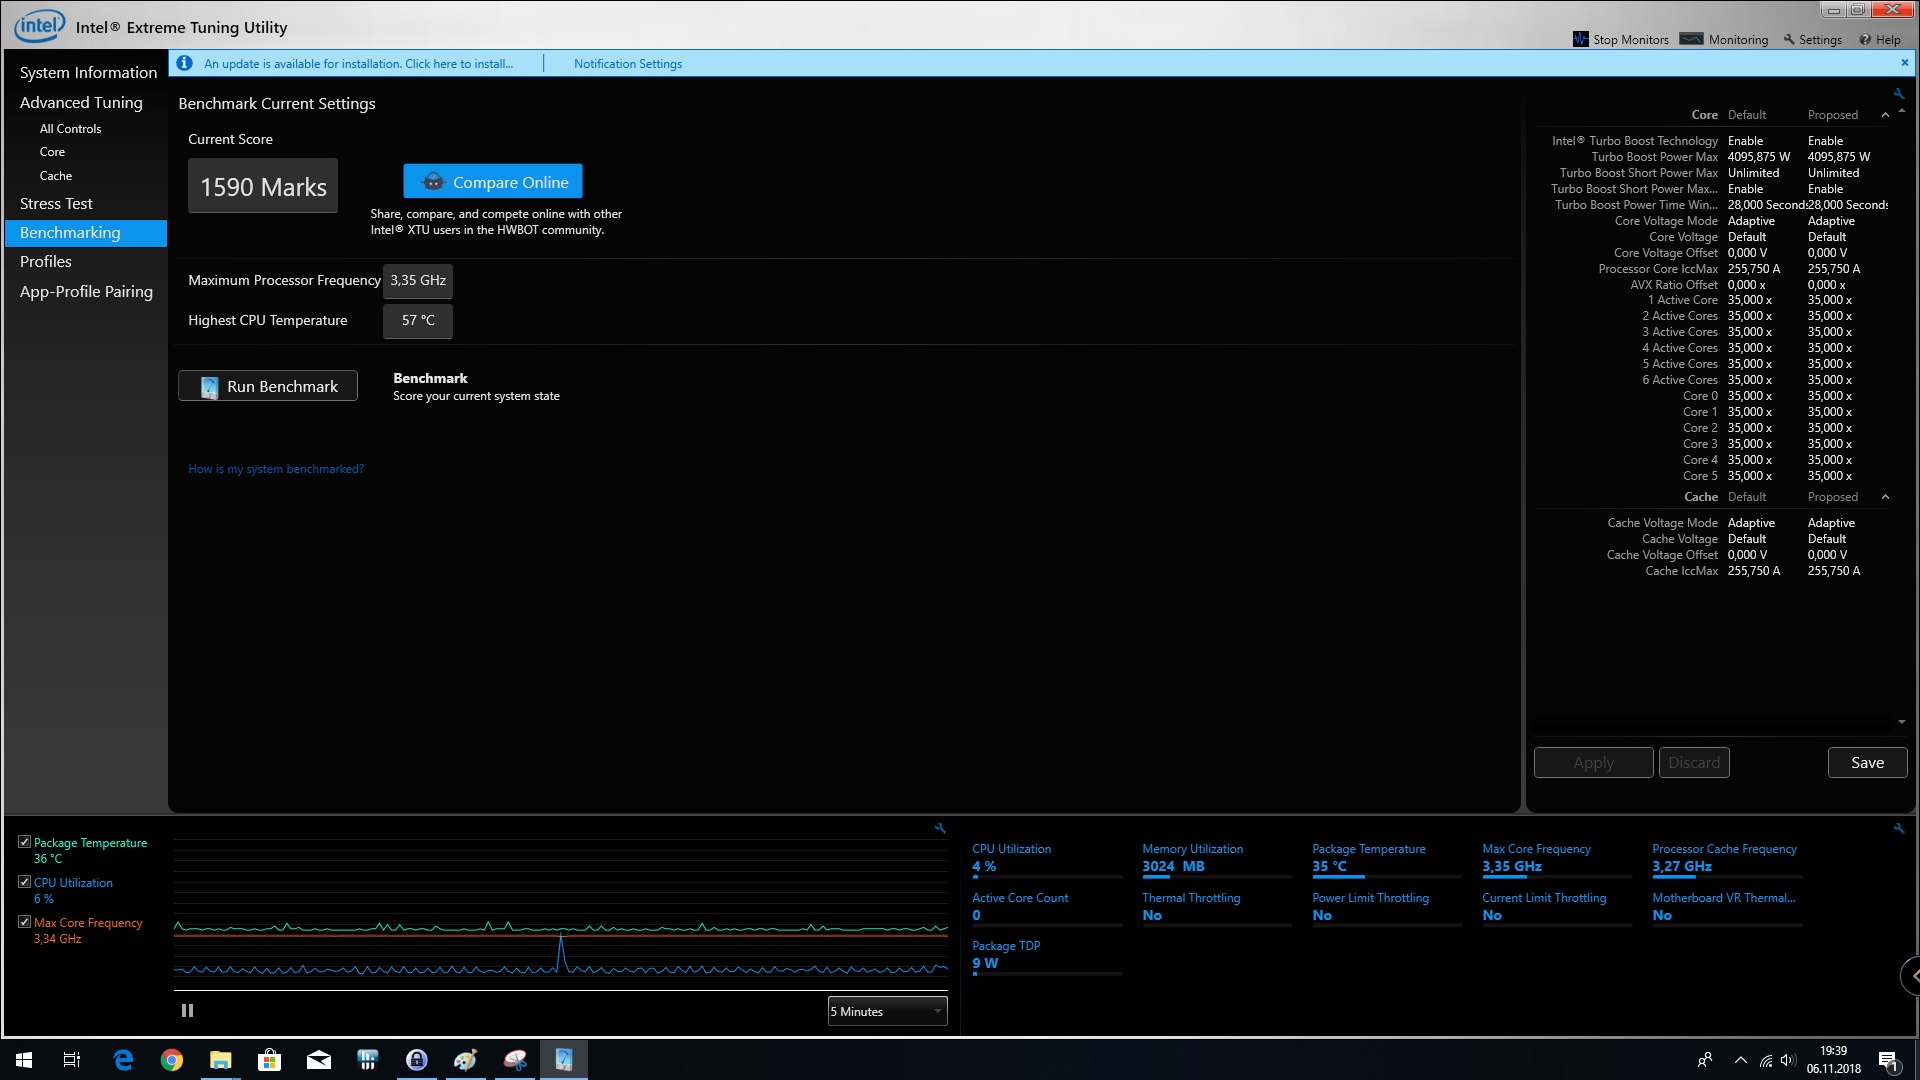
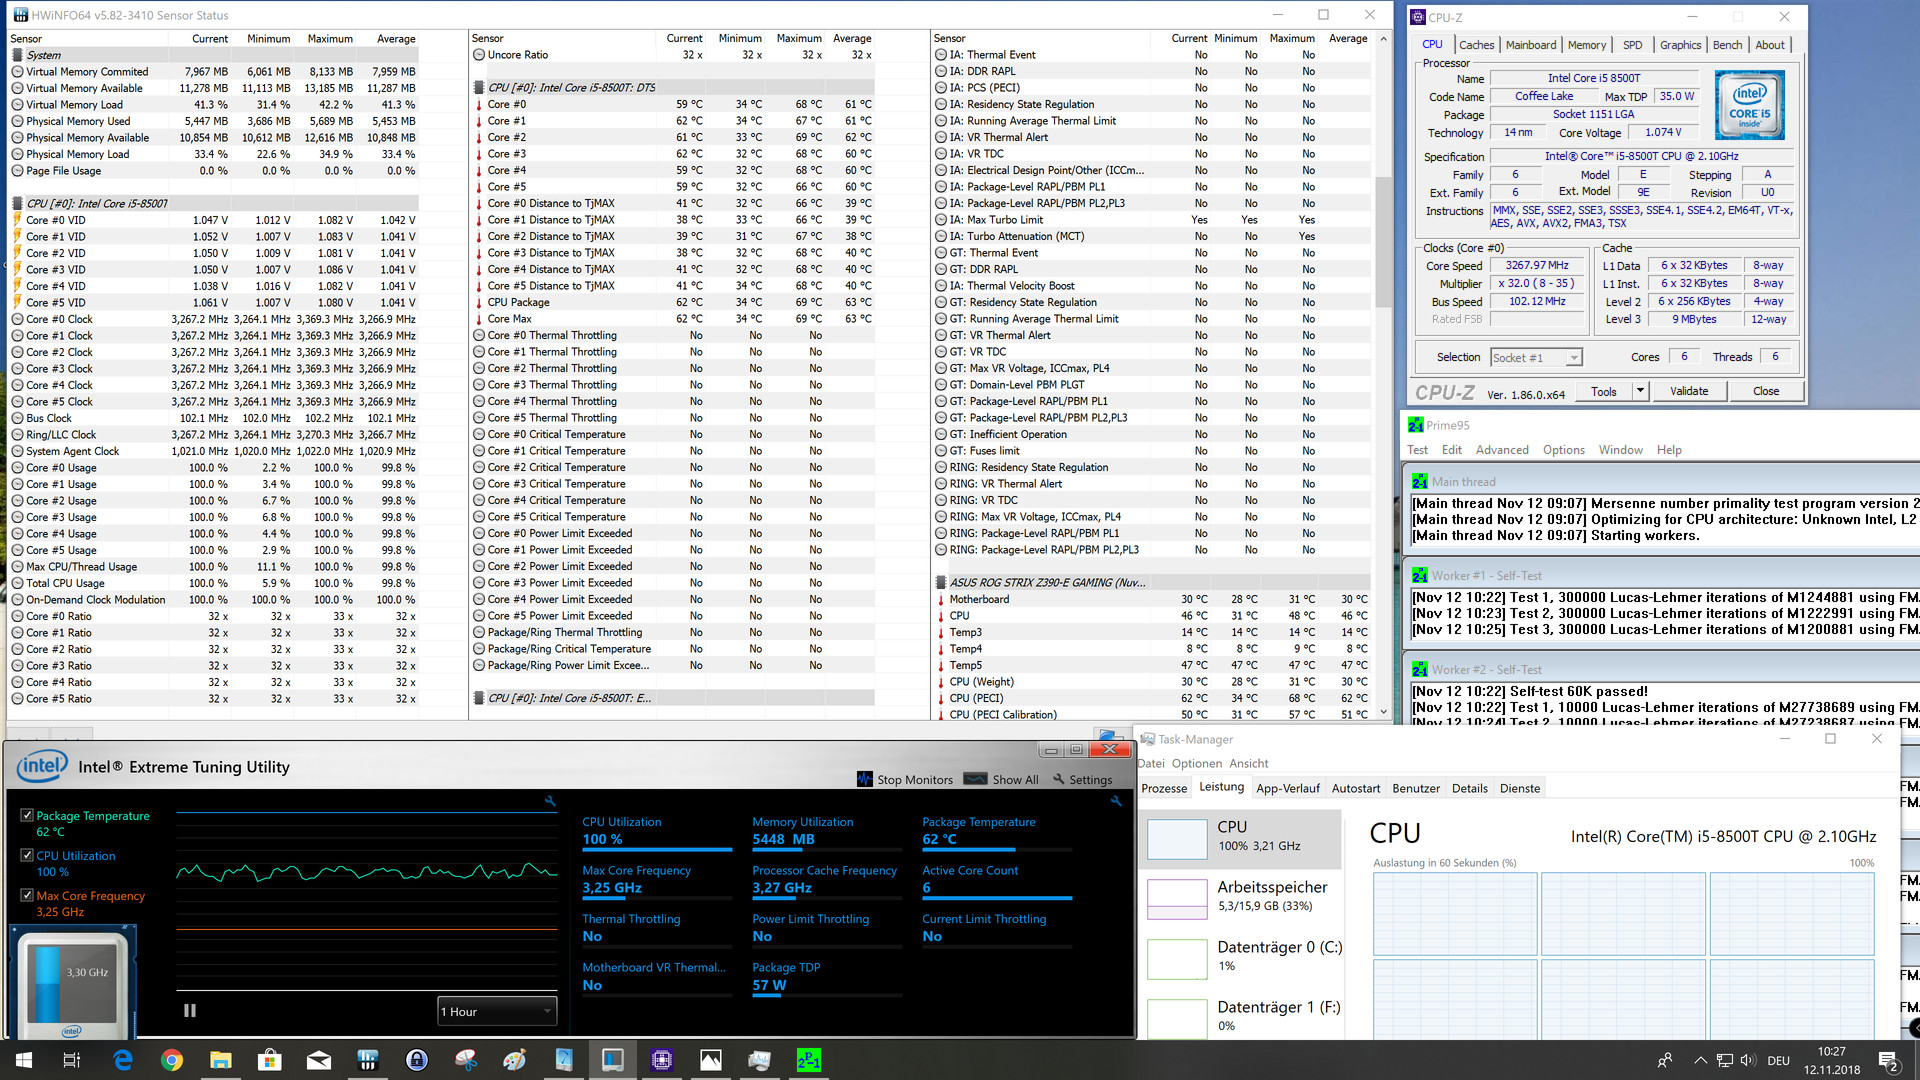
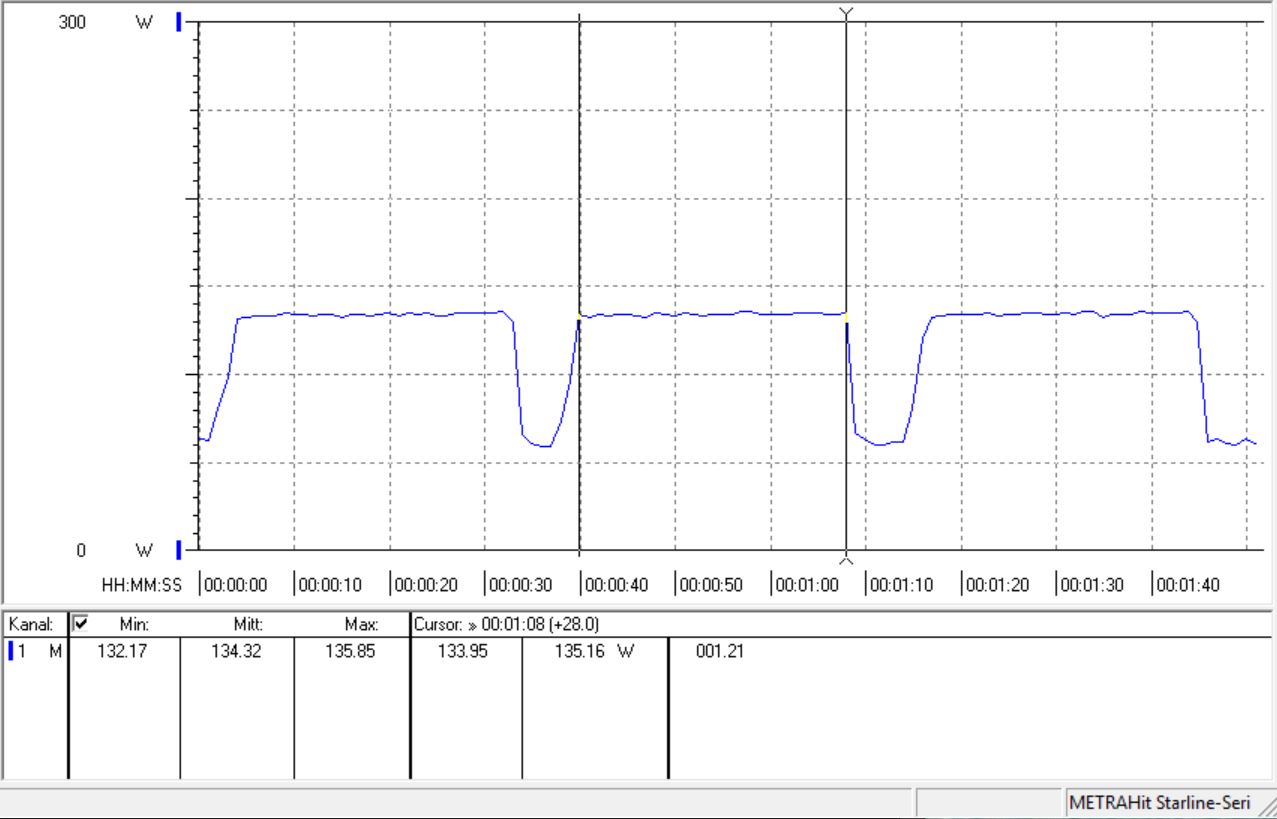
We subjected the Core i5-8500T to a Cinebench R15 multi-core benchmark loop to find how the processor performed under sustained load. We recorded an average power consumption of 42.5 W during the benchmark loop and average clock speed of 3.2 GHz, the latter of which coincides with Intel’s specifications. Moreover, the core temperature averaged a comparatively cool 53.4 °C (~128 °F), probably in part because of our oversized Raijintek AIO. Our test system averaged 760 points in Cinebench R15, which is a way off what the Ryzen 5 2400G achieves. However, we suspect that the log file that we ran in the background during the benchmark loop reduced these scores somewhat.
Gaming Performance
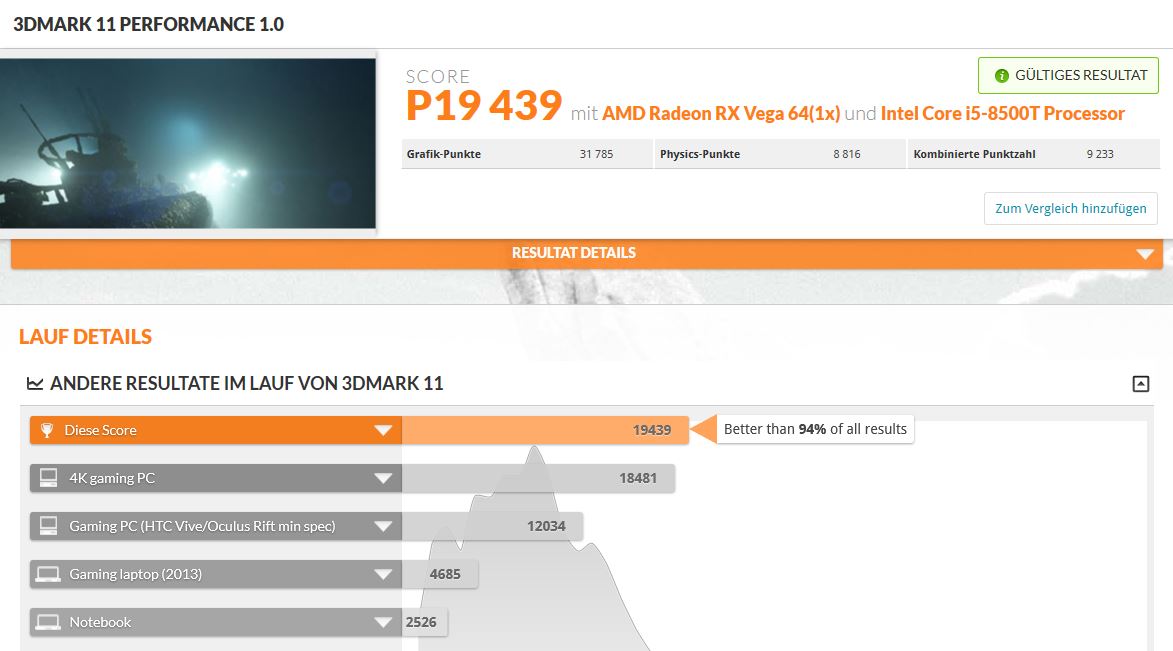
Synthetic benchmarks demonstrate that the Core i5-8500T is not designed for gaming, with scores markedly decreasing as we increased the resolution of the benchmarks. The processor is also a bottleneck at low resolutions, which explains why the Core i7-8700K outscores the Core i5-8500T in the 3DMark Cloud Gate Standard Graphics benchmark.
The gap between the Core i5-8500T and Core i7-8700K is clearer in-game benchmarks, particularly at low presets and resolutions. Our Core i5-8500T test system scores around 15% fewer FPS than its more powerful sibling in games like "Assassin’s Creed Odyssey" and "Forza Horizon 4". This performance gap increases dramatically in CPU intensive games like "Final Fantasy XV" though, in which the Core i5-8500T averages around 100 FPS fewer than the Core i7-8700K. Moreover, the Core i5-8500T finished far behind all AMD Ryzen APUs in our FFXV comparison table too. Gaming may become increasingly difficult on a Core i5-8500T system as newer games take advantage of more cores and benefit from HT or SMT support.
In general, our gaming tests revealed that the Core i5-8500T reaches its limits when playing current triple-A titled. We would recommend buying an Intel Core i7-8700K or a new AMD Ryzen APU if you want a gaming CPU over a Core i5-8500T. The new Ryzen APUs tend to be considerably cheaper than their Intel counterparts, but with up to 8 cores.
Insider tip: The new Ryzen chips are better value for money than the Intel equivalents.
| Performance rating - Percent | |
| AMD Radeon RX Vega 64 -2! | |
| AMD Radeon RX Vega 64 | |
| AMD Radeon RX Vega 64 | |
| AMD Radeon RX Vega 64 | |
| AMD Radeon RX Vega 64 | |
| AMD Radeon RX Vega 64 | |
| AMD Radeon RX Vega 64 | |
| 3DMark 11 | |
| 1280x720 Performance | |
| AMD Radeon RX Vega 64 | |
| AMD Radeon RX Vega 64 | |
| AMD Radeon RX Vega 64 | |
| AMD Radeon RX Vega 64 | |
| AMD Radeon RX Vega 64 | |
| AMD Radeon RX Vega 64 | |
| 1280x720 Performance Physics | |
| AMD Radeon RX Vega 64 | |
| AMD Radeon RX Vega 64 | |
| AMD Radeon RX Vega 64 | |
| AMD Radeon RX Vega 64 | |
| AMD Radeon RX Vega 64 | |
| AMD Radeon RX Vega 64 | |
| Performance rating - Percent | |
| AMD Radeon RX Vega 64 | |
| AMD Radeon RX Vega 64 | |
| AMD Radeon RX Vega 64 | |
| AMD Radeon RX Vega 64 | |
| AMD Radeon RX Vega 64 -6! | |
| AMD Radeon RX Vega 64 -6! | |
| AMD Radeon RX Vega 64 -6! | |
| The Witcher 3 | |
| 1024x768 Low Graphics & Postprocessing | |
| AMD Radeon RX Vega 64 | |
| AMD Radeon RX Vega 64 | |
| AMD Radeon RX Vega 64 | |
| AMD Radeon RX Vega 64 | |
| AMD Radeon RX Vega 64 | |
| AMD Radeon RX Vega 64 | |
| AMD Radeon RX Vega 64 | |
| 1920x1080 Ultra Graphics & Postprocessing (HBAO+) | |
| AMD Radeon RX Vega 64 | |
| AMD Radeon RX Vega 64 | |
| AMD Radeon RX Vega 64 | |
| AMD Radeon RX Vega 64 | |
| AMD Radeon RX Vega 64 | |
| AMD Radeon RX Vega 64 | |
| AMD Radeon RX Vega 64 | |
| Rise of the Tomb Raider | |
| 1024x768 Lowest Preset | |
| AMD Radeon RX Vega 64 | |
| AMD Radeon RX Vega 64 | |
| AMD Radeon RX Vega 64 | |
| AMD Radeon RX Vega 64 | |
| AMD Radeon RX Vega 64 | |
| AMD Radeon RX Vega 64 | |
| AMD Radeon RX Vega 64 | |
| 1920x1080 Very High Preset AA:FX AF:16x | |
| AMD Radeon RX Vega 64 | |
| AMD Radeon RX Vega 64 | |
| AMD Radeon RX Vega 64 | |
| AMD Radeon RX Vega 64 | |
| AMD Radeon RX Vega 64 | |
| AMD Radeon RX Vega 64 | |
| AMD Radeon RX Vega 64 | |
| Battlefield 1 | |
| 1280x720 Low Preset | |
| AMD Radeon RX Vega 64 | |
| AMD Radeon RX Vega 64 | |
| AMD Radeon RX Vega 64 | |
| AMD Radeon RX Vega 64 | |
| AMD Radeon RX Vega 64 | |
| AMD Radeon RX Vega 64 | |
| AMD Radeon RX Vega 64 | |
| 1920x1080 Ultra Preset AA:T | |
| AMD Radeon RX Vega 64 | |
| AMD Radeon RX Vega 64 | |
| AMD Radeon RX Vega 64 | |
| AMD Radeon RX Vega 64 | |
| AMD Radeon RX Vega 64 | |
| AMD Radeon RX Vega 64 | |
| AMD Radeon RX Vega 64 | |
| Assassin´s Creed Origins | |
| 1280x720 Very Low Preset | |
| AMD Radeon RX Vega 64 | |
| AMD Radeon RX Vega 64 | |
| AMD Radeon RX Vega 64 | |
| AMD Radeon RX Vega 64 | |
| AMD Radeon RX Vega 64 | |
| AMD Radeon RX Vega 64 | |
| AMD Radeon RX Vega 64 | |
| 1920x1080 Ultra High Preset | |
| AMD Radeon RX Vega 64 | |
| AMD Radeon RX Vega 64 | |
| AMD Radeon RX Vega 64 | |
| AMD Radeon RX Vega 64 | |
| AMD Radeon RX Vega 64 | |
| AMD Radeon RX Vega 64 | |
| AMD Radeon RX Vega 64 | |
| Final Fantasy XV Benchmark | |
| 1280x720 Lite Quality | |
| AMD Radeon RX Vega 64 | |
| AMD Radeon RX Vega 64 | |
| AMD Radeon RX Vega 64 | |
| AMD Radeon RX Vega 64 | |
| AMD Radeon RX Vega 64 | |
| AMD Radeon RX Vega 64 | |
| AMD Radeon RX Vega 64 | |
| 1920x1080 High Quality | |
| AMD Radeon RX Vega 64 | |
| AMD Radeon RX Vega 64 | |
| AMD Radeon RX Vega 64 | |
| AMD Radeon RX Vega 64 | |
| AMD Radeon RX Vega 64 | |
| AMD Radeon RX Vega 64 | |
| AMD Radeon RX Vega 64 | |
| AMD Radeon RX Vega 64 | |
| Far Cry 5 | |
| 1280x720 Low Preset AA:T | |
| AMD Radeon RX Vega 64 | |
| AMD Radeon RX Vega 64 | |
| AMD Radeon RX Vega 64 | |
| AMD Radeon RX Vega 64 | |
| AMD Radeon RX Vega 64 | |
| AMD Radeon RX Vega 64 | |
| AMD Radeon RX Vega 64 | |
| 1920x1080 Ultra Preset AA:T | |
| AMD Radeon RX Vega 64 | |
| AMD Radeon RX Vega 64 | |
| AMD Radeon RX Vega 64 | |
| AMD Radeon RX Vega 64 | |
| AMD Radeon RX Vega 64 | |
| AMD Radeon RX Vega 64 | |
| AMD Radeon RX Vega 64 | |
| Shadow of the Tomb Raider | |
| 1280x720 Lowest Preset | |
| AMD Radeon RX Vega 64 | |
| AMD Radeon RX Vega 64 | |
| AMD Radeon RX Vega 64 | |
| AMD Radeon RX Vega 64 | |
| 1920x1080 Highest Preset AA:T | |
| AMD Radeon RX Vega 64 | |
| AMD Radeon RX Vega 64 | |
| AMD Radeon RX Vega 64 | |
| AMD Radeon RX Vega 64 | |
| Forza Horizon 4 | |
| 1280x720 Very Low Preset | |
| AMD Radeon RX Vega 64 | |
| AMD Radeon RX Vega 64 | |
| AMD Radeon RX Vega 64 | |
| AMD Radeon RX Vega 64 | |
| 1920x1080 Ultra Preset AA:2xMS | |
| AMD Radeon RX Vega 64 | |
| AMD Radeon RX Vega 64 | |
| AMD Radeon RX Vega 64 | |
| AMD Radeon RX Vega 64 | |
| Assassin´s Creed Odyssey | |
| 1280x720 Low Preset | |
| AMD Radeon RX Vega 64 | |
| AMD Radeon RX Vega 64 | |
| AMD Radeon RX Vega 64 | |
| AMD Radeon RX Vega 64 | |
| 1920x1080 Ultra High Preset | |
| AMD Radeon RX Vega 64 | |
| AMD Radeon RX Vega 64 | |
| AMD Radeon RX Vega 64 | |
| AMD Radeon RX Vega 64 | |
The Intel Core i5-8500T & an AMD Radeon RX Vega 64
| low | med. | high | ultra | 4K | |
|---|---|---|---|---|---|
| The Witcher 3 (2015) | 225.9 | 184.4 | 131.9 | 77.7 | 46.2 |
| Rise of the Tomb Raider (2016) | 221.6 | 190.1 | 122.2 | 96.6 | 48.7 |
| Battlefield 1 (2016) | 196 | 181.4 | 163 | 146 | 65 |
| Assassin´s Creed Origins (2017) | 80 | 74 | 72 | 66 | 35 |
| Final Fantasy XV Benchmark (2018) | 68.1 | 61.2 | 54.5 | 27.9 | |
| Far Cry 5 (2018) | 124 | 110 | 104 | 98 | 45 |
| Shadow of the Tomb Raider (2018) | 155 | 111 | 103 | 91 | 32 |
| Forza Horizon 4 (2018) | 203 | 167 | 160 | 131 | 68 |
| Assassin´s Creed Odyssey (2018) | 79 | 72 | 66 | 50 | 29 |
The Intel Core i7-8700K & an AMD Radeon RX Vega 64
| low | med. | high | ultra | 4K | |
|---|---|---|---|---|---|
| The Witcher 3 (2015) | 284.8 | 228.5 | 136.9 | 79.4 | 49.8 |
| Rise of the Tomb Raider (2016) | 281.7 | 196.4 | 120.9 | 99 | 50.2 |
| Battlefield 1 (2016) | 200 | 200 | 167.6 | 147.7 | 65.8 |
| Assassin´s Creed Origins (2017) | 84 | 77 | 76 | 67 | 35 |
| Final Fantasy XV Benchmark (2018) | 164.4 | 91.4 | 61.4 | 28.1 | |
| Far Cry 5 (2018) | 144 | 124 | 118 | 111 | 46 |
| Shadow of the Tomb Raider (2018) | 188 | 115 | 104 | 91 | 32 |
| Forza Horizon 4 (2018) | 234 | 171 | 162 | 131 | 68 |
| Assassin´s Creed Odyssey (2018) | 92 | 83 | 81 | 51 | 29 |
Application Performance
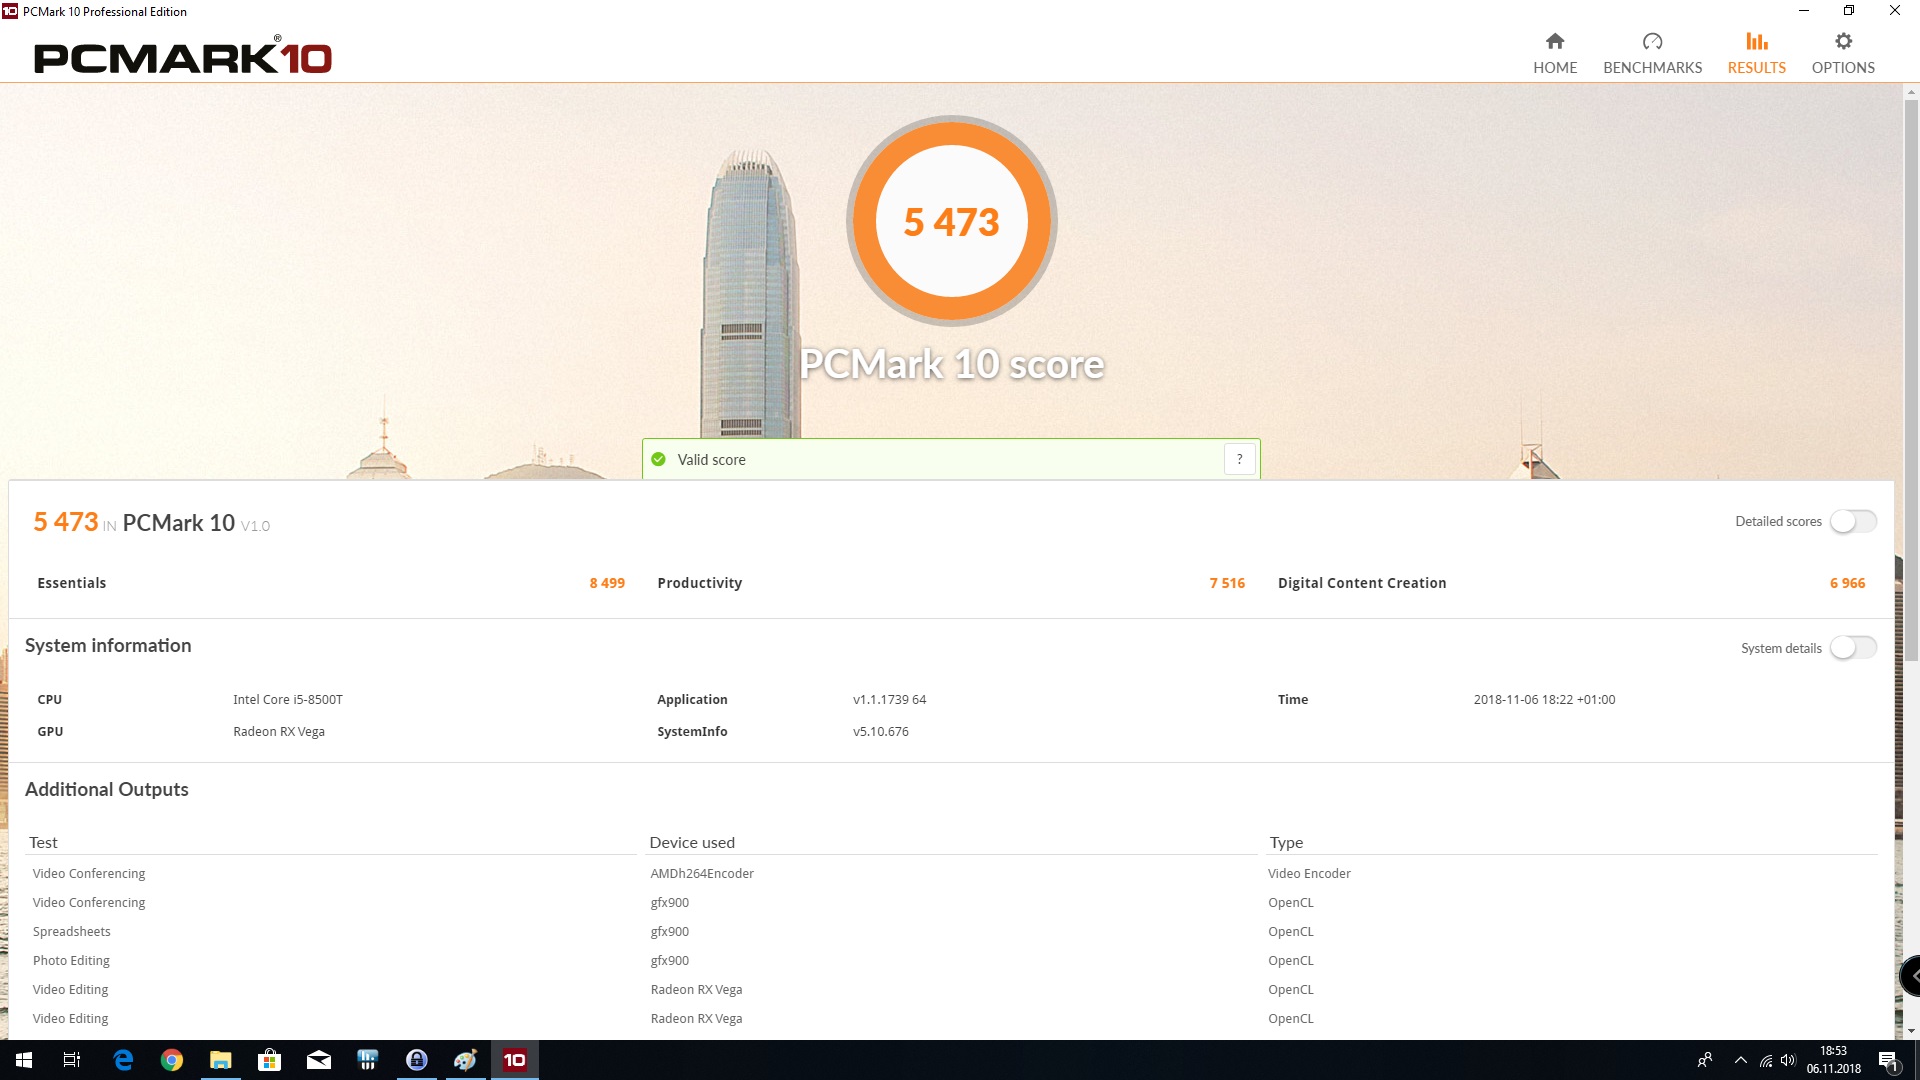
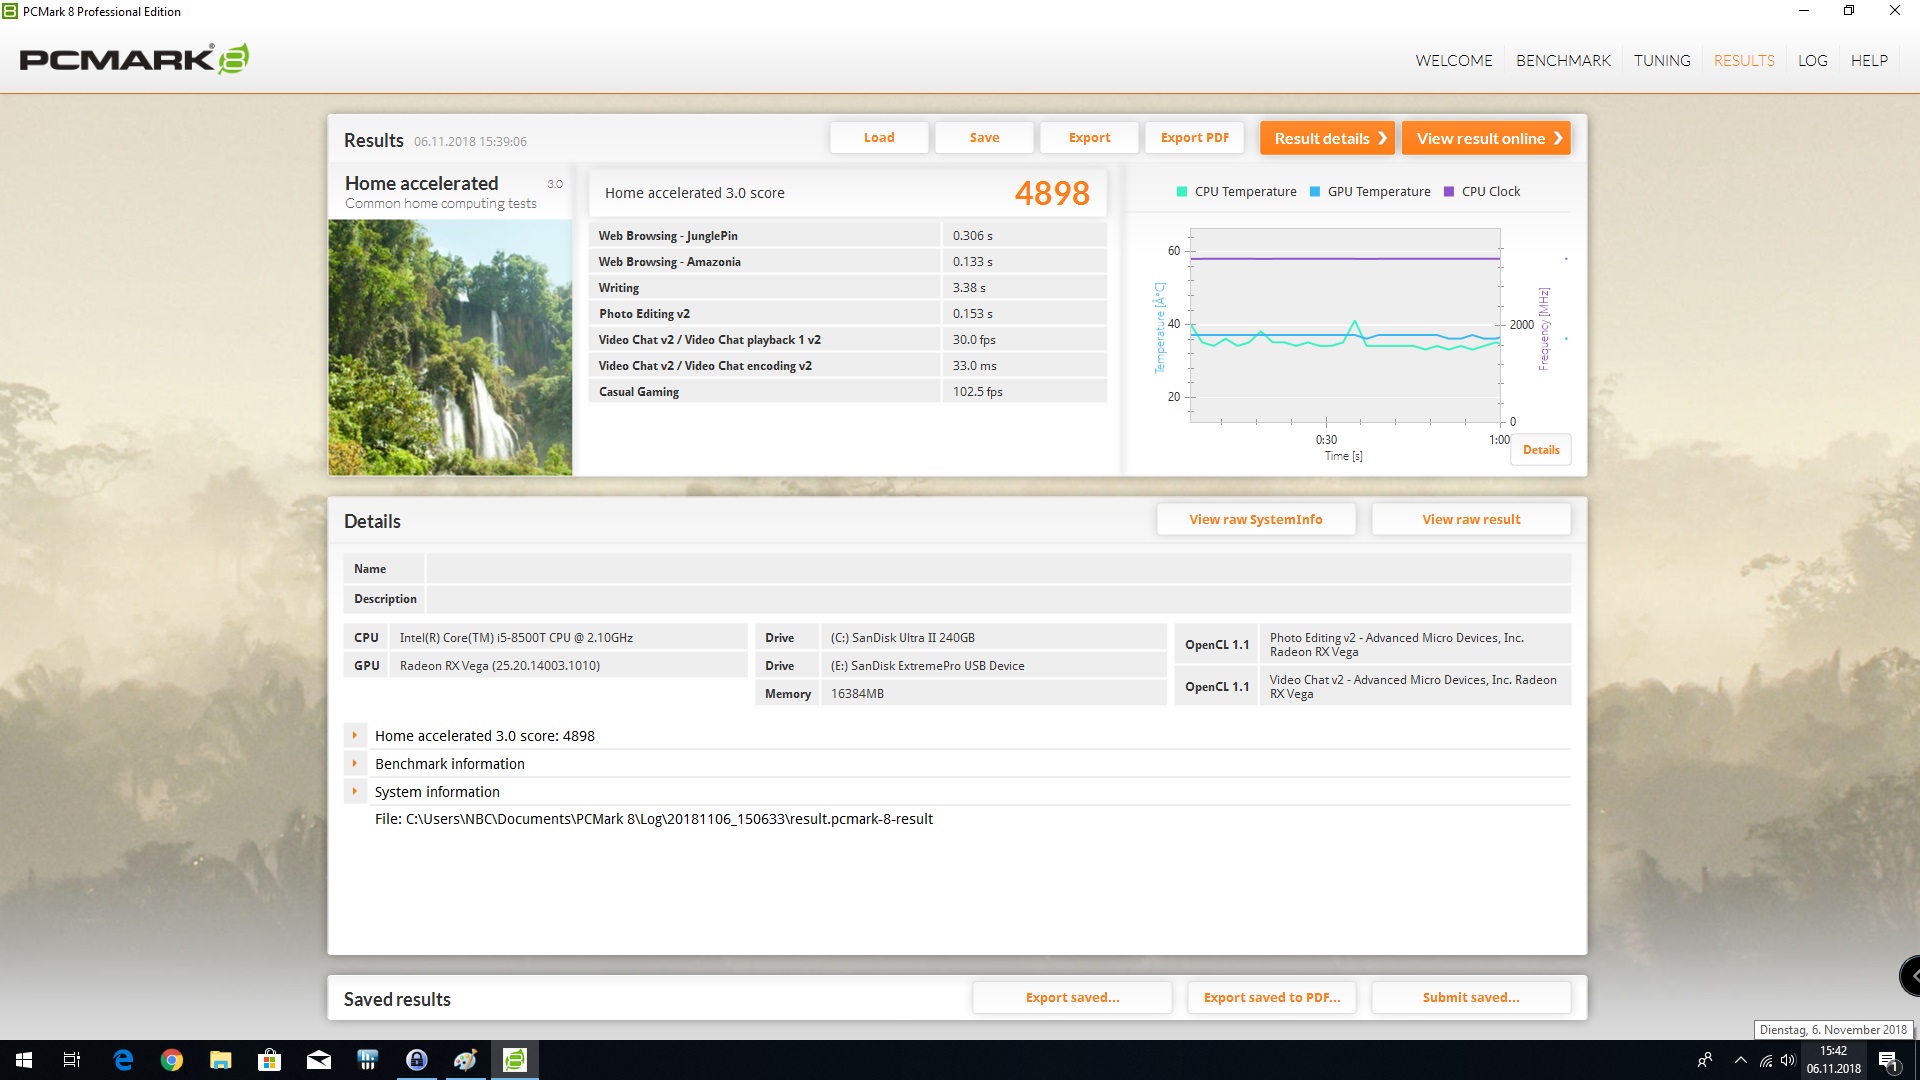
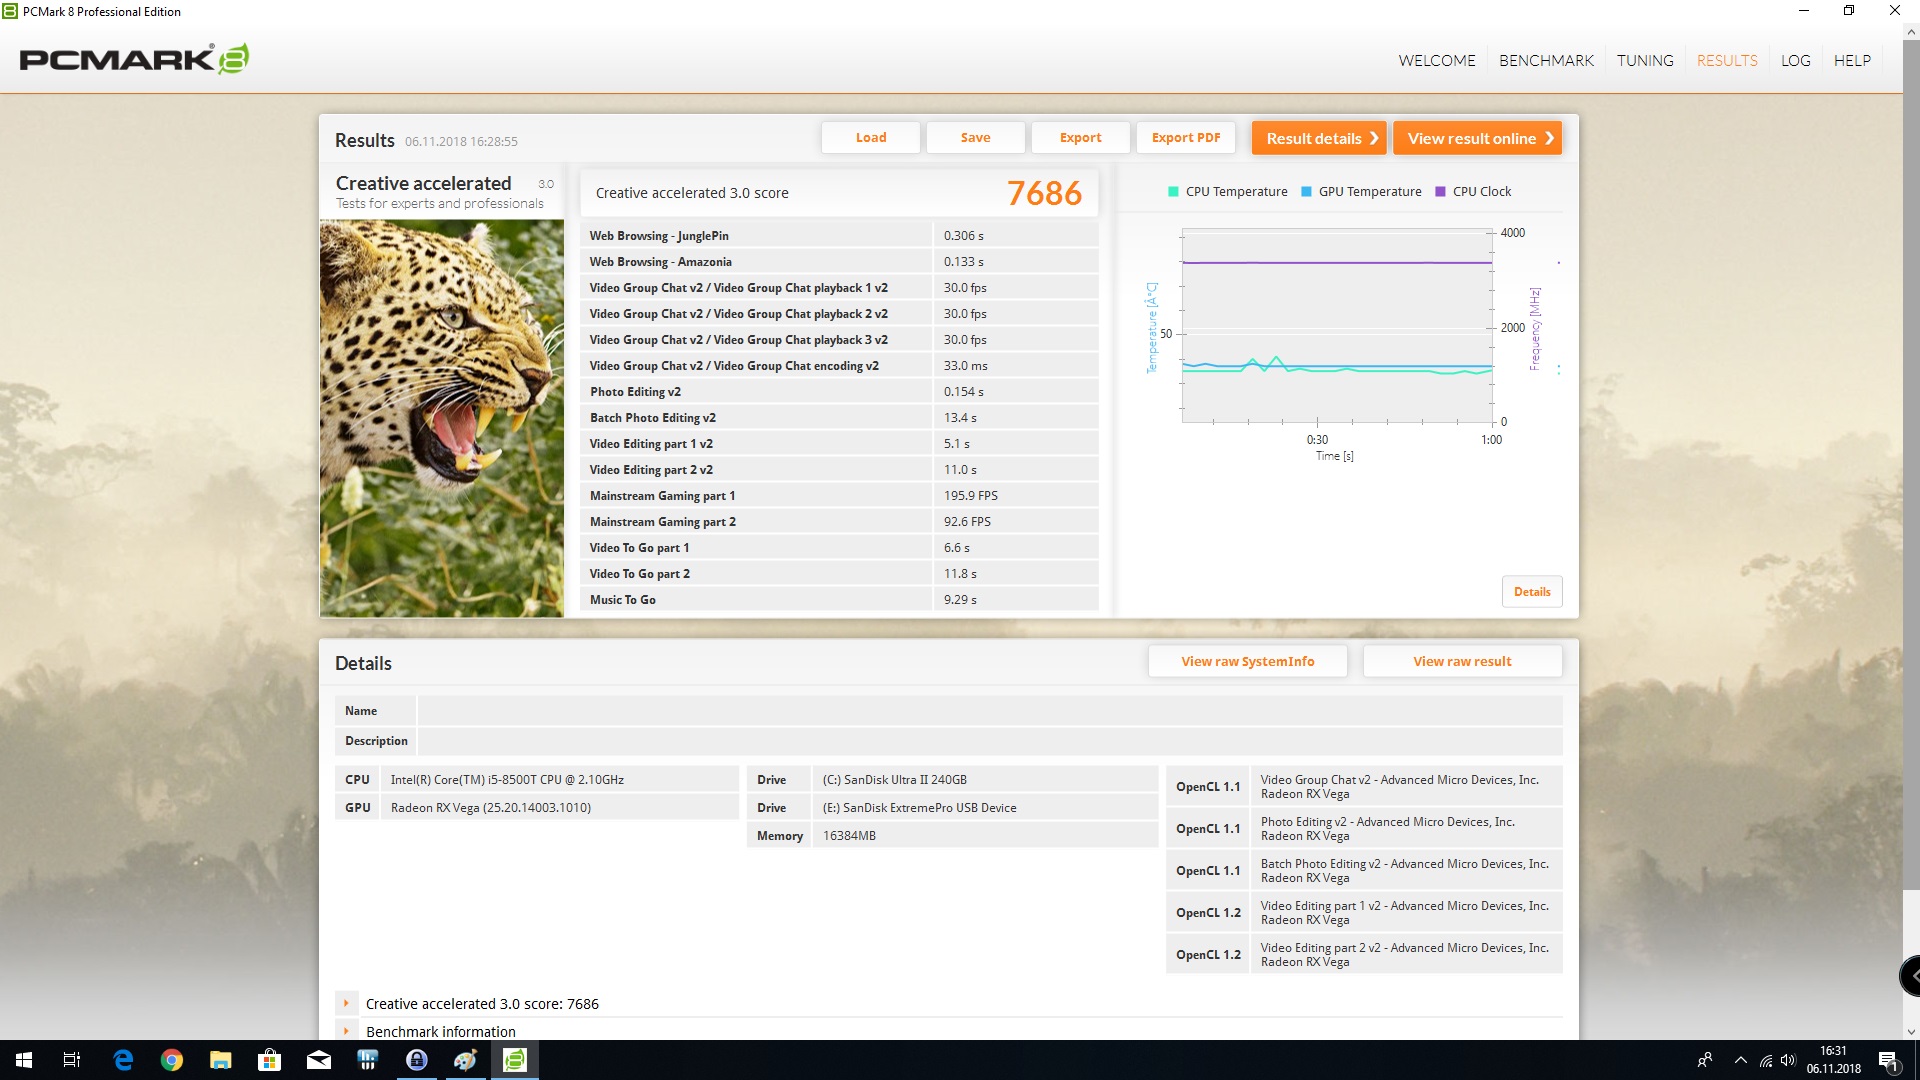
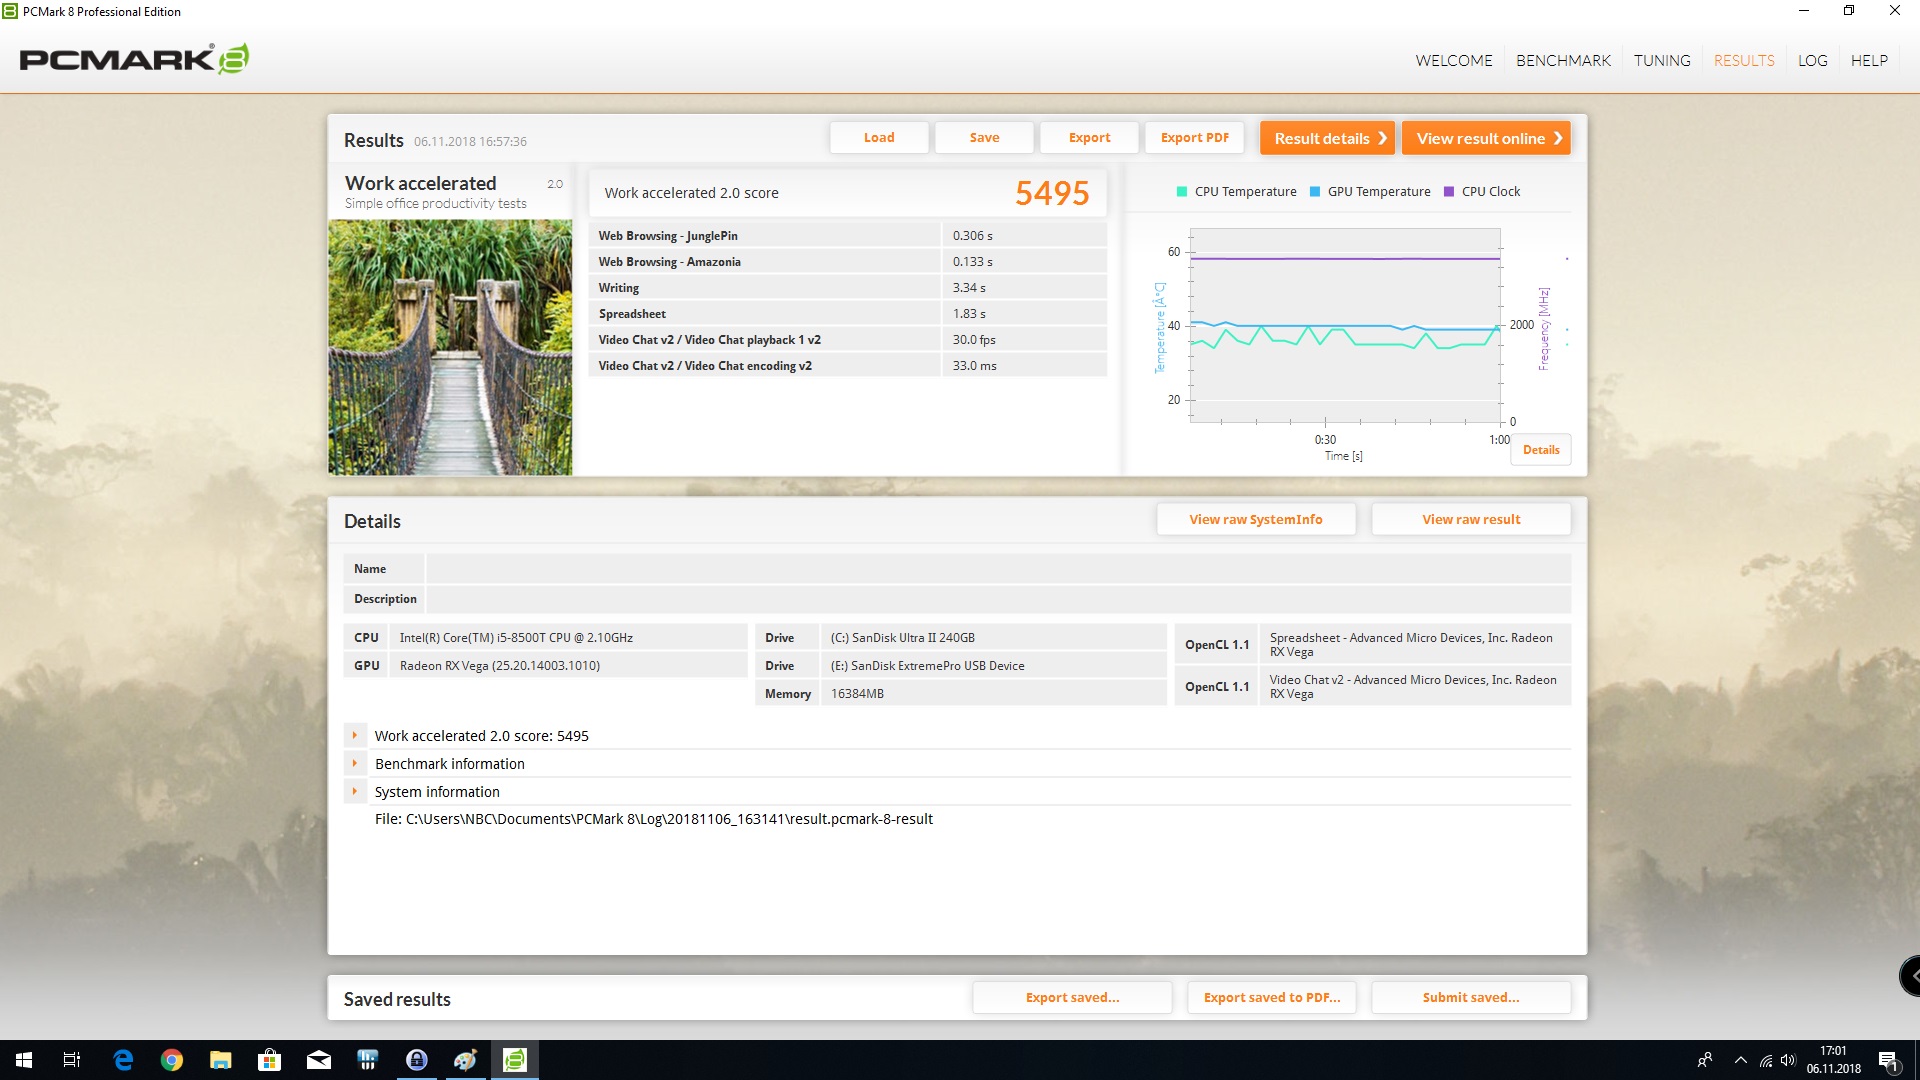
The Core i5-8500T consistently outscored the Ryzen 5 2400G and the Ryzen 3 2200G in PCMark benchmarks, while the Intel chip outscored all the new Ryzen APUs in PCMark 8 Work v2 and Home v2 benchmarks. The Ryzen 5 2600 generally finished higher in our PCMark comparison tables primarily because it can use AMD SMT to execute up to twelve threads simultaneously. The higher thread count ensures that the Ryzen 5 2600 has better system performance than the Core i5-8500T.
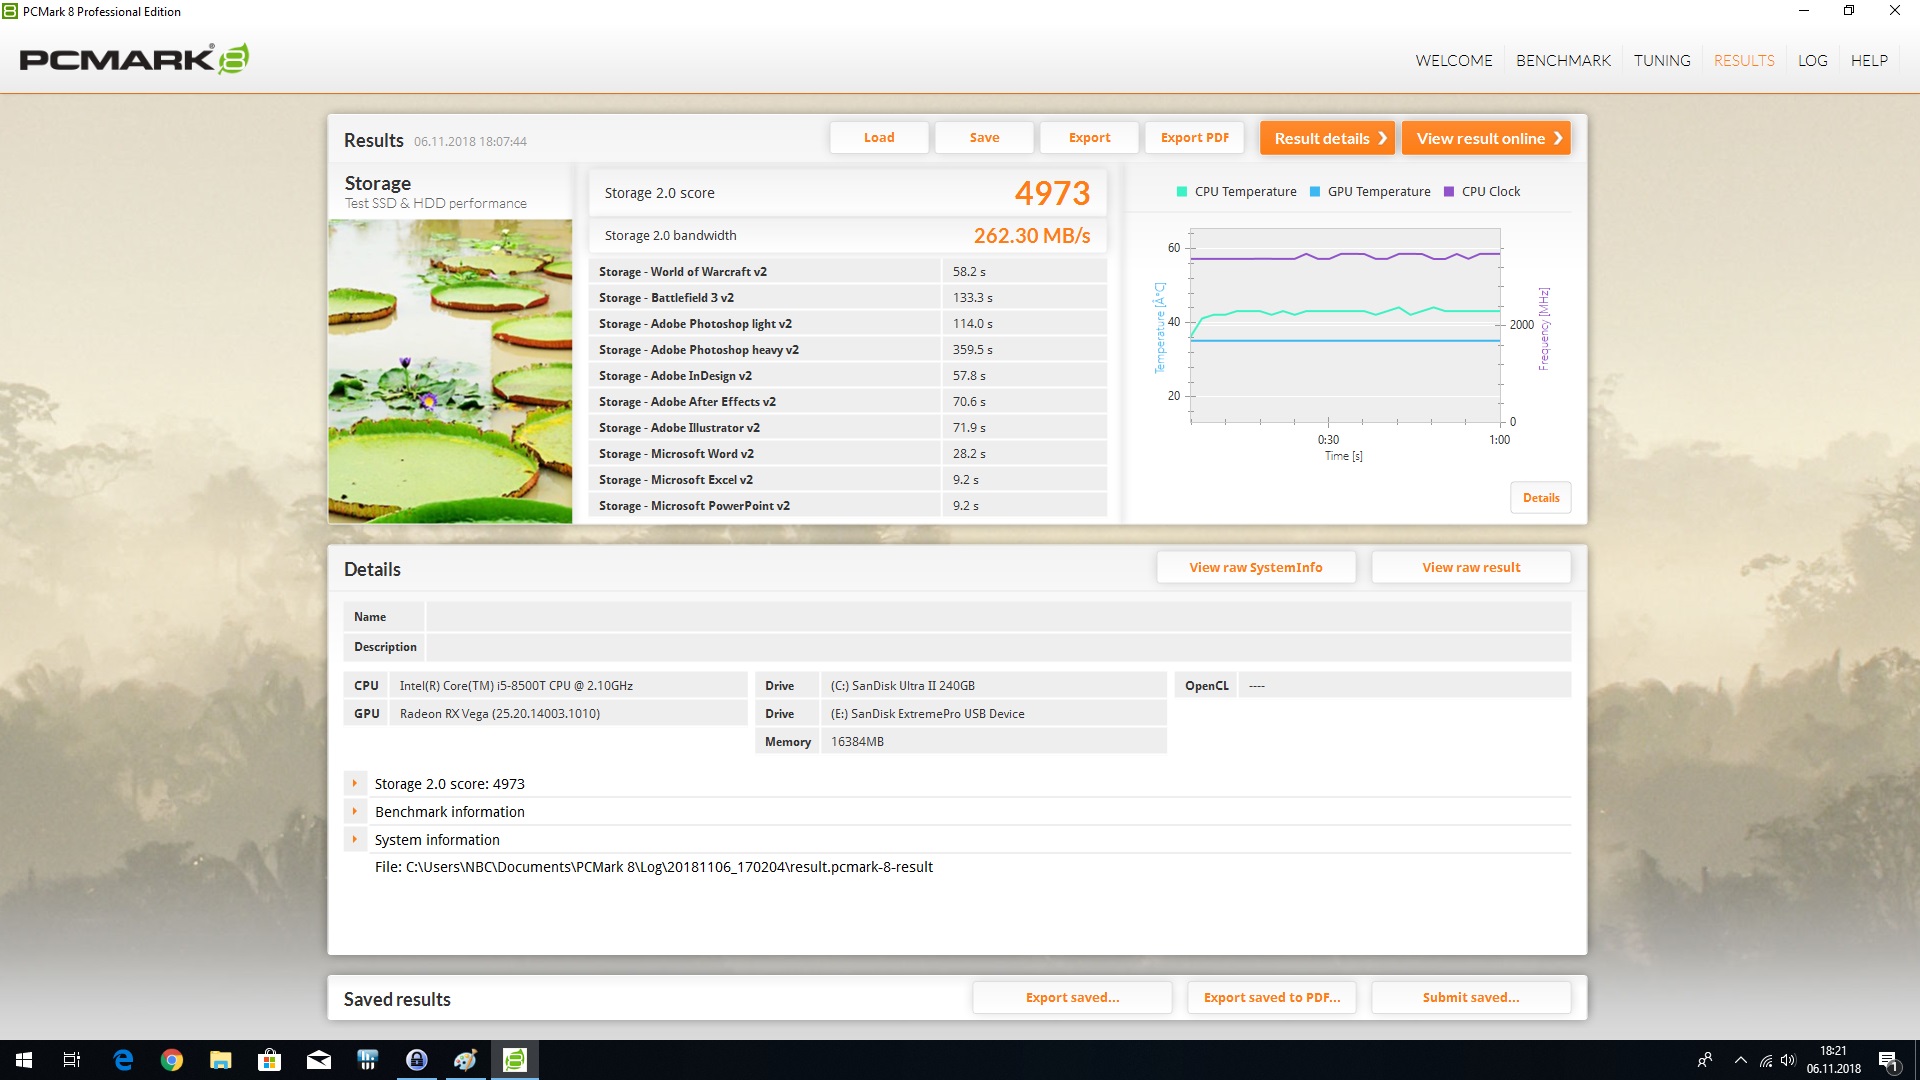
Our test system performed solidly in daily use with no significant latencies. We could only equip our system with a SATA SSD, which somewhat limited the system performance. An NVMe SSD would have improved PCMark benchmark scores. The Core i5-8500T is powerful enough for normal office tasks and browsing the internet. The integrated UHD Graphics 630 also helps reduce CPU usage by taking over for tasks like video streaming. The UHD Graphics 630 supports the Google VP9 codec and the HDCP 2.2 codec, the latter of which can decode 4K videos in Windows 10.
| PCMark 10 - Score | |
| AMD Ryzen 7 2700X | |
| AMD Ryzen 5 2600X | |
| Intel Core i9-9900K | |
| AMD Ryzen 7 2700 | |
| AMD Ryzen 5 2600 | |
| Intel Core i5-8500T | |
| AMD Ryzen 5 2400G | |
| AMD Ryzen 3 2200G | |
Emissions
The T-series chips generally score highly for their energy efficiency, a trend which Intel has continued with the Core i5-8500T. We must point out that our comparison tables below are the power consumption for our test systems and not just the processor. We did not include a dedicated GPU with our Ryzen 3 2200G and Ryzen 5 2400G test systems, which is why they appear to be significantly more power efficient than our Core i5-8500T test system.
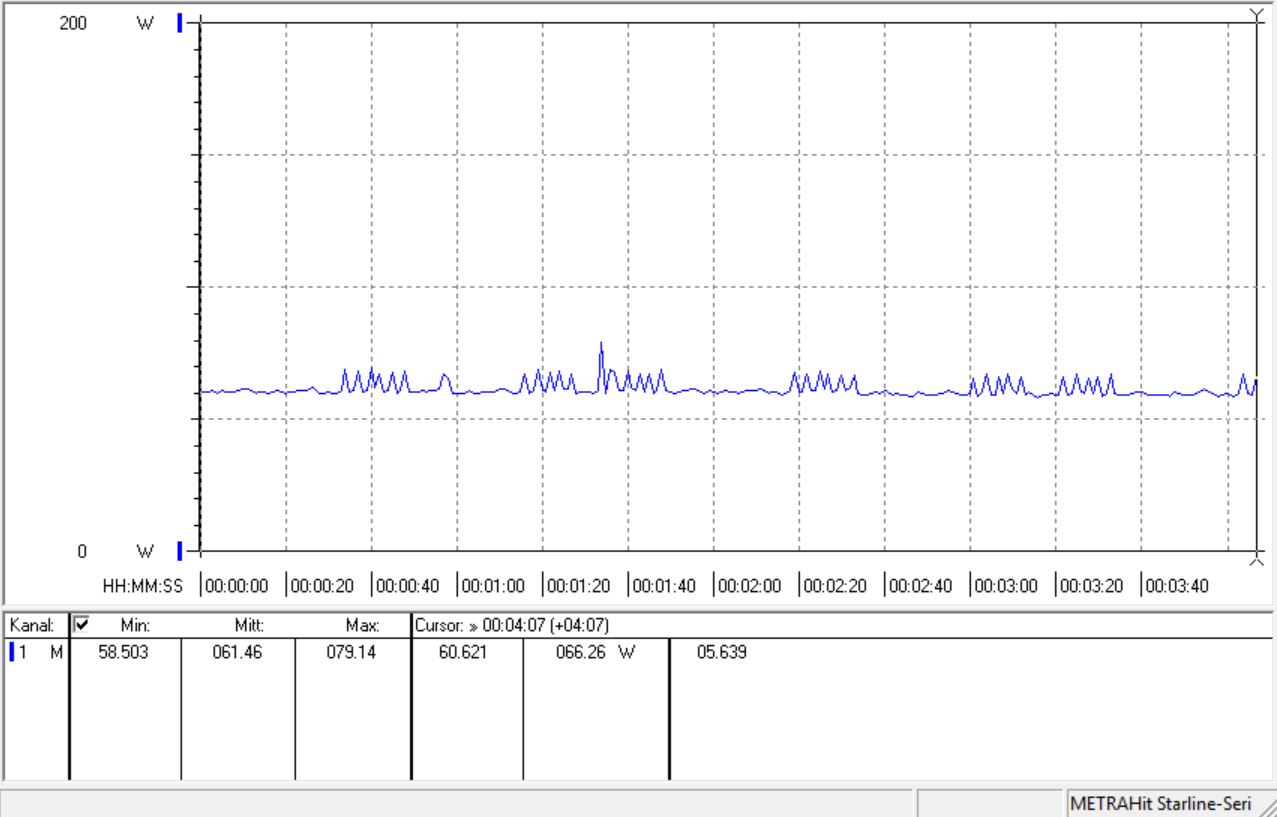
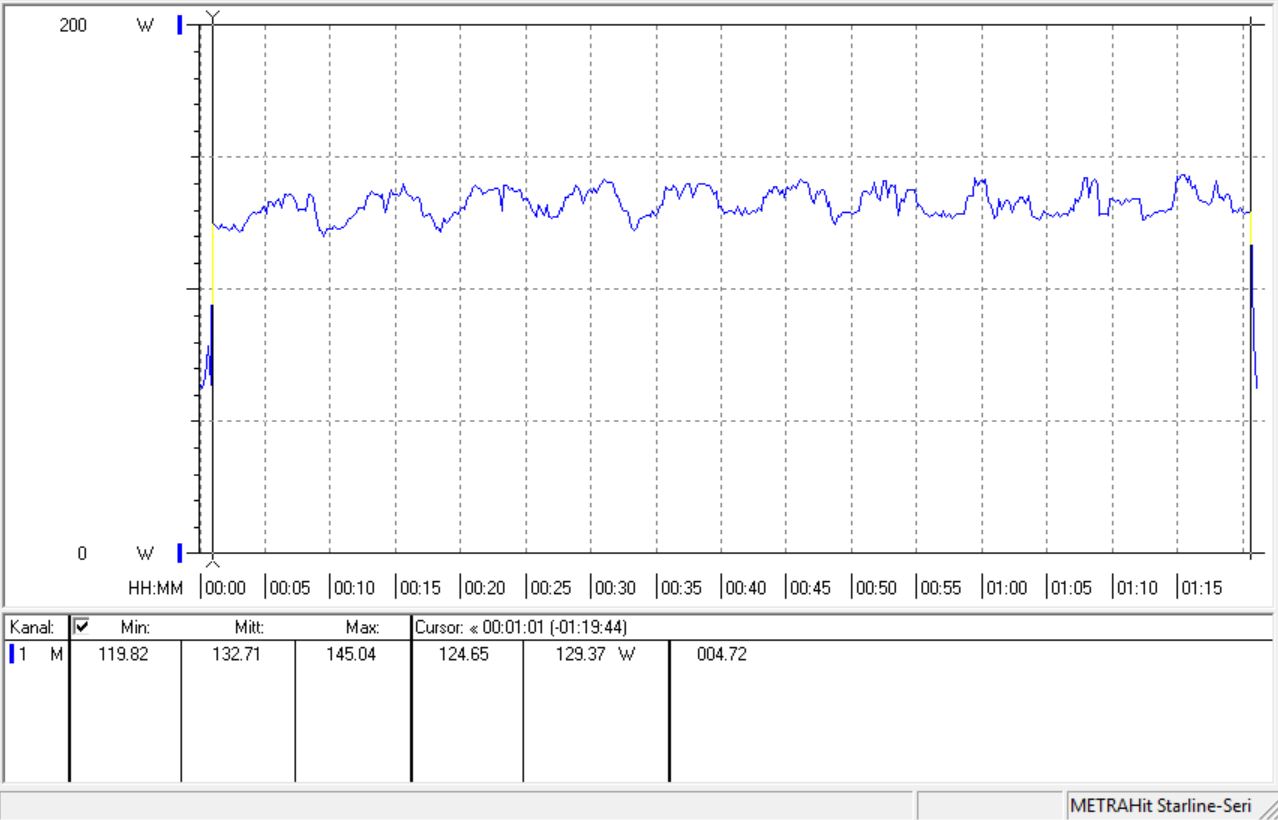
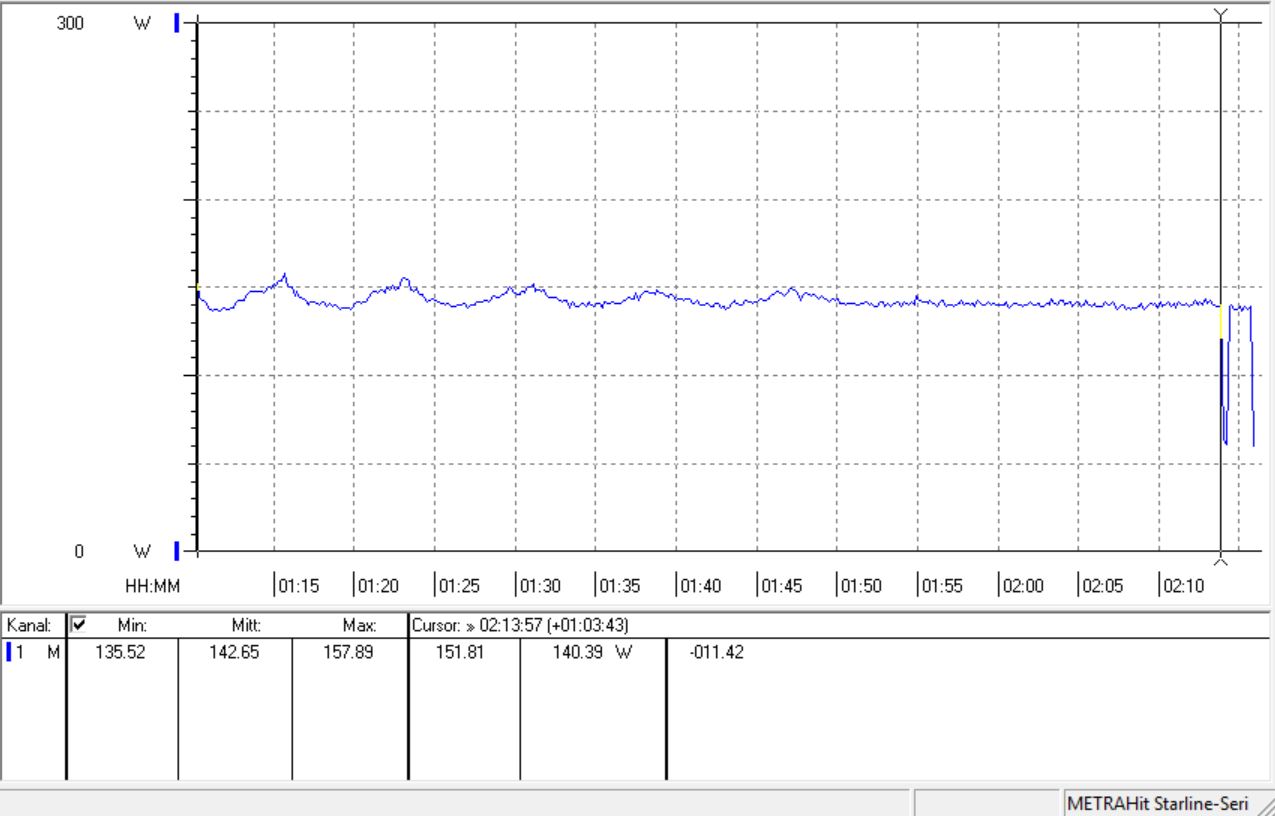
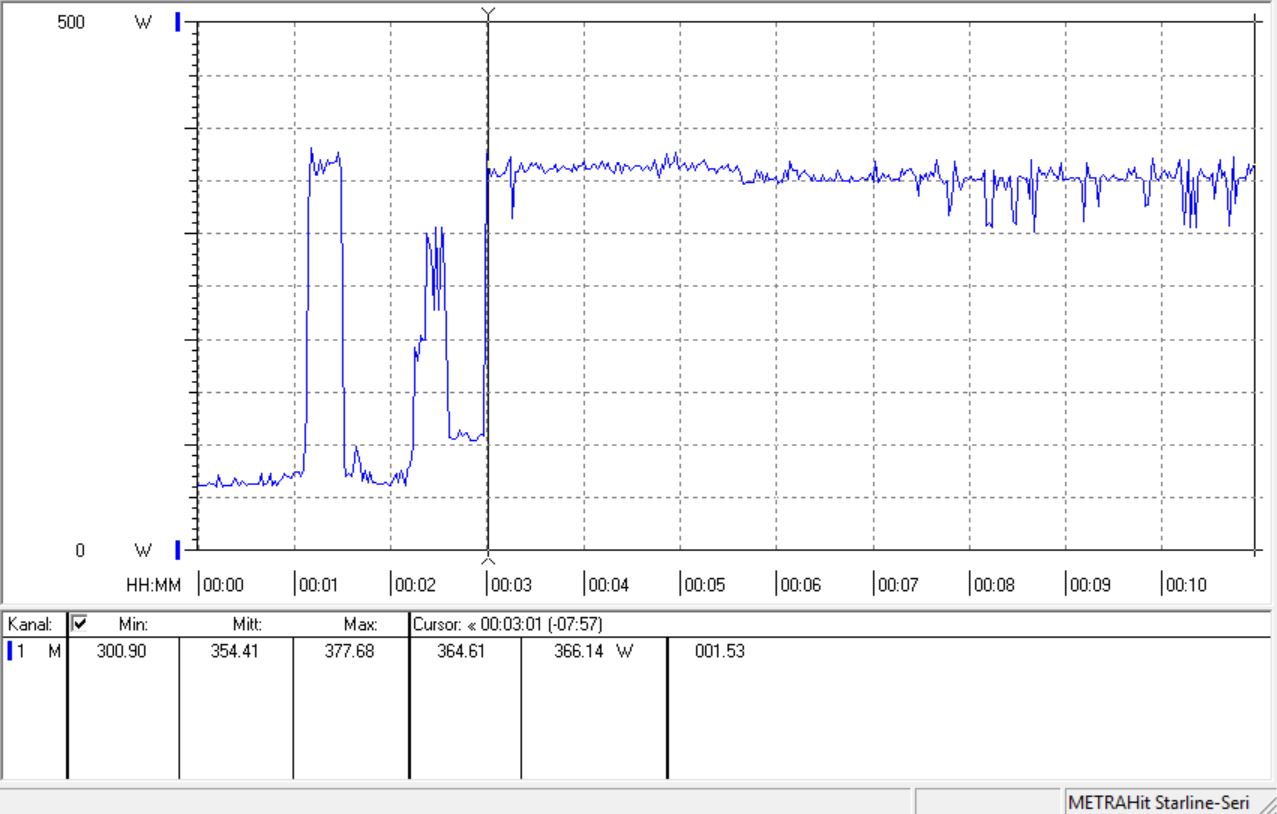
The Core i5-8500T powered test system idles at around 64 W, which is 4 W more than what the Core i7-8700K achieves in the same test system. As expected, the latter consumes more under load, but amazingly the Core i5-8500T consumes significantly more than 35 W during a Prime95 stress test. According to Intel Extreme Utility (XTU), our test processor consumes up to 57 W, while it also averaged 42.5 W in our loop of the Cinebench R15 multi-core benchmark. The BIOS settings allow the CPU to exceed its rated TDP limit should it need to. Likewise, the BIOS can restrict the processor to its 35-W limit, but this will correspond with reduced performance.
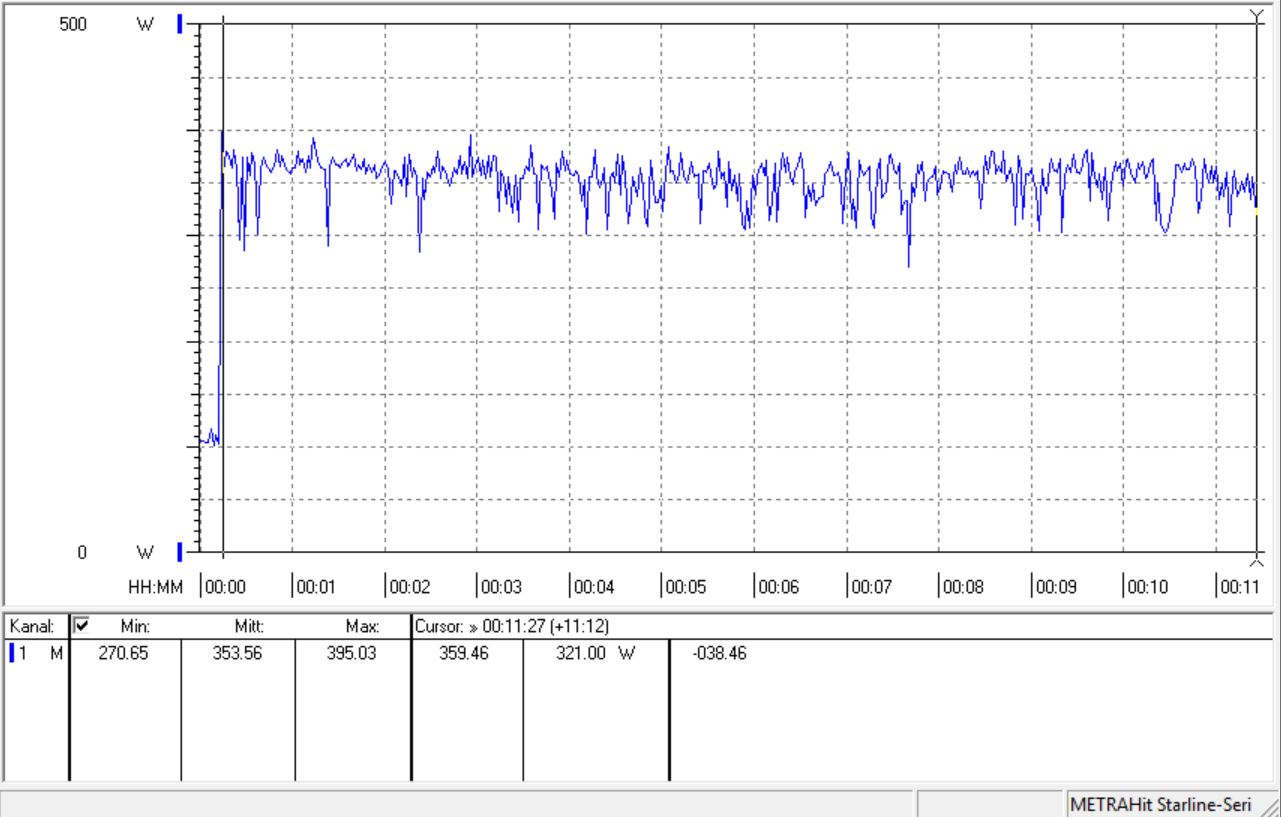
This is not a deceptive move by Intel as the Core i5-8500T provides a better energy balance than its Core i7 counterpart. The two CPUs consume up to 354 W in our test system, but the AMD Radeon RX Vega 64 consumes a large share of this.
Overall, the Core i5-8500T is flexible enough to create an efficient and quiet system, particularly as users can set the TDP down to 25 W. The processor is so frugal that a system could be passively cooled with the right cooler.
Power Consumption – Intel Core i5-8500T
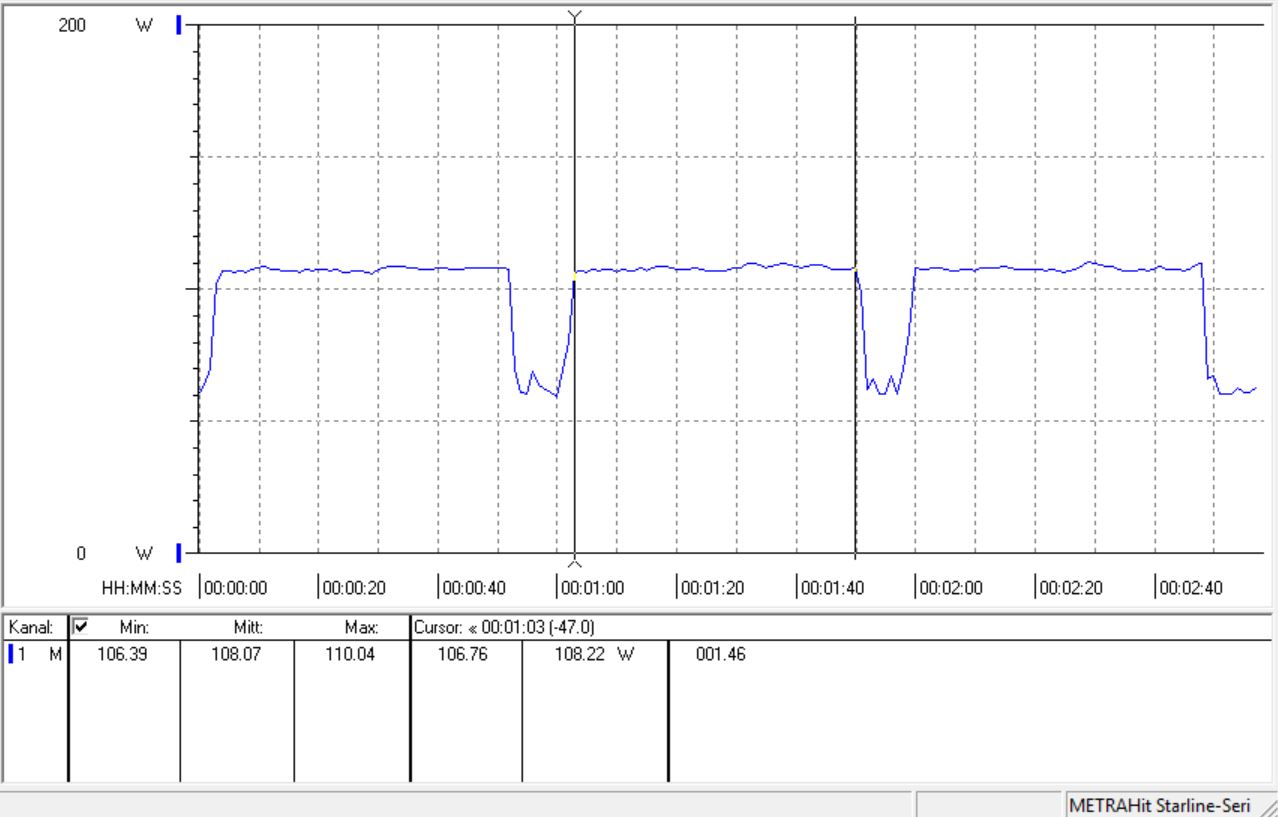
Power consumption - Intel Core i7-8700K
| Power Consumption | |
| Cinebench R15 Multi (external Monitor) | |
| AMD Ryzen 7 2700X (Idle: 74.3 W) | |
| Intel Core i9-9900K | |
| AMD Ryzen 5 2600X | |
| AMD Ryzen 5 2600 | |
| AMD Ryzen 7 2700 | |
| Intel Core i7-8700K | |
| Intel Core i5-8500T | |
| AMD Ryzen 5 2400G (Idle: 23.5 W) | |
| AMD Ryzen 3 2200G (Idle: 22.7 W) | |
| Prime95 V2810 Stress (external Monitor) | |
| AMD Ryzen 7 2700X (Idle: 74.3 W) | |
| Intel Core i9-9900K | |
| AMD Ryzen 5 2600X (Idle: 71.3 W) | |
| AMD Ryzen 5 2600 | |
| Intel Core i7-8700K | |
| AMD Ryzen 7 2700 | |
| Intel Core i5-8500T | |
| AMD Ryzen 5 2400G (Idle: 23.5 W) | |
| AMD Ryzen 3 2200G (Idle: 22.7 W) | |
| 1920x1080 The Witcher 3 ultra (external Monitor) | |
| AMD Ryzen 5 2600X | |
| AMD Ryzen 7 2700X (Idle: 74.3 W) | |
| AMD Ryzen 5 2600 | |
| AMD Ryzen 7 2700 | |
| Intel Core i9-9900K (80 fps) | |
| Intel Core i7-8700K | |
| Intel Core i5-8500T | |
| AMD Ryzen 5 2400G (13 fps, Idle: 23.5 W) | |
| AMD Ryzen 3 2200G (12 fps, Idle: 22.7 W) | |
* ... smaller is better
Overclocking
It is not possible to overclock the Intel Core i5-8500T because it does not have an unlocked multiplier. Intel only allows users to overclock its K processors.
Verdict
The Intel Core i5-8500T is a 6-core processor that would be a great basis for a powerful office computer or a small living room PC. Intel has integrated a UHD Graphics 630 too, which means that users will only need a dedicated GPU if they want to play games. Please be aware that the Core i5-8500T will only work with an Intel 300 series chipset motherboard.
The 35-W TDP that Intel states is a theoretical value, which our test CPU consistently exceed during our tests when left at “auto” settings. The Core i5-8500T can even operate below its TDP, but users will first need to set this within the BIOS. In short, the CPU is efficient enough to be passively cooled.
The Core i5-8500T is suitable for numerous tasks thanks to its power-efficient design. Users could even pair the CPU with a powerful GPU for some gaming, even though Intel does not market the Core i5-8500T as being suitable for such activities.
With that said, the Core i5-8500T currently costs around €340 (~$386), which is considerably more expensive than comparable AMD APUs. Moreover, The Ryzen 7 2700X, which has 8 cores and 16 threads, currently costs as much as the Core i5-8500T. The APU is rated up to 105 W though, which is almost double the maximum that the Core i5-8500T consumed during our tests.
Unfortunately, Intel pricing has tended to only move upwards recently. The company currently has production issues with certain processors that have prevented it from meeting market demand.

