

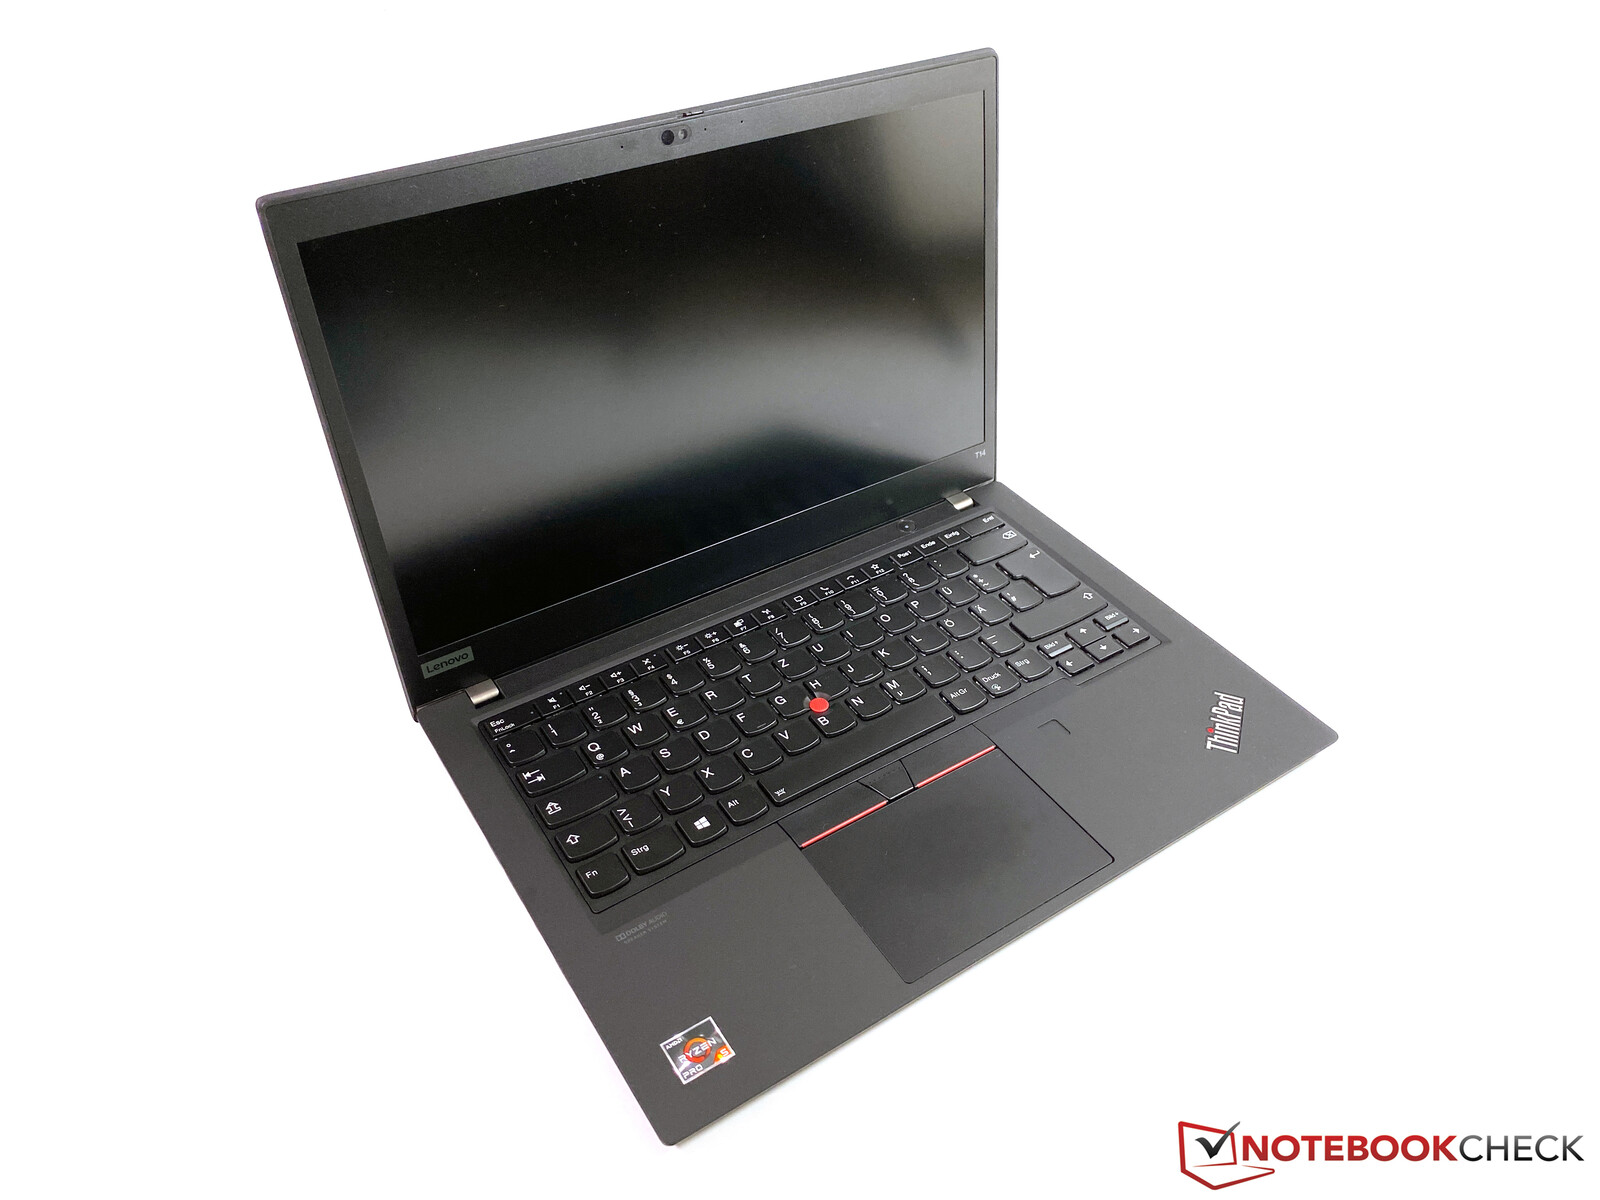
Lenovo ThinkPad T14 AMD Review: Best Business Laptop you can buy?
Lenovo offers its popular business laptop ThinkPad T14 both with Intel as well as AMD processors, and both models now share the same model designation. We have already reviewed the Intel version of the T14, and now we have a closer look at the T14 AMD. Our test unit is an education model with the designation 20UES00H00 for about 1,100 Euros (~$1,308); the corresponding version for regular customers is listed for about 1,300 Euros (~$1,545) in Lenovo's online shop.
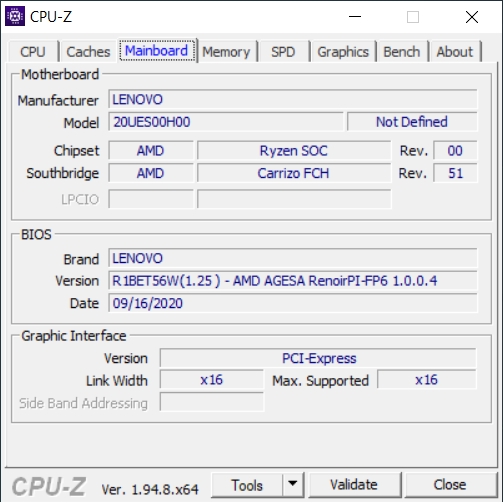
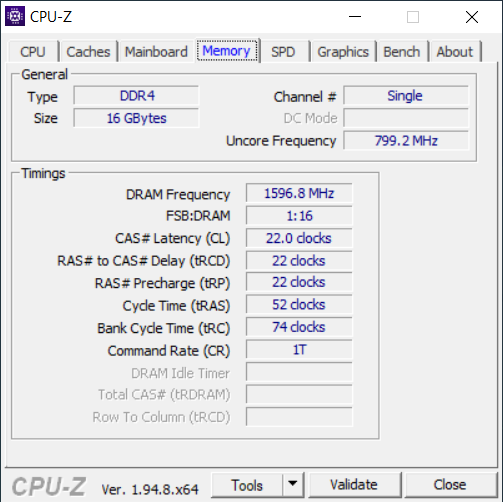
Our test unit is equipped with the AMD Ryzen 5 Pro 4650U, the integrated RX Vega 6, 16 GB RAM (single-channel) and the matte LowPower 1080p screen. The test model is identical to the previously reviewed ThinkPad T14 with the Intel processor, so we want to focus on the differences in terms of performance and the components. Please see our in-depth review of the ThinkPad T14 Intel for more information on the case, the input devices, and the speakers:
Rating | Date | Model | Weight | Height | Size | Resolution | Price |
|---|---|---|---|---|---|---|---|
| 88.9 % v7 (old) | 11 / 2020 | Lenovo ThinkPad T14-20UES00H00 R5 PRO 4650U, Vega 6 | 1.5 kg | 17.9 mm | 14.00" | 1920x1080 | |
| 88 % v7 (old) | 07 / 2020 | Lenovo ThinkPad T14-20S1S06B00 i5-10210U, UHD Graphics 620 | 1.5 kg | 17.9 mm | 14.00" | 1920x1080 | |
| 87.8 % v7 (old) | 11 / 2020 | HP EliteBook 845 G7-23Y60EA R5 PRO 4650U, Vega 6 | 1.5 kg | 17.9 mm | 14.00" | 1920x1080 | |
| 85.3 % v7 (old) | 10 / 2020 | Dell Latitude 14 5410-RJ80D i5-10310U, UHD Graphics 620 | 1.6 kg | 20.7 mm | 14.00" | 1920x1080 | |
| 90.5 % v7 (old) | 08 / 2020 | Lenovo ThinkPad T14s-20UJS00K00 R7 PRO 4750U, Vega 7 | 1.3 kg | 16.1 mm | 14.00" | 1920x1080 | |
| 88.7 % v7 (old) | 09 / 2019 | Lenovo ThinkPad T495-20NKS01Y00 R5 PRO 3500U, Vega 8 | 1.5 kg | 18.9 mm | 14.00" | 1920x1080 |
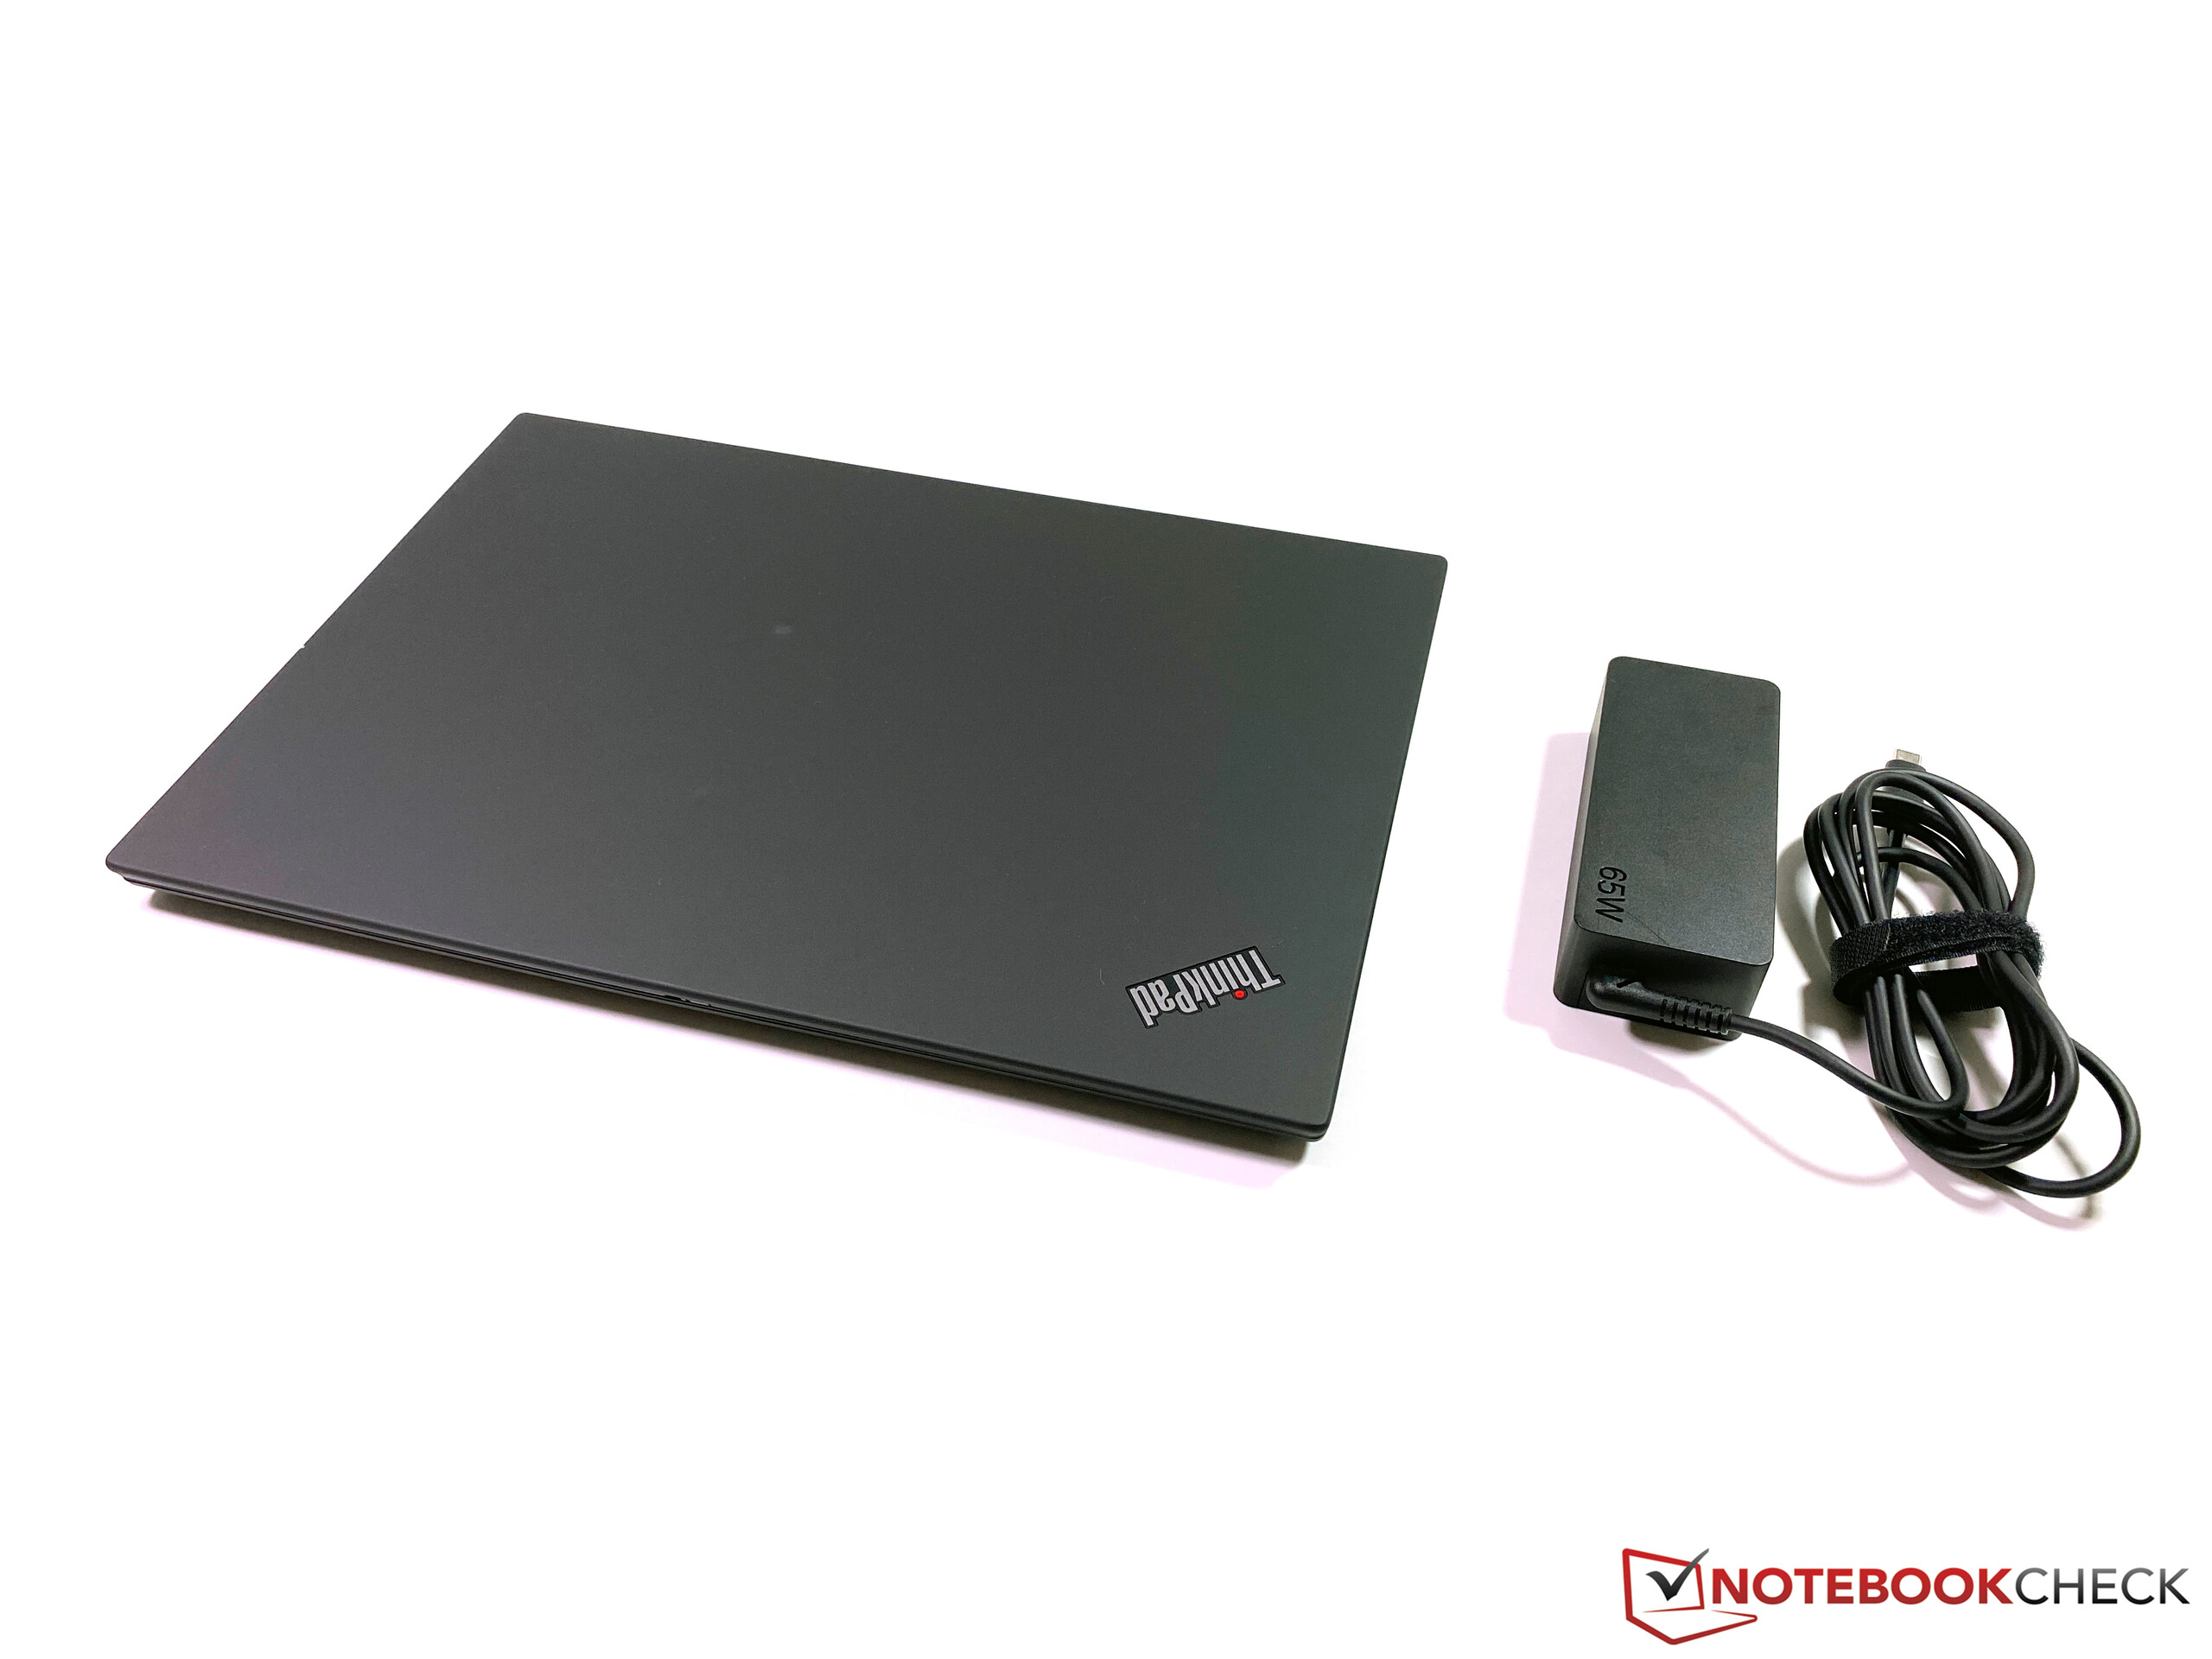
Case - AMD and Intel T14 are identical
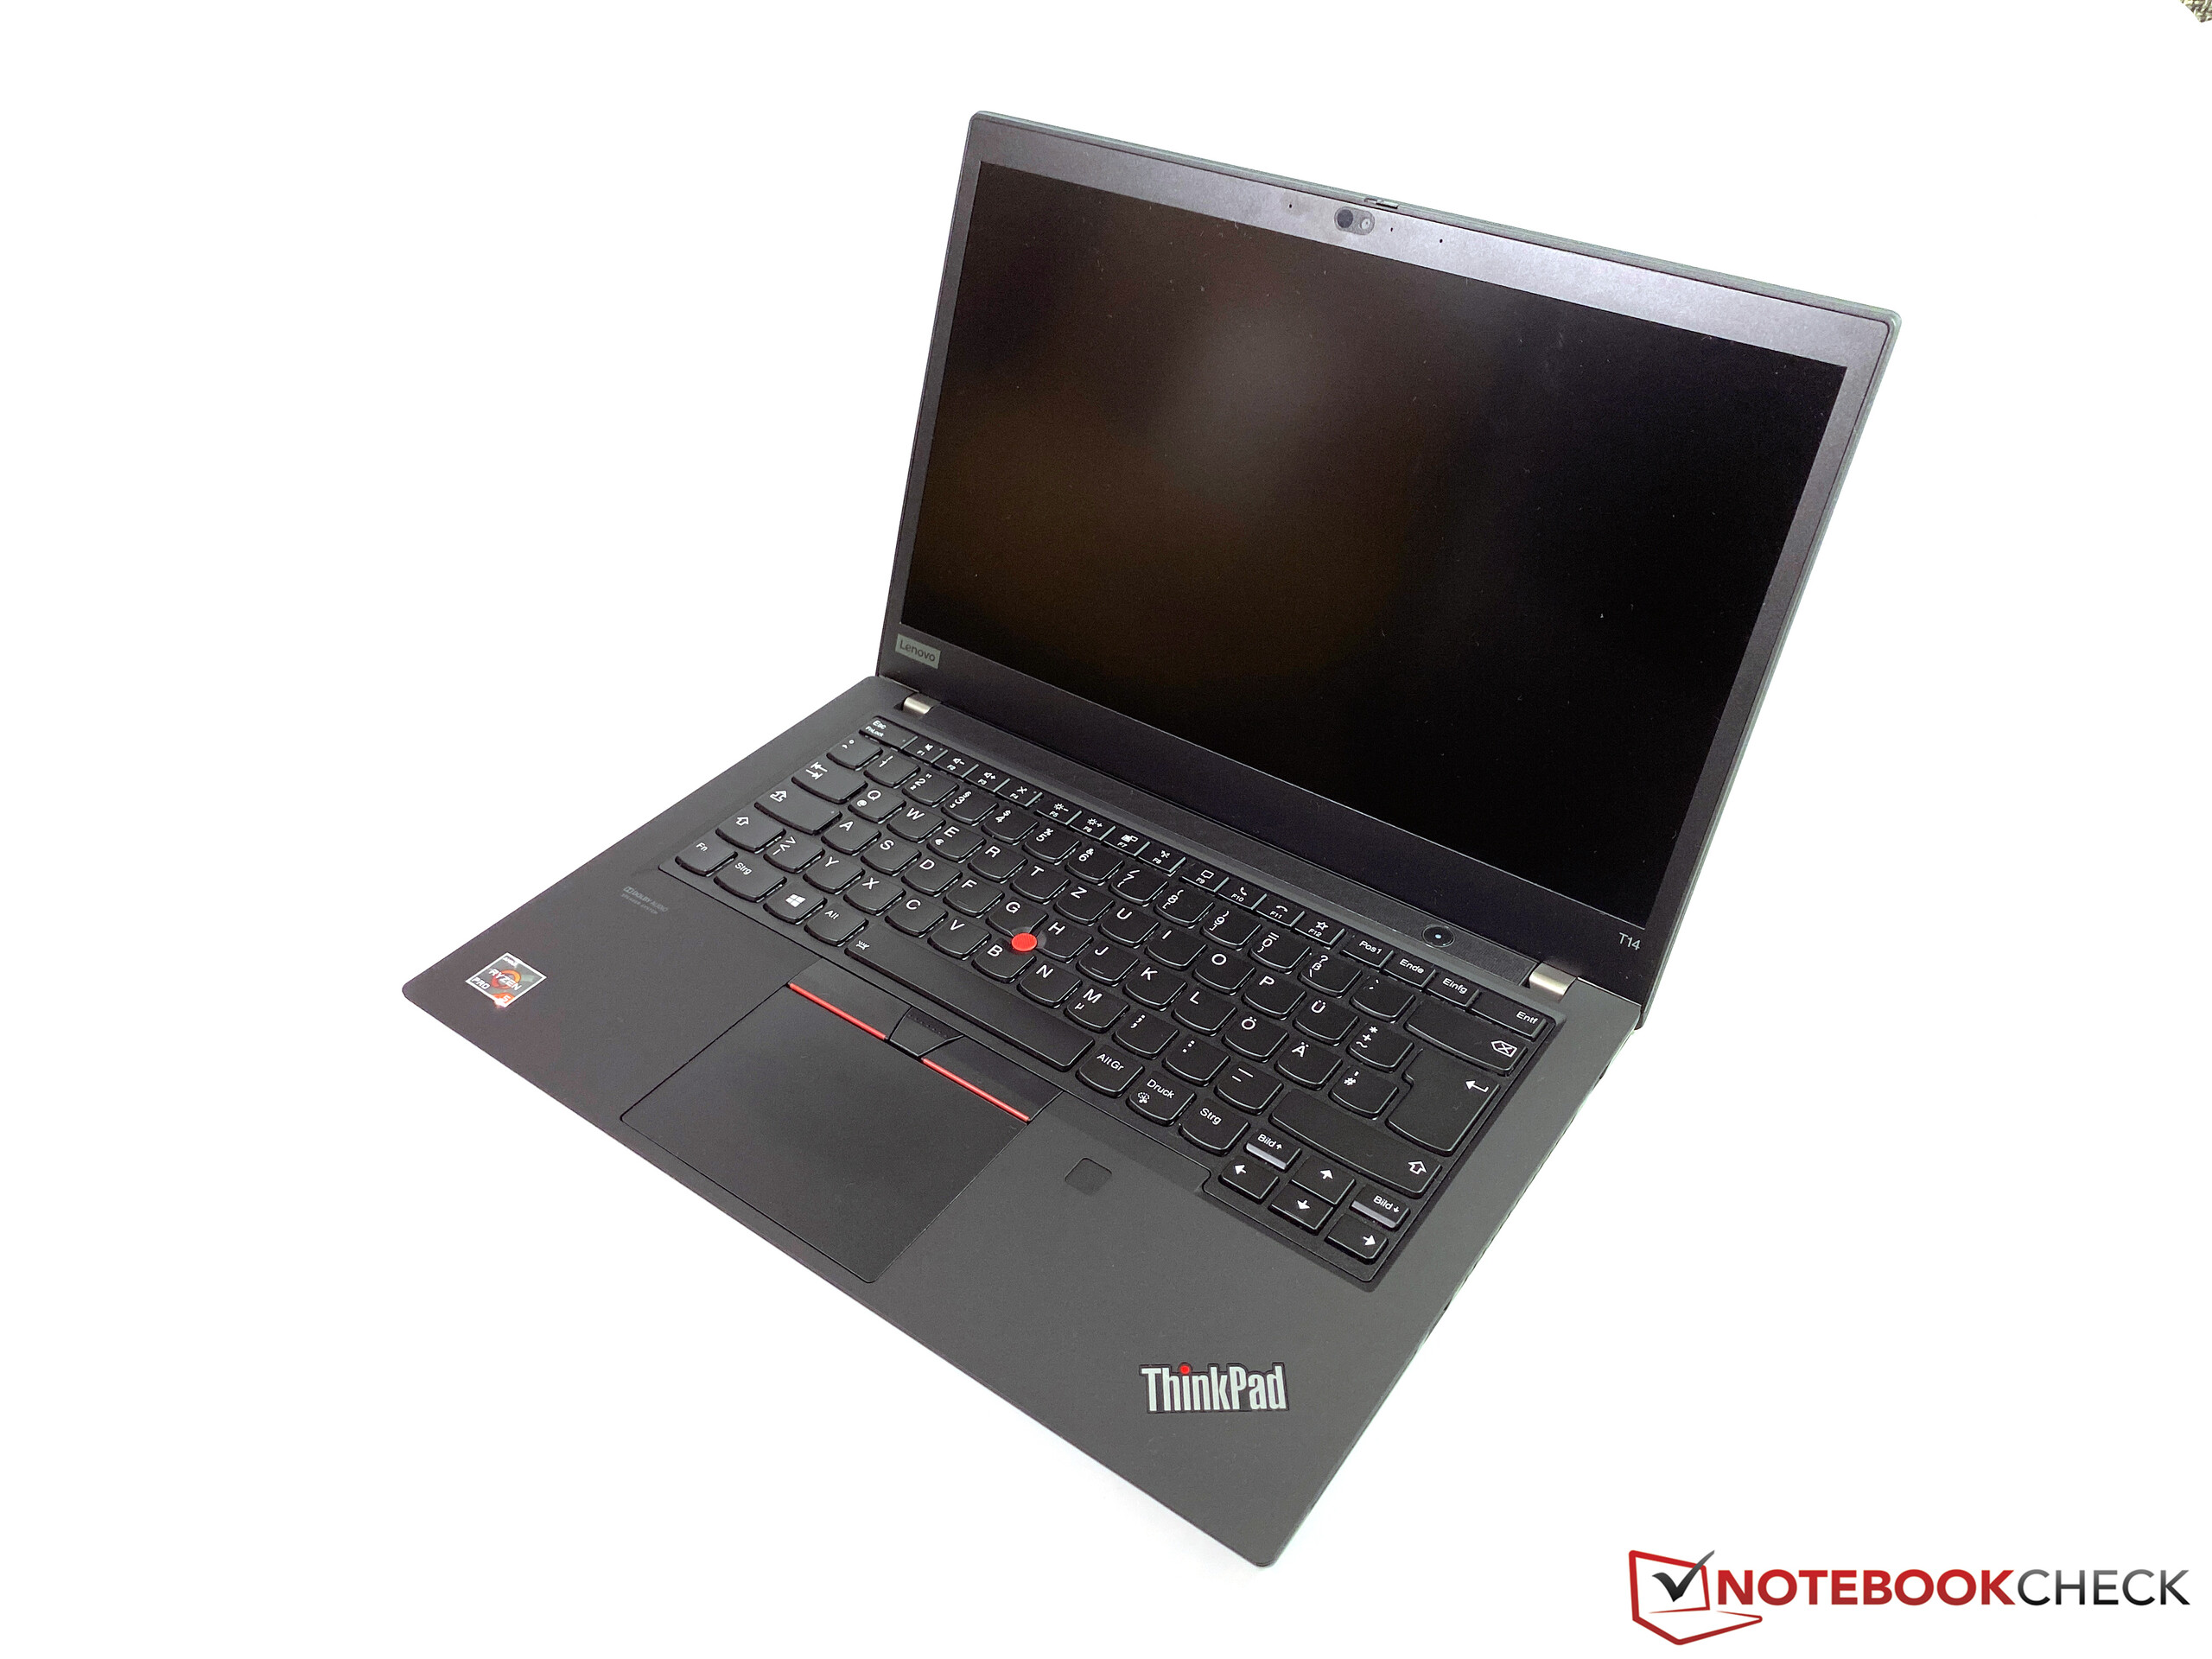
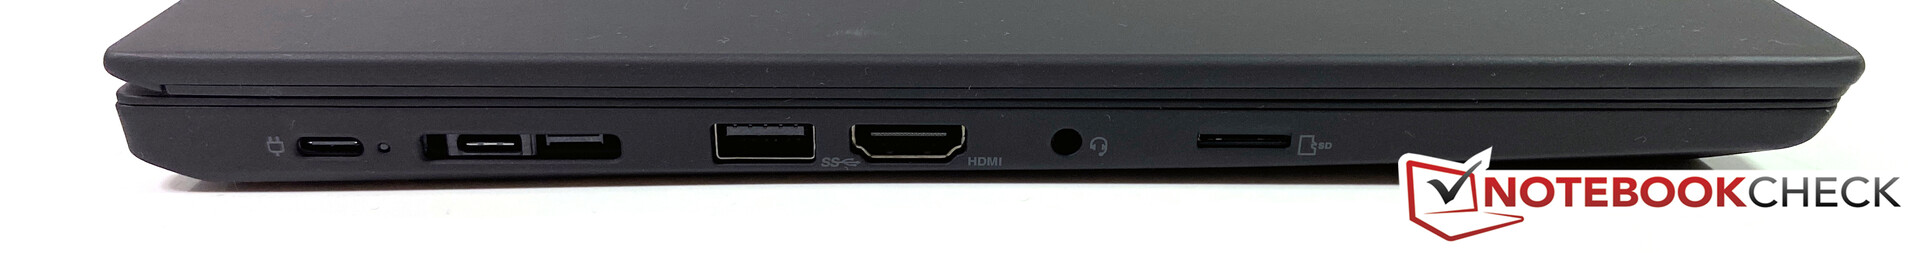
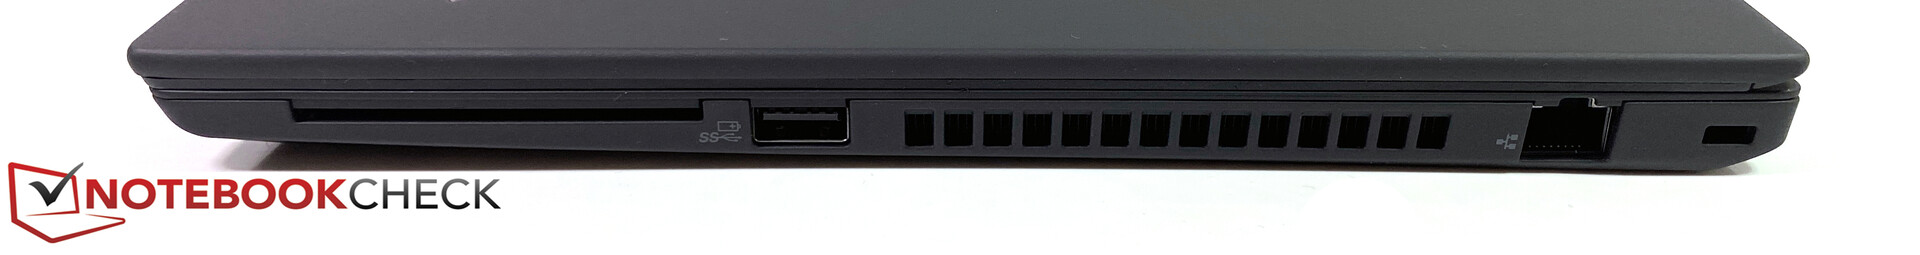
Connectivity - T14 AMD without TB3 but with HDMI 2.0
The AMD-based ThinkPad T14 does not support Thunderbolt 3, but the two USB-C ports (USB 3.1 Gen.2, 10 Gb/s) can still be used to charge the device and attach external screens (DisplayPort 1.4 Alt-mode). The HDMI 2.0 output is another advantage over the Intel model, so 4K screens can be driven at 60 Hz.
| SD Card Reader | |
| average JPG Copy Test (av. of 3 runs) | |
| Dell Latitude 14 5410-RJ80D (Toshiba Exceria Pro M501 microSDXC 64GB) | |
| Lenovo ThinkPad T14-20UES00H00 (Toshiba Exceria Pro M501 64 GB UHS-II) | |
| Lenovo ThinkPad T14s-20UJS00K00 (Toshiba Exceria Pro M501 64 GB UHS-II) | |
| Average of class Office (22.4 - 198.5, n=28, last 2 years) | |
| maximum AS SSD Seq Read Test (1GB) | |
| Dell Latitude 14 5410-RJ80D (Toshiba Exceria Pro M501 microSDXC 64GB) | |
| Lenovo ThinkPad T14s-20UJS00K00 (Toshiba Exceria Pro M501 64 GB UHS-II) | |
| Lenovo ThinkPad T14-20UES00H00 (Toshiba Exceria Pro M501 64 GB UHS-II) | |
| Average of class Office (25 - 249, n=26, last 2 years) | |


Display - Familiar 1080p Screen
We have already reviewed the matte LowPower 1080p display (1920x1080 pixels) in numerous 14-inch ThinkPads. Lenovo uses panels from four different suppliers, and we have already compared the four models in the past. Customers cannot influence the panel choice ahead of the purchase. We have already tested the exact same panel in the ThinkPad T14 Intel, so we want to keep things brief at this point.
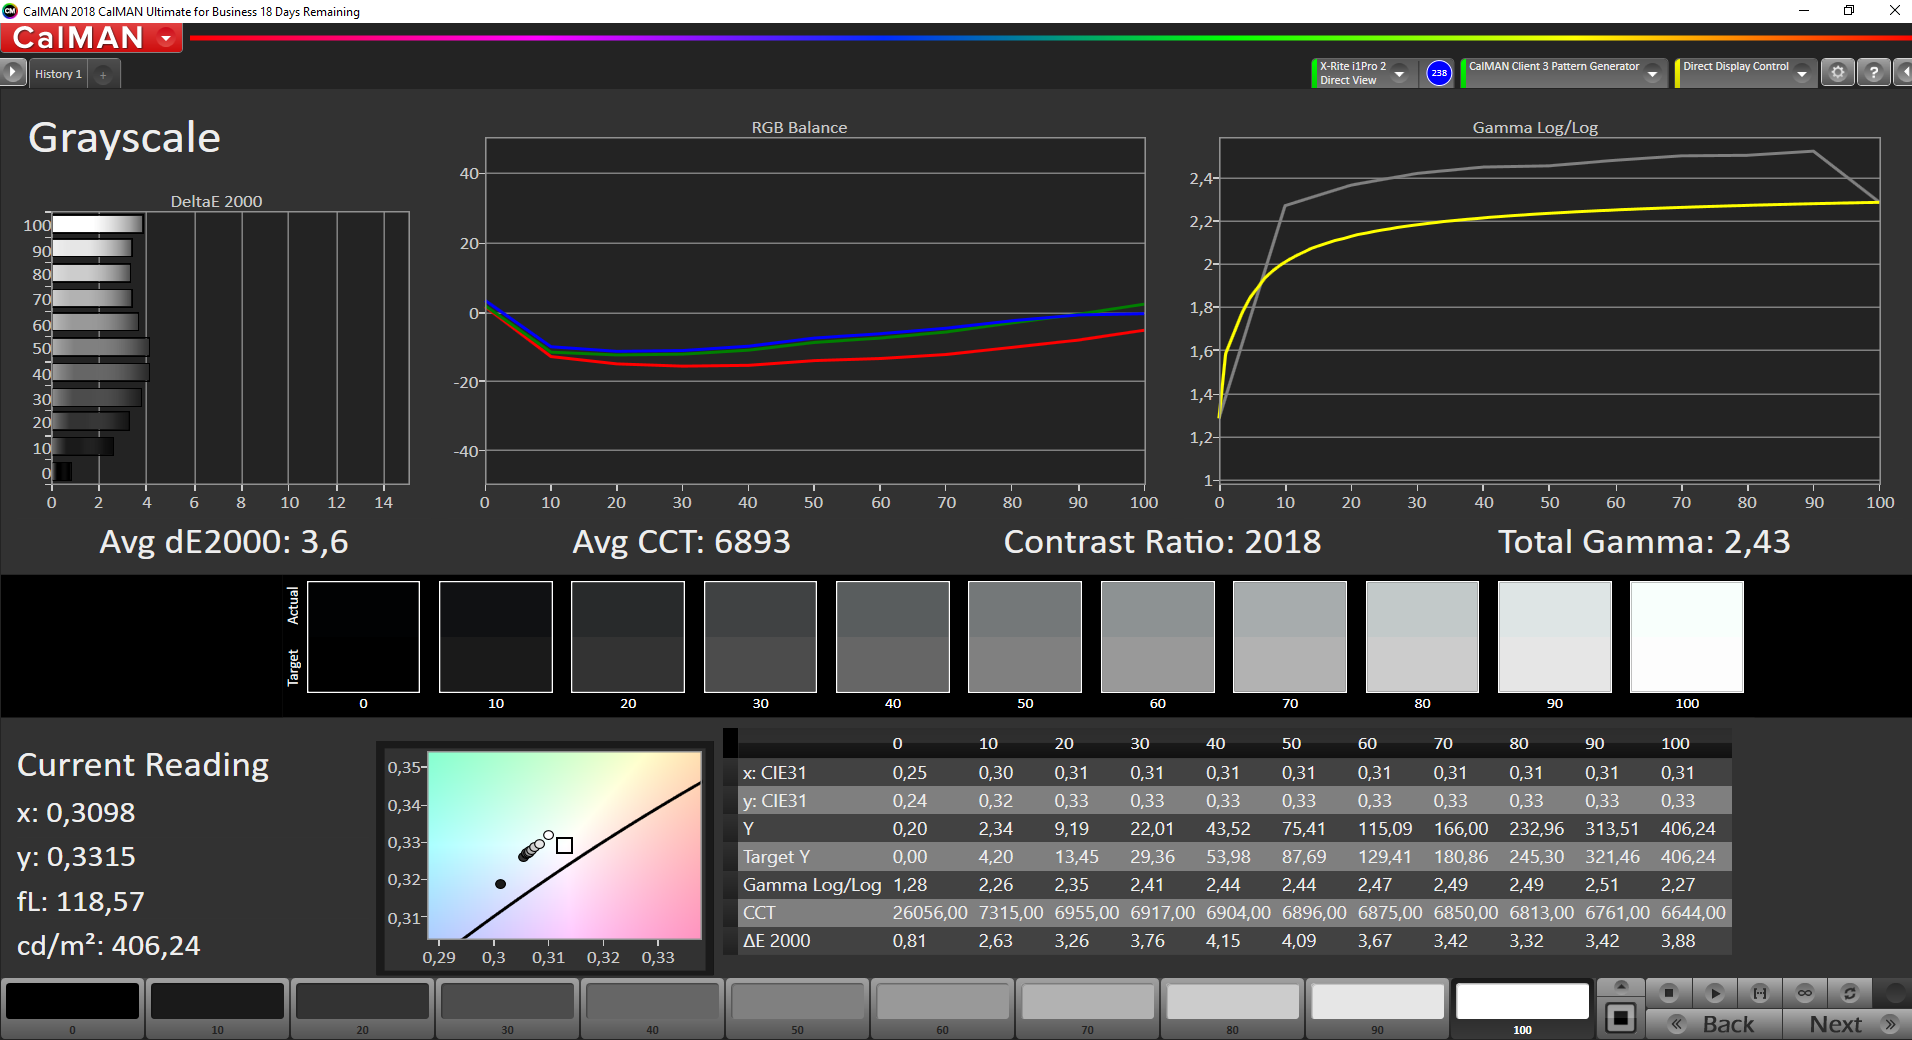
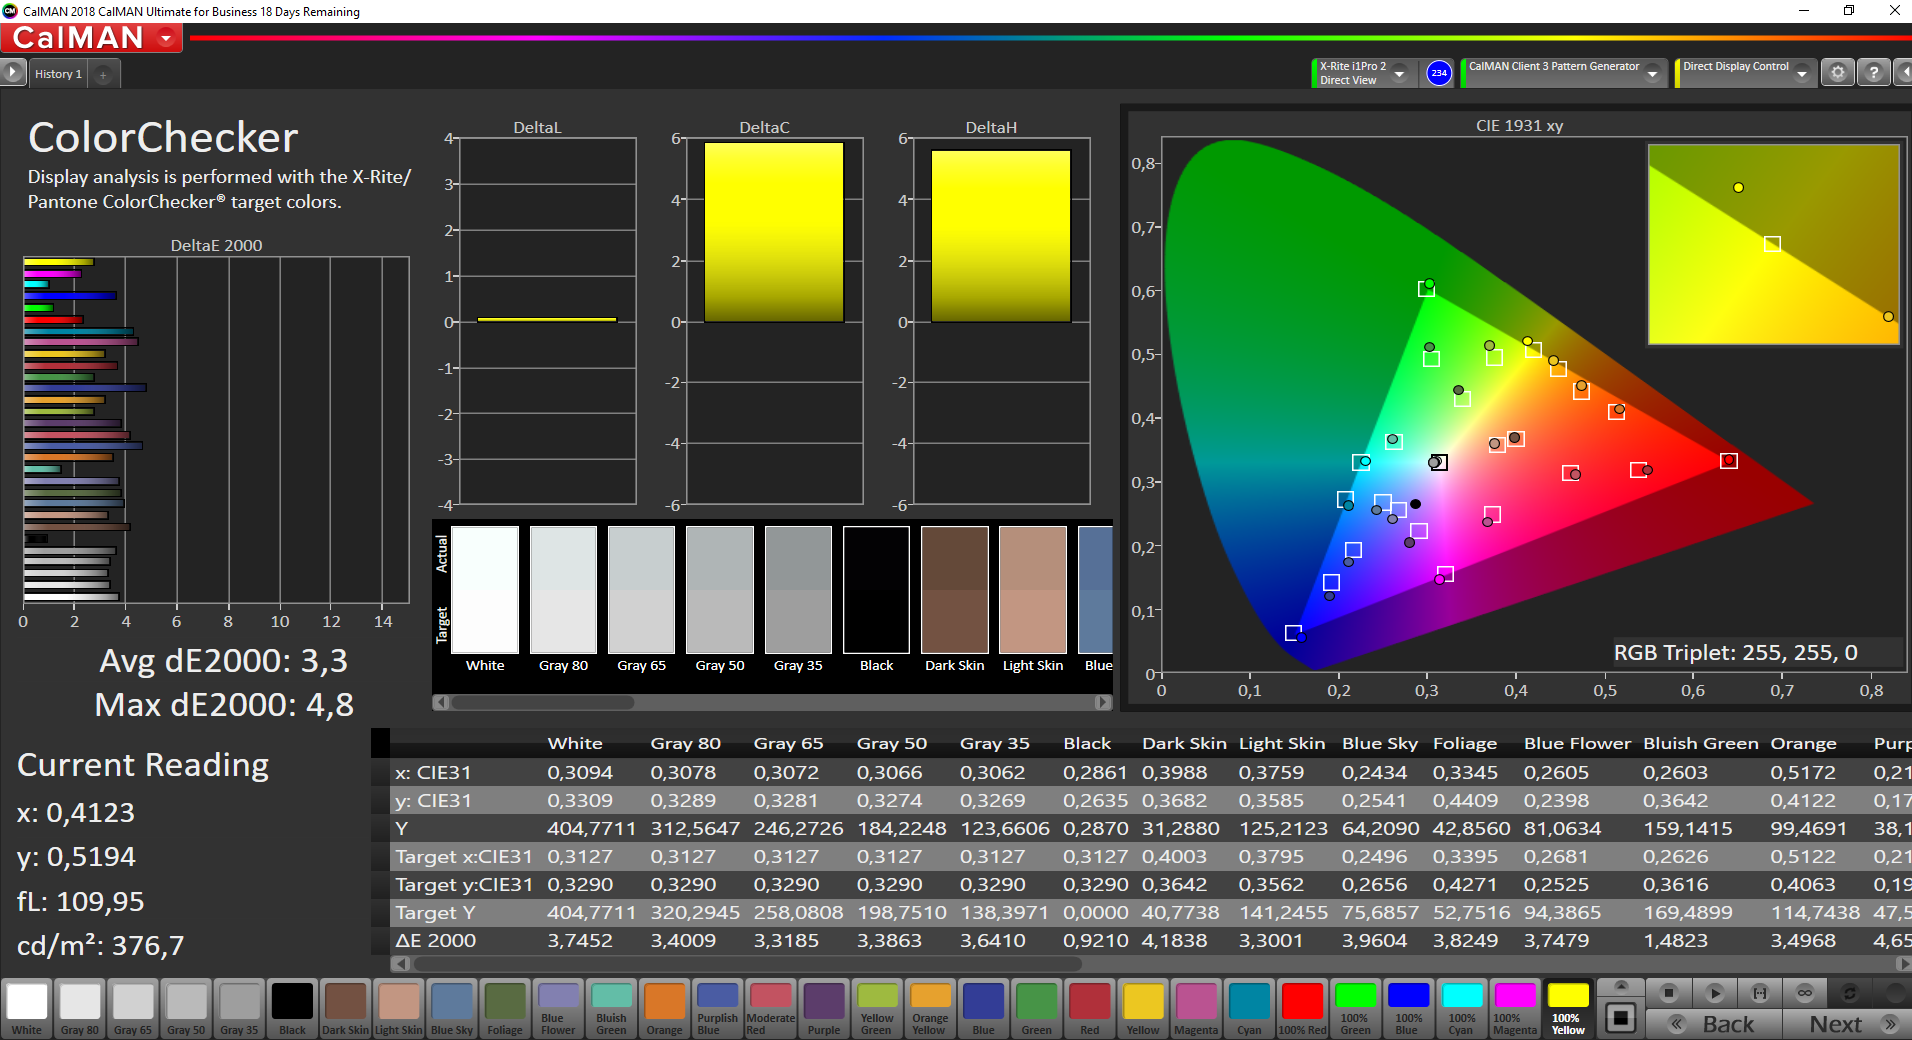
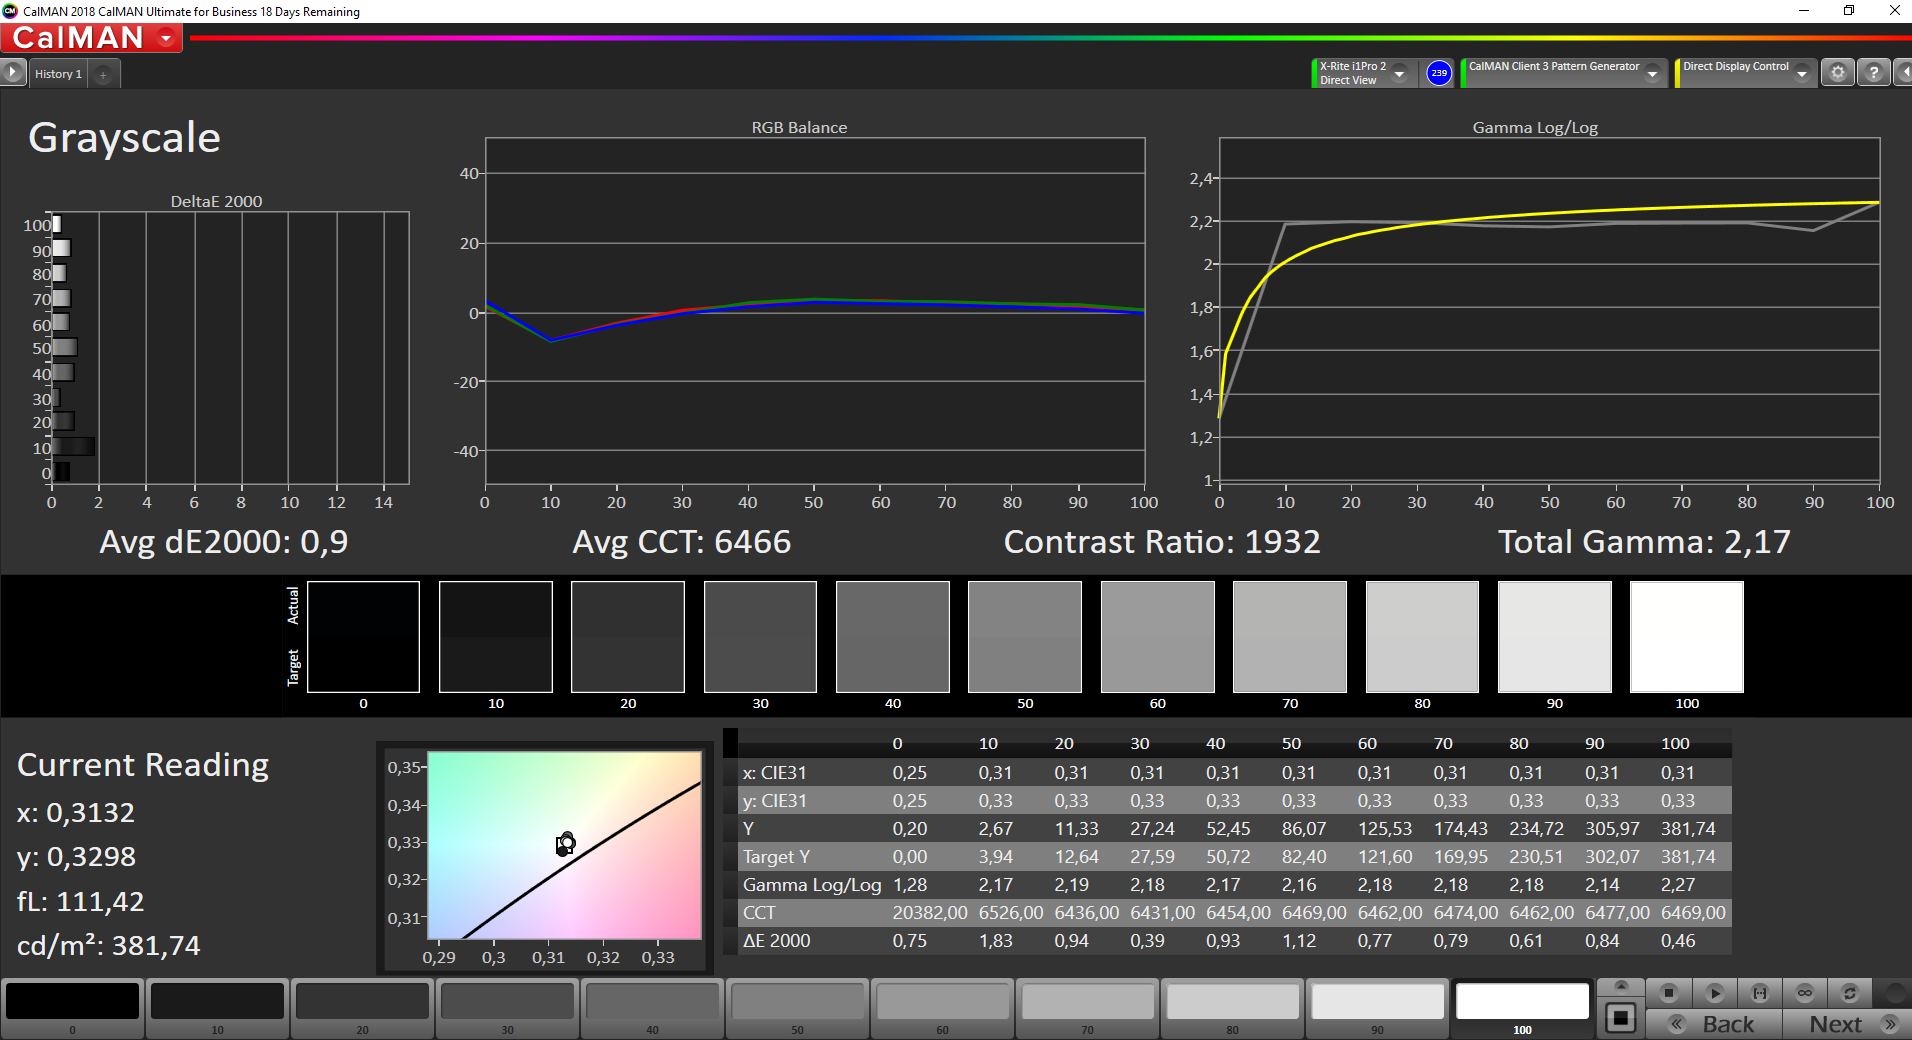
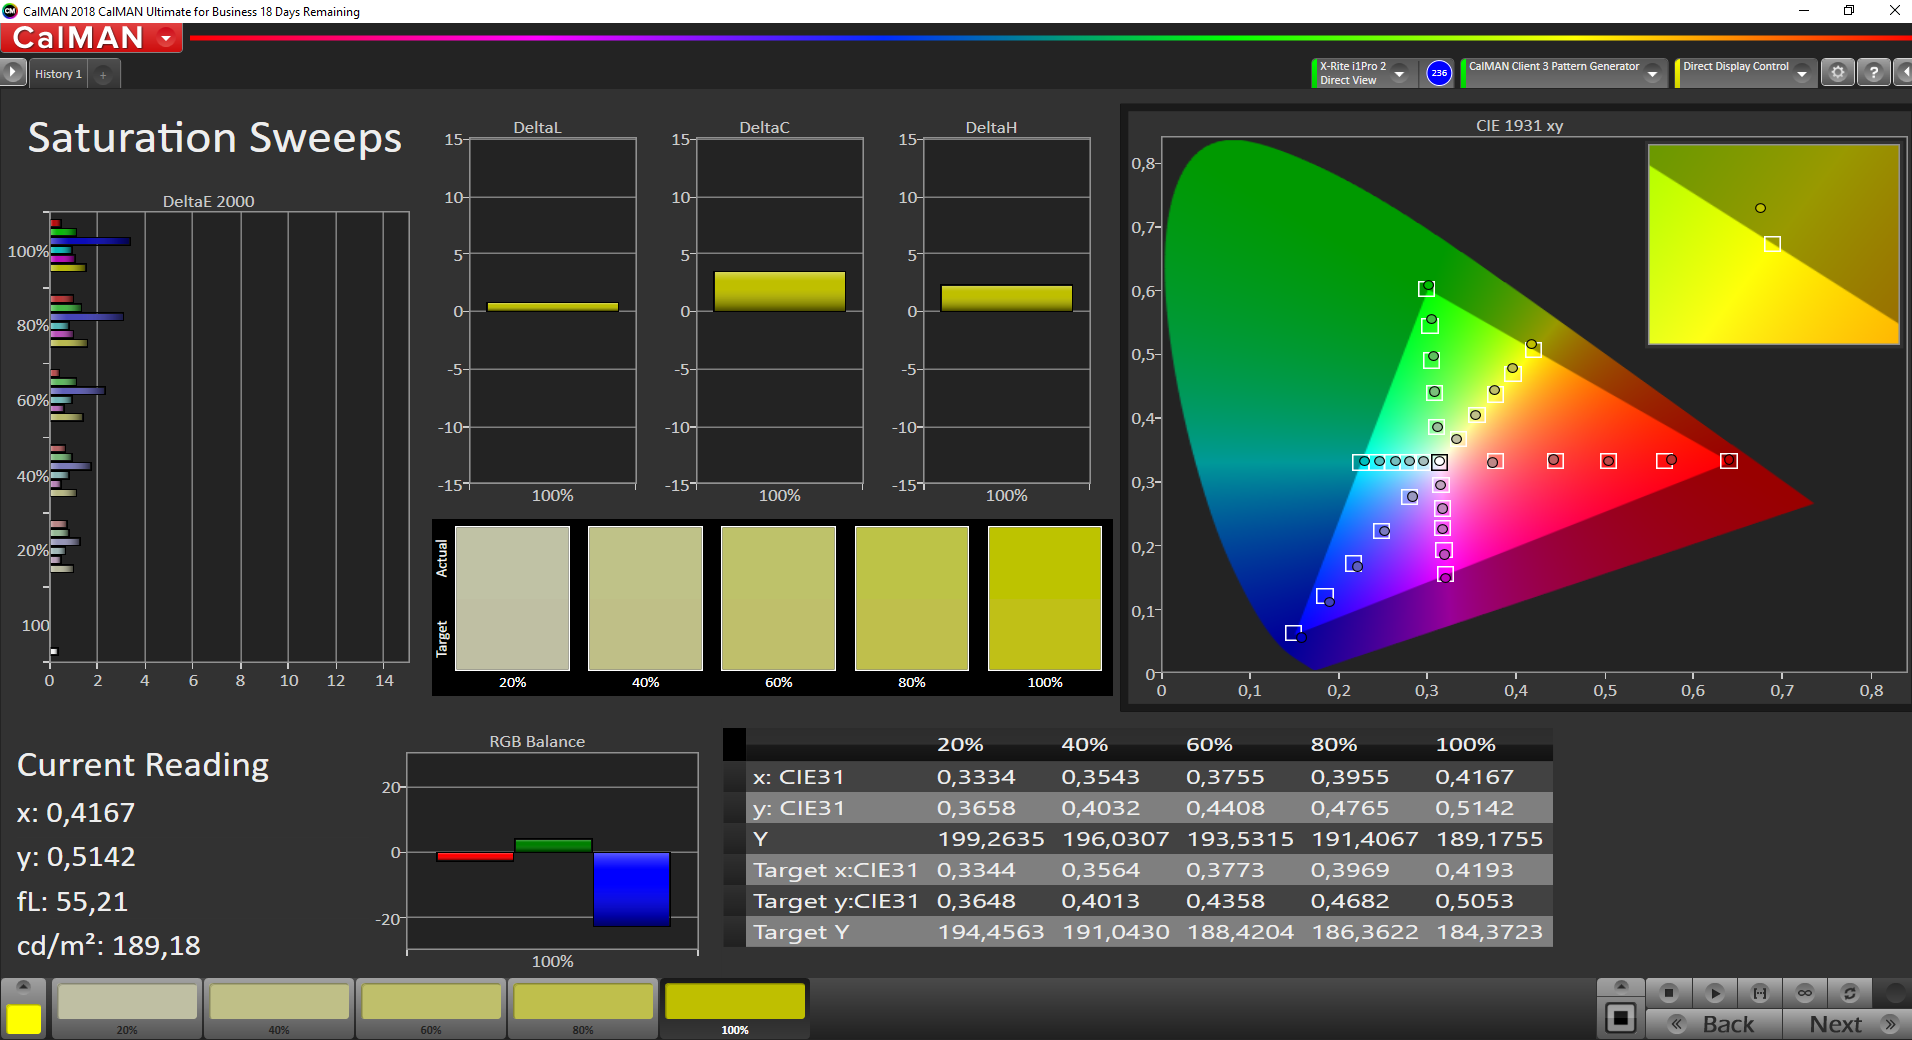
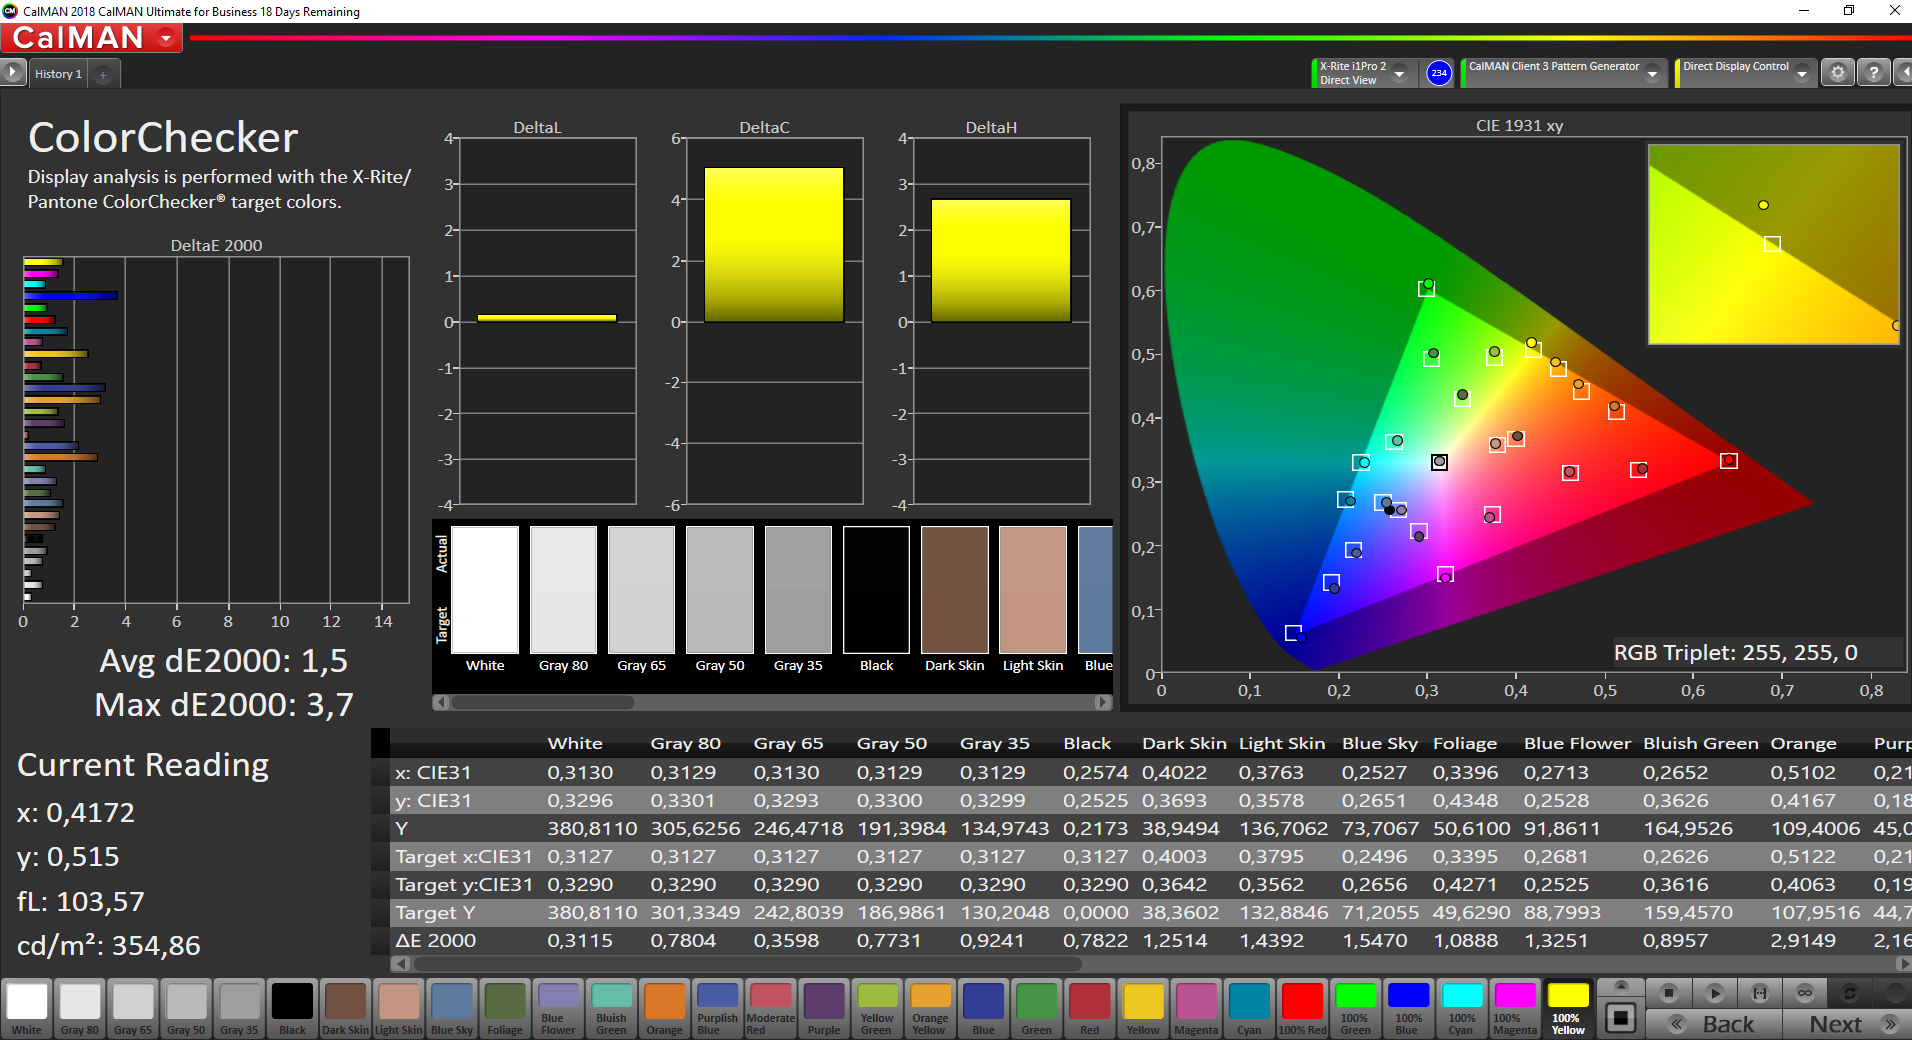
The subjective picture impression is very good and even bright surfaces do not appear too grainy. The results for the brightness, the black value and the contrast ratio are very good for a business laptop and also superior to the competitors from HP and Dell we have tested. We cannot detect PWM flickering, but the display suffers from slow response times with visible ghosting. The color accuracy is already very good out of the box, but we still recommend calibration if you want to use the screen for picture editing. The matte panel works really well outdoors thanks to the high brightness.
The display selection is almost identical for the two ThinkPad versions (Intel/AMD), and only the glossy 4K screen is reserved for the Intel T14. However, we do not think a glossy 4K screen is the best option for a business laptop anyway.
| |||||||||||||||||||||||||
Brightness Distribution: 88 %
Center on Battery: 409 cd/m²
Contrast: 2030:1 (Black: 0.2 cd/m²)
ΔE ColorChecker Calman: 3.3 | ∀{0.5-29.43 Ø4.78}
calibrated: 1.5
ΔE Greyscale Calman: 3.6 | ∀{0.09-98 Ø5}
95.5% sRGB (Argyll 1.6.3 3D)
61.5% AdobeRGB 1998 (Argyll 1.6.3 3D)
67.2% AdobeRGB 1998 (Argyll 3D)
95.8% sRGB (Argyll 3D)
66.1% Display P3 (Argyll 3D)
Gamma: 2.43
CCT: 6893 K
| Lenovo ThinkPad T14-20UES00H00 B140HAN05.7, IPS, 1920x1080, 14" | HP EliteBook 845 G7-23Y60EA LG Philips LGD064E, IPS, 1920x1080, 14" | Dell Latitude 14 5410-RJ80D BOE NV14N4F, a-Si IPS LED, 1920x1080, 14" | Lenovo ThinkPad T14s-20UJS00K00 N140HCG-GQ2, IPS , 1920x1080, 14" | Lenovo ThinkPad T14-20S1S06B00 B140HAN05.7, LTPS IPS LED, 1920x1080, 14" | |
|---|---|---|---|---|---|
| Display | -43% | -40% | 2% | 0% | |
| Display P3 Coverage (%) | 66.1 | 36.76 -44% | 39.02 -41% | 66.8 1% | 66 0% |
| sRGB Coverage (%) | 95.8 | 55.3 -42% | 58 -39% | 97.9 2% | 96.8 1% |
| AdobeRGB 1998 Coverage (%) | 67.2 | 37.98 -43% | 40.32 -40% | 69 3% | 67.1 0% |
| Response Times | 32% | 10% | 49% | 10% | |
| Response Time Grey 50% / Grey 80% * (ms) | 64 ? | 37 ? 42% | 46 ? 28% | 32.4 ? 49% | 58.4 ? 9% |
| Response Time Black / White * (ms) | 29.6 ? | 23 ? 22% | 32 ? -8% | 15.2 ? 49% | 26.4 ? 11% |
| PWM Frequency (Hz) | 1000 ? | 26040 ? | |||
| Screen | -37% | -61% | 7% | -2% | |
| Brightness middle (cd/m²) | 406 | 227 -44% | 235 -42% | 404 0% | 397 -2% |
| Brightness (cd/m²) | 403 | 220 -45% | 219 -46% | 371 -8% | 394 -2% |
| Brightness Distribution (%) | 88 | 82 -7% | 81 -8% | 88 0% | 90 2% |
| Black Level * (cd/m²) | 0.2 | 0.18 10% | 0.21 -5% | 0.34 -70% | 0.2 -0% |
| Contrast (:1) | 2030 | 1261 -38% | 1119 -45% | 1188 -41% | 1985 -2% |
| Colorchecker dE 2000 * | 3.3 | 4.1 -24% | 6.11 -85% | 1.4 58% | 3.6 -9% |
| Colorchecker dE 2000 max. * | 4.8 | 7.06 -47% | 16.6 -246% | 3.2 33% | 5.9 -23% |
| Colorchecker dE 2000 calibrated * | 1.5 | 4.04 -169% | 0.8 47% | 1.2 20% | |
| Greyscale dE 2000 * | 3.6 | 1.99 45% | 5.52 -53% | 1.6 56% | 3.9 -8% |
| Gamma | 2.43 91% | 2.48 89% | 2.33 94% | 2.13 103% | 2.48 89% |
| CCT | 6893 94% | 6607 98% | 6680 97% | 6480 100% | 7090 92% |
| Color Space (Percent of AdobeRGB 1998) (%) | 61.5 | 35 -43% | 37 -40% | 63 2% | 61.4 0% |
| Color Space (Percent of sRGB) (%) | 95.5 | 55 -42% | 58 -39% | 97.9 3% | 96.6 1% |
| Total Average (Program / Settings) | -16% /
-29% | -30% /
-47% | 19% /
12% | 3% /
-0% |
* ... smaller is better

Display Response Times
| ↔ Response Time Black to White | ||
|---|---|---|
| 29.6 ms ... rise ↗ and fall ↘ combined | ↗ 13.2 ms rise | 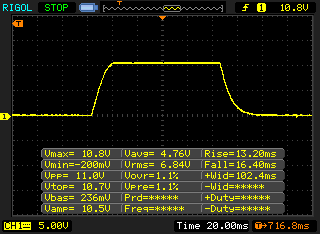 |
| ↘ 16.4 ms fall | ||
| The screen shows relatively slow response rates in our tests and may be too slow for gamers. In comparison, all tested devices range from 0.1 (minimum) to 240 (maximum) ms. » 78 % of all devices are better. This means that the measured response time is worse than the average of all tested devices (20.2 ms). | ||
| ↔ Response Time 50% Grey to 80% Grey | ||
| 64 ms ... rise ↗ and fall ↘ combined | ↗ 30.8 ms rise | 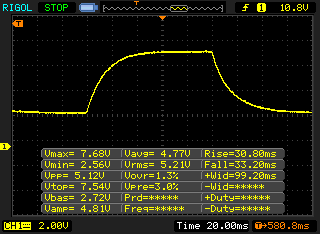 |
| ↘ 33.2 ms fall | ||
| The screen shows slow response rates in our tests and will be unsatisfactory for gamers. In comparison, all tested devices range from 0.165 (minimum) to 636 (maximum) ms. » 97 % of all devices are better. This means that the measured response time is worse than the average of all tested devices (31.6 ms). | ||
Screen Flickering / PWM (Pulse-Width Modulation)
| Screen flickering / PWM not detected |  | ||
In comparison: 53 % of all tested devices do not use PWM to dim the display. If PWM was detected, an average of 8108 (minimum: 5 - maximum: 343500) Hz was measured. | |||
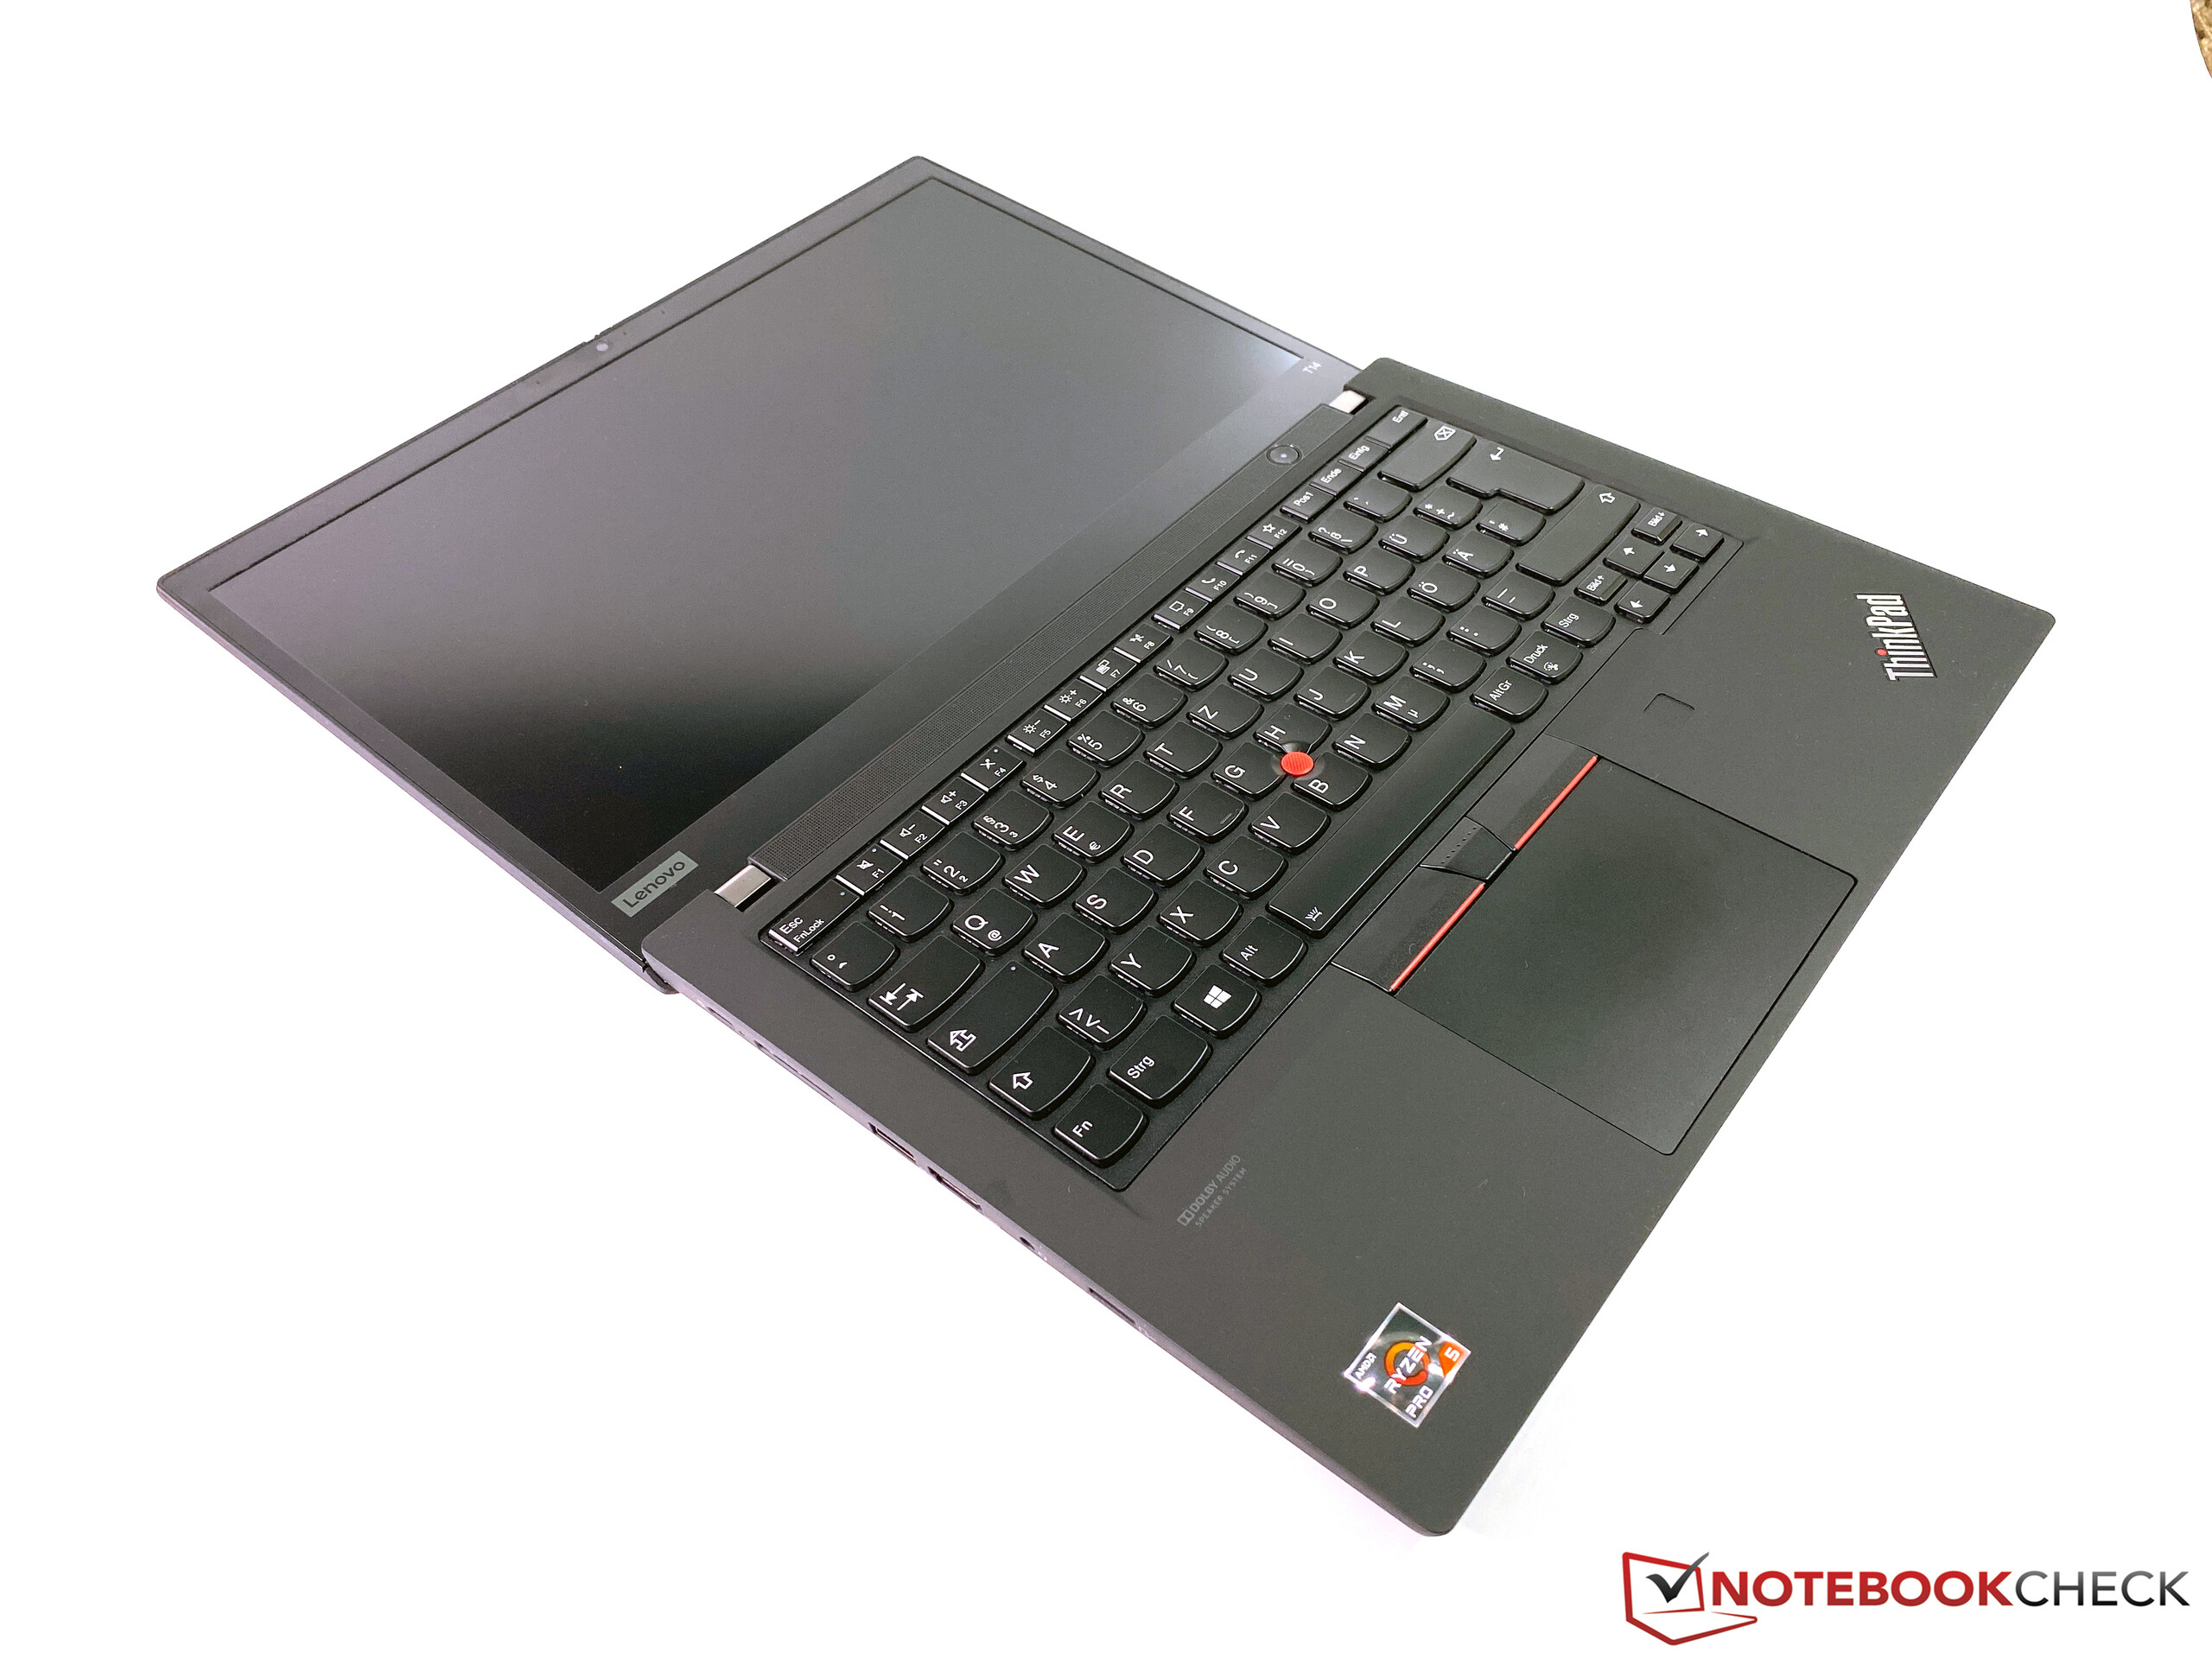
Performance - ThinkPad with 6-core AMD Ryzen Pro
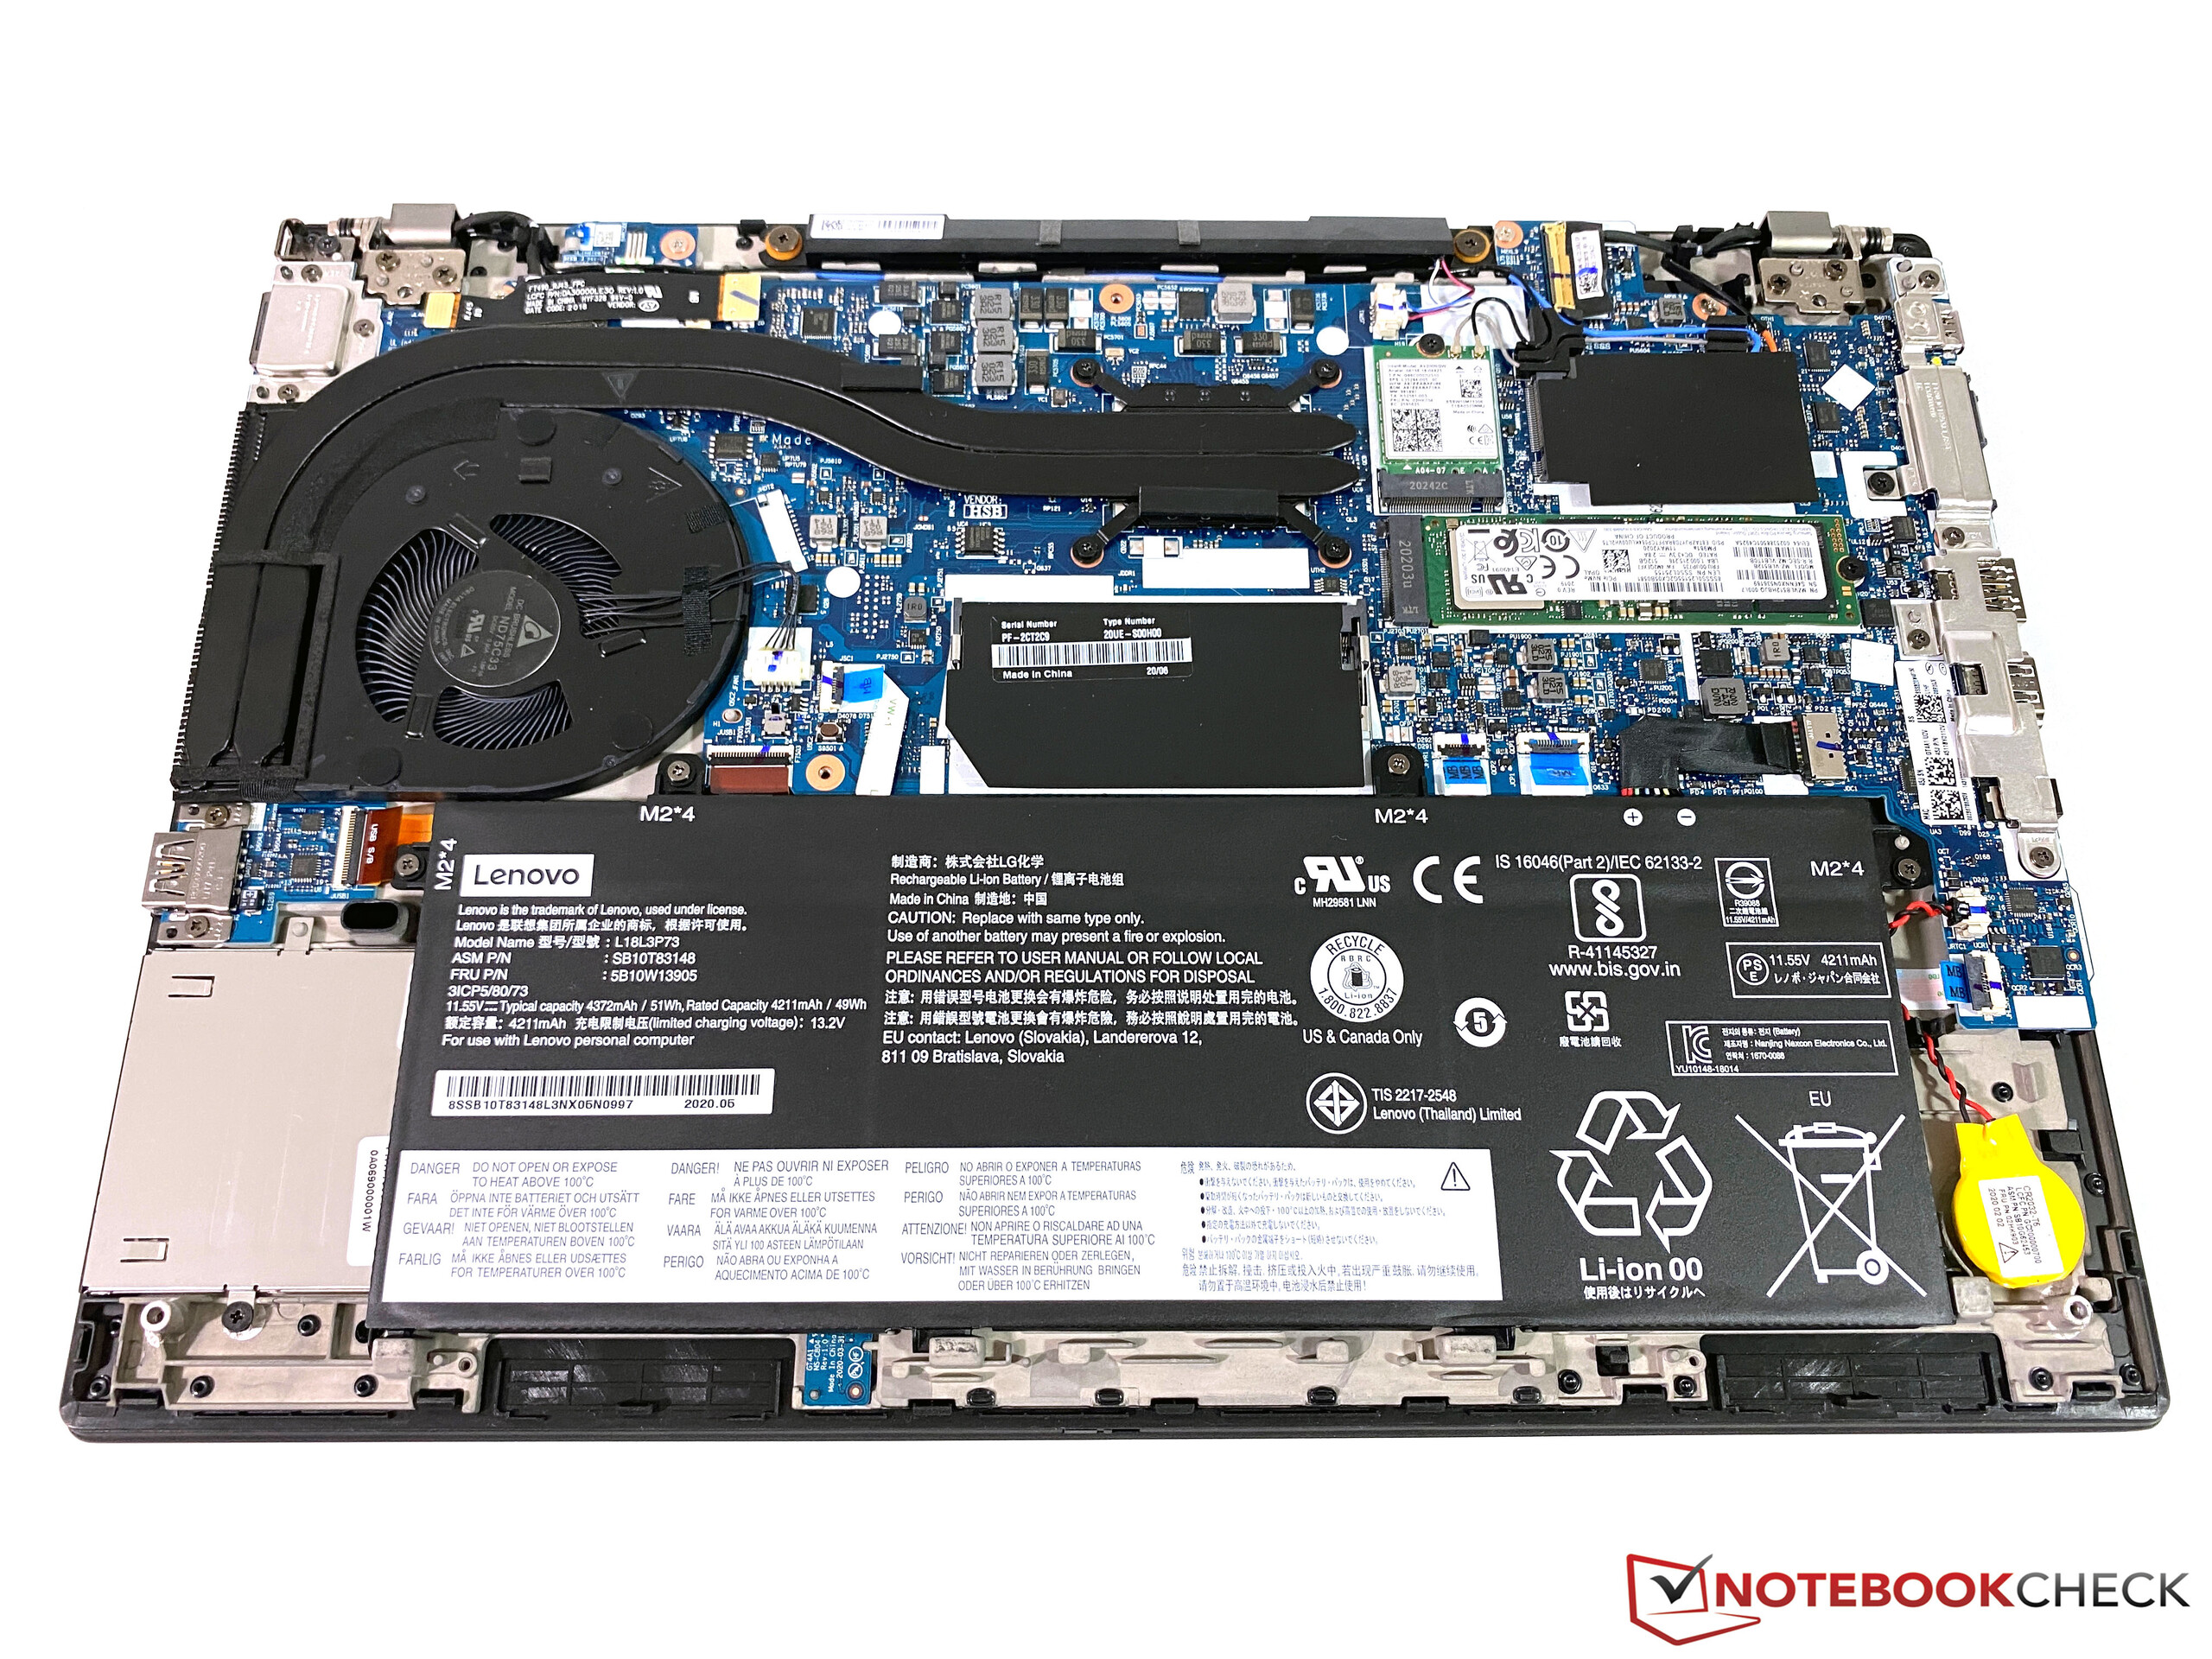
Most pre-configured models of the ThinkPad T14 are shipped with single-channel RAM. Thanks to the additional SODIMM slot, however, it is pretty easy to upgrade the memory and it can result in a noticeable performance advantage for the iGPU in particular. We have used the single-channel configuration for our benchmarks and the rating, but we have also included the results with a dual-channel configuration with a second RAM module (in this case 16 GB DDR4-3200 from Crucial) in some sections.
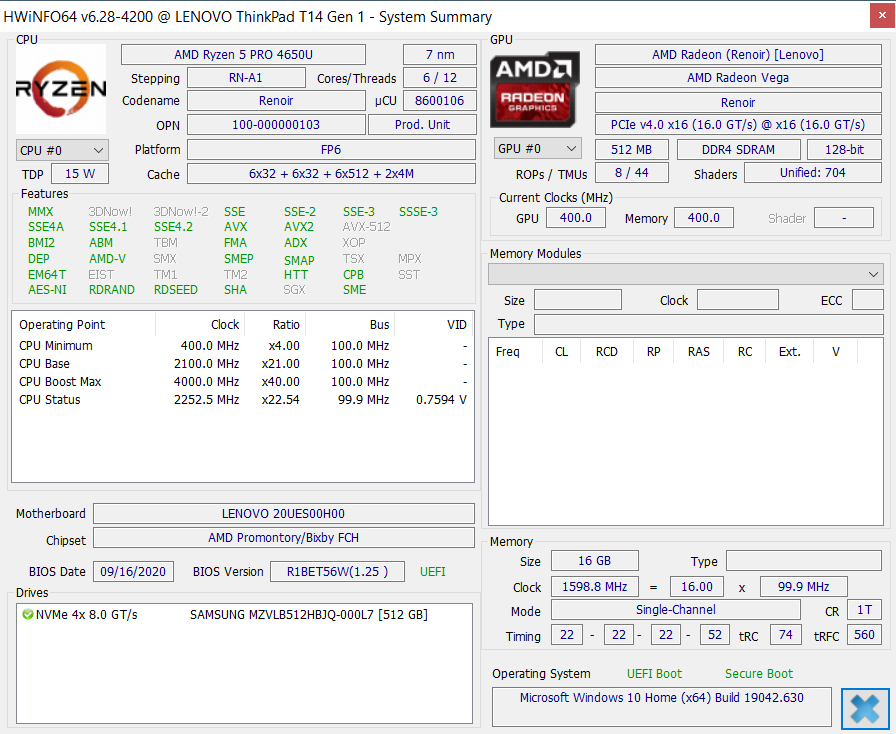
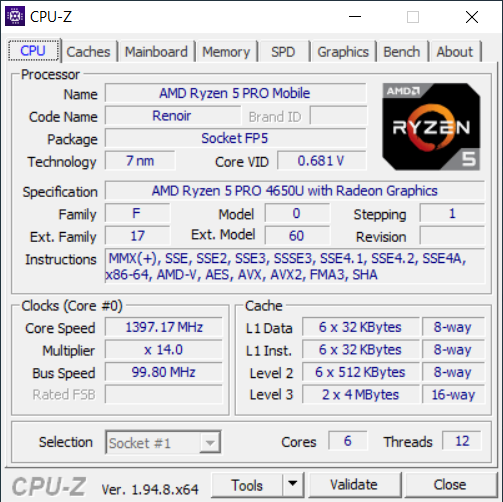
Processor - T14 with Ryzen 5 Pro
Compared to less expensive ThinkPad models from the L- or E-series, Lenovo uses Ryzen Pro CPUs for the more expensive T-series. These Pro CPUs offer additional security features comparable to Intel's vPro technology. You can get the Ryzen 7 Pro 4750U with 8 cores, but our test unit "only" gets the slower Ryzen 5 Pro 4650U with 6 cores (12 threads, up to 4.0 GHz).
Lenovo is pretty conservative in terms of the TDP limits for the T14 with a short burst of 25 W (6x 3.1-3.2 GHz) and a sustained value of 23 Watts (6x 3.0 GHz). The Intel T14 has a much higher short-term consumption, but it eventually levels off at just ~17 W. The thinner T14s AMD has slightly lower limits (25/18 W).
The CPU performance is pretty much identical to the HP EliteBook 845 G7, which benefits from a slightly higher initial TDP configuration (30/23 W). The ThinkPad T14s with the faster Ryzen 7 Pro is ahead in the multi-core benchmarks, but the T14 with the same processor should be even faster thanks to the higher TDP limits. The Intel competition is easily beaten, and we still have to wait for business laptops with Tiger Lake CPUs. Right now, AMD's processors just offer much better performance.
Overall, even the "smaller" Ryzen 5 Pro leaves an excellent impression and offers plenty of performance for a mobile business laptop. The CPU performance is not reduced on battery power.
Cinebench R15: CPU Single 64Bit | CPU Multi 64Bit
Blender: v2.79 BMW27 CPU
7-Zip 18.03: 7z b 4 -mmt1 | 7z b 4
Geekbench 5.5: Single-Core | Multi-Core
HWBOT x265 Benchmark v2.2: 4k Preset
LibreOffice : 20 Documents To PDF
R Benchmark 2.5: Overall mean
| Cinebench R20 / CPU (Single Core) | |
| Average of class Office (285 - 815, n=78, last 2 years) | |
| Lenovo ThinkPad T14s-20UJS00K00 | |
| HP EliteBook 845 G7-23Y60EA | |
| Average AMD Ryzen 5 PRO 4650U (453 - 454, n=4) | |
| Lenovo ThinkPad T14-20UES00H00 | |
| Dell Latitude 14 5410-RJ80D | |
| Lenovo ThinkPad T14-20S1S06B00 | |
| Lenovo ThinkPad T495-20NKS01Y00 | |
| Cinebench R20 / CPU (Multi Core) | |
| Average of class Office (590 - 8840, n=78, last 2 years) | |
| Lenovo ThinkPad T14s-20UJS00K00 | |
| HP EliteBook 845 G7-23Y60EA | |
| Average AMD Ryzen 5 PRO 4650U (2561 - 2692, n=4) | |
| Lenovo ThinkPad T14-20UES00H00 | |
| Dell Latitude 14 5410-RJ80D | |
| Lenovo ThinkPad T14-20S1S06B00 | |
| Lenovo ThinkPad T495-20NKS01Y00 | |
| Cinebench R15 / CPU Single 64Bit | |
| Average of class Office (99.5 - 312, n=80, last 2 years) | |
| Lenovo ThinkPad T14s-20UJS00K00 | |
| Lenovo ThinkPad T14-20UES00H00 | |
| Average AMD Ryzen 5 PRO 4650U (175 - 177, n=4) | |
| HP EliteBook 845 G7-23Y60EA | |
| Dell Latitude 14 5410-RJ80D | |
| Lenovo ThinkPad T14-20S1S06B00 | |
| Lenovo ThinkPad T495-20NKS01Y00 | |
| Cinebench R15 / CPU Multi 64Bit | |
| Average of class Office (246 - 3380, n=80, last 2 years) | |
| Lenovo ThinkPad T14s-20UJS00K00 | |
| HP EliteBook 845 G7-23Y60EA | |
| Average AMD Ryzen 5 PRO 4650U (1123 - 1168, n=4) | |
| Lenovo ThinkPad T14-20UES00H00 | |
| Dell Latitude 14 5410-RJ80D | |
| Lenovo ThinkPad T14-20S1S06B00 | |
| Lenovo ThinkPad T495-20NKS01Y00 | |
| Blender / v2.79 BMW27 CPU | |
| Dell Latitude 14 5410-RJ80D | |
| Lenovo ThinkPad T14-20S1S06B00 | |
| Lenovo ThinkPad T495-20NKS01Y00 | |
| Lenovo ThinkPad T14-20UES00H00 | |
| Average AMD Ryzen 5 PRO 4650U (415 - 448, n=4) | |
| HP EliteBook 845 G7-23Y60EA | |
| Average of class Office (158 - 1956, n=80, last 2 years) | |
| Lenovo ThinkPad T14s-20UJS00K00 | |
| 7-Zip 18.03 / 7z b 4 -mmt1 | |
| Average of class Office (3046 - 6497, n=80, last 2 years) | |
| Lenovo ThinkPad T14s-20UJS00K00 | |
| Lenovo ThinkPad T14-20UES00H00 | |
| Lenovo ThinkPad T14-20S1S06B00 | |
| Average AMD Ryzen 5 PRO 4650U (4202 - 4359, n=4) | |
| HP EliteBook 845 G7-23Y60EA | |
| Dell Latitude 14 5410-RJ80D | |
| Lenovo ThinkPad T495-20NKS01Y00 | |
| 7-Zip 18.03 / 7z b 4 | |
| Average of class Office (7532 - 76886, n=81, last 2 years) | |
| Lenovo ThinkPad T14s-20UJS00K00 | |
| HP EliteBook 845 G7-23Y60EA | |
| Average AMD Ryzen 5 PRO 4650U (30895 - 32454, n=4) | |
| Lenovo ThinkPad T14-20UES00H00 | |
| Dell Latitude 14 5410-RJ80D | |
| Lenovo ThinkPad T14-20S1S06B00 | |
| Lenovo ThinkPad T495-20NKS01Y00 | |
| Geekbench 5.5 / Single-Core | |
| Average of class Office (811 - 2128, n=78, last 2 years) | |
| Lenovo ThinkPad T14s-20UJS00K00 | |
| Dell Latitude 14 5410-RJ80D | |
| Lenovo ThinkPad T14-20UES00H00 | |
| Average AMD Ryzen 5 PRO 4650U (1065 - 1102, n=4) | |
| HP EliteBook 845 G7-23Y60EA | |
| Lenovo ThinkPad T14-20S1S06B00 | |
| Geekbench 5.5 / Multi-Core | |
| Average of class Office (1719 - 16999, n=78, last 2 years) | |
| Lenovo ThinkPad T14s-20UJS00K00 | |
| HP EliteBook 845 G7-23Y60EA | |
| Average AMD Ryzen 5 PRO 4650U (4581 - 4705, n=4) | |
| Lenovo ThinkPad T14-20UES00H00 | |
| Dell Latitude 14 5410-RJ80D | |
| Lenovo ThinkPad T14-20S1S06B00 | |
| HWBOT x265 Benchmark v2.2 / 4k Preset | |
| Average of class Office (1.72 - 26, n=78, last 2 years) | |
| Lenovo ThinkPad T14s-20UJS00K00 | |
| HP EliteBook 845 G7-23Y60EA | |
| Average AMD Ryzen 5 PRO 4650U (7.82 - 8.14, n=4) | |
| Lenovo ThinkPad T14-20UES00H00 | |
| Lenovo ThinkPad T14-20S1S06B00 | |
| Dell Latitude 14 5410-RJ80D | |
| Lenovo ThinkPad T495-20NKS01Y00 | |
| LibreOffice / 20 Documents To PDF | |
| HP EliteBook 845 G7-23Y60EA | |
| Average AMD Ryzen 5 PRO 4650U (61.5 - 88.8, n=4) | |
| Dell Latitude 14 5410-RJ80D | |
| Lenovo ThinkPad T14-20UES00H00 | |
| Lenovo ThinkPad T14s-20UJS00K00 | |
| Lenovo ThinkPad T14-20S1S06B00 | |
| Average of class Office (41.5 - 129.6, n=78, last 2 years) | |
| R Benchmark 2.5 / Overall mean | |
| Dell Latitude 14 5410-RJ80D | |
| Lenovo ThinkPad T14-20S1S06B00 | |
| Average AMD Ryzen 5 PRO 4650U (0.643 - 0.663, n=4) | |
| HP EliteBook 845 G7-23Y60EA | |
| Lenovo ThinkPad T14-20UES00H00 | |
| Lenovo ThinkPad T14s-20UJS00K00 | |
| Average of class Office (0.4098 - 1.06, n=78, last 2 years) | |
* ... smaller is better
System Performance
We did not notice any problems with the system performance and, as expected, the T14 is a very responsive system. A second memory module will improve the PCMark 10 result by around 6% (4740 vs. 4473 points).
| PCMark 8 Home Score Accelerated v2 | 4111 points | |
| PCMark 8 Creative Score Accelerated v2 | 5214 points | |
| PCMark 8 Work Score Accelerated v2 | 5383 points | |
| PCMark 10 Score | 4473 points | |
Help | ||
DPC Latency
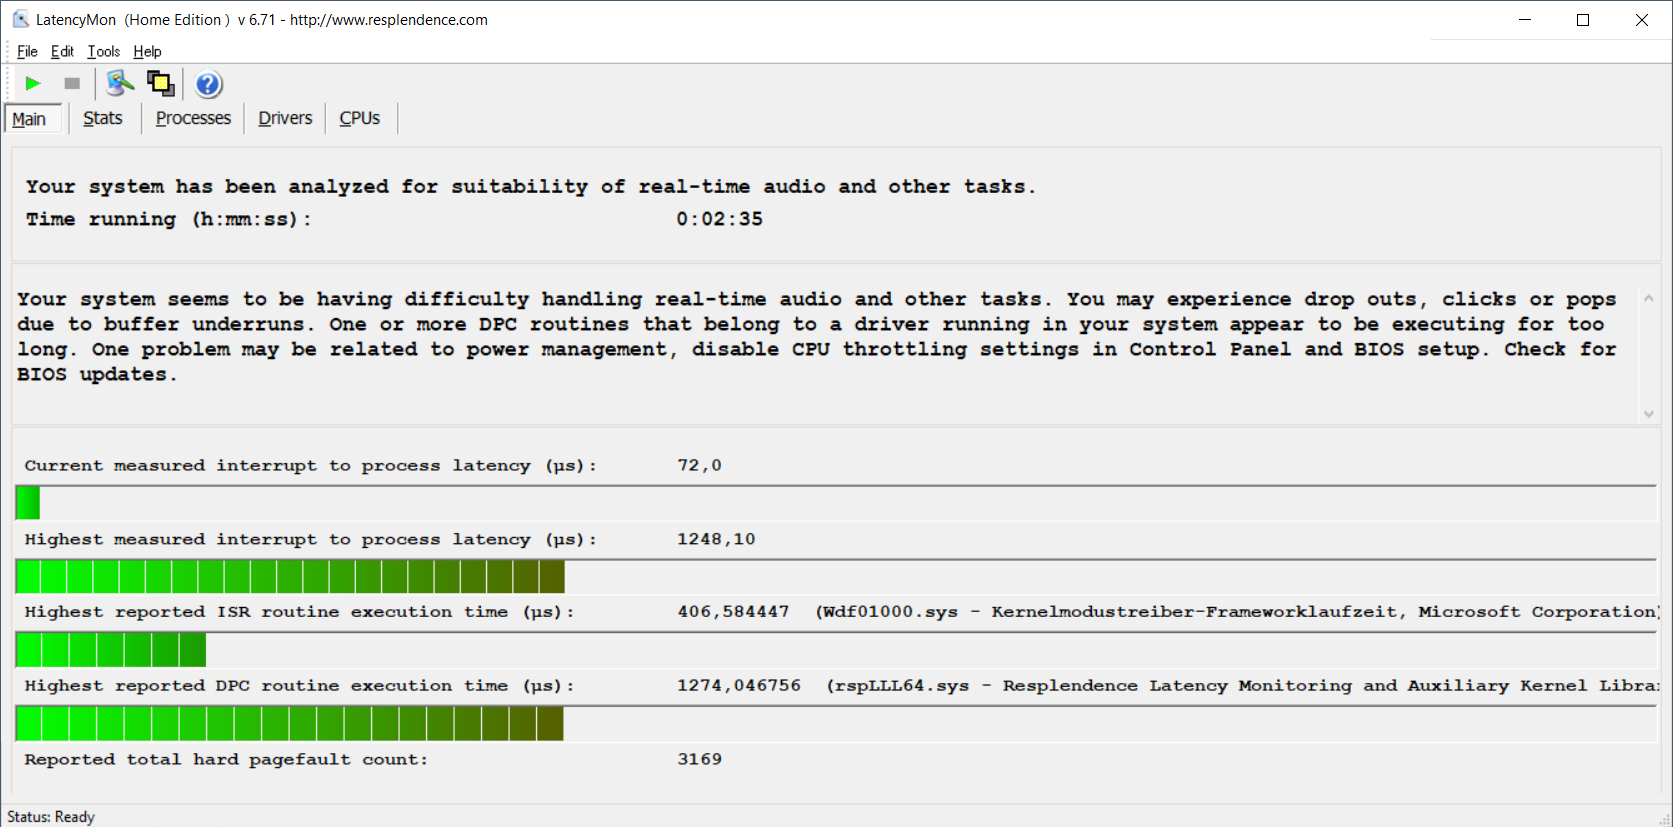
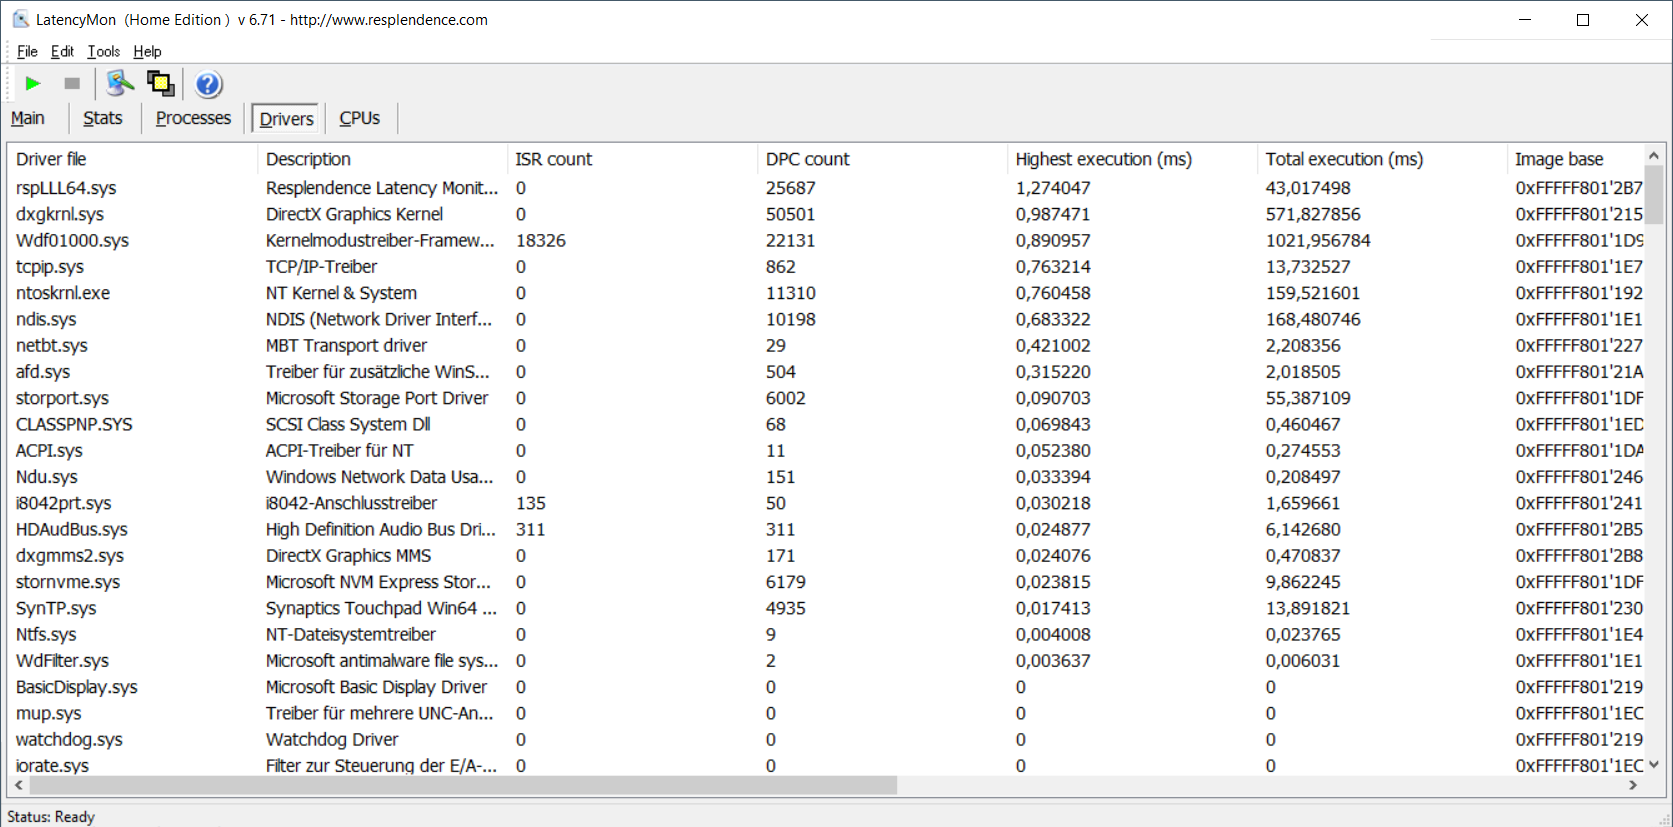
| DPC Latencies / LatencyMon - interrupt to process latency (max), Web, Youtube, Prime95 | |
| Dell Latitude 14 5410-RJ80D | |
| Lenovo ThinkPad T14s-20UJS00K00 | |
| Lenovo ThinkPad T14-20UES00H00 | |
| Lenovo ThinkPad T14-20S1S06B00 | |
| HP EliteBook 845 G7-23Y60EA | |
* ... smaller is better
Storage Devices - T14 with fast Samsung PCIe-SSD
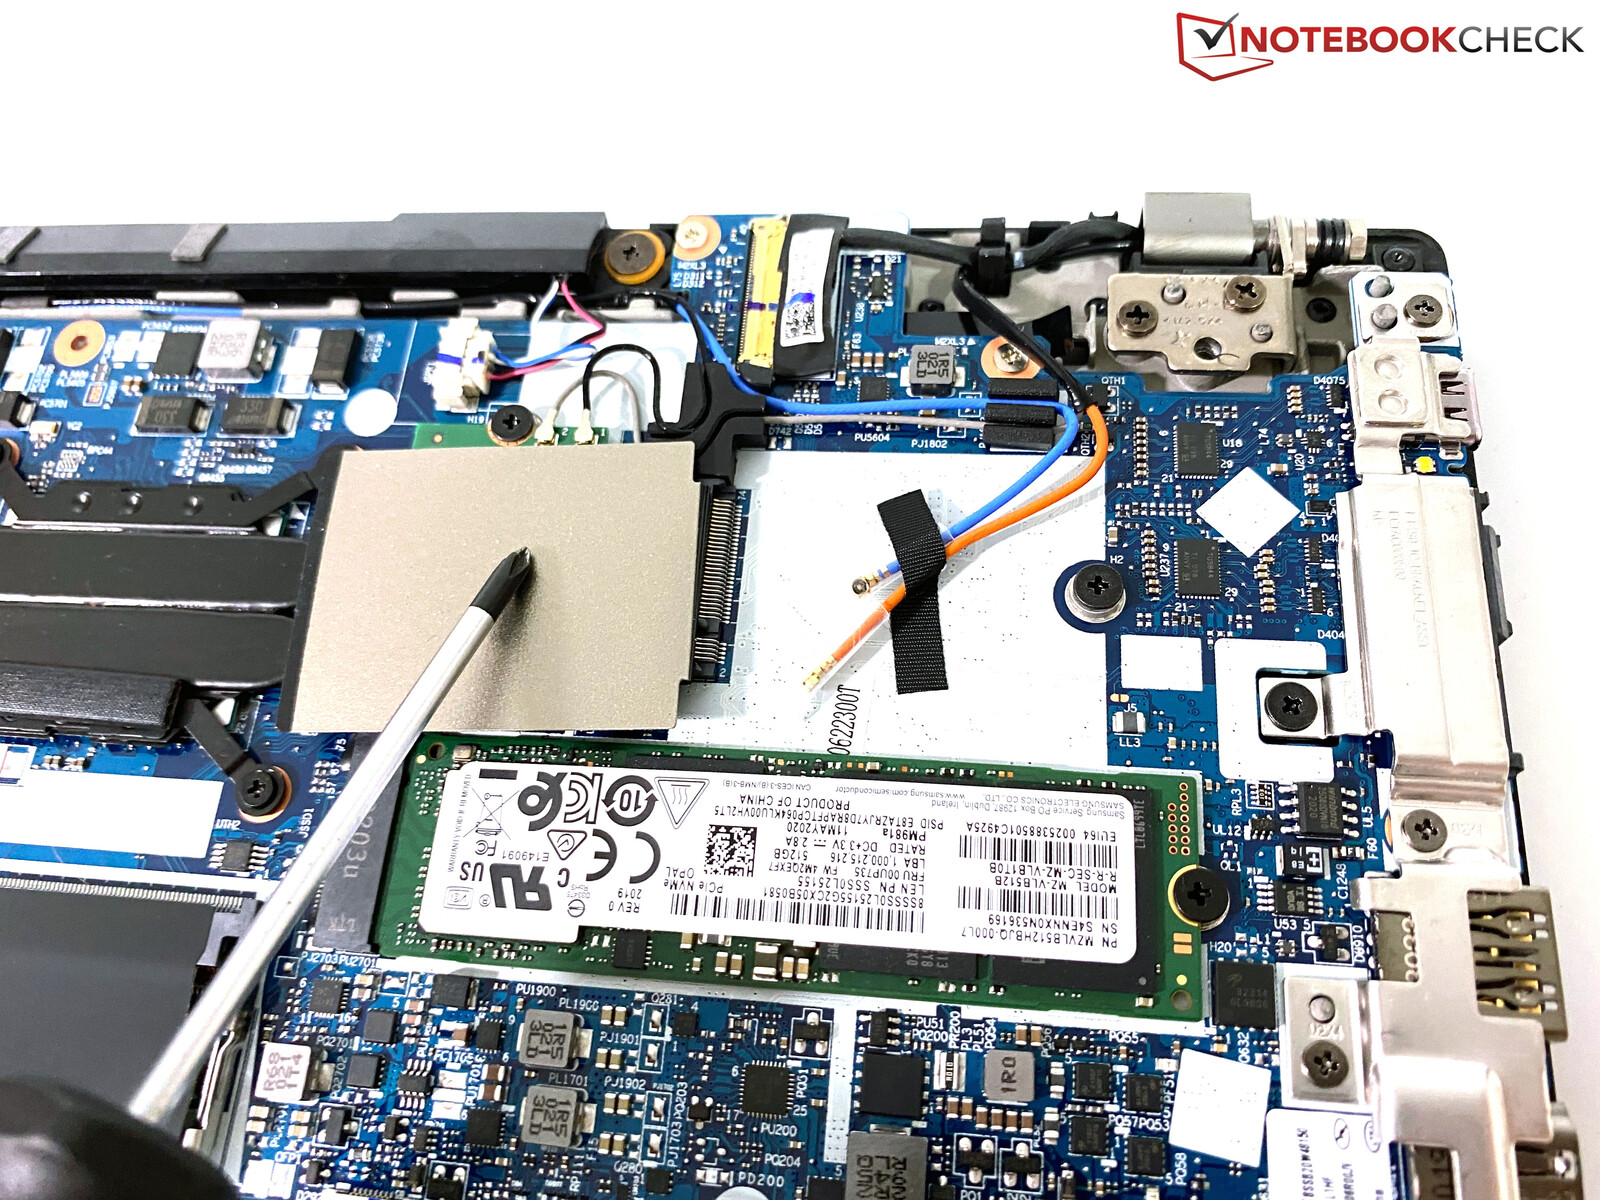
The ThinkPad T14 has a slot for a regular M.2-2280 SSD. Our test unit is equipped with a drive from Samsung (PM981a) and a capacity of 512 GB, and you can use 445 GB after the initial set-up. The performance of the PCIe-SSD is very good. The empty M.2-2242 slot, which is intended for the optional WWAN module, can also be equipped with a PCIe-SSD.
| Lenovo ThinkPad T14-20UES00H00 Samsung SSD PM981a MZVLB512HBJQ | HP EliteBook 845 G7-23Y60EA Samsung PM991 MZVLQ256HAJD | Dell Latitude 14 5410-RJ80D Toshiba KBG40ZNS256G NVMe | Lenovo ThinkPad T14s-20UJS00K00 WDC PC SN730 SDBPNTY-1T00 | Lenovo ThinkPad T14-20S1S06B00 Lite-On CA5-8D512 | Lenovo ThinkPad T495-20NKS01Y00 Samsung SSD PM981 MZVLB512HAJQ | Average Samsung SSD PM981a MZVLB512HBJQ | |
|---|---|---|---|---|---|---|---|
| CrystalDiskMark 5.2 / 6 | -34% | -20% | 5% | 1% | 10% | 15% | |
| Write 4K (MB/s) | 88.1 | 80.6 -9% | 95.5 8% | 108 23% | 114.1 30% | 137.7 56% | 140.8 ? 60% |
| Read 4K (MB/s) | 38.28 | 31.2 -18% | 47.14 23% | 39.82 4% | 53.6 40% | 44.11 15% | 48.6 ? 27% |
| Write Seq (MB/s) | 2002 | 883 -56% | 1251 -38% | 2028 1% | 1743 -13% | 2714 36% | 2106 ? 5% |
| Read Seq (MB/s) | 2153 | 1352 -37% | 1624 -25% | 1826 -15% | 2092 -3% | 2665 24% | 2099 ? -3% |
| Write 4K Q32T1 (MB/s) | 423.7 | 361 -15% | 333.5 -21% | 570 35% | 394.8 -7% | 251.2 -41% | 451 ? 6% |
| Read 4K Q32T1 (MB/s) | 393.2 | 272 -31% | 335.2 -15% | 401.5 2% | 372.6 -5% | 336.6 -14% | 482 ? 23% |
| Write Seq Q32T1 (MB/s) | 2889 | 979 -66% | 1234 -57% | 3091 7% | 2176 -25% | 2994 4% | 2903 ? 0% |
| Read Seq Q32T1 (MB/s) | 3566 | 2286 -36% | 2247 -37% | 2872 -19% | 3204 -10% | 3547 -1% | 3511 ? -2% |
| AS SSD | -65% | -99% | 9% | 19% | 13% | 9% | |
| Seq Read (MB/s) | 2138 | 1649 -23% | 1837 -14% | 2291 7% | 2125 -1% | 2661 24% | 2412 ? 13% |
| Seq Write (MB/s) | 1226 | 615 -50% | 700 -43% | 1343 10% | 1087 -11% | 2330 90% | 1983 ? 62% |
| 4K Read (MB/s) | 55 | 42.8 -22% | 44.5 -19% | 42.56 -23% | 49.34 -10% | 48.28 -12% | 53.1 ? -3% |
| 4K Write (MB/s) | 123.5 | 110.5 -11% | 90.1 -27% | 132.2 7% | 119 -4% | 94.7 -23% | 131.1 ? 6% |
| 4K-64 Read (MB/s) | 850 | 450 -47% | 905 6% | 850 0% | 859 1% | 1475 74% | 1201 ? 41% |
| 4K-64 Write (MB/s) | 1852 | 780 -58% | 447.8 -76% | 2262 22% | 1125 -39% | 1494 -19% | 1726 ? -7% |
| Access Time Read * (ms) | 0.04 | 0.154 -285% | 0.16 -300% | 0.05 -25% | 0.058 -45% | 0.046 -15% | 0.05525 ? -38% |
| Access Time Write * (ms) | 0.029 | 0.035 -21% | 0.175 -503% | 0.028 3% | 0.032 -10% | 0.041 -41% | 0.05394 ? -86% |
| Score Read (Points) | 1119 | 658 -41% | 1133 1% | 1121 0% | 1121 0% | 1790 60% | 1495 ? 34% |
| Score Write (Points) | 2098 | 953 -55% | 608 -71% | 2529 21% | 1353 -36% | 1822 -13% | 2055 ? -2% |
| Score Total (Points) | 3758 | 1910 -49% | 2273 -40% | 4185 11% | 3007 -20% | 4514 20% | 4303 ? 15% |
| Copy ISO MB/s (MB/s) | 1386 | 236 -83% | 2546 84% | 1265 -9% | 1894 ? 37% | ||
| Copy Program MB/s (MB/s) | 417.7 | 60.6 -85% | 428.6 3% | 1353 224% | 539 ? 29% | ||
| Copy Game MB/s (MB/s) | 916 | 126.6 -86% | 943 3% | 3007 228% | 1193 ? 30% | ||
| Total Average (Program / Settings) | -50% /
-54% | -60% /
-66% | 7% /
7% | 10% /
13% | 12% /
12% | 12% /
11% |
* ... smaller is better

DiskSpd Read Loop, Queue Depth 8
GPU Performance - Radeon RX Vega 6
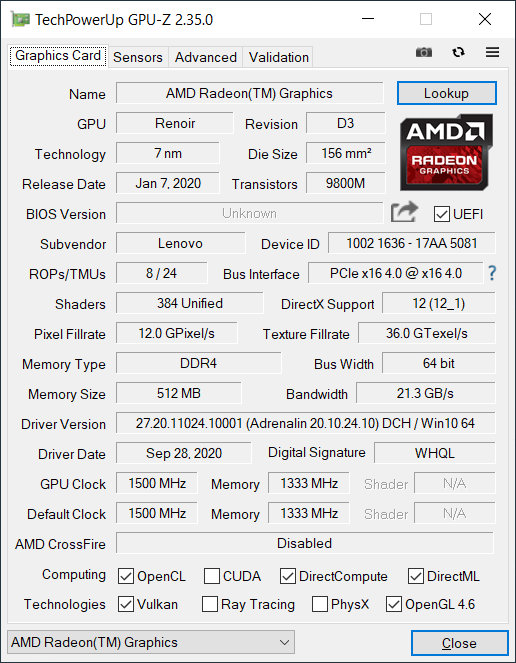
The AMD Ryzen 5 Pro 4650U is equipped with the integrated graphics unit Radeon RX Vega 6. Compared to previous versions of the Vega 6, the core clock is now much higher (1500 vs. 1100 MHz), but the performance of our test unit is throttled due to the single-channel memory configuration. As soon as we add the second memory module, there are performance gains between 30% and 44% (see table) depending on the benchmark. Intel's iGPUs from the Comet Lake chips (which are still used for business laptops right now) are much slower.
The performance of the iGPU remains stable under sustained workloads; the device easily passes the Fire Strike stress test at 99.4%. There is no performance reduction on battery, either.
| Benchmark | Single-Channel RAM | Dual-Channel RAM | Difference |
|---|---|---|---|
| 3DMark 11 Graphics | 3608 | 4711 | +30% |
| 3DMark Fire Strike Graphics | 2228 | 3217 | +44% |
| 3DMark Time Spy Graphics | 661 | 884 | +33% |
| 3DMark 11 Performance | 3754 points | |
| 3DMark Fire Strike Score | 2018 points | |
| 3DMark Time Spy Score | 758 points | |
Help | ||
Gaming Performance
An office laptop like the T14 is obviously not a gaming machine, but simple titles actually run smoothly at low settings. A second memory module once again improves the performance noticeably, which is also shown by the following table.
| Benchmark | Single-Channel RAM | Dual-Channel RAM | Difference |
|---|---|---|---|
| Witcher 3 Low | 39 FPS | 60 FPS | +54% |
| Far Cry 5 Low | 27 FPS | 42 FPS | +56% |
| F1 2020 Low | 50 FPS | 74 FPS | +48% |
| low | med. | high | ultra | |
|---|---|---|---|---|
| The Witcher 3 (2015) | 39 | 12.5 | ||
| Dota 2 Reborn (2015) | 88.5 | 67.1 | 33.7 | 31.3 |
| X-Plane 11.11 (2018) | 36.1 | 26.8 | 24.5 | |
| Far Cry 5 (2018) | 27 | 13 | 12 | |
| F1 2020 (2020) | 50 | 25 |
Emissions - Quiet fan and high temperatures
System Noise
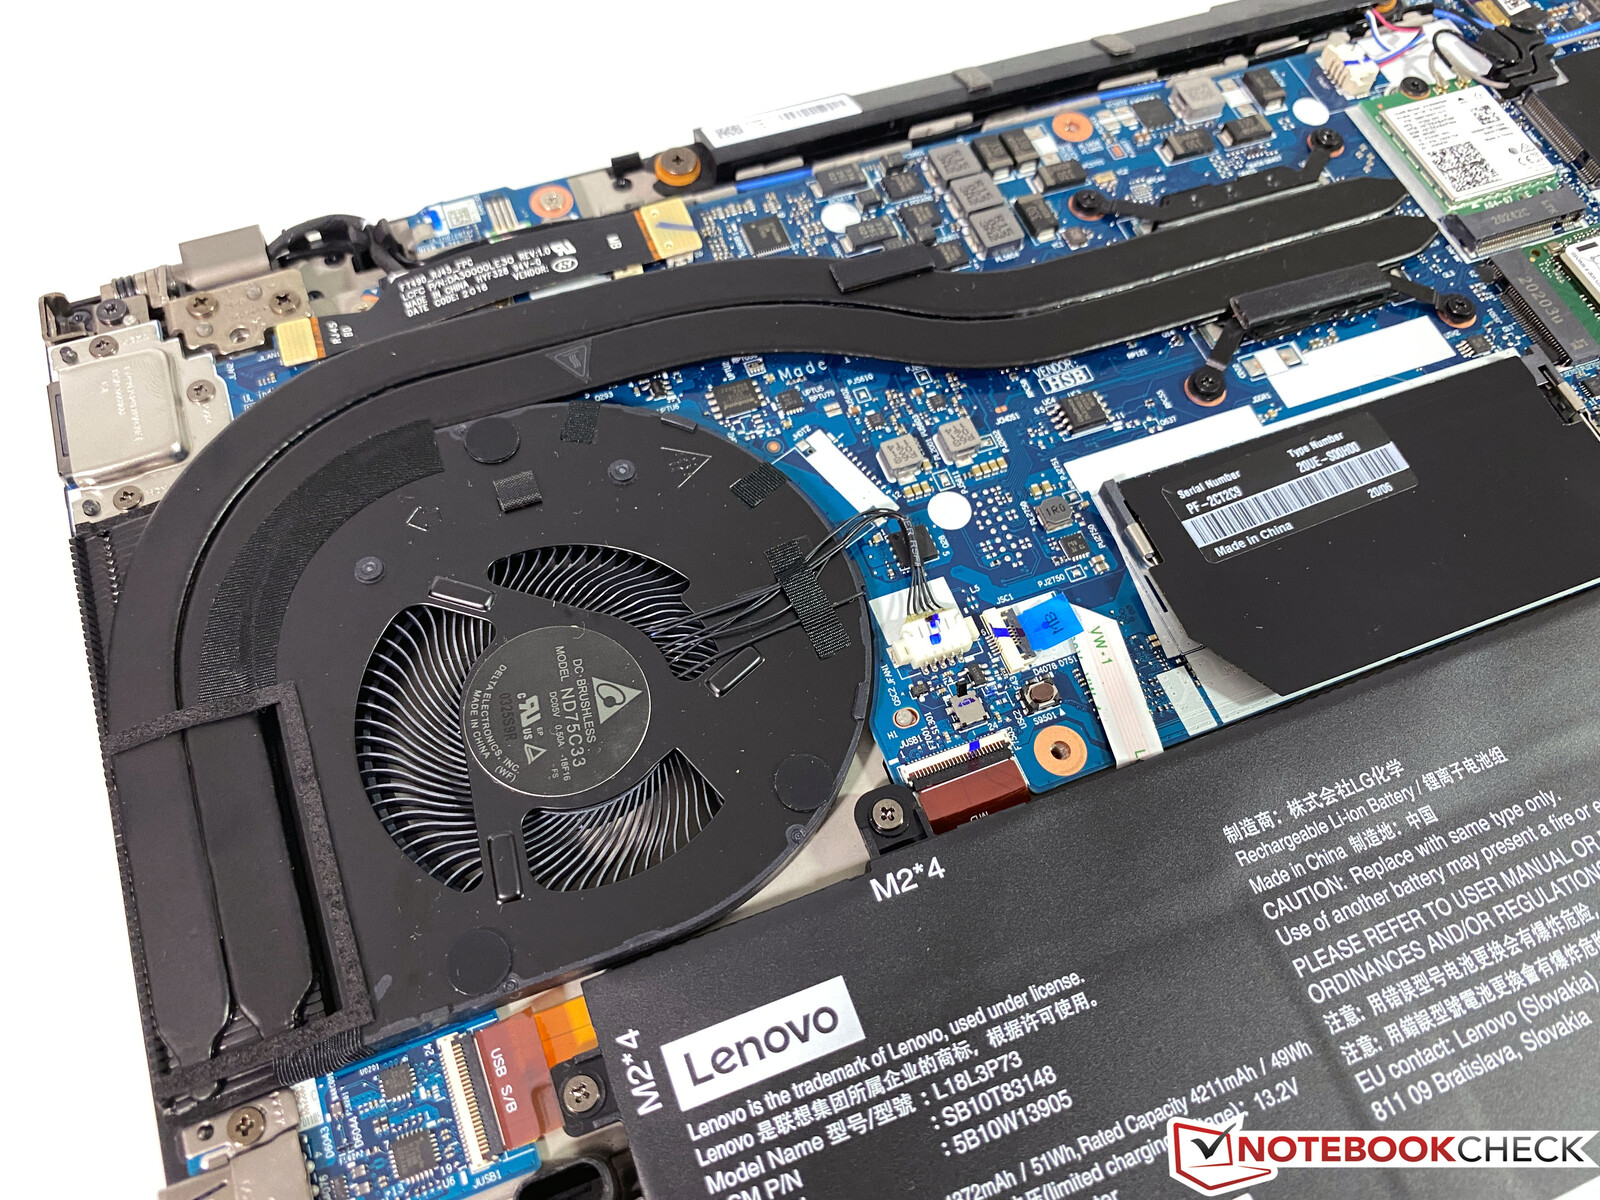
Similar to the Intel model of the ThinkPad T14 as well as the ThinkPad T14s, the fan of our AMD-based review unit is pretty restrained and stays very quiet even under full load. All in all, all three systems are very similar in our measurements, so Lenovo still favors a quiet fan noise for its business laptops. We did not notice any other electronic sounds during our review period.
Noise level
| Idle |
| 29.3 / 29.3 / 30.3 dB(A) |
| Load |
| 31.3 / 33 dB(A) |
 | ||
30 dB silent 40 dB(A) audible 50 dB(A) loud |
||
min: | ||
| Lenovo ThinkPad T14-20UES00H00 Vega 6, R5 PRO 4650U, Samsung SSD PM981a MZVLB512HBJQ | HP EliteBook 845 G7-23Y60EA Vega 6, R5 PRO 4650U, Samsung PM991 MZVLQ256HAJD | Dell Latitude 14 5410-RJ80D UHD Graphics 620, i5-10310U, Toshiba KBG40ZNS256G NVMe | Lenovo ThinkPad T14s-20UJS00K00 Vega 7, R7 PRO 4750U, WDC PC SN730 SDBPNTY-1T00 | Lenovo ThinkPad T14-20S1S06B00 UHD Graphics 620, i5-10210U, Lite-On CA5-8D512 | |
|---|---|---|---|---|---|
| Noise | 12% | 3% | 1% | -2% | |
| off / environment * (dB) | 29.3 | 25.4 13% | 24.9 15% | 29.2 -0% | 29.6 -1% |
| Idle Minimum * (dB) | 29.3 | 25.4 13% | 24.9 15% | 29.2 -0% | 29.6 -1% |
| Idle Average * (dB) | 29.3 | 25.4 13% | 24.9 15% | 29.2 -0% | 29.6 -1% |
| Idle Maximum * (dB) | 30.3 | 25.4 16% | 24.9 18% | 29.6 2% | 29.6 2% |
| Load Average * (dB) | 31.3 | 29.6 5% | 38.7 -24% | 30.2 4% | 33.5 -7% |
| Witcher 3 ultra * (dB) | 33 | 32.3 2% | |||
| Load Maximum * (dB) | 33 | 29.5 11% | 39.2 -19% | 32.3 2% | 33.5 -2% |
* ... smaller is better
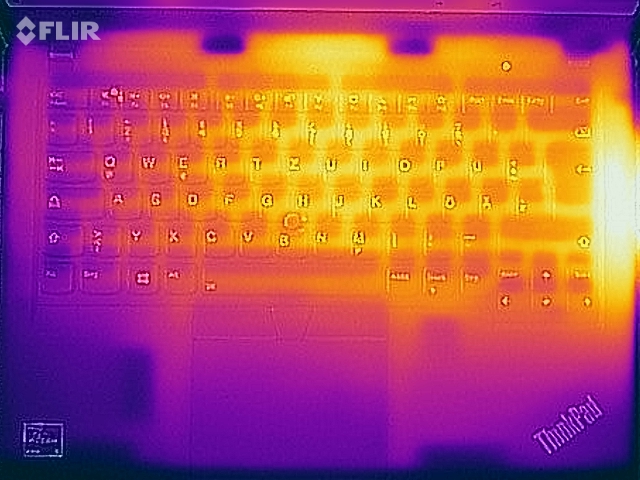
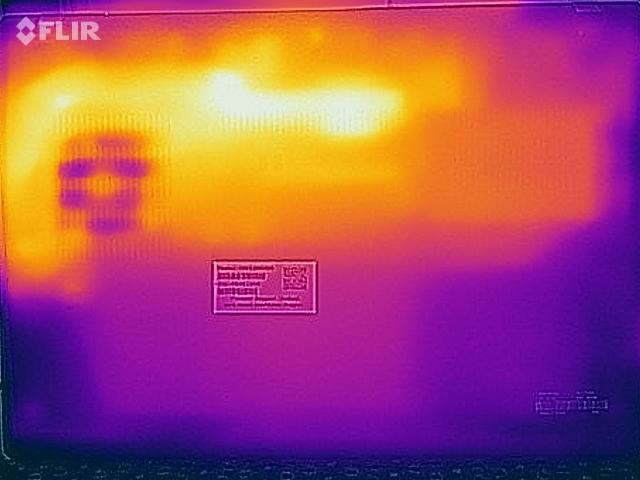
Temperature
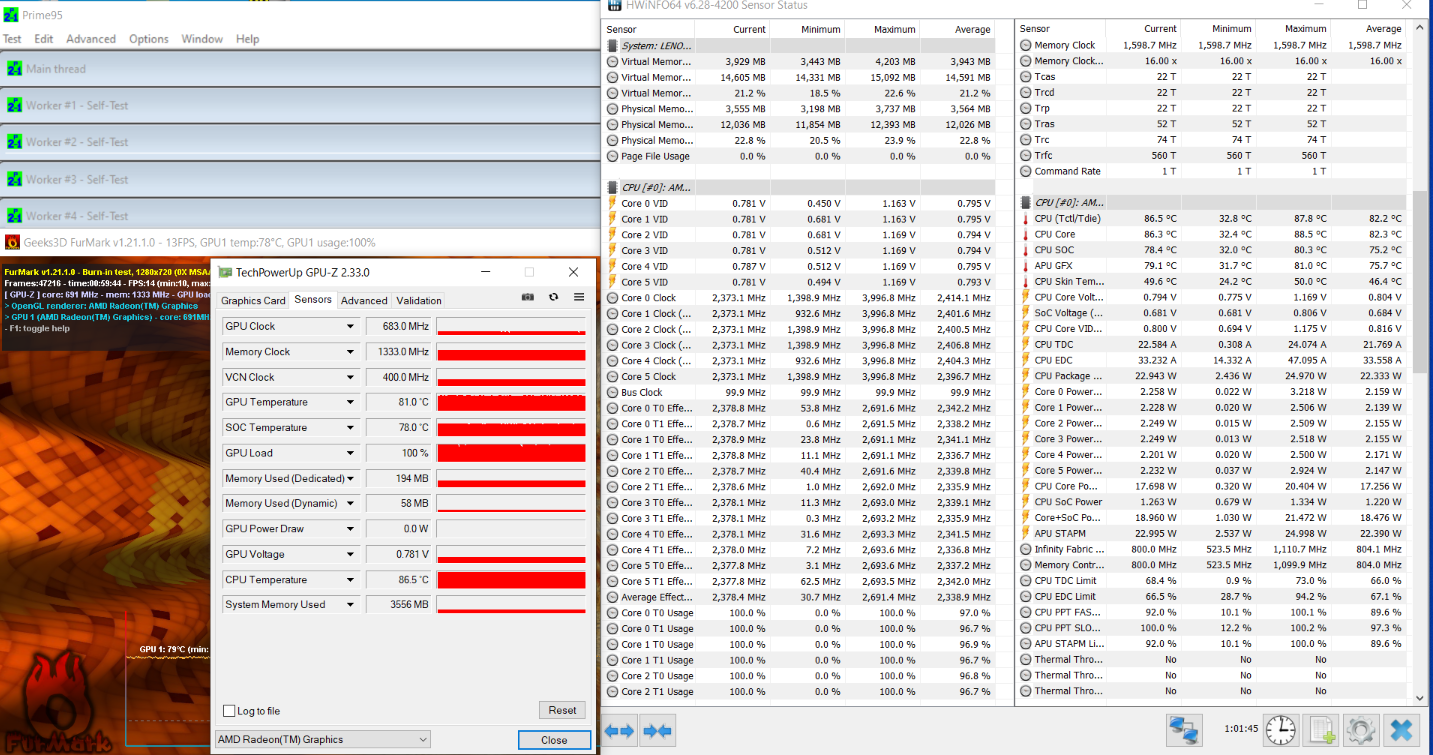
However, the quiet fan noise results in high surface temperatures under load, even though the results are lower compared to the T14 with the Intel CPU. We can still measure almost 60 °C at the bottom and 50 °C at the top of the base unit in our stress test. These temperatures are just too high for an office laptop and you should definitely not put the device on your lap when you stress it.
Similar to pure CPU stress, the power consumption of the APU quickly levels off at 23 W and stays there. This results in a CPU clock of 6x ~2.4 GHz and ~700 MHz for the iGPU.
(-) The maximum temperature on the upper side is 49.2 °C / 121 F, compared to the average of 34.3 °C / 94 F, ranging from 21.2 to 62.5 °C for the class Office.
(-) The bottom heats up to a maximum of 59.2 °C / 139 F, compared to the average of 36.8 °C / 98 F
(+) In idle usage, the average temperature for the upper side is 25.9 °C / 79 F, compared to the device average of 29.5 °C / 85 F.
(+) The palmrests and touchpad are reaching skin temperature as a maximum (33.5 °C / 92.3 F) and are therefore not hot.
(-) The average temperature of the palmrest area of similar devices was 27.6 °C / 81.7 F (-5.9 °C / -10.6 F).
Speakers
Lenovo ThinkPad T14-20UES00H00 audio analysis
(-) | not very loud speakers (70.2 dB)
Bass 100 - 315 Hz
(±) | reduced bass - on average 13.8% lower than median
(±) | linearity of bass is average (11.9% delta to prev. frequency)
Mids 400 - 2000 Hz
(±) | higher mids - on average 6.5% higher than median
(±) | linearity of mids is average (7.1% delta to prev. frequency)
Highs 2 - 16 kHz
(+) | balanced highs - only 3.1% away from median
(+) | highs are linear (6% delta to prev. frequency)
Overall 100 - 16.000 Hz
(±) | linearity of overall sound is average (24.6% difference to median)
Compared to same class
» 72% of all tested devices in this class were better, 7% similar, 21% worse
» The best had a delta of 7%, average was 21%, worst was 53%
Compared to all devices tested
» 74% of all tested devices were better, 6% similar, 20% worse
» The best had a delta of 4%, average was 24%, worst was 134%
HP EliteBook 845 G7-23Y60EA audio analysis
(-) | not very loud speakers (67.8 dB)
Bass 100 - 315 Hz
(-) | nearly no bass - on average 19.8% lower than median
(±) | linearity of bass is average (11.7% delta to prev. frequency)
Mids 400 - 2000 Hz
(+) | balanced mids - only 1.3% away from median
(+) | mids are linear (4.8% delta to prev. frequency)
Highs 2 - 16 kHz
(+) | balanced highs - only 3% away from median
(+) | highs are linear (4.5% delta to prev. frequency)
Overall 100 - 16.000 Hz
(±) | linearity of overall sound is average (16.2% difference to median)
Compared to same class
» 39% of all tested devices in this class were better, 4% similar, 57% worse
» The best had a delta of 5%, average was 18%, worst was 53%
Compared to all devices tested
» 25% of all tested devices were better, 5% similar, 69% worse
» The best had a delta of 4%, average was 24%, worst was 134%
Dell Latitude 14 5410-RJ80D audio analysis
(±) | speaker loudness is average but good (77.5 dB)
Bass 100 - 315 Hz
(-) | nearly no bass - on average 19.7% lower than median
(±) | linearity of bass is average (8.7% delta to prev. frequency)
Mids 400 - 2000 Hz
(+) | balanced mids - only 4.6% away from median
(±) | linearity of mids is average (7.4% delta to prev. frequency)
Highs 2 - 16 kHz
(±) | higher highs - on average 5.2% higher than median
(+) | highs are linear (5.1% delta to prev. frequency)
Overall 100 - 16.000 Hz
(±) | linearity of overall sound is average (16% difference to median)
Compared to same class
» 17% of all tested devices in this class were better, 6% similar, 77% worse
» The best had a delta of 7%, average was 21%, worst was 53%
Compared to all devices tested
» 24% of all tested devices were better, 5% similar, 70% worse
» The best had a delta of 4%, average was 24%, worst was 134%
Energy Management - AMD ThinkPad with increased power consumption
Power Consumption
Our idle measurements show that Lenovo still has to improve the power consumption of the AMD ThinkPad. Similar to the T14s, the results are higher compared to the Intel counterparts. HP's EliteBook 845 G7 with the AMD APU, for example, is also more than 2 W more efficient in our idle min scenario (where the maximum display brightness is not relevant). The included 65 W power adapter is completely sufficient, even during the stress test.
| Off / Standby | |
| Idle | |
| Load |
|
Key:
min: | |
| Lenovo ThinkPad T14-20UES00H00 R5 PRO 4650U, Vega 6, Samsung SSD PM981a MZVLB512HBJQ, IPS, 1920x1080, 14" | HP EliteBook 845 G7-23Y60EA R5 PRO 4650U, Vega 6, Samsung PM991 MZVLQ256HAJD, IPS, 1920x1080, 14" | Dell Latitude 14 5410-RJ80D i5-10310U, UHD Graphics 620, Toshiba KBG40ZNS256G NVMe, a-Si IPS LED, 1920x1080, 14" | Lenovo ThinkPad T14s-20UJS00K00 R7 PRO 4750U, Vega 7, WDC PC SN730 SDBPNTY-1T00, IPS , 1920x1080, 14" | Lenovo ThinkPad T14-20S1S06B00 i5-10210U, UHD Graphics 620, Lite-On CA5-8D512, LTPS IPS LED, 1920x1080, 14" | Lenovo ThinkPad T495-20NKS01Y00 R5 PRO 3500U, Vega 8, Samsung SSD PM981 MZVLB512HAJQ, IPS, 1920x1080, 14" | Average AMD Radeon RX Vega 6 (Ryzen 4000/5000) | Average of class Office | |
|---|---|---|---|---|---|---|---|---|
| Power Consumption | 29% | 19% | -0% | -1% | 5% | 12% | -3% | |
| Idle Minimum * (Watt) | 5.8 | 3.1 47% | 2.9 50% | 5.7 2% | 3.2 45% | 5.1 12% | 3.98 ? 31% | 4.54 ? 22% |
| Idle Average * (Watt) | 8.3 | 5.6 33% | 4.5 46% | 8.9 -7% | 6.1 27% | 7.7 7% | 6.53 ? 21% | 7.52 ? 9% |
| Idle Maximum * (Watt) | 11 | 8.6 22% | 7.4 33% | 11 -0% | 10.4 5% | 10.7 3% | 8.65 ? 21% | 8.91 ? 19% |
| Load Average * (Watt) | 39.5 | 28.4 28% | 34.6 12% | 38.2 3% | 45.6 -15% | 35.8 9% | 35 ? 11% | 42.8 ? -8% |
| Load Maximum * (Watt) | 40.8 | 35.4 13% | 60 -47% | 40.2 1% | 68.6 -68% | 43.2 -6% | 51.5 ? -26% | 64.3 ? -58% |
* ... smaller is better
Battery Runtime
The battery capacity (50 Wh) is identical to the Intel SKU, but the battery runtime is shorter due to the higher consumption values. About 8.5 hours in the Wi-Fi test (or 7.5 hours at full brightness, respectively) is not a bad result for the AMD T14, but the Intel T14 lasts much longer at 11 and 8:13 hours. However, the AMD model is ahead in the video test, so it looks like the iGPU is more efficient than the Intel counterpart. Both versions will drain the battery in about 70 minutes under load.
| Lenovo ThinkPad T14-20UES00H00 R5 PRO 4650U, Vega 6, 50 Wh | HP EliteBook 845 G7-23Y60EA R5 PRO 4650U, Vega 6, 56 Wh | Dell Latitude 14 5410-RJ80D i5-10310U, UHD Graphics 620, 68 Wh | Lenovo ThinkPad T14s-20UJS00K00 R7 PRO 4750U, Vega 7, 57 Wh | Lenovo ThinkPad T14-20S1S06B00 i5-10210U, UHD Graphics 620, 50 Wh | Lenovo ThinkPad T495-20NKS01Y00 R5 PRO 3500U, Vega 8, 50 Wh | Average of class Office | |
|---|---|---|---|---|---|---|---|
| Battery runtime | 40% | 56% | 37% | 10% | 17% | 44% | |
| H.264 (h) | 11.6 | 9.5 -18% | 15.2 31% | 13.2 14% | 10.4 -10% | 11.8 2% | 14.9 ? 28% |
| WiFi v1.3 (h) | 8.4 | 12.2 45% | 13.7 63% | 10.2 21% | 11 31% | 9.1 8% | 12.6 ? 50% |
| Load (h) | 1.2 | 2.3 92% | 2.1 75% | 2.1 75% | 1.3 8% | 1.7 42% | 1.846 ? 54% |
| Reader / Idle (h) | 16.2 | 22.3 ? |
Pros
Cons
Verdict - The T14 is also better with AMD APU
Similar to many other ThinkPad models, the T14 with the AMD processor also left a better impression during our review compared to the Intel counterpart. The battery runtime is a bit worse and Thunderbolt 3 is missing as well, but you get HDMI 2.0 in return and the AMD APU is just much more powerful. The performance gap would be even larger if our review unit was equipped with dual-channel memory or the faster Ryzen 7 Pro processor. The lack of the glossy 4K screen for the AMD ThinkPad T14 is not a big deal in our opinion.
The ThinkPad T14 with the AMD processor leaves a good impression in our review and offers much more CPU and GPU performance for a lower price. All in all, it is the better all-rounder for the office.
The AMD model has two more advantages. Lenovo uses the Pro versions of AMD's processors, so you get extended security features. These are available on Intel chips as well, but you will have to pay extra to get processors with vPro support. Then there is the price, because a comparable Intel version of the T14 is about 300 Euros (~$357) more expensive.
The T14 AMD definitely gets our recommendation, even though the T14s AMD is an even better package and stays the best office laptop you can get from Lenovo right now.
Lenovo ThinkPad T14-20UES00H00
- 11/16/2020 v7 (old)
Andreas Osthoff
Price comparison
