The passively cooled M4 SoC makes the competition look old - Apple MacBook Air 13 (M4, base model) review
Unbeatable total package for just under $1,000.
The base model of the new MacBook Air 13 benefits from an extremely fast M4 processor and, in addition to a thin case, still offers a brilliant IPS display, silent operation and long battery life—at least with the brightness reduced.Andreas Osthoff, 👁 Andreas Osthoff (translated by Daisy Dickson) Published 🇩🇪 🇫🇷 ...
Verdict - The M4 SoC shines even inside the smallest MacBook Air
The highlight of the current MacBook Air is of course its M4 processor, which offers enormously high performance even inside the small 13-inch case—without having to be actively cooled. Even under constant load, its multi-core performance is still better than the current Lunar Lake chips from Intel and not far off the actively cooled Snapdragon models. Not to mention its single-core performance, where Apple's M4 generation is at least two generations ahead of the competition. Other advantages of the new chip include support for Thunderbolt 4 and two external displays (in addition to the integrated panel), which has previously always been a weak point of the Air.
Of course, you can complain about its 60 Hz display, especially considering that its MRSP skyrockets if you select any of Apple's expensive upgrades. But if you look at the price of the entry-level version (even at its MRSP of $999), you suddenly won't find as many good displays with higher frequencies, even among the competition. This device's picture quality is also very good, and there is no PWM flickering like you would find on OLED panels. What is more annoying is its high power consumption as soon as you make use of the panel's high brightness.
The base model's price-to-performance ratio is great overall, and the new M4 model can already be found online for less than its MRSP. The fact that Apple still only equips the entry-level model with a 256 GB SSD is of course a big minus point, especially as you can't upgrade it after purchasing. Together with the manufacturer's high upgrade prices, we have to criticize this point. 200 dollars for the jump from 256 to 512 GB is simply outrageous, even if this already includes the M4 SoC with the 10-core GPU.
All-in-all, however, the MacBook Air 13 remains an extremely good overall package and is simply one of the best everyday companions on the market—even if the competition has advantages in some areas.
Pros
Cons
Price and availability

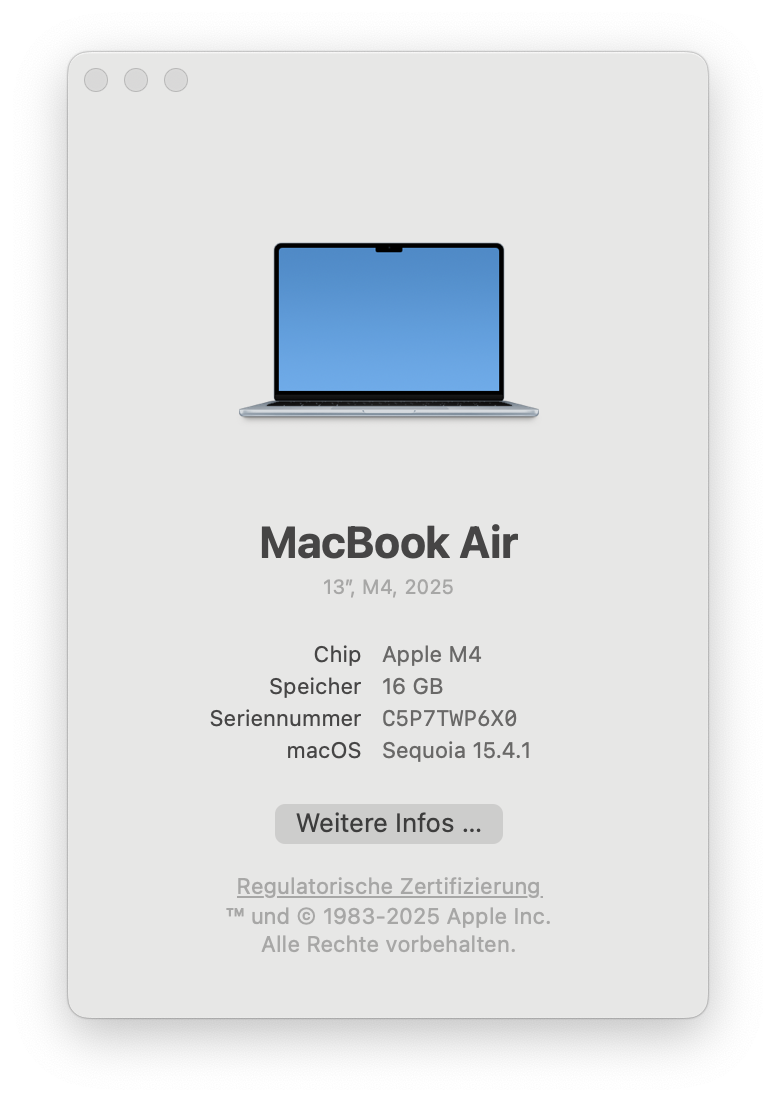
Apple has now launched its MacBook Air models with the M4 processors—and with lower prices. We have already been able to test the larger 15-inch model in detail, so now let's take a look at the entry-level version of the smaller MacBook Air 13, which is available for around $950 (MRSP: $999). It comes with the M4 SoC with 10 CPU and 8 GPU cores, 16 GB RAM and a 256-GB SSD.
In this article, we will focus on the performance of the new M4 processor. For comprehensive information on the laptop's case, input devices, display and speakers, please refer to our detailed review of the predecessor model and the larger MacBook Air 15 M4.
Specifications
Differences compared to the MacBook Air M3
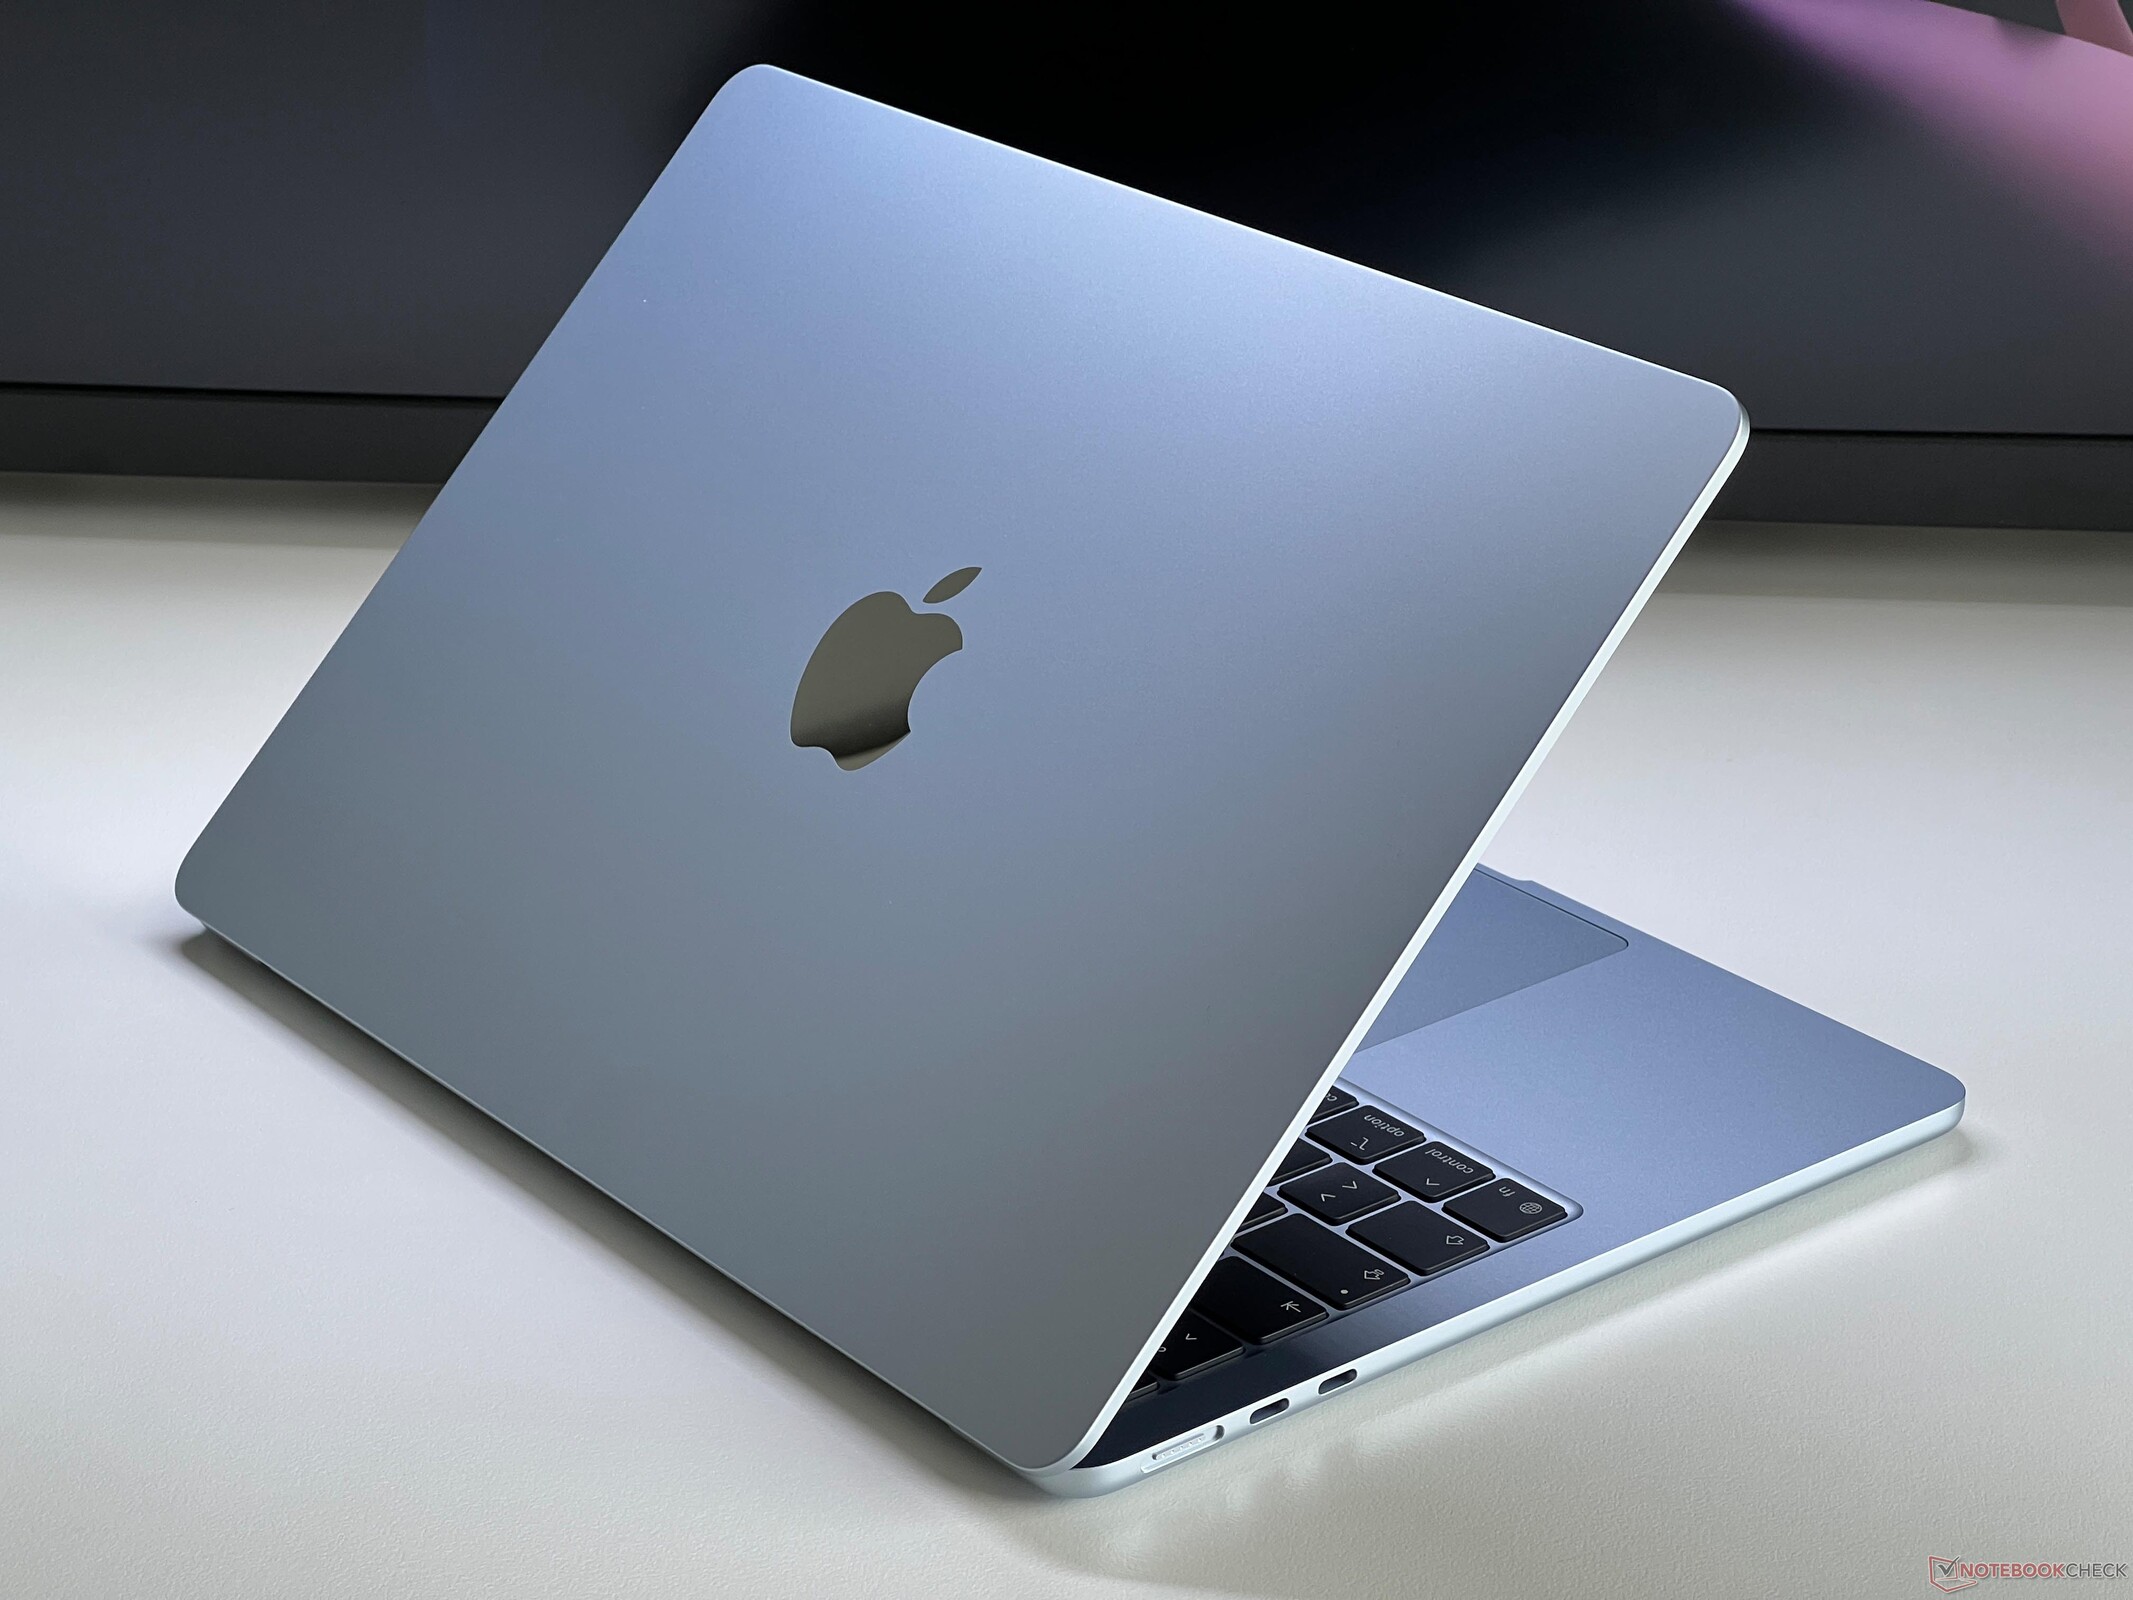
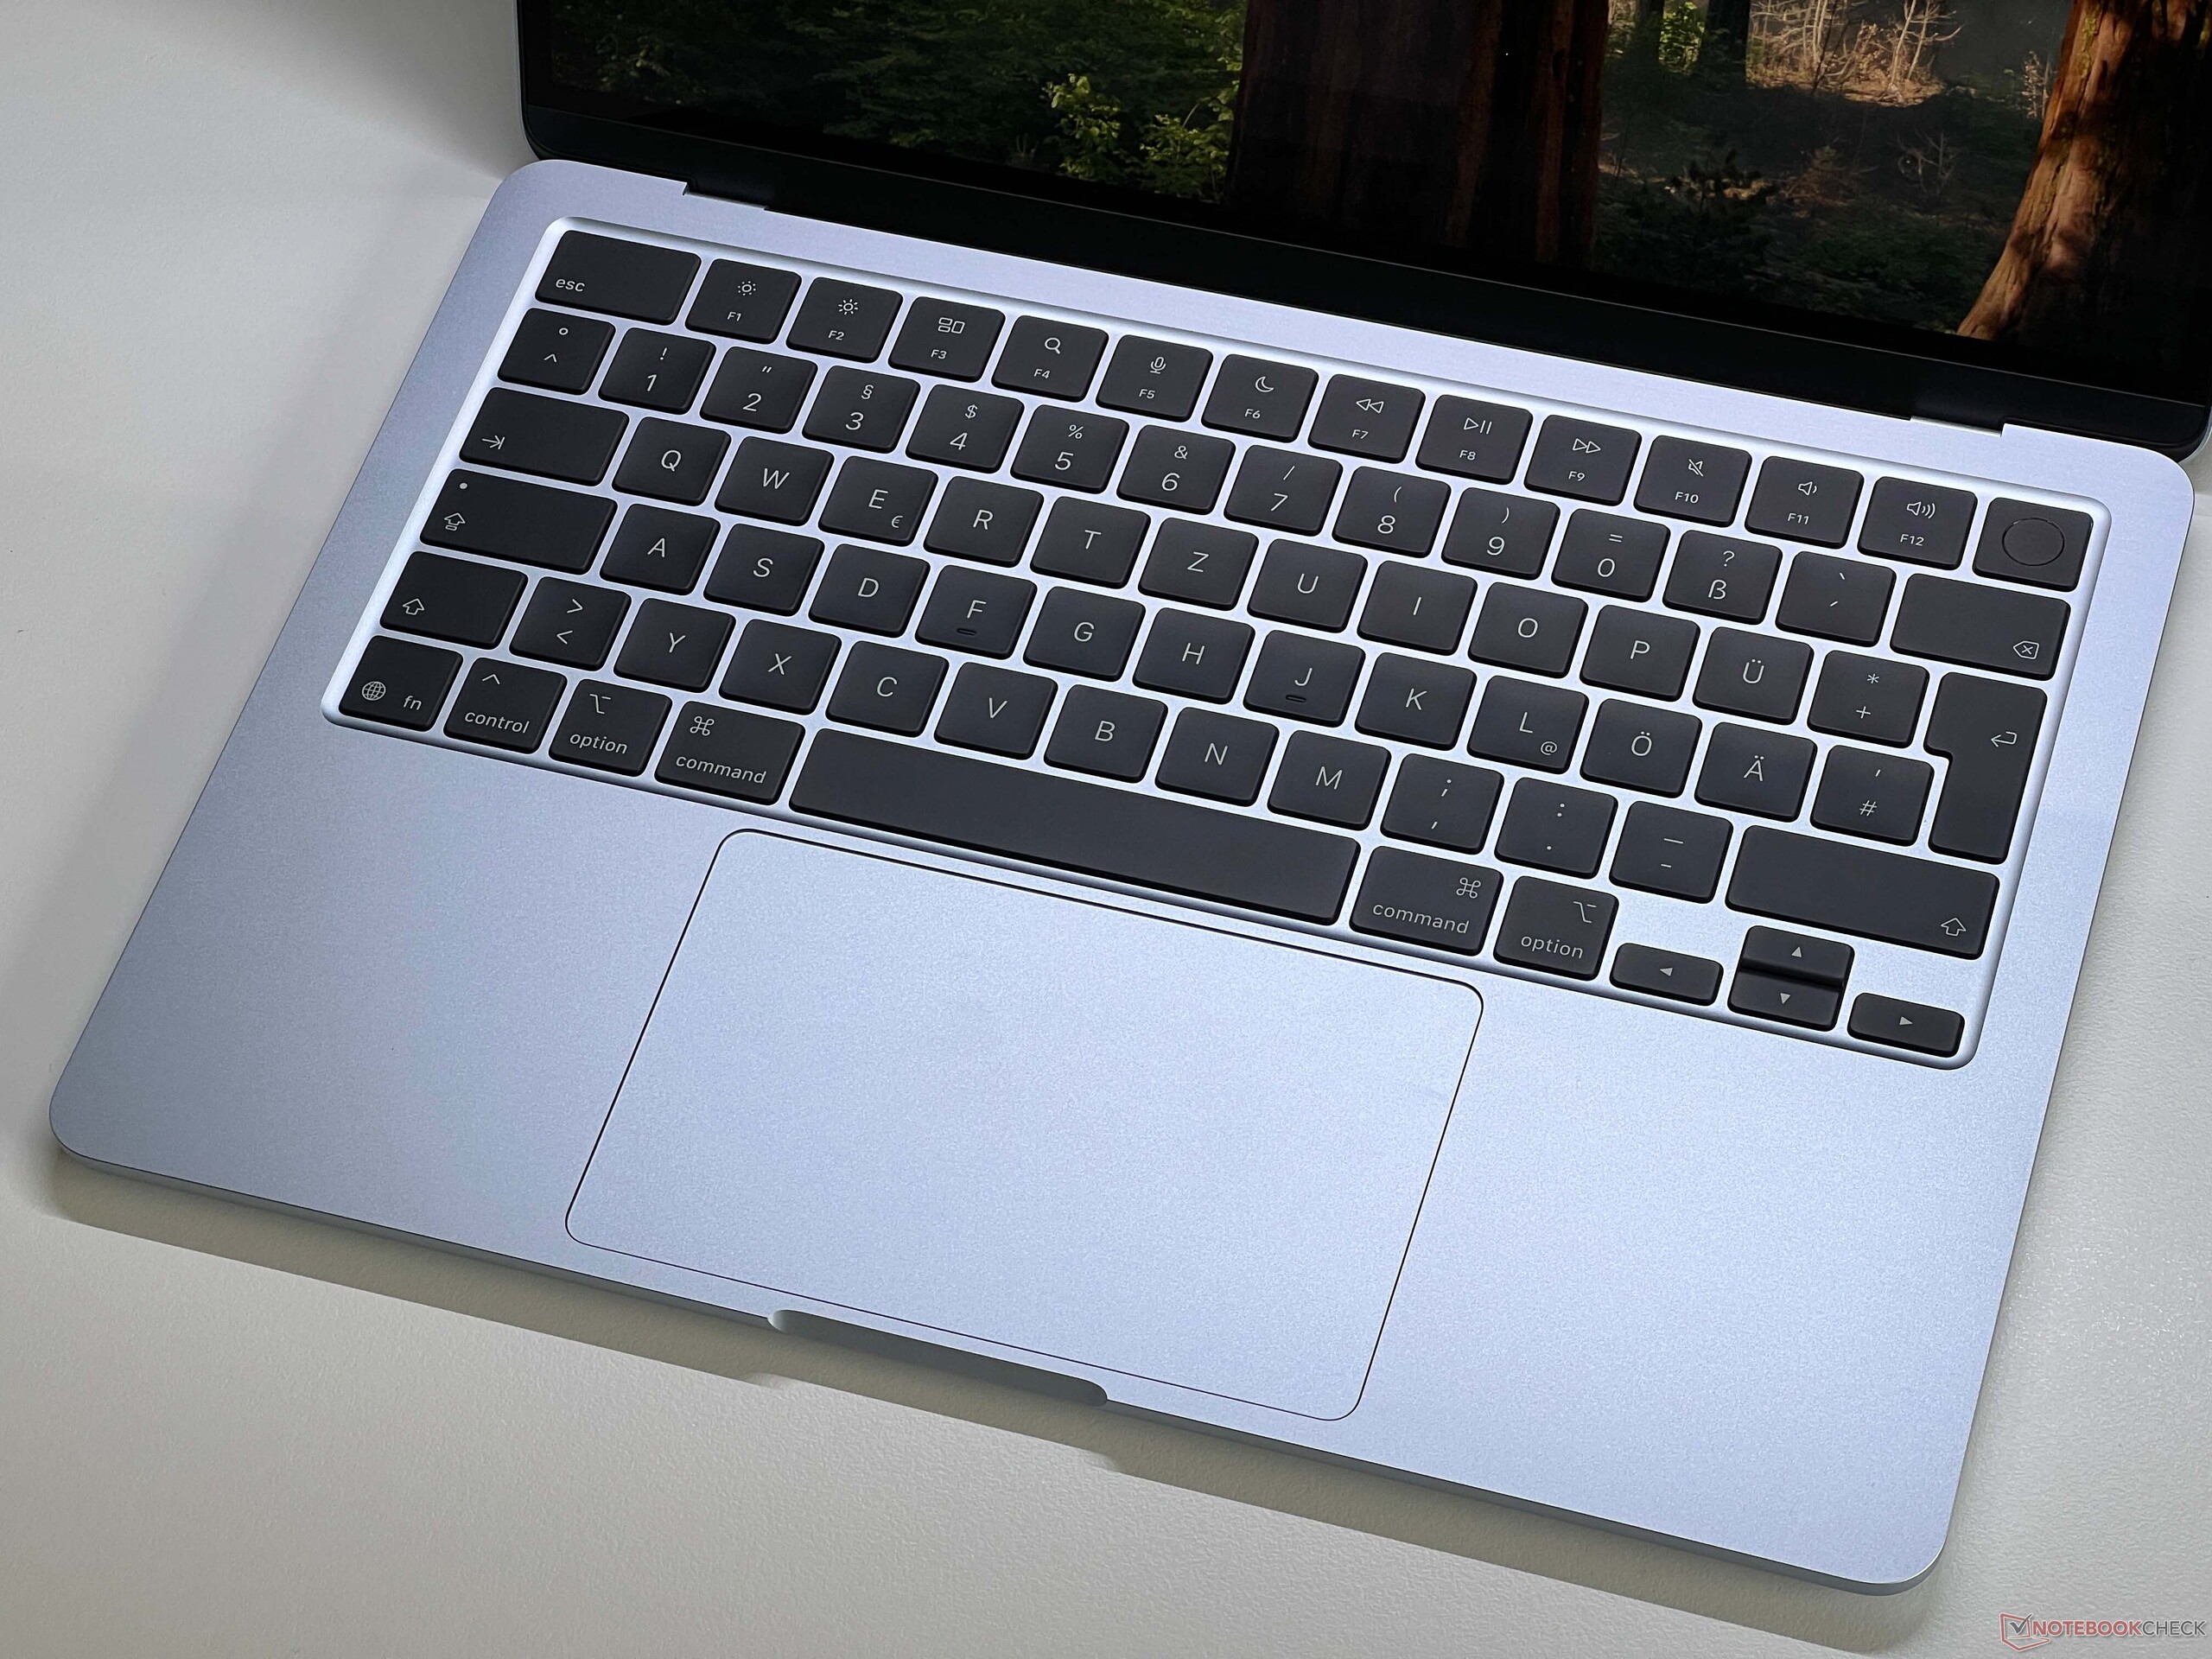
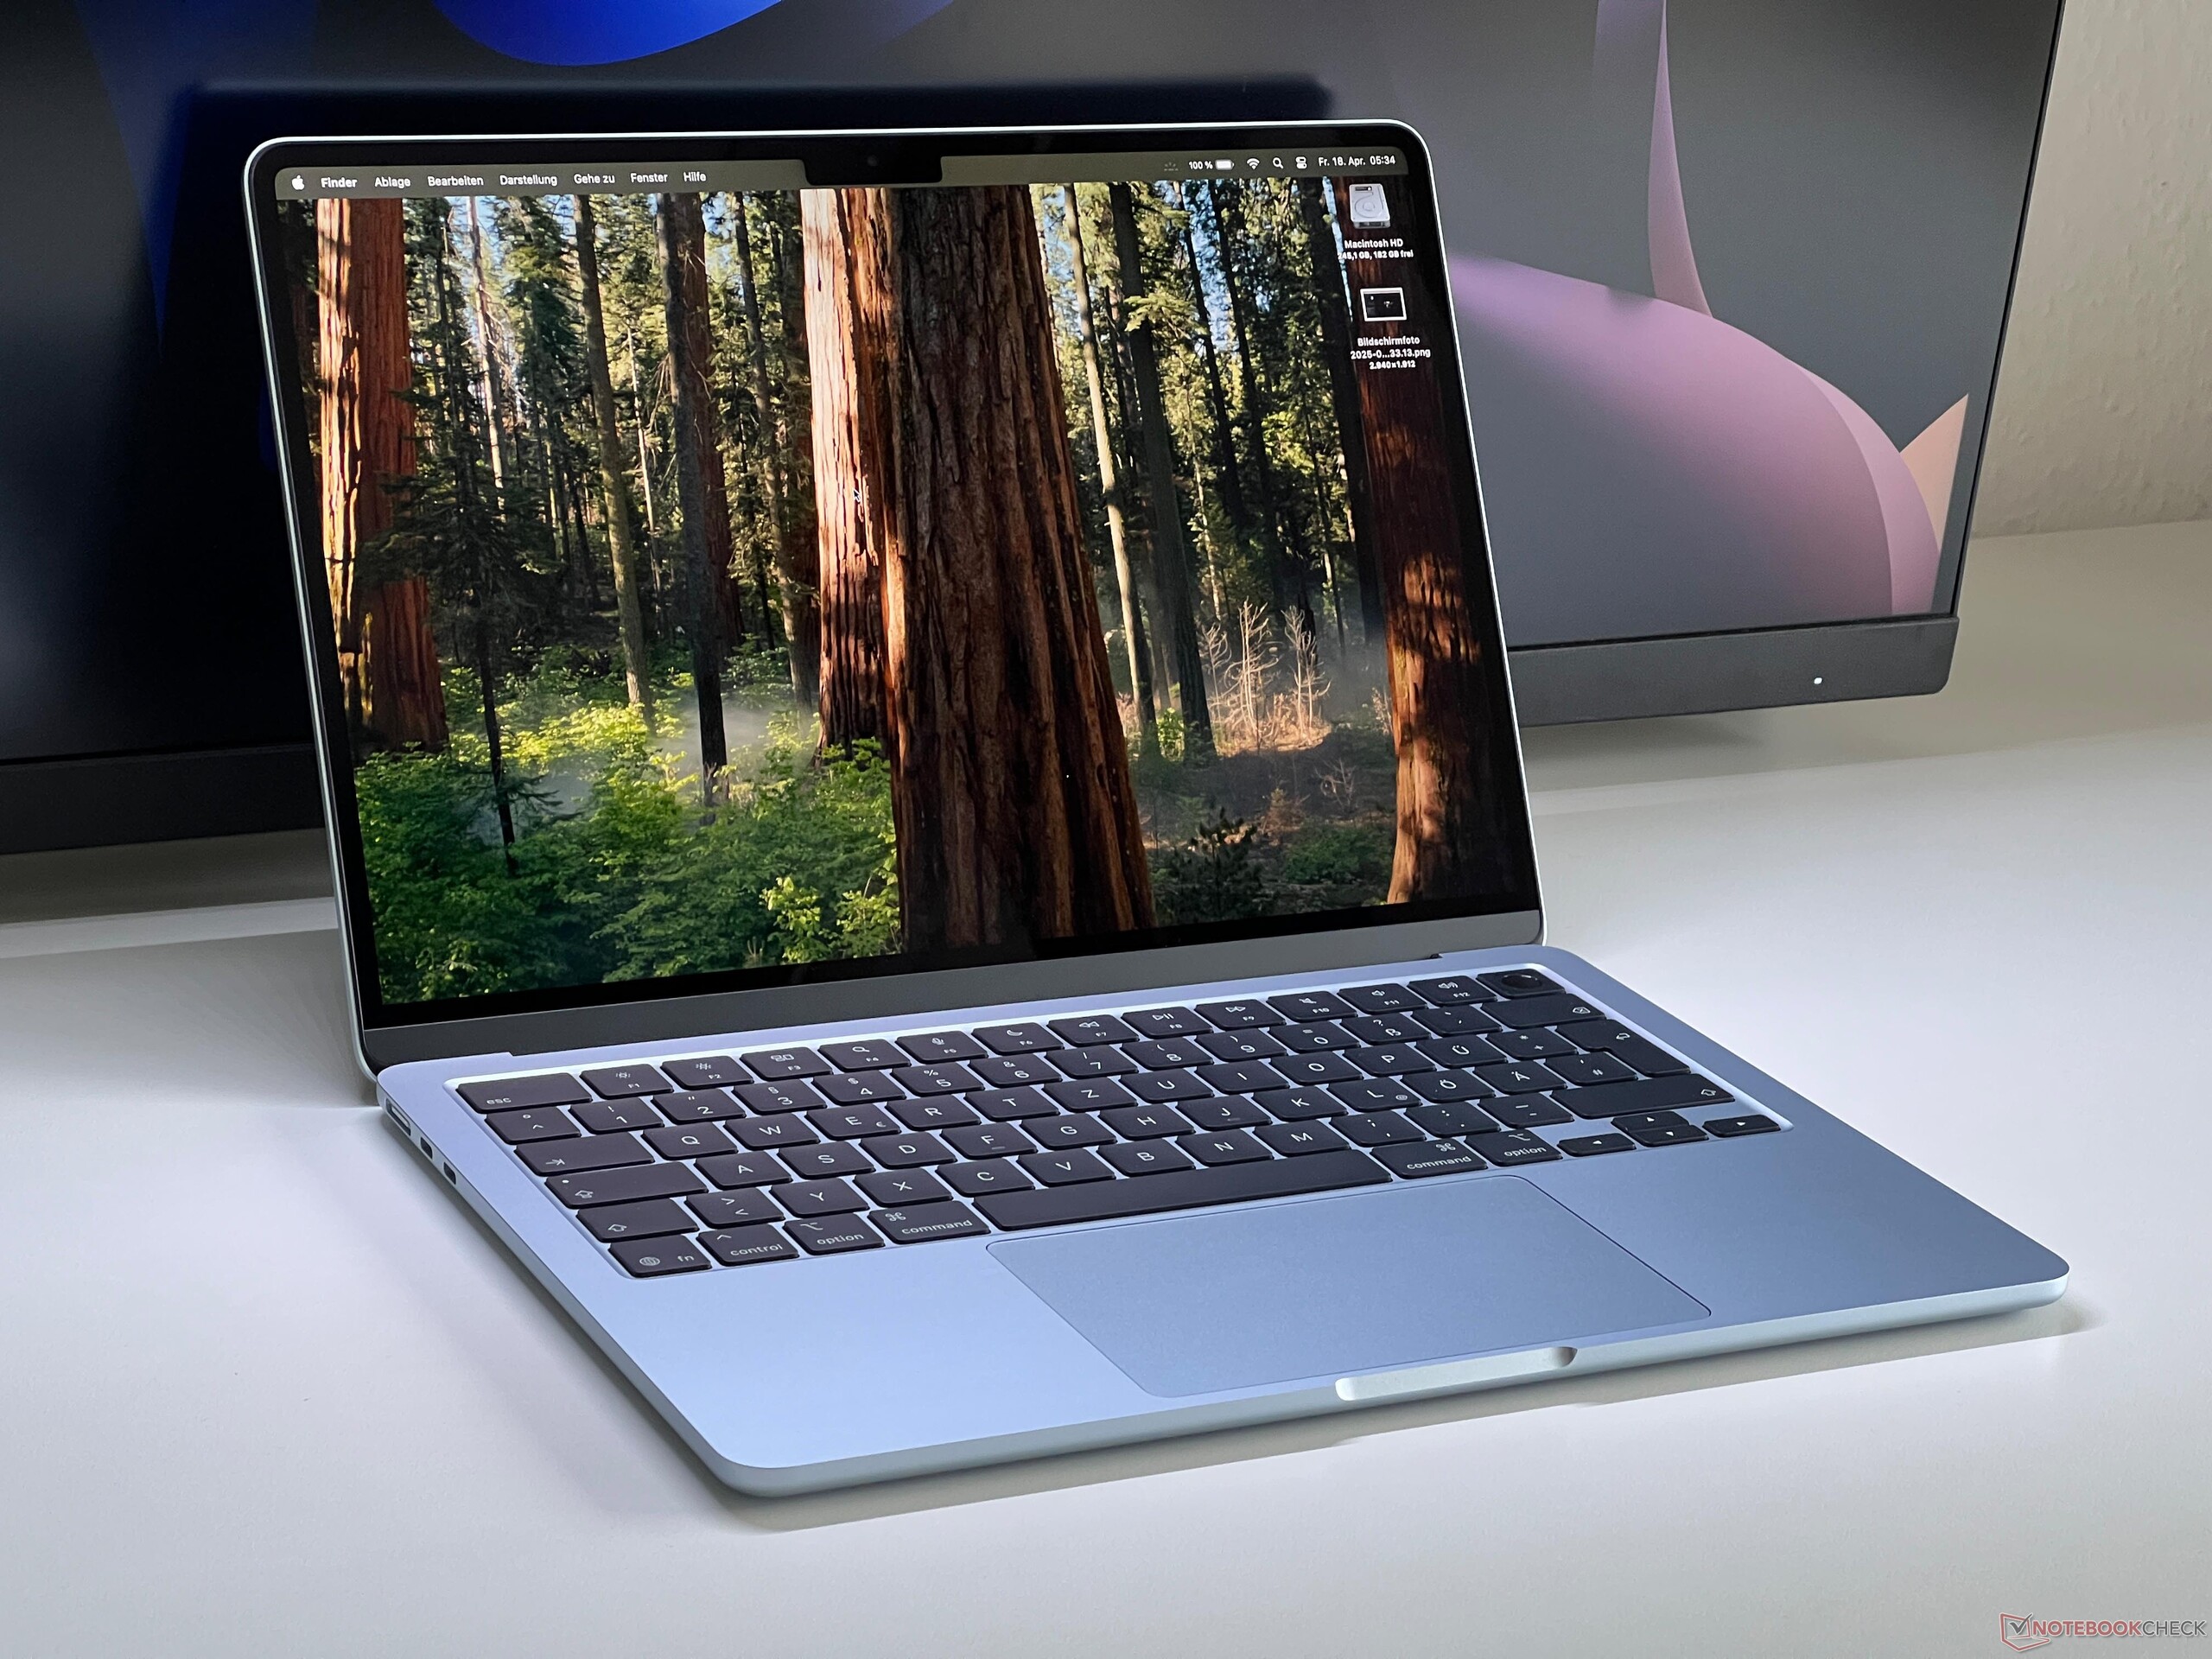
The new MacBook Air 13 M4 doesn't differ from its predecessor in terms of its case design—only our test device's colorway Sky Blue is new and replaces the familiar Space Gray. The M4 SoC now offers Thunderbolt 4 support as well as support for two external displays in addition to the laptop's integrated panel. Its webcam has also been updated (now 12 MP with Center Stage), but it still has the same resolution.
Sustainability
Apple has provides a detailed environmental report on its website. The device consists of 55% recycled materials and no plastic is used for its packaging.
Performance - The M4 SoC with 16 GB RAM
The base model of the MacBook Air 13 is delivered with the slimmed-down M4 processor, which only has an 8-core GPU. The faster version can optionally be selected for an additional $100. A minimum of 16 GB RAM (LPDDR5-7500) is installed, with 24 or 32 GB available if desired ($200 surcharge each), whereby this already includes the CPU upgrade.
Processor
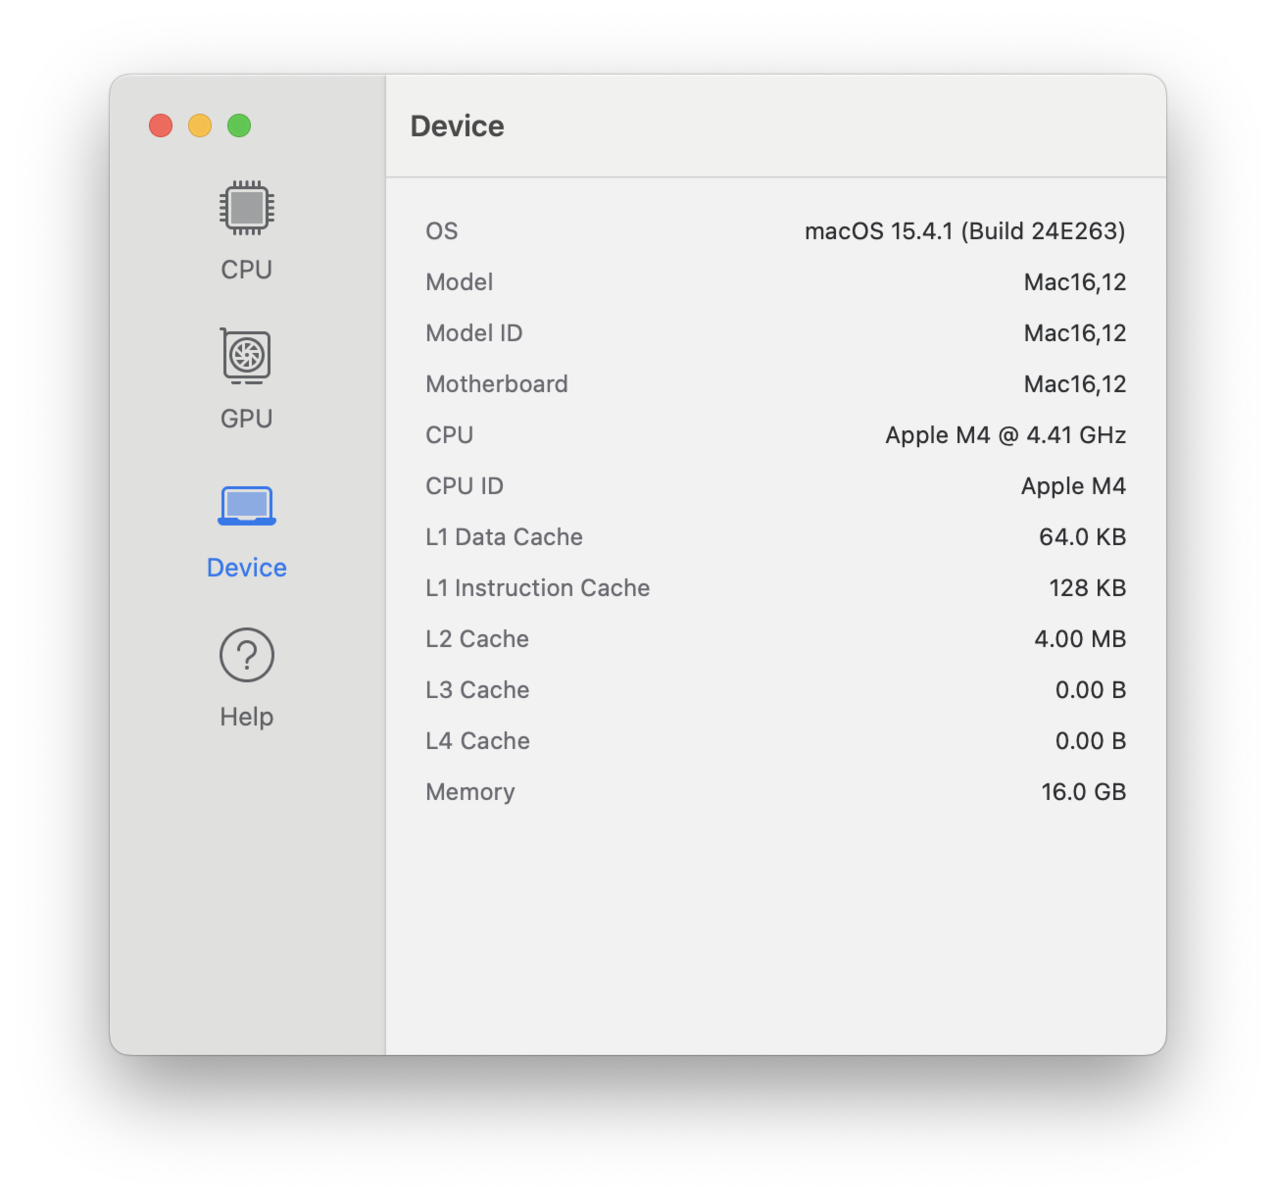
Like the other variants, the base model of the M4 SoC features 10 cores (4x performance, 6x efficiency) and can briefly consume up to 20 watts at its peak. However, the value then drops to around 8 watts within a few minutes. For our CPU benchmarks, we focused on the current versions of Cinebench 2024 and Geekbench, which run natively on all three platforms (Apple, Windows x86/ARM), enabling very good comparability.
The test device's benchmark results were very good overall. In the Cinebench multi-test, the M4 SoC had to admit defeat to the actively cooled Snapdragon competitors, as its reduced power consumption naturally came into play during the long test (M4 in the MBP 14 was 21% faster here, for example). However, the gap to the Snapdragons was quite small, and the Lunar Lake competitors fell significantly behind. Even after half an hour, its CB Multi score only dropped by 13% to 710 points. In the shorter Geekbench multi-core test, on the other hand, the M4 SoC came out on top.
At the moment, the current M4 generation has a clear advantage when it comes to single-core performance, and the same can be said for Apple's cheapest laptop. The competition is at least two generations behind in this respect. Its performance remains constant in battery mode.
Cinebench 2024: CPU Multi Core | CPU Single Core
Geekbench 6.7: Multi-Core | Single-Core
| CPU Performance rating | |
| Apple MacBook Pro 14 2024 M4 | |
| Average Apple M4 10-Core | |
| Apple MacBook Air 13 M4 Entry | |
| Dell XPS 13 9345 | |
| Microsoft Surface Laptop 7 13.8 Copilot+ | |
| Apple MacBook Air 13 M3 8C GPU | |
| HP OmniBook X 14 | |
| Average of class Subnotebook | |
| MSI Prestige 13 AI Plus Evo A2VMG | |
| Lenovo ThinkPad X9-14 Gen 1 Aura Edition | |
| Asus Vivobook S 14 OLED S5406SA | |
| Cinebench 2024 / CPU Multi Core | |
| Apple MacBook Pro 14 2024 M4 | |
| Dell XPS 13 9345 | |
| Average Apple M4 10-Core (815 - 986, n=5) | |
| Microsoft Surface Laptop 7 13.8 Copilot+ | |
| HP OmniBook X 14 | |
| Apple MacBook Air 13 M4 Entry | |
| Average of class Subnotebook (148 - 1471, n=71, last 2 years) | |
| MSI Prestige 13 AI Plus Evo A2VMG | |
| Asus Vivobook S 14 OLED S5406SA | |
| Apple MacBook Air 13 M3 8C GPU | |
| Lenovo ThinkPad X9-14 Gen 1 Aura Edition | |
| Cinebench 2024 / CPU Single Core | |
| Average Apple M4 10-Core (173 - 177, n=5) | |
| Apple MacBook Pro 14 2024 M4 | |
| Apple MacBook Air 13 M4 Entry | |
| Apple MacBook Air 13 M3 8C GPU | |
| Microsoft Surface Laptop 7 13.8 Copilot+ | |
| Dell XPS 13 9345 | |
| Average of class Subnotebook (35 - 200, n=57, last 2 years) | |
| MSI Prestige 13 AI Plus Evo A2VMG | |
| Lenovo ThinkPad X9-14 Gen 1 Aura Edition | |
| Asus Vivobook S 14 OLED S5406SA | |
| HP OmniBook X 14 | |
| Geekbench 6.7 / Multi-Core | |
| Apple MacBook Pro 14 2024 M4 | |
| Average Apple M4 10-Core (14690 - 15173, n=6) | |
| Apple MacBook Air 13 M4 Entry | |
| Dell XPS 13 9345 | |
| Microsoft Surface Laptop 7 13.8 Copilot+ | |
| HP OmniBook X 14 | |
| Average of class Subnotebook (2244 - 20325, n=69, last 2 years) | |
| Apple MacBook Air 13 M3 8C GPU | |
| Lenovo ThinkPad X9-14 Gen 1 Aura Edition | |
| MSI Prestige 13 AI Plus Evo A2VMG | |
| Asus Vivobook S 14 OLED S5406SA | |
| Geekbench 6.7 / Single-Core | |
| Apple MacBook Air 13 M4 Entry | |
| Average Apple M4 10-Core (3655 - 3838, n=6) | |
| Apple MacBook Pro 14 2024 M4 | |
| Apple MacBook Air 13 M3 8C GPU | |
| Dell XPS 13 9345 | |
| Microsoft Surface Laptop 7 13.8 Copilot+ | |
| Lenovo ThinkPad X9-14 Gen 1 Aura Edition | |
| Average of class Subnotebook (960 - 4195, n=65, last 2 years) | |
| MSI Prestige 13 AI Plus Evo A2VMG | |
| Asus Vivobook S 14 OLED S5406SA | |
| HP OmniBook X 14 | |
System performance
In the system benchmarks, the new MacBook Air M4 again showed improved results, and was ahead of its competitors in both the cross-platform CrossMark test and the browser tests. Unsurprisingly, the Air is also an extremely responsive computer during everyday use. Older apps for Intel Macs can still be reliably emulated via Rosetta 2.
WebXPRT 3: Overall
WebXPRT 4: Overall
Mozilla Kraken 1.1: Total
| CrossMark / Overall | |
| Apple MacBook Air 13 M4 Entry | |
| Average Apple M4 10-Core, Apple M4 8-Core GPU (n=1) | |
| Apple MacBook Air 13 M3 10C GPU | |
| Lenovo ThinkPad X9-14 Gen 1 Aura Edition | |
| MSI Prestige 13 AI Plus Evo A2VMG | |
| Average of class Subnotebook (365 - 2356, n=63, last 2 years) | |
| Asus Vivobook S 14 OLED S5406SA | |
| Microsoft Surface Laptop 7 13.8 Copilot+ | |
| Dell XPS 13 9345 | |
| HP OmniBook X 14 | |
| CrossMark / Productivity | |
| Apple MacBook Air 13 M4 Entry | |
| Average Apple M4 10-Core, Apple M4 8-Core GPU (n=1) | |
| Apple MacBook Air 13 M3 10C GPU | |
| Lenovo ThinkPad X9-14 Gen 1 Aura Edition | |
| MSI Prestige 13 AI Plus Evo A2VMG | |
| Average of class Subnotebook (364 - 2277, n=63, last 2 years) | |
| Asus Vivobook S 14 OLED S5406SA | |
| Microsoft Surface Laptop 7 13.8 Copilot+ | |
| Dell XPS 13 9345 | |
| HP OmniBook X 14 | |
| CrossMark / Creativity | |
| Apple MacBook Air 13 M4 Entry | |
| Average Apple M4 10-Core, Apple M4 8-Core GPU (n=1) | |
| Apple MacBook Air 13 M3 10C GPU | |
| Lenovo ThinkPad X9-14 Gen 1 Aura Edition | |
| MSI Prestige 13 AI Plus Evo A2VMG | |
| Average of class Subnotebook (372 - 2743, n=63, last 2 years) | |
| Asus Vivobook S 14 OLED S5406SA | |
| Microsoft Surface Laptop 7 13.8 Copilot+ | |
| Dell XPS 13 9345 | |
| HP OmniBook X 14 | |
| CrossMark / Responsiveness | |
| Apple MacBook Air 13 M4 Entry | |
| Average Apple M4 10-Core, Apple M4 8-Core GPU (n=1) | |
| Apple MacBook Air 13 M3 10C GPU | |
| Average of class Subnotebook (312 - 1854, n=63, last 2 years) | |
| Microsoft Surface Laptop 7 13.8 Copilot+ | |
| MSI Prestige 13 AI Plus Evo A2VMG | |
| Lenovo ThinkPad X9-14 Gen 1 Aura Edition | |
| Dell XPS 13 9345 | |
| Asus Vivobook S 14 OLED S5406SA | |
| HP OmniBook X 14 | |
| WebXPRT 3 / Overall | |
| Apple MacBook Air 13 M4 Entry | |
| Average Apple M4 10-Core, Apple M4 8-Core GPU (n=1) | |
| Apple MacBook Air 13 M3 10C GPU | |
| Microsoft Surface Laptop 7 13.8 Copilot+ | |
| Dell XPS 13 9345 | |
| HP OmniBook X 14 | |
| Average of class Subnotebook (156 - 530, n=59, last 2 years) | |
| MSI Prestige 13 AI Plus Evo A2VMG | |
| Asus Vivobook S 14 OLED S5406SA | |
| WebXPRT 4 / Overall | |
| Apple MacBook Air 13 M4 Entry | |
| Average Apple M4 10-Core, Apple M4 8-Core GPU (n=1) | |
| Dell XPS 13 9345 | |
| Apple MacBook Air 13 M3 10C GPU | |
| Microsoft Surface Laptop 7 13.8 Copilot+ | |
| Lenovo ThinkPad X9-14 Gen 1 Aura Edition | |
| MSI Prestige 13 AI Plus Evo A2VMG | |
| Average of class Subnotebook (132 - 378, n=64, last 2 years) | |
| HP OmniBook X 14 | |
| Asus Vivobook S 14 OLED S5406SA | |
| Mozilla Kraken 1.1 / Total | |
| Asus Vivobook S 14 OLED S5406SA | |
| HP OmniBook X 14 | |
| Average of class Subnotebook (234 - 1104, n=64, last 2 years) | |
| MSI Prestige 13 AI Plus Evo A2VMG | |
| Lenovo ThinkPad X9-14 Gen 1 Aura Edition | |
| Dell XPS 13 9345 | |
| Microsoft Surface Laptop 7 13.8 Copilot+ | |
| Apple MacBook Air 13 M3 10C GPU | |
| Apple MacBook Air 13 M4 Entry | |
| Average Apple M4 10-Core, Apple M4 8-Core GPU (n=1) | |
* ... smaller is better
Storage device
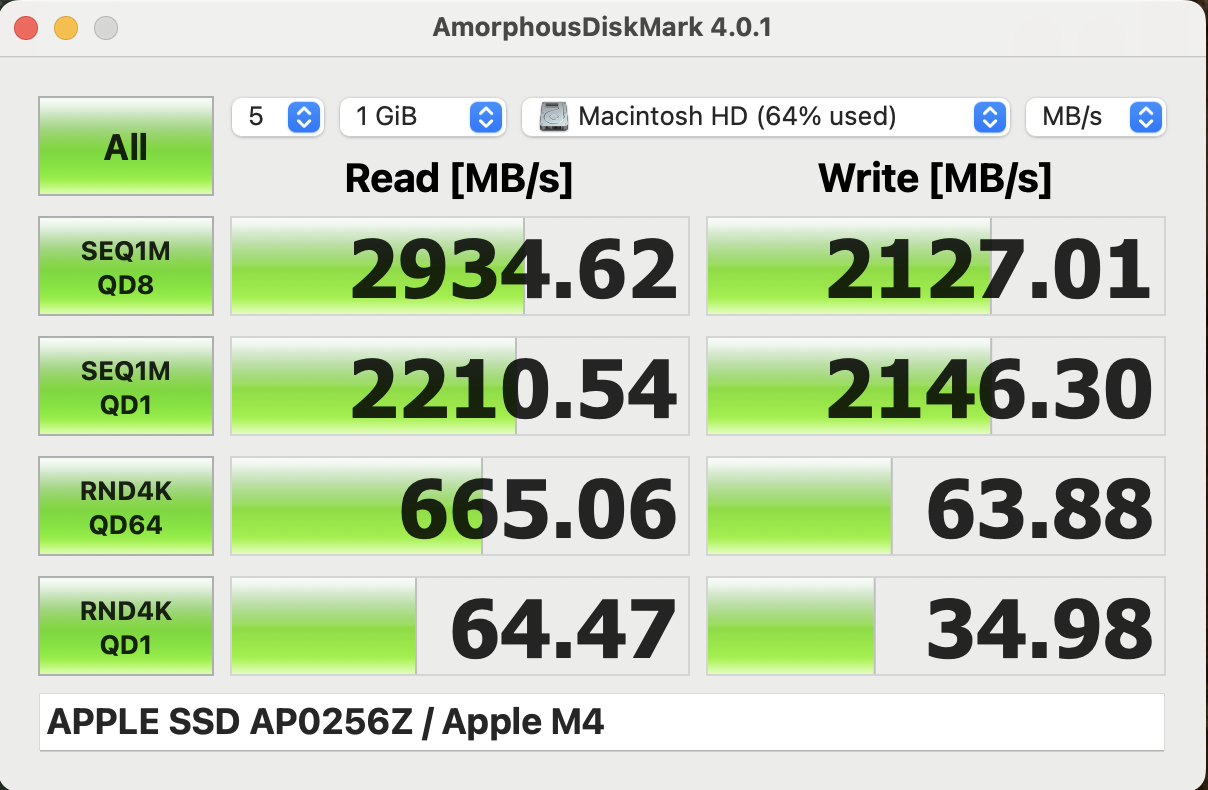
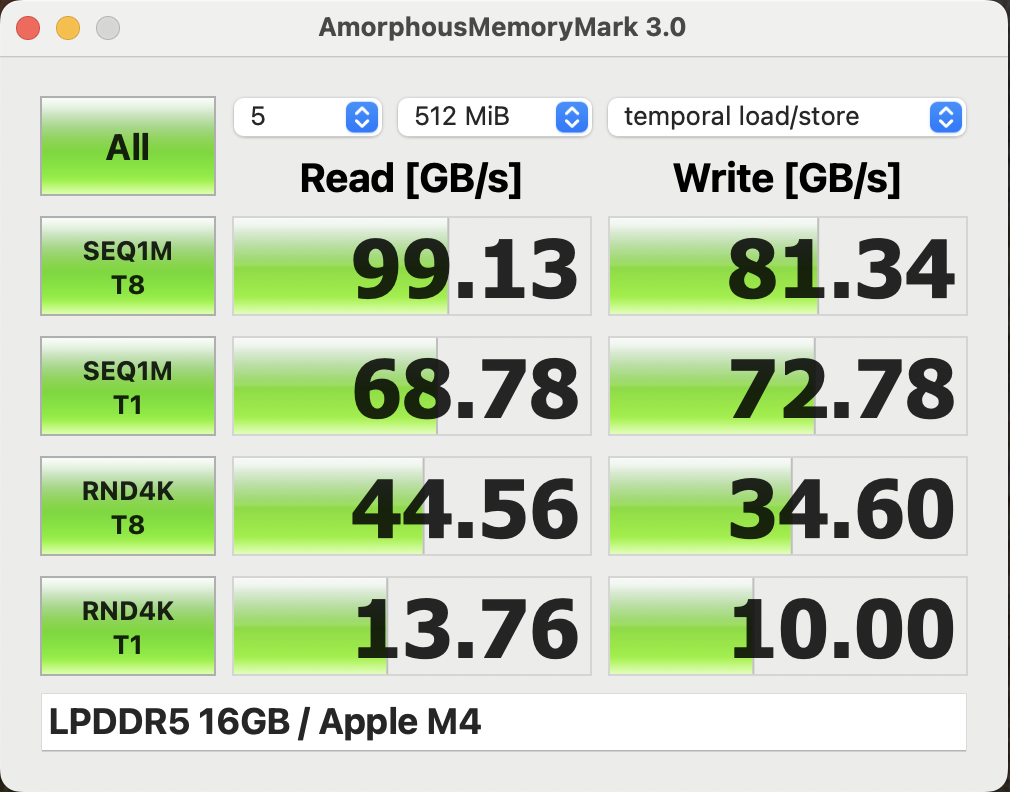
All MacBook Air models are now supplied with at least 16 GB of RAM, but Apple has stuck with its meagre 256 GB SSD capacity (of which 206 GB is available to users after first starting up the device). As the NAND modules are soldered on, it isn't possible to upgrade this at a later date. Its transfer rates were still around 3 GB/s during our test, which is sufficient for everyday use. Apple continues to charge handsomely for SSD upgrades (+$200 for 512 GB, +$400 for 1 TB).
Graphics card
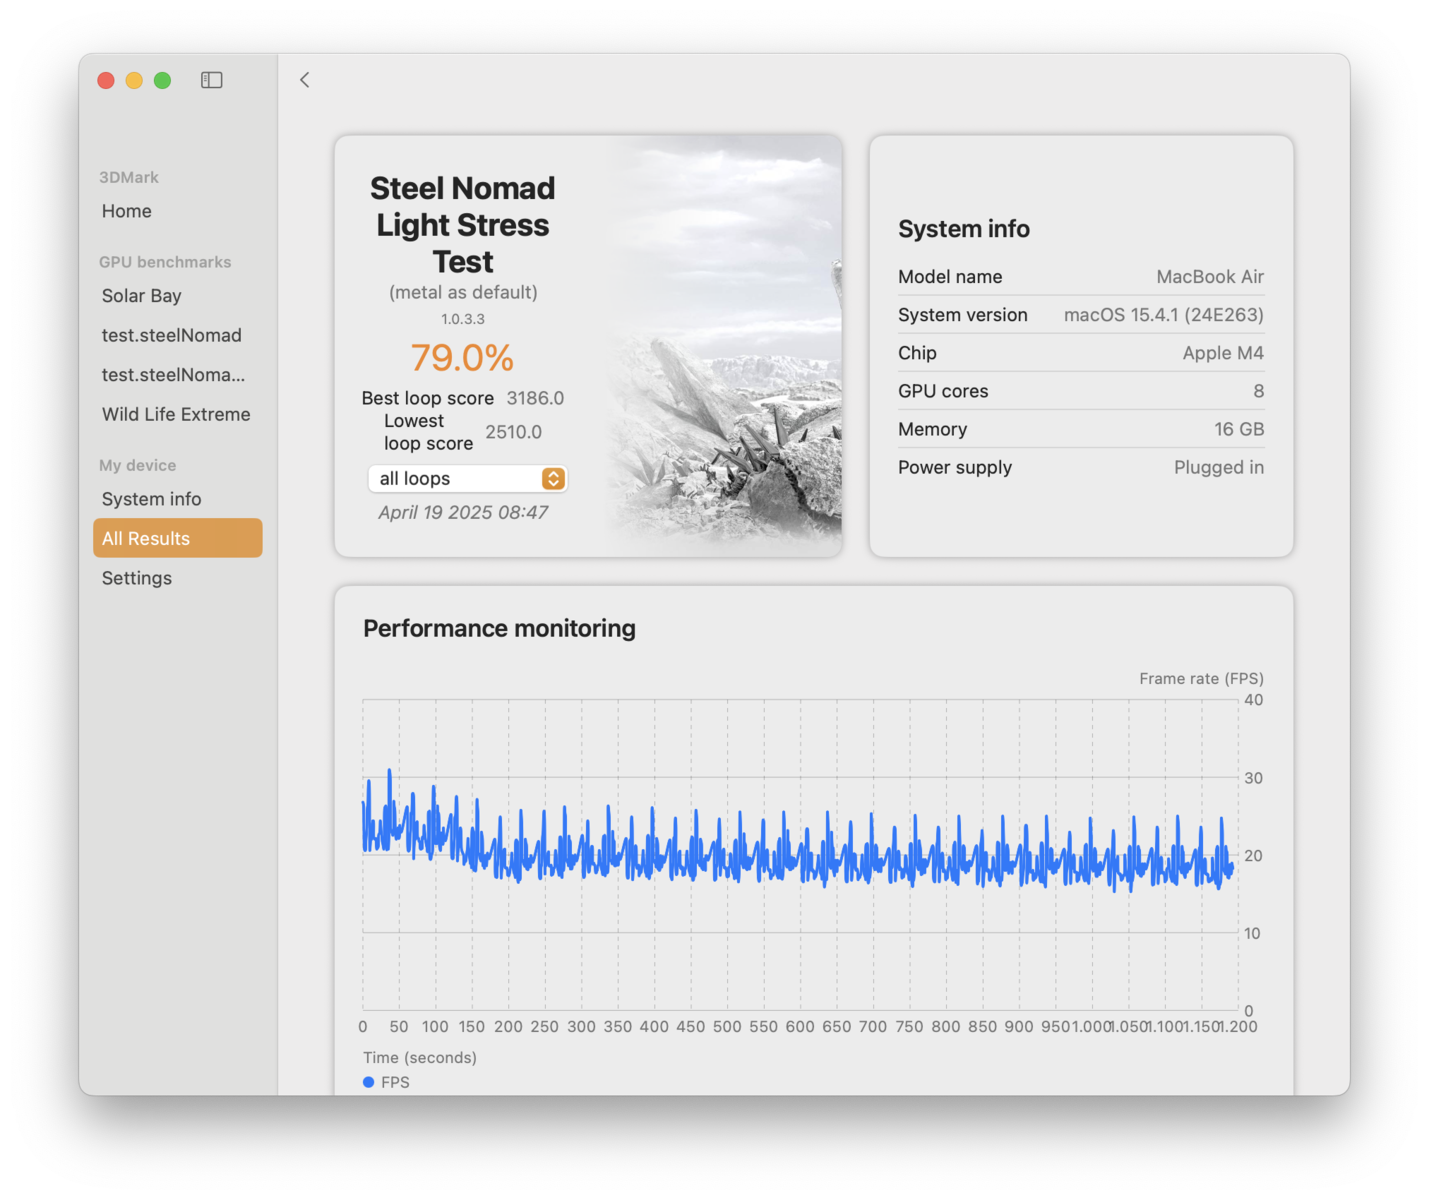
The small M4 SoC's integrated graphics adapter features eight cores, which can consume a maximum of 15.5 watts, but this quickly levels out at around 8 watts. This results in a drop in performance of around 20% under constant load. Overall, however, the GPU performance is still very good—it was far ahead of the Snapdragon CPUs' Adreno GPUs and just ahead of the fastest Intel iGPUs of the Lunar Lake chips during our test. Its graphics performance remains stable in battery mode.
The selection of native games available on the Mac is slowly increasing, and the entry-level Air 13 doesn't do badly in this discipline either. Civilization VII, for example, can even run smoothly with high details, whereas Baldur's Gate 3 is limited to low details.
| 3DMark Steel Nomad Score | 716 points | |
| 3DMark Steel Nomad Light Score | 3168 points | |
| 3DMark Steel Nomad Light Unlimited Score | 3167 points | |
Help | ||
| Blender / v3.3 Classroom METAL | |
| Apple MacBook Air 13 M3 10C GPU | |
| Average of class Subnotebook (76.3 - 227, n=5, last 2 years) | |
| Apple MacBook Air 13 M4 Entry | |
| Average Apple M4 8-Core GPU (n=1) | |
| Blender / v3.3 Classroom CPU | |
| HP OmniBook X 14 | |
| Microsoft Surface Laptop 7 13.8 Copilot+ | |
| Dell XPS 13 9345 | |
| Lenovo ThinkPad X9-14 Gen 1 Aura Edition | |
| Asus Vivobook S 14 OLED S5406SA | |
| MSI Prestige 13 AI Plus Evo A2VMG | |
| Average of class Subnotebook (241 - 861, n=63, last 2 years) | |
| Apple MacBook Air 13 M3 10C GPU | |
| Apple MacBook Air 13 M4 Entry | |
| Average Apple M4 8-Core GPU (n=1) | |
| Blender / v3.3 Classroom oneAPI/Intel | |
| Average of class Subnotebook (105 - 396, n=12, last 2 years) | |
| MSI Prestige 13 AI Plus Evo A2VMG | |
* ... smaller is better
| Civilization 7 - 1920x1080 High Preset AA:MS | |
| Apple MacBook Air 13 M4 Entry | |
| Average of class Subnotebook (39.5 - 62.9, n=3, last 2 years) | |
| Shadow of the Tomb Raider - 1920x1080 Highest Preset AA:T | |
| Apple MacBook Pro 14 2024 M4 | |
| Average of class Subnotebook (17 - 42, n=6, last 2 years) | |
| Apple MacBook Air 13 M3 10C GPU | |
| Apple MacBook Air 13 M4 Entry | |
| Total War Pharaoh - 1920x1080 Ultra Preset | |
| Apple MacBook Pro 14 2024 M4 | |
| Average of class Subnotebook (14.9 - 71.1, n=9, last 2 years) | |
| Apple MacBook Air 13 M4 Entry | |
| Apple MacBook Air 13 M3 10C GPU | |
| low | med. | high | ultra | |
|---|---|---|---|---|
| Shadow of the Tomb Raider (2018) | 103 | 39 | 34 | 30 |
| Baldur's Gate 3 (2023) | 39.7 | 27.8 | 23.1 | 22.6 |
| Cyberpunk 2077 (2023) | 25.9 | 20.3 | 17 | 14.3 |
| Total War Pharaoh (2023) | 53.2 | 46.3 | 40.7 | 28.7 |
| Civilization 7 (2025) | 98 | 78.2 | 62.9 |
Emissions & energy
Noise emissions
Despite its high performance, the M4 SoC remains passively cooled, which is still a huge advantage for the MacBook Air. There were no other electronic noises on the test device during our test.
| Apple MacBook Air 13 M4 Entry M4 8-Core GPU, M4 10-Core, Apple SSD AP0256Z | Lenovo ThinkPad X9-14 Gen 1 Aura Edition Arc 140V, Core Ultra 7 258V, WD PC SN740 SDDQMQD-1T00 | Asus Vivobook S 14 OLED S5406SA Arc 130V, Core Ultra 5 226V, Micron 2500 MTFDKBA512QGN | MSI Prestige 13 AI Plus Evo A2VMG Arc 140V, Core Ultra 7 258V | HP OmniBook X 14 Adreno X1-85 3.8 TFLOPS, SD X Elite X1E-78-100, WD PC SN560 SDDPNQE-1T00 | Dell XPS 13 9345 Adreno X1-85 3.8 TFLOPS, SD X Elite X1E-80-100 | Microsoft Surface Laptop 7 13.8 Copilot+ Adreno X1-85 3.8 TFLOPS, SD X Elite X1E-80-100, Samsung MZ9L4512HBLU-00BMV | |
|---|---|---|---|---|---|---|---|
| Noise | |||||||
| off / environment * (dB) | 24.9 | 24.2 | 24.1 | 23.7 | 22.9 | 23.8 | |
| Idle Minimum * (dB) | 24.9 | 24.2 | 24.8 | 23.7 | 22.9 | 23.8 | |
| Idle Average * (dB) | 24.9 | 24.2 | 24.8 | 23.7 | 22.9 | 23.8 | |
| Idle Maximum * (dB) | 24.9 | 24.2 | 26.7 | 23.7 | 22.9 | 23.8 | |
| Load Average * (dB) | 26.5 | 28.8 | 36.8 | 29.7 | 32.8 | 26 | |
| Cyberpunk 2077 ultra * (dB) | 40.5 | 37.6 | 44.5 | 37.1 | 40.6 | 31.5 | |
| Load Maximum * (dB) | 43.6 | 45.6 | 50.8 | 37.1 | 40.6 | 40.3 |
* ... smaller is better
Temperature
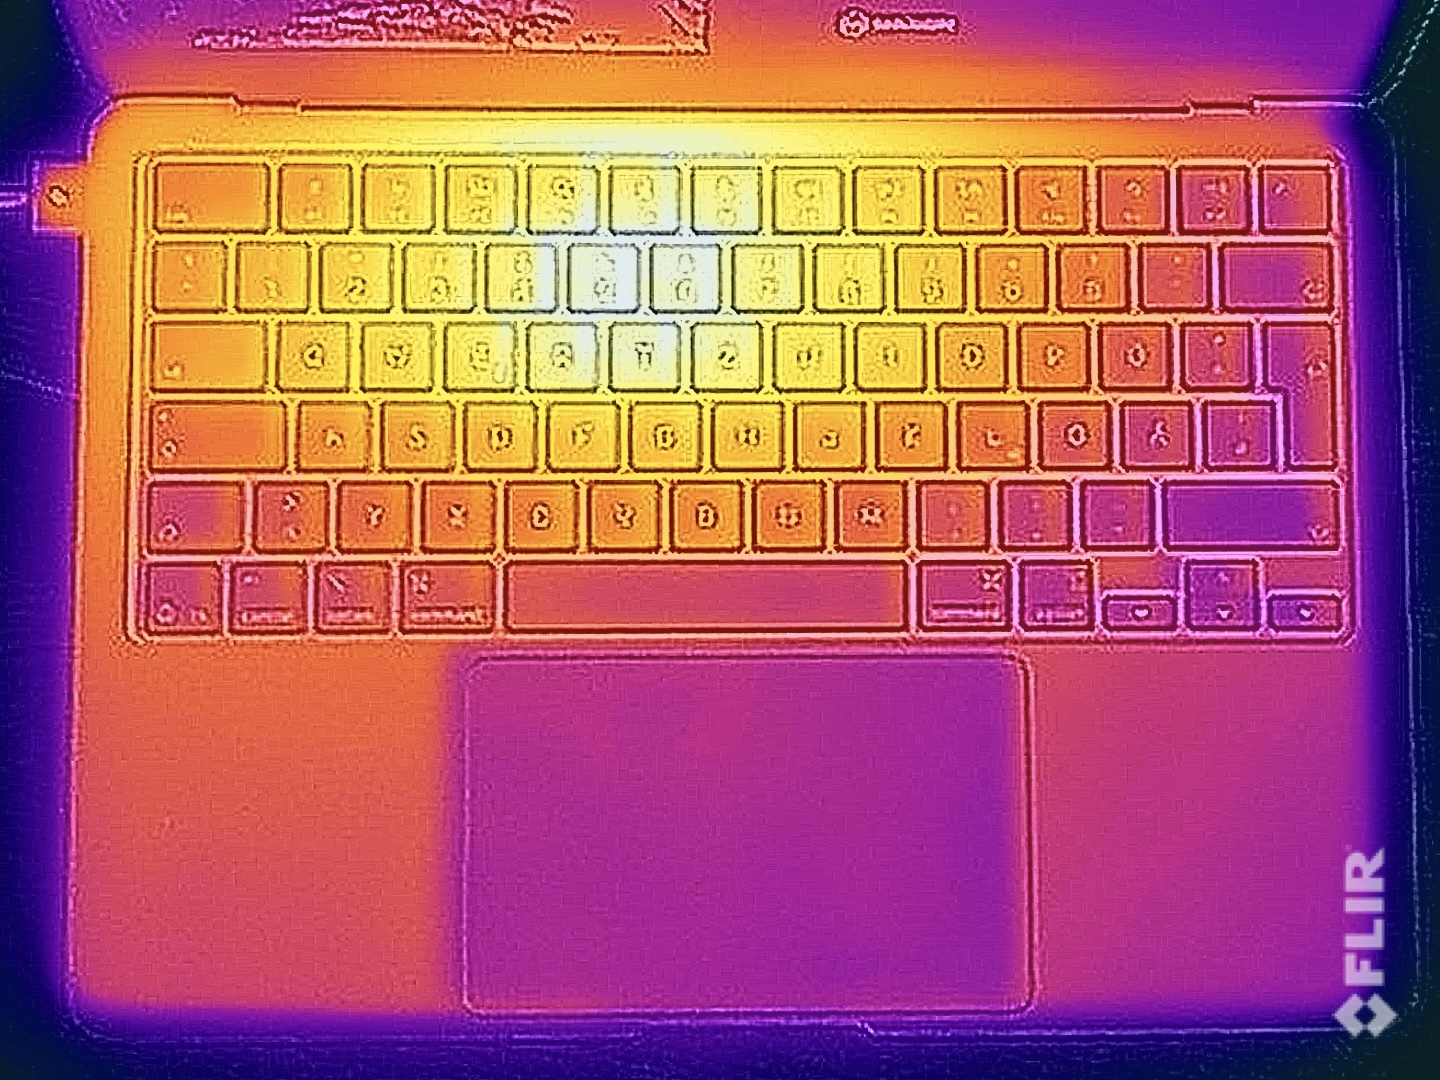
Its surface temperatures are unproblematic. Under full load, we measured a maximum of just under 43 °C on the underside, so you can still place the Air on your thighs without any problems. The keyboard gets a little warmer, which is of course noticeable, but this doesn't yet pose any limitations. During everyday tasks, on the other hand, the entire case stays very cool.
(±) The maximum temperature on the upper side is 44.9 °C / 113 F, compared to the average of 35.9 °C / 97 F, ranging from 21.4 to 59 °C for the class Subnotebook.
(±) The bottom heats up to a maximum of 42.6 °C / 109 F, compared to the average of 39.2 °C / 103 F
(+) In idle usage, the average temperature for the upper side is 23.6 °C / 74 F, compared to the device average of 30.8 °C / 87 F.
(+) The palmrests and touchpad are reaching skin temperature as a maximum (34.2 °C / 93.6 F) and are therefore not hot.
(-) The average temperature of the palmrest area of similar devices was 28.2 °C / 82.8 F (-6 °C / -10.8 F).

| Apple MacBook Air 13 M4 Entry Apple M4 10-Core, Apple M4 8-Core GPU | Lenovo ThinkPad X9-14 Gen 1 Aura Edition Intel Core Ultra 7 258V, Intel Arc Graphics 140V | Asus Vivobook S 14 OLED S5406SA Intel Core Ultra 5 226V, Intel Arc Graphics 130V | MSI Prestige 13 AI Plus Evo A2VMG Intel Core Ultra 7 258V, Intel Arc Graphics 140V | HP OmniBook X 14 Qualcomm Snapdragon X Elite X1E-78-100, Qualcomm SD X Adreno X1-85 3.8 TFLOPS | Dell XPS 13 9345 Qualcomm Snapdragon X Elite X1E-80-100, Qualcomm SD X Adreno X1-85 3.8 TFLOPS | Microsoft Surface Laptop 7 13.8 Copilot+ Qualcomm Snapdragon X Elite X1E-80-100, Qualcomm SD X Adreno X1-85 3.8 TFLOPS | Apple MacBook Air 13 M3 10C GPU Apple M3, Apple M3 10-Core GPU | |
|---|---|---|---|---|---|---|---|---|
| Heat | -15% | -4% | -3% | -2% | -16% | -4% | 4% | |
| Maximum Upper Side * (°C) | 44.9 | 45.4 -1% | 38.4 14% | 43.4 3% | 44.2 2% | 45.2 -1% | 47.1 -5% | 44.3 1% |
| Maximum Bottom * (°C) | 42.6 | 46.4 -9% | 49.7 -17% | 42.4 -0% | 44.5 -4% | 44.2 -4% | 44.6 -5% | 43.4 -2% |
| Idle Upper Side * (°C) | 23.9 | 30.2 -26% | 25.1 -5% | 25.4 -6% | 25.1 -5% | 30.4 -27% | 24.7 -3% | 22.3 7% |
| Idle Bottom * (°C) | 24 | 29.9 -25% | 25.8 -8% | 25.6 -7% | 24.3 -1% | 31.6 -32% | 24.5 -2% | 22.1 8% |
* ... smaller is better
During the stress test under combined CPU&GPU load, the smaller MacBook Air 13 was only just behind the larger 15-inch model. After a brief load peak of around 27 watts, the M4 SoC's power consumption dropped to around 8 watts over the following few minutes and then remained at this level.
Power consumption
There were no surprises in terms of its power consumption during our test, but the laptop's IPS display requires a relatively high amount of power at full brightness, despite its low frequency of 60 Hz. The competitors are significantly more frugal in this respect in idle mode, although to be fair, they often use lower resolutions and also run at 60 Hz. In the stress test, the 30-watt power supply was briefly the limiting factor, but only for a few seconds. During the course of the stress test, its power consumption then stabilized at ~23 watts.
| Off / Standby | |
| Idle | |
| Load |
|
Key:
min: | |
| Apple MacBook Air 13 M4 Entry M4 8-Core GPU, M4 10-Core, Apple SSD AP0256Z | Lenovo ThinkPad X9-14 Gen 1 Aura Edition Arc 140V, Core Ultra 7 258V, WD PC SN740 SDDQMQD-1T00 | Asus Vivobook S 14 OLED S5406SA Arc 130V, Core Ultra 5 226V, Micron 2500 MTFDKBA512QGN | MSI Prestige 13 AI Plus Evo A2VMG Arc 140V, Core Ultra 7 258V | HP OmniBook X 14 Adreno X1-85 3.8 TFLOPS, SD X Elite X1E-78-100, WD PC SN560 SDDPNQE-1T00 | Dell XPS 13 9345 Adreno X1-85 3.8 TFLOPS, SD X Elite X1E-80-100 | Microsoft Surface Laptop 7 13.8 Copilot+ Adreno X1-85 3.8 TFLOPS, SD X Elite X1E-80-100, Samsung MZ9L4512HBLU-00BMV | Apple MacBook Air 13 M3 10C GPU M3 10-Core GPU, M3, Apple SSD AP0512Z | |
|---|---|---|---|---|---|---|---|---|
| Power Consumption | -55% | -49% | -65% | -36% | -45% | -10% | -7% | |
| Idle Minimum * (Watt) | 1.9 | 3.6 -89% | 2.7 -42% | 3.5 -84% | 2.5 -32% | 2.8 -47% | 1.4 26% | 1.95 -3% |
| Idle Average * (Watt) | 8.7 | 4.6 47% | 6.7 23% | 5.9 32% | 4.7 46% | 4.9 44% | 6.3 28% | 8.7 -0% |
| Idle Maximum * (Watt) | 8.8 | 5.2 41% | 6.9 22% | 10 -14% | 6.2 30% | 5.7 35% | 7.6 14% | 8.9 -1% |
| Load Average * (Watt) | 29.9 | 31.2 -4% | 34.5 -15% | 38.7 -29% | 25.6 14% | 40.6 -36% | 26.9 10% | 34.3 -15% |
| Cyberpunk 2077 ultra external monitor * (Watt) | 21.5 | 48.4 -125% | 41.9 -95% | 45.6 -112% | 36.7 -71% | 39.4 -83% | ||
| Cyberpunk 2077 ultra * (Watt) | 18.5 | 47.3 -156% | 43 -132% | 46.3 -150% | 40.3 -118% | 40.7 -120% | 38.5 -108% | |
| Load Maximum * (Watt) | 30.8 | 61.8 -101% | 62.7 -104% | 61.5 -100% | 67.9 -120% | 64 -108% | 40.7 -32% | 35.4 -15% |
| Witcher 3 ultra * (Watt) | 28.6 |
* ... smaller is better
Power consumption Cyberpunk / stress test
Power consumption with external monitor
Runtimes
The test device's battery life showed clear differences depending on the screen brightness. In our WLAN test at 150 cd/m², the current MacBook Air 13 M4 achieved a very good runtime of more than 16 hours, which is very competitive. At full brightness, however, the IPS panel's high power consumption made itself known, as we then only noted just over 7 hours, which meant it came in last place in our comparison group.
Notebookcheck total rating
Apple MacBook Air 13 M4 Entry
- 04/20/2025 v8
Andreas Osthoff
 Total Sustainability Score:
 Possible alternatives compared
Image | Model / Review | Price | Weight | Height | Display |
|---|---|---|---|---|---|
1. 91.2% 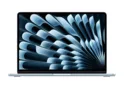 | Apple MacBook Air 13 M4 Entry Apple M4 10-Core ⎘ Apple M4 8-Core GPU ⎘ 16 GB Memory, 256 GB SSD | Amazon: List Price: 1039€ | 1.2 kg | 11.3 mm | 13.60" 2560x1664 225 PPI IPS |
2. 88.8% 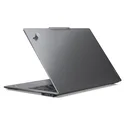 | Lenovo ThinkPad X9-14 Gen 1 Aura Edition Intel Core Ultra 7 258V ⎘ Intel Arc Graphics 140V ⎘ 32 GB Memory, 1024 GB SSD | Amazon: List Price: 1800 Euro | 1.2 kg | 17.8 mm | 14.00" 1920x1200 162 PPI OLED |
3. 85.9%  | Asus Vivobook S 14 OLED S5406SA Intel Core Ultra 5 226V ⎘ Intel Arc Graphics 130V ⎘ 16 GB Memory, 512 GB SSD | Amazon: List Price: 1099€ | 1.3 kg | 15.9 mm | 14.00" 1920x1200 162 PPI OLED |
4. 85% 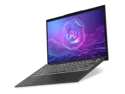 | MSI Prestige 13 AI Plus Evo A2VMG Intel Core Ultra 7 258V ⎘ Intel Arc Graphics 140V ⎘ 32 GB Memory | Amazon: 1. $31.99 CPU Cooling Fan Replacement ... 2. $1,479.00 MSI Prestige 16 AI+ Evo 16" ... 3. $1,349.00 HIDevolution [2024] MSI Pres... List Price: 1400 USD | 970 g | 16.9 mm | 13.30" 2880x1800 255 PPI OLED |
5. 84.4% 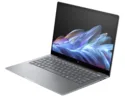 | HP OmniBook X 14 Qualcomm Snapdragon X Elite X1E-78-100 ⎘ Qualcomm SD X Adreno X1-85 3.8 TFLOPS ⎘ 16 GB Memory, 1024 GB SSD | Amazon: List Price: 1299€ | 1.3 kg | 14.3 mm | 14.00" 2240x1400 189 PPI IPS |
6. 84.5%  | Dell XPS 13 9345 Qualcomm Snapdragon X Elite X1E-80-100 ⎘ Qualcomm SD X Adreno X1-85 3.8 TFLOPS ⎘ 16 GB Memory | Amazon: List Price: 1300 USD | 1.2 kg | 15.3 mm | 13.40" 1920x1200 169 PPI IPS |
7. 86.2%  | Microsoft Surface Laptop 7 13.8 Copilot+ Qualcomm Snapdragon X Elite X1E-80-100 ⎘ Qualcomm SD X Adreno X1-85 3.8 TFLOPS ⎘ 16 GB Memory, 512 GB SSD | Amazon: List Price: 1649€ | 1.3 kg | 17.5 mm | 13.80" 2304x1536 201 PPI IPS |
Transparency
The selection of devices to be reviewed is made by our editorial team. The test sample was provided to the author as a loan by the manufacturer or retailer for the purpose of this review. The lender had no influence on this review, nor did the manufacturer receive a copy of this review before publication. There was no obligation to publish this review. As an independent media company, Notebookcheck is not subjected to the authority of manufacturers, retailers or publishers.
This is how Notebookcheck is testing
Every year, Notebookcheck independently reviews hundreds of laptops and smartphones using standardized procedures to ensure that all results are comparable. We have continuously developed our test methods for around 20 years and set industry standards in the process. In our test labs, high-quality measuring equipment is utilized by experienced technicians and editors. These tests involve a multi-stage validation process. Our complex rating system is based on hundreds of well-founded measurements and benchmarks, which maintains objectivity. Further information on our test methods can be found here.

