Notebookcheck Logo

Qualcomm Snapdragon 8cx Gen 3 vs Intel Core i5-9400F

Qualcomm Snapdragon 8cx Gen 3

► remove from comparison Qualcomm SD 8cx Gen 3

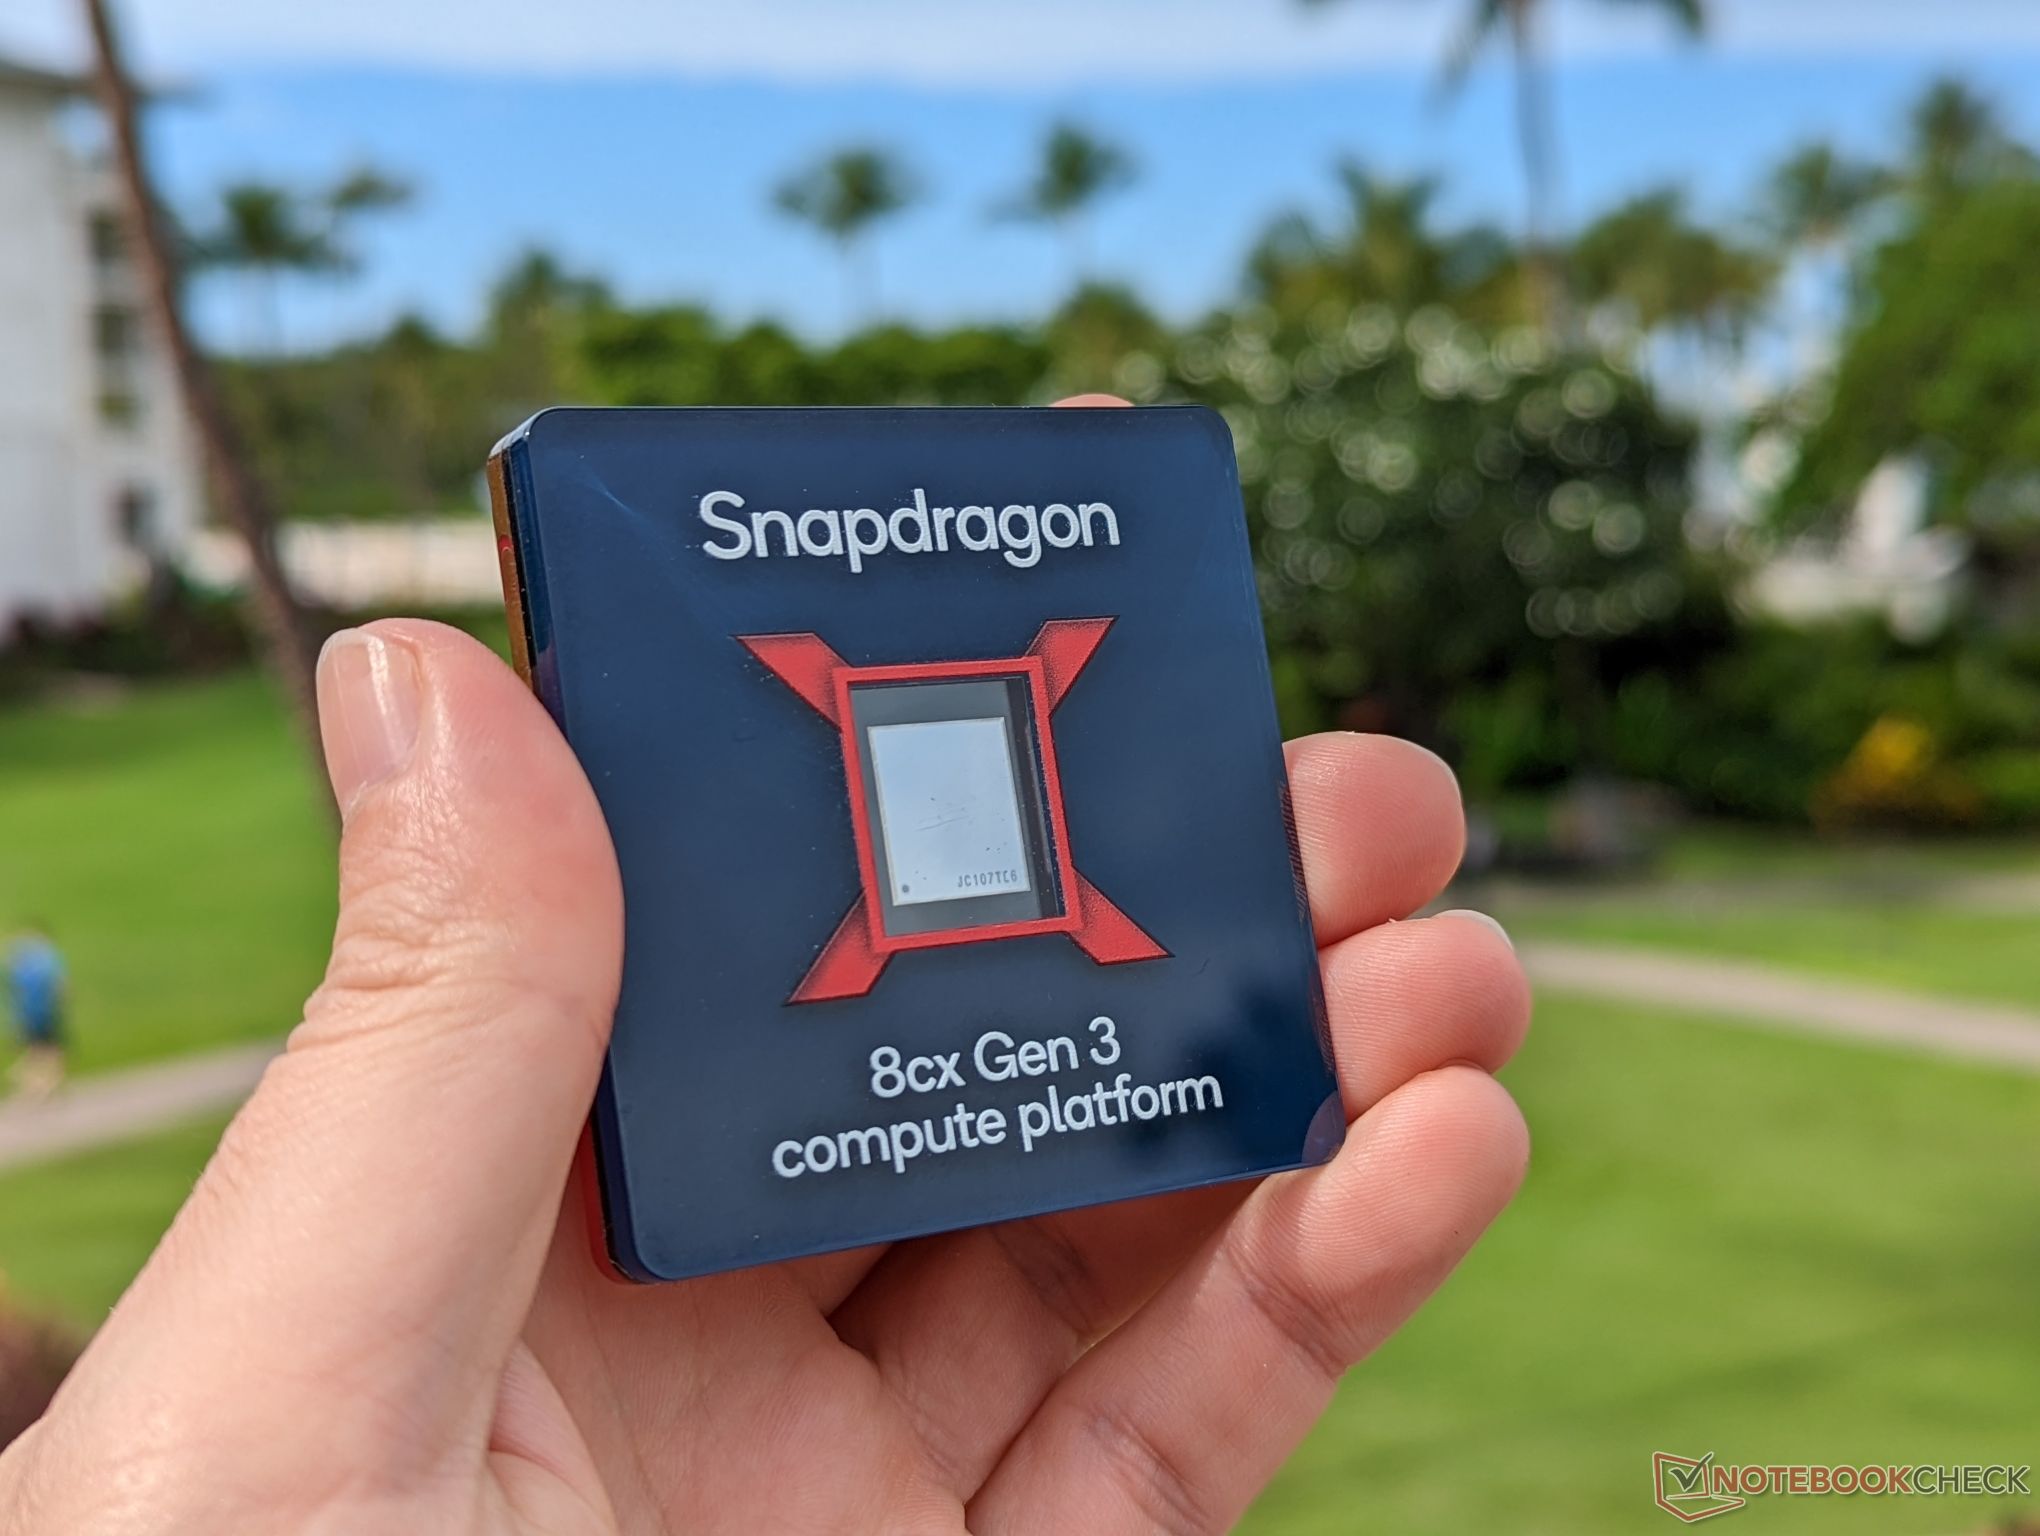
The Qualcomm Snapdragon 8cx Gen 3 Compute Platform is an ARM based SoC for Windows laptops. It integrates four big ARM Cortex-X1 performance cores (up to 3 GHz) and four smaller ARM Cortex-A78 with up to 2.4 GHz.

The Compute Platform also integrates a Snapdragon X62 5G modem with up to 10 Gbps download and 316 Mbps upload. The integrated WLAN modem supports Wi-Fi 6E (2x2) and the satellite positioning system supports BeiDou, Galileo, GLONASS, GPS, QZSS, and SBAS. The integrated video engine supports H.264, H.265, and VP9 decoding in 4K 120fps.

The performance should be around 85% faster for the CPU and 60% faster for the GPU compared to the previous generation (Snapdragon 8cx Gen 2).

The chip is produced in the modern 5nm process at Samsung (5LPE) and designed for fanless laptops (7 to 9 Watt TDP range).

Intel Core i5-9400F

► remove from comparison Intel i5-9400F

The Intel Core i5-9400F is a six-core desktop processor based on the Coffee Lake architecture introduced in October 2018 along with the flagship Intel Core i9-9900K. The processor clocks at 2.9-4.1 GHz and can process up to 6 threads simultaneously. The Intel Core i5-9400F is manufactured in the improved 14-nm process (14nm++).

Performance

Compared to the Intel Core i5-8400, the performance could only be increased slightly. Performance increases of up to 10 percent can be expected. Both processors (old and new) still do not offer hyperthreading. The performance increase therefore only adds up to small architecture improvements and a slightly higher basic and turbo clock rate. This CPU is suitable for everyday office use, which does not require large coolers due to the low waste heat. But games are also among the application areas, because in games the Intel Core i5-9400F clearly beats the Intel Core i3-9100F. Here the six cores are paying off in the meantime. 

Graphics unit

The Intel Core i5-9400F is a processor without integrated graphics unit. If you value an iGPU, you should take a closer look at the Intel Core i5-9400, as it offers the entry level Intel UHD Graphics 630.

Power consumption

Intel puts the Thermal Design Power (TDP) at 65 watts. This means there is no need for large cooling systems, which also allows installation in very compact housings.

ModelQualcomm Snapdragon 8cx Gen 3Intel Core i5-9400F
CodenameCortex-X1 / A78Coffee Lake-R
SeriesQualcomm SnapdragonIntel Coffee Lake
Clock2400 - 2995 MHz2900 - 4100 MHz
L1 Cache768 KB384 KB
L2 Cache6 MB1.5 MB
L3 Cache8 MB9 MB
Cores / Threads8 / 86 / 6
TDP7 Watt65 Watt
Technology5 nm14 nm
FeaturesFastConnect 6900 2x2 Wi-Fi, Adreno 690 GPUDual-Channel DDR4-2666 Memory Controller, AVX, AVX2, AES-NI, TSX, Quick Sync, Virtualization
iGPUQualcomm Adreno 690
NPU / AI15 TOPS INT8
ArchitectureARMx86
Announced
Manufacturerwww.qualcomm.com
Series: Coffee Lake Coffee Lake-R
Intel Core i9-9900KS compare4 - 5 GHz8 / 16 cores16 MB L3
Intel Core i9-9900K compare3.6 - 5 GHz8 / 16 cores16 MB L3
Intel Core i7-9700K compare3.6 - 4.9 GHz8 / 8 cores12 MB L3
Intel Core i7-9700 compare3 - 4.7 GHz8 / 8 cores12 MB L3
Intel Core i5-9600K compare3.7 - 4.6 GHz6 / 6 cores9 MB L3
Intel Core i9-9900T compare2.1 - 4.4 GHz8 / 16 cores16 MB L3
Intel Core i5-9400F « 2.9 - 4.1 GHz6 / 6 cores9 MB L3
Intel Core i3-9100F compare3.6 - 4.2 GHz4 / 4 cores6 MB L3
Voltage100 V
Die Size149 mm2
SocketLGA 1151-2
$182 U.S.

Benchmarks

Performance Rating - CB R15 + R20 + 7-Zip + X265 + Blender + 3DM11 CPU - SD 8cx Gen 3
22.5 pt (37%)
Restrict / Search: Model: Max. age: years
Performance Rating - CB R15 + R20 + 7-Zip + X265 + Blender + 3DM11 CPU - i5-9400F
28.7 pt (48%)
Restrict / Search: Model: Max. age: years
Cinebench R23 - Cinebench R23 Multi Core
min: 3534     avg: 3603     median: 3567 (3%)     max: 3709 Points
Cinebench R23 - Cinebench R23 Single Core
min: 559     avg: 588     median: 598 (25%)     max: 608 Points
Cinebench R20 - Cinebench R20 CPU (Single Core)
min: 199     avg: 208.7     median: 205 (22%)     max: 222 Points
416 Points (45%)
Cinebench R20 - Cinebench R20 CPU (Multi Core)
min: 810     avg: 1105     median: 1248 (3%)     max: 1258 Points
2378 Points (6%)
Cinebench R15 - Cinebench R15 CPU Multi 64 Bit
min: 723     avg: 749     median: 748.5 (5%)     max: 774 Points
984 Points (6%)
Cinebench R15 - Cinebench R15 CPU Single 64 Bit
min: 119     avg: 119.1     median: 119.1 (33%)     max: 119.1 Points
173 Points (48%)
Cinebench R11.5 - Cinebench R11.5 CPU Multi 64 Bit
9.2 Points (12%)
11.3 Points (15%)
Cinebench R11.5 - Cinebench R11.5 CPU Single 64 Bit
1.4 Points (33%)
2 Points (46%)
Cinebench R10 - Cinebench R10 Rend. Single (32bit)
2481 Points (15%)
6490 Points (39%)
Cinebench R10 - Cinebench R10 Rend. Multi (32bit)
13940 Points (10%)
31523 Points (23%)
Cinebench R10 - Cinebench R10 Rend. Multi (64bit)
40065 Points (26%)
Cinebench R10 - Cinebench R10 Rend. Single (64bit)
8182 Points (10%)
wPrime 2.10 - wPrime 2.0 1024m *
305.3 s (4%)
198.7 s (2%)
wPrime 2.10 - wPrime 2.0 32m *
8.7 s (2%)
6.8 s (1%)
WinRAR - WinRAR 4.0
4046 Points (6%)
5794 Points (9%)
7-Zip 18.03 - 7-Zip 18.03 Multi Thread 4 runs
min: 16223     avg: 21572     median: 23989 (14%)     max: 24505 MIPS
25639 MIPS (15%)
7-Zip 18.03 - 7-Zip 18.03 Single Thread 4 runs
min: 3874     avg: 3912     median: 3915 (46%)     max: 3946 MIPS
4678 MIPS (55%)
X264 HD Benchmark 4.0 - x264 Pass 2
33.2 fps (1%)
64 fps (2%)
X264 HD Benchmark 4.0 - x264 Pass 1
146.9 fps (4%)
234 fps (6%)
HWBOT x265 Benchmark v2.2 - HWBOT x265 4k Preset
min: 1.5     avg: 2.2     median: 2.5 (4%)     max: 2.68 fps
9.1 fps (16%)
TrueCrypt - TrueCrypt Serpent
0.5 GB/s (15%)
TrueCrypt - TrueCrypt Twofish
0.9 GB/s (15%)
TrueCrypt - TrueCrypt AES
5.2 GB/s (14%)
Blender - Blender 3.3 Classroom CPU *
min: 1153     avg: 1626     median: 1625.5 (21%)     max: 2098 Seconds
Blender - Blender 2.79 BMW27 CPU *
min: 1059     avg: 1246     median: 1080 (8%)     max: 1600 Seconds
468.5 Seconds (3%)
R Benchmark 2.5 - R Benchmark 2.5 *
min: 1.011     avg: 1     median: 1 (22%)     max: 1.013 sec
0.7 sec (14%)
3DMark 06 - CPU - 3DMark 06 - CPU
3876 Points (8%)
Super Pi mod 1.5 XS 1M - Super Pi mod 1.5 XS 1M *
17.5 s (4%)
9.3 s (2%)
Super Pi mod 1.5 XS 2M - Super Pi mod 1.5 XS 2M *
37.4 s (2%)
20.8 s (1%)
Super Pi Mod 1.5 XS 32M - Super Pi mod 1.5 XS 32M *
848 s (4%)
499.8 s (2%)
3DMark 11 - 3DM11 Performance Physics
min: 7084     avg: 7306     median: 7333 (18%)     max: 7500 Points
11185 Points (28%)
3DMark - 3DMark Ice Storm Physics
18857 Points (15%)
70546 Points (57%)
3DMark - 3DMark Ice Storm Extreme Physics
70482 Points (57%)
3DMark - 3DMark Ice Storm Unlimited Physics
72413 Points (58%)
3DMark - 3DMark Cloud Gate Physics
min: 2899     avg: 4704     median: 4704 (12%)     max: 6509 Points
8275 Points (21%)
3DMark - 3DMark Fire Strike Standard Physics
min: 9533     avg: 9637     median: 9637 (17%)     max: 9741 Points
12616 Points (22%)
3DMark - 3DMark Time Spy CPU
2939 Points (12%)
5777 Points (24%)
Geekbench 6.5 - Geekbench 6.5 Single-Core
1592 Points (39%)
Geekbench 6.5 - Geekbench 6.5 Multi-Core
6248 Points (24%)
Geekbench 5.5 - Geekbench 5.1 - 5.5 64 Bit Single-Core
min: 1486     avg: 1588     median: 1588 (60%)     max: 1690 Points
1139 Points (43%)
Geekbench 5.5 - Geekbench 5.1 - 5.5 64 Bit Multi-Core
min: 4457     avg: 5990     median: 5989.5 (11%)     max: 7522 Points
5715 Points (10%)
Geekbench 5.0 - Geekbench 5.0 64 Bit Single-Core
min: 663     avg: 665     median: 665 (3%)     max: 667 Points
1132 Points (5%)
Geekbench 5.0 - Geekbench 5.0 64 Bit Multi-Core
min: 3749     avg: 3797     median: 3796.5 (12%)     max: 3844 Points
5698 Points (18%)
Geekbench 4.4 - Geekbench 4.1 - 4.4 64 Bit Single-Core
3460 Points (35%)
5347 Points (53%)
Geekbench 4.4 - Geekbench 4.1 - 4.4 64 Bit Multi-Core
15240 Points (15%)
21830 Points (21%)
Mozilla Kraken 1.1 - Kraken 1.1 Total Score *
min: 1913     avg: 1925     median: 1915 (2%)     max: 1946 ms
867 ms (1%)
Octane V2 - Octane V2 Total Score
49893 Points (37%)
WebXPRT 4 - WebXPRT 4 Score
min: 64.2     avg: 66.2     median: 67.2 (18%)     max: 67.2 Points
WebXPRT 3 - WebXPRT 3 Score
min: 84.7     avg: 90.5     median: 90.5 (16%)     max: 96.2 Points
211 Points (38%)
CrossMark - CrossMark Overall
min: 627     avg: 673     median: 672.5 (25%)     max: 718 Points
Power Consumption - Prime95 Power Consumption - external Monitor *
min: 26.9     avg: 33.5     median: 35.7 (6%)     max: 37.9 Watt
131.6 Watt (23%)
Power Consumption - Cinebench R15 Multi Power Consumption - external Monitor *
min: 32.7     avg: 33     median: 33 (6%)     max: 33.2 Watt
122.5 Watt (22%)
Power Consumption - Idle Power Consumption - external Monitor *
min: 3.21     avg: 3.4     median: 3.2 (2%)     max: 3.6 Watt
Power Consumption - Idle Power Consumption 150cd 1min *
min: 3.5     avg: 3.7     median: 3.7 (4%)     max: 3.9 Watt
Power Consumption - Power Efficiency - Cinebench R15 Multi external Monitor
min: 22.1     avg: 22.7     median: 22.7 (17%)     max: 23.3 Points per Watt
8 Points per Watt (6%)

Average Benchmarks Qualcomm Snapdragon 8cx Gen 3 → 100% n=34

Average Benchmarks Intel Core i5-9400F → 176% n=34

- Range of benchmark values for this graphics card
red legend - Average benchmark values for this graphics card
* Smaller numbers mean a higher performance
1 This benchmark is not used for the average calculation

Add one or more devices and compare

In the following list you can select (and also search for) devices that should be added to the comparison. You can select more than one device.

restrict list:
v1.34
log 09. 06:39:54

#0 ran 0s before starting gpusingle class +0s ... 0s

#1 checking url part for id 14600 +0s ... 0s

#2 checking url part for id 12197 +0s ... 0s

#3 redirected to Ajax server, took 1759984793s time from redirect:1 +0s ... 0s

#4 did not recreate cache, as it is less than 5 days old! Created at Tue, 07 Oct 2025 05:18:31 +0200 +0s ... 0s

#5 composed specs +0.005s ... 0.005s

#6 did output specs +0s ... 0.006s

#7 getting avg benchmarks for device 14600 +0.004s ... 0.01s

#8 got single benchmarks 14600 +0.007s ... 0.016s

#9 getting avg benchmarks for device 12197 +0.004s ... 0.02s

#10 got single benchmarks 12197 +0.004s ... 0.024s

#11 got avg benchmarks for devices +0s ... 0.024s

#12 min, max, avg, median took s +0.039s ... 0.063s

#13 return log +0.001s ... 0.064s

Please share our article, every link counts!
Mail Logo
> Expert Reviews and News on Laptops, Smartphones and Tech Innovations > Benchmarks / Tech > Processor Comparison - Head 2 Head
Redaktion, 2017-09- 8 (Update: 2023-07- 1)