Notebookcheck Logo

AMD Ryzen 9 7950X3D vs Intel Core i7-14700K vs AMD Ryzen 7 7800X3D

AMD Ryzen 9 7950X3D

► remove from comparison AMD R9 7950X3D

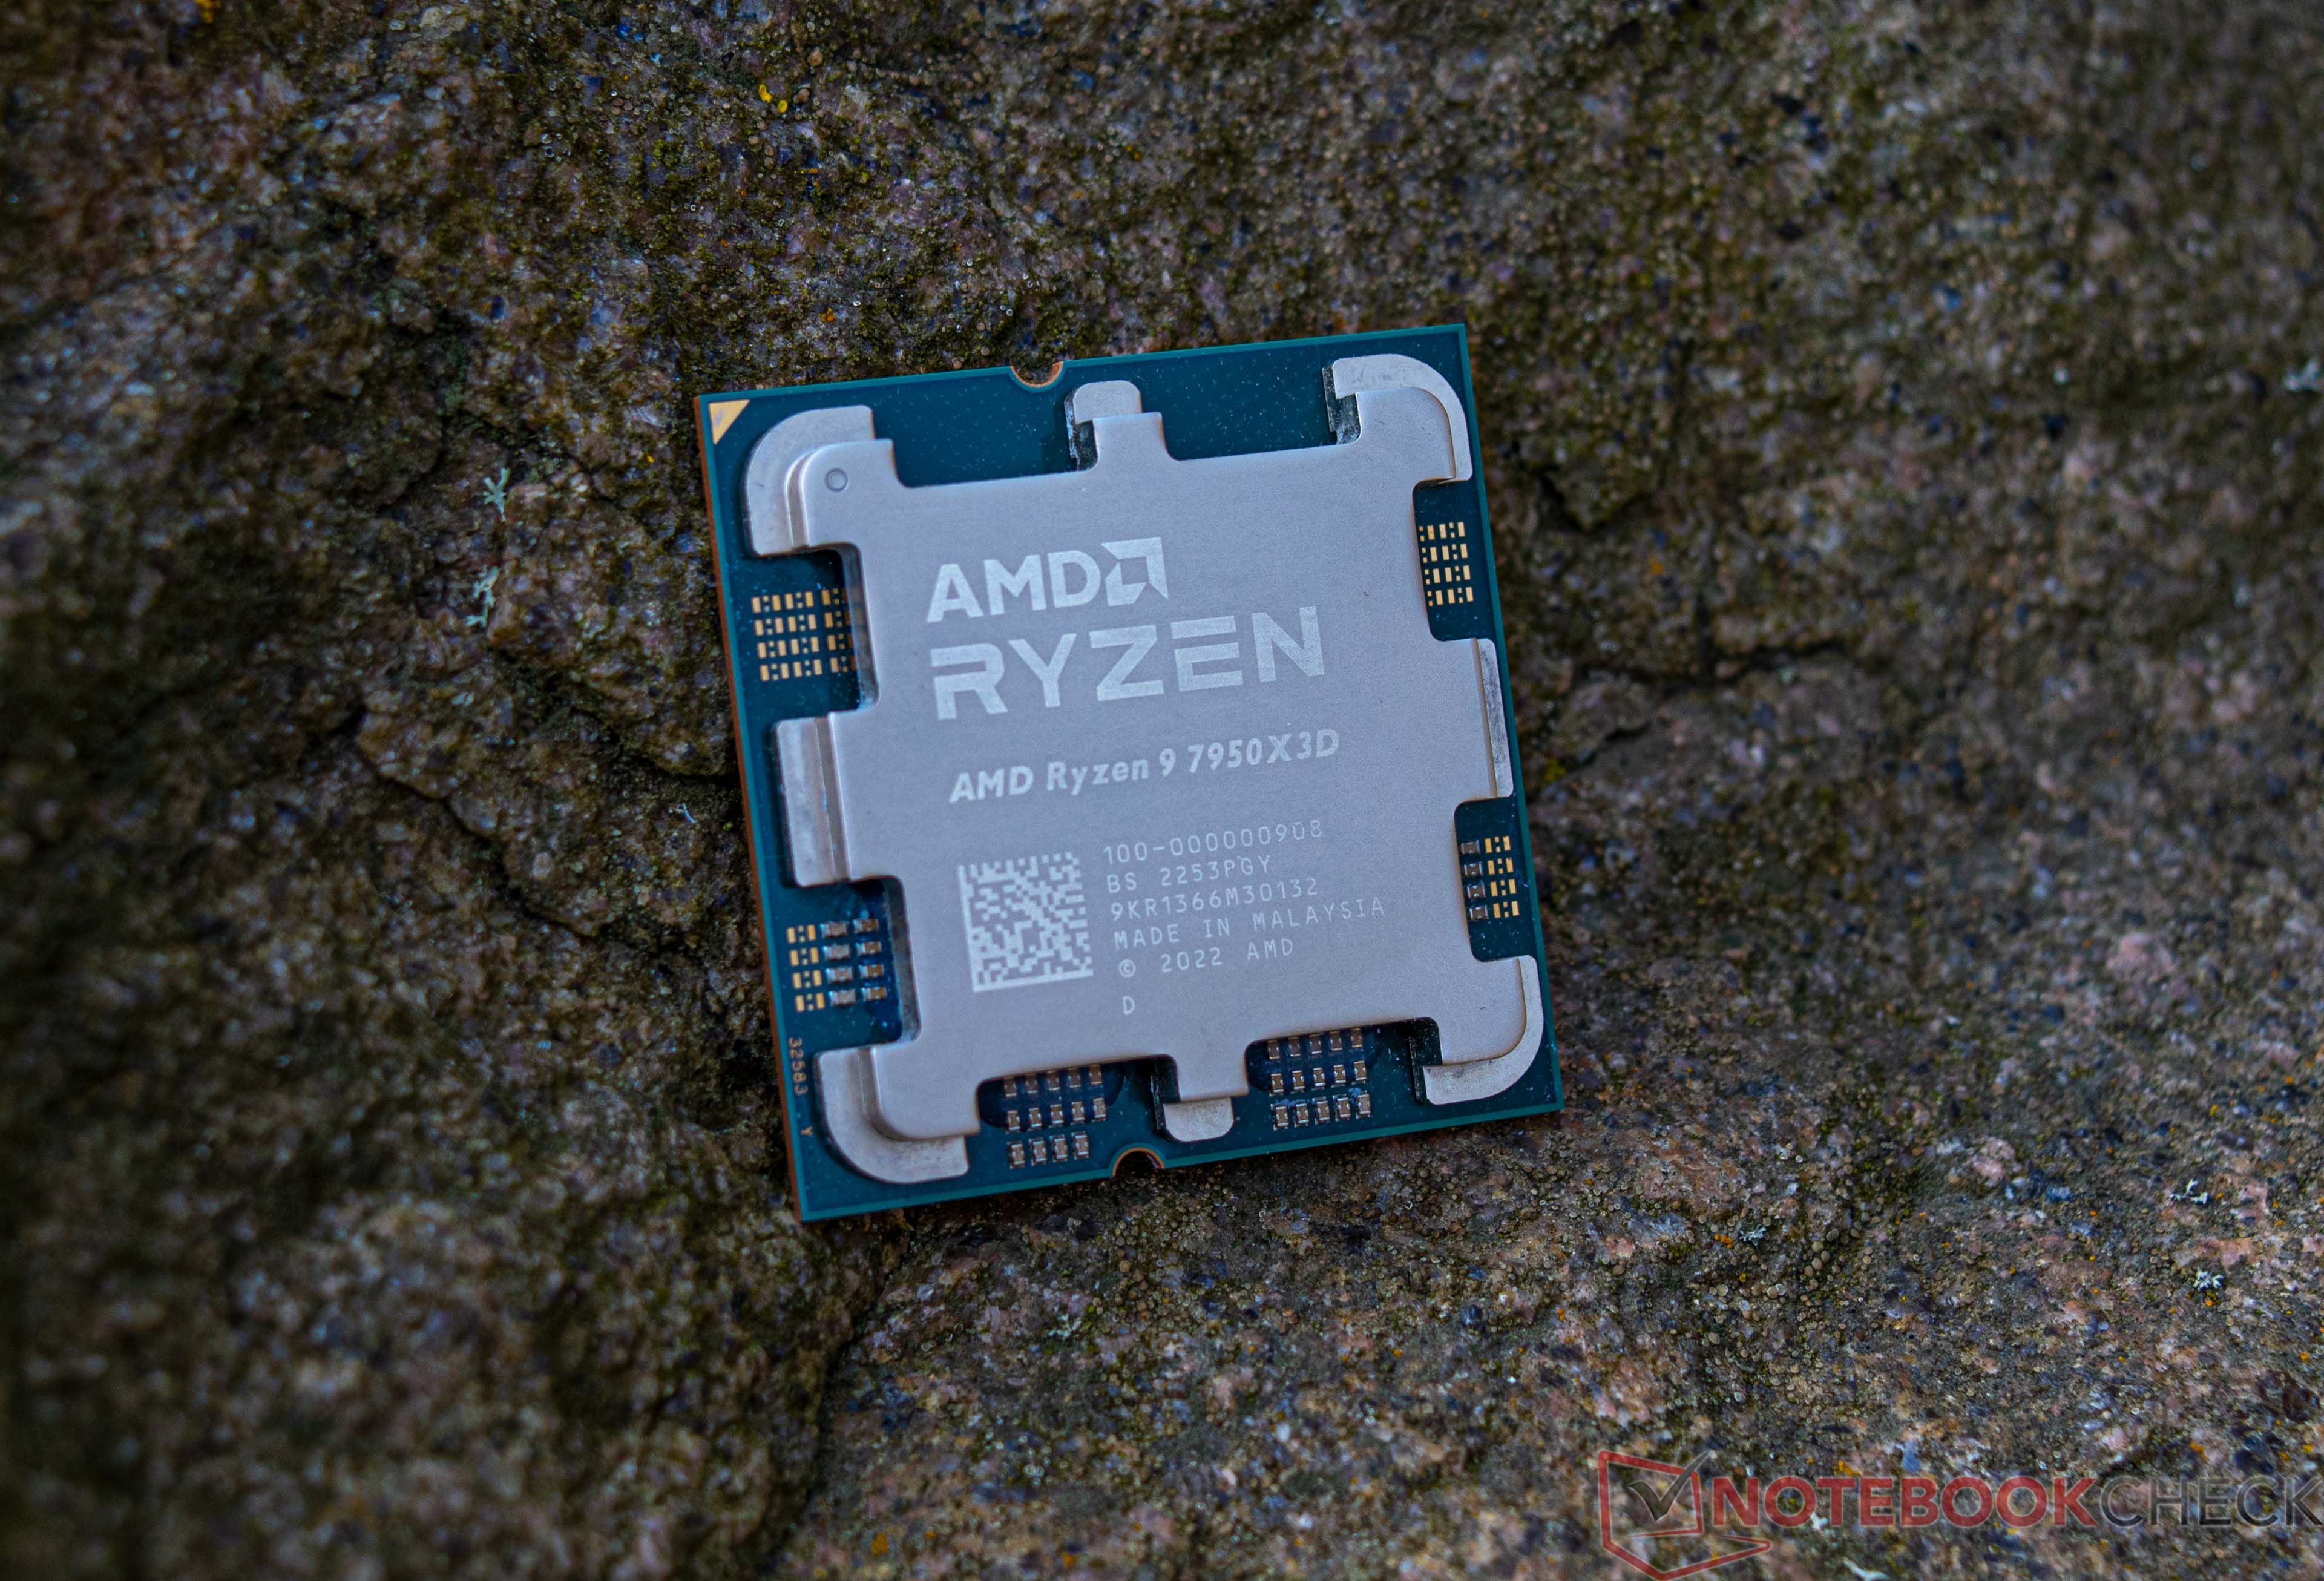
The AMD Ryzen 9 7950X3D is a high-end desktop processor of the Raphael series with 16 cores and SMT (Simultaneous Multithreading), which means it can process up to 32 threads simultaneously. With the release in February 2023, the Ryzen 9 7950X3D is AMD's fastest consumer processor and the new top model of the 7000 series. The CPU cores clock from 4.2 GHz (base clock) up to 5.7 GHz (single core Turbo). In addition, the AMD Ryzen 9 7950X3D has a CCD with 8 cores that can access the fast 3D V-cache, which offers considerably more gaming performance.

The performance of the AMD Ryzen 9 7950X3D is consistently excellent in all applications tested. In addition, AMD was again able to increase the single-thread performance compared to the non-X3D models. Nevertheless, the lower base clock compared to the AMD Ryzen 9 7950X means that a small drop in multi-thread performance has to be accepted.

The internal structure of the processor is comparable to the previous AMD Ryzen 9 7950X. The AMD Ryzen 9 7950X3D is also still based on the chiplet design consisting of two CCD clusters with 8 cores each. However, the two CCDs differ significantly from each other because one offers the fast 3D V-Cache, which primarily improves gaming performance. In testing, the AMD Ryzen 9 7950X3D was able to put the Intel Core i9-13900K in second place and is the fastest gaming CPU on the market at the time of testing. 

The AMD Ryzen 9 7950X3D is an extremely energy-efficient CPU with up to 162 watts (PPT) and is significantly more frugal under load than an AMD Ryzen 9 7950X (max. 230 watts).

Intel Core i7-14700K

► remove from comparison Intel i7-14700K

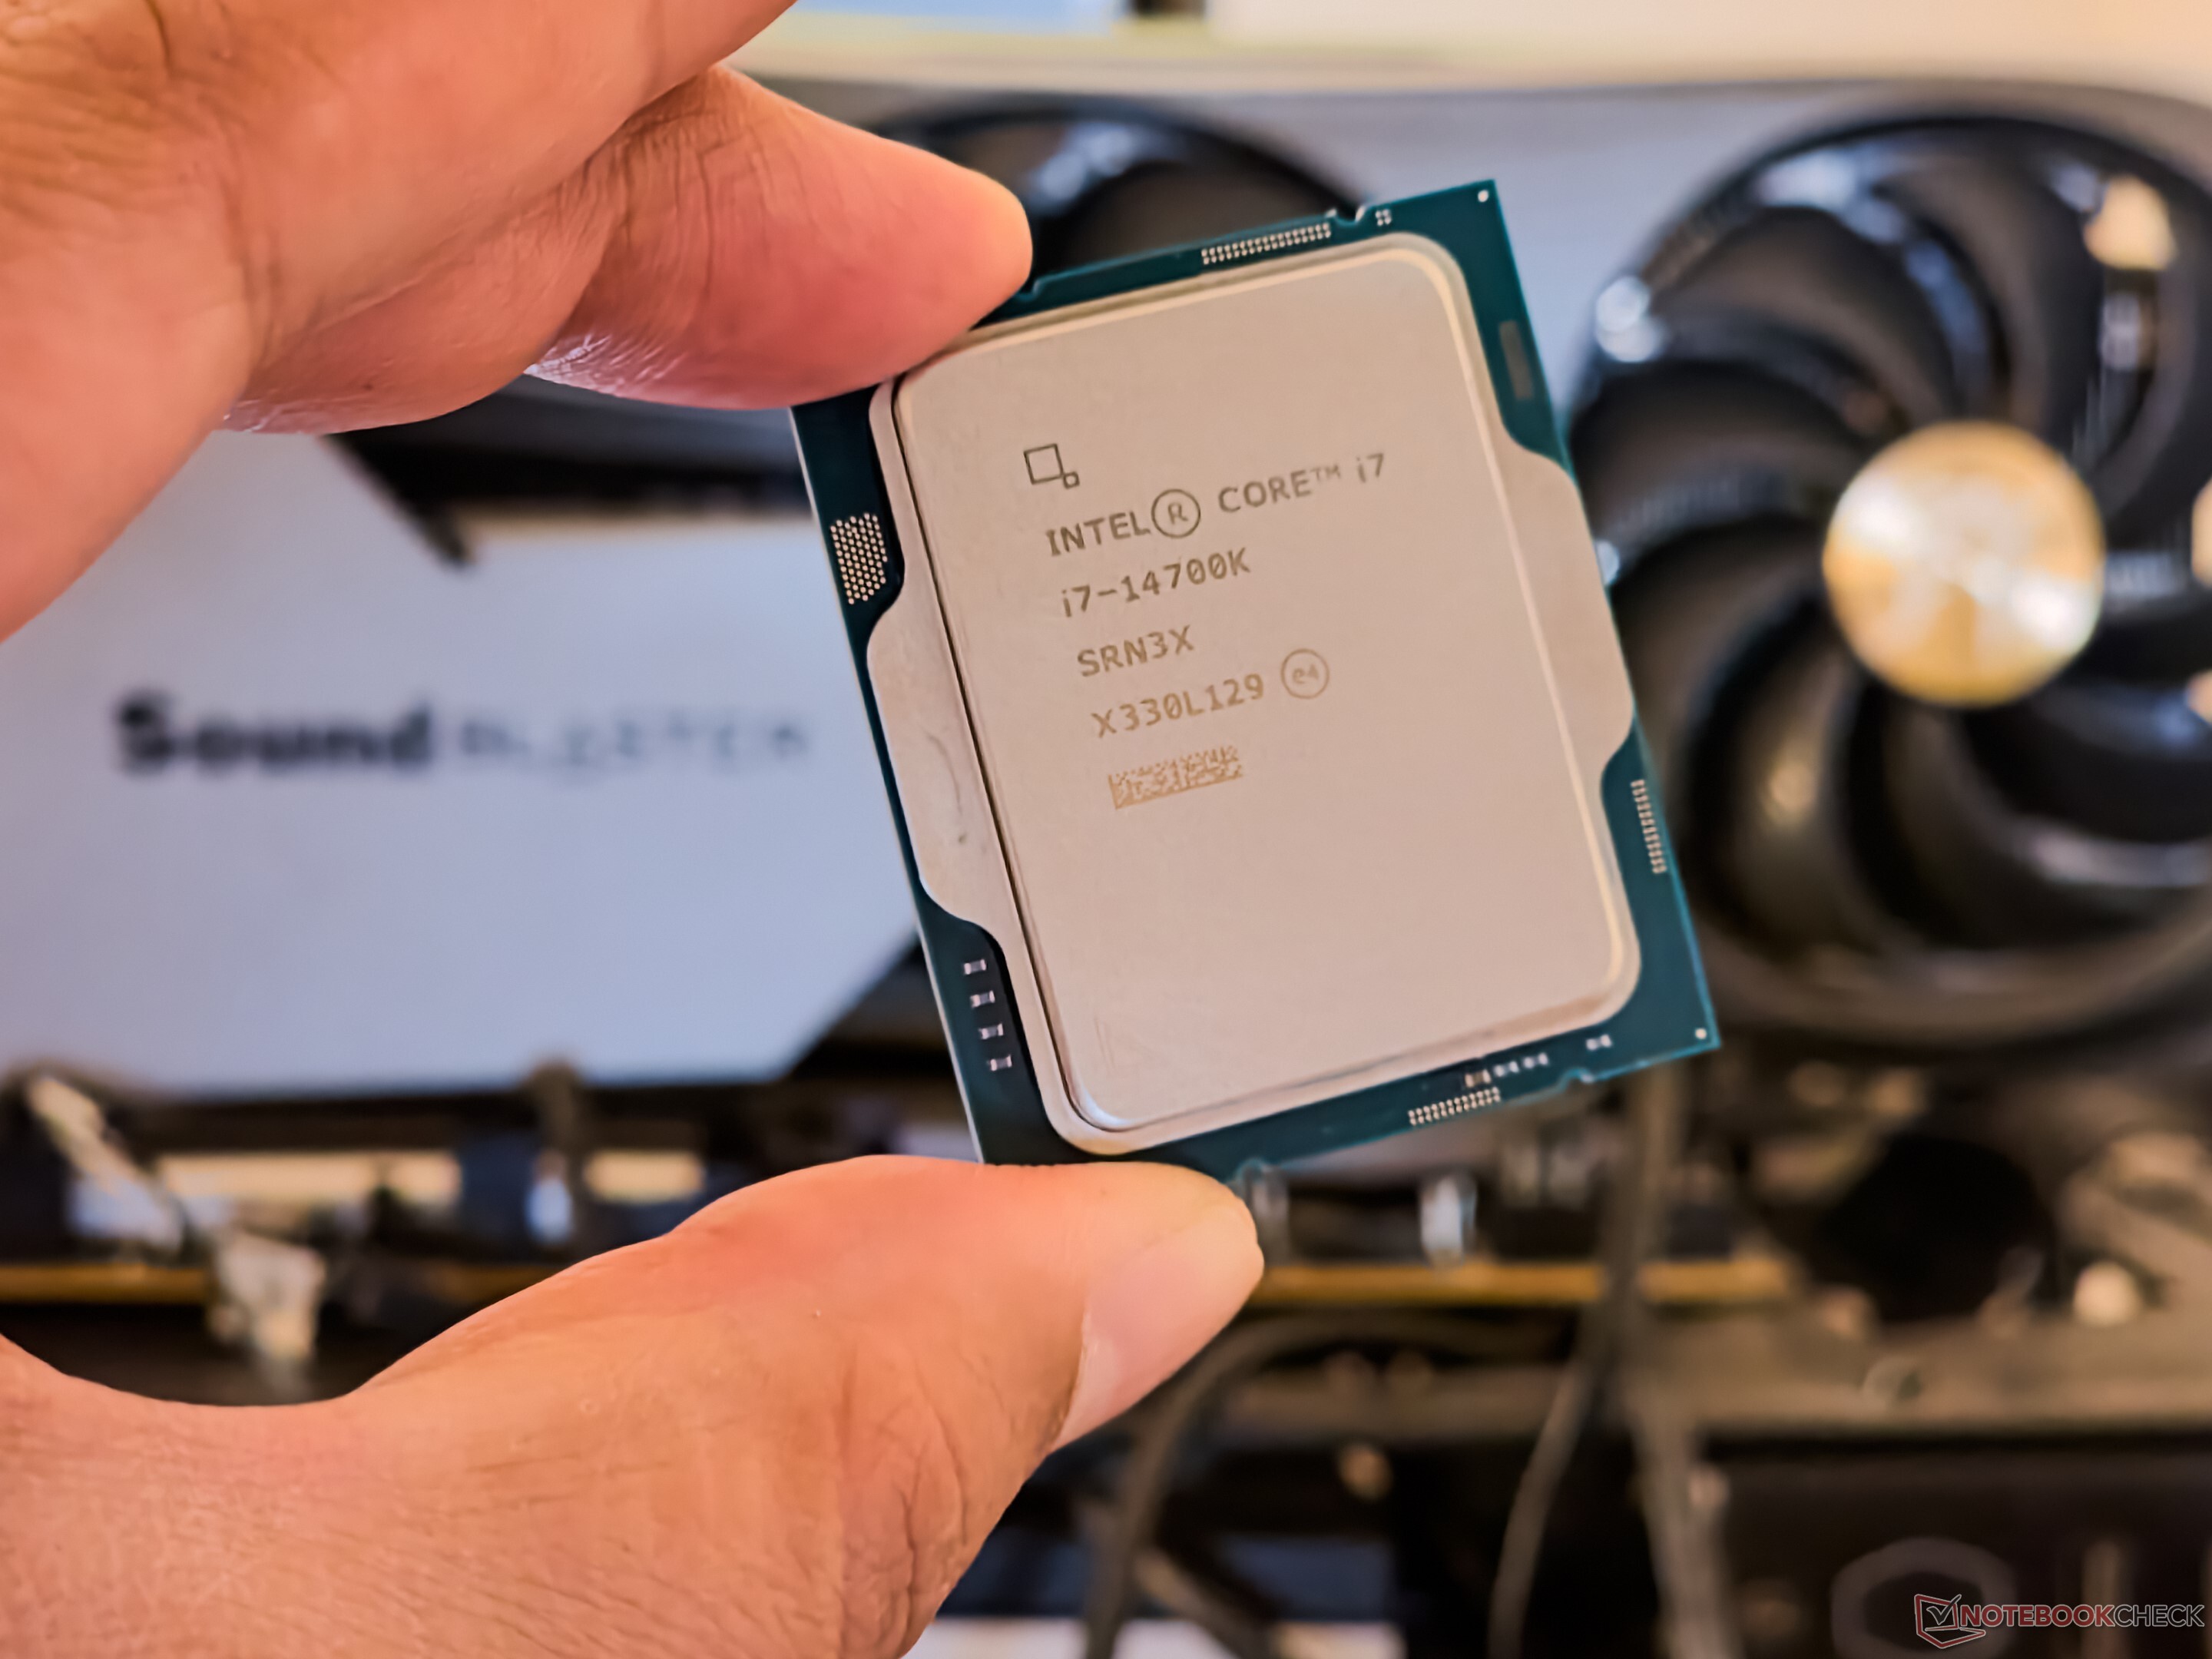
The Intel Core i7-14700K is a desktop processor based on the Raptor Lake architecture, which inherits the 13th generation of Intel Core processors with minor improvements. The processor offers a base clock of 2.5 GHz or 3.4 GHz and reaches up to 5.6 GHz in Turbo. The basic CPU structure remains unchanged. The Intel Core i7-14700K features 8 P-cores and 12 E-cores, allowing up to 28 threads to be processed in parallel. The Intel Core i7-14700K still offers a freely selectable multiplier, which makes overclocking much easier. It is also based on the LGA 1700 socket, which was already introduced with Alder Lake.

Performance

Compared to the Intel Core i7-13700K, the IPC of the new Core i7-14700K has only been increased slightly. This means that the difference in performance is only due to the higher number of efficiency cores (12 vs. 8) and higher clock rates.


Graphics unit

Like the Intel Core i7-13700K, the Intel Core i7-14700K also has an integrated graphics unit. The Intel Iris Xe architecture continues to serve as the basis. In terms of performance, however, nothing has changed with the Intel UHD Graphics 770.

Power consumption

The TDP of the Intel Core i7-14700K is 125 Watts, with the option of consuming up to 253 watts in Turbo mode.

AMD Ryzen 7 7800X3D

► remove from comparison AMD R7 7800X3D

The AMD Ryzen 7 7800X3D is a high-end desktop processor from the Raphael series with 8 Zen 4 cores and SMT (Simultaneous Multithreading), allowing it to handle up to 16 threads simultaneously. After its announcement in January 2023 at CES in Las Vegas, it was launched in April 2023. Following the launch of the two top models, the AMD Ryzen 9 7900X3D and the AMD Ryzen 9 7950X3D, the third model was introduced, which offers significantly more gaming performance with the 3D V-Cache.

The CPU cores have a base clock of 4.2 GHz and can be boosted up to 5 GHz (single-core turbo). The AMD Ryzen 7 7800X3D features a CCD with 8 cores, which includes the fast 3D V-Cache. This differs significantly from the two Ryzen 9 models, as they have two CCDs, but only one of them can utilize the 3D V-Cache.

The performance of the AMD Ryzen 7 7800X3D is consistently good, although its multi-threaded performance suffers a bit due to the eight native compute cores. However, the real strength of the AMD Ryzen 7 7800X3D lies in gaming performance, where it excels. In tests, we see consistently high gaming performance, even surpassing that of an Intel Core i9-13900K.

In terms of power consumption, the AMD Ryzen 7 7800X3D aligns with the other two models featuring 3D V-Cache, making the 8-core processor extremely power-efficient. In numbers, this means that the AMD Ryzen 7 7800X3D is specified with a TDP of up to 120 watts. The PPT (Package Power Tracking) is also rated up to 162 watts. For comparison, an AMD Ryzen 9 7950X is specified with 170 watts (TDP) or 230 watts (PPT).

ModelAMD Ryzen 9 7950X3DIntel Core i7-14700KAMD Ryzen 7 7800X3D
CodenameRaphael (Zen4)Raptor LakeRaphael (Zen4)
SeriesAMD Raphael (Zen 4, Ryzen 7000)Intel Raptor Lake-RAMD Raphael (Zen 4, Ryzen 7000)
Series: Raphael (Zen 4, Ryzen 7000) Raphael (Zen4)
AMD Ryzen 9 7950X3D « 4.2 - 5.7 GHz16 / 32 cores128 MB L3
AMD Ryzen 9 7900X4.7 - 5.6 GHz12 / 24 cores64 MB L3
AMD Ryzen 9 79003.7 - 5.4 GHz12 / 24 cores64 MB L3
AMD Ryzen 7 7700X4.5 - 5.4 GHz8 / 16 cores32 MB L3
AMD Ryzen 7 77003.8 - 5.3 GHz8 / 16 cores32 MB L3
AMD Ryzen 7 7800X3D4.2 - 5 GHz8 / 16 cores96 MB L3
AMD Ryzen 5 7600X4.7 - 5.3 GHz6 / 12 cores32 MB L3
AMD Ryzen 5 76003.8 - 5.1 GHz6 / 12 cores32 MB L3
Intel Core i9-14900K3.2 - 6 GHz24 / 32 cores36 MB L3
Intel Core i7-14700K « 2.5 - 5.6 GHz20 / 28 cores33 MB L3
Intel Core i9-149002 - 5.8 GHz24 / 32 cores36 MB L3
Intel Core i7-147001.5 - 5.4 GHz20 / 28 cores33 MB L3
Intel Core i5-14600K3.5 - 5.3 GHz14 / 20 cores24 MB L3
Intel Core i5-145002.6 - 5 GHz14 / 20 cores24 MB L3
Intel Core i5-14500T1.7 - 4.8 GHz14 / 20 cores24 MB L3
AMD Ryzen 9 7950X3D4.2 - 5.7 GHz16 / 32 cores128 MB L3
AMD Ryzen 9 7900X4.7 - 5.6 GHz12 / 24 cores64 MB L3
AMD Ryzen 9 79003.7 - 5.4 GHz12 / 24 cores64 MB L3
AMD Ryzen 7 7700X4.5 - 5.4 GHz8 / 16 cores32 MB L3
AMD Ryzen 7 77003.8 - 5.3 GHz8 / 16 cores32 MB L3
AMD Ryzen 7 7800X3D « 4.2 - 5 GHz8 / 16 cores96 MB L3
AMD Ryzen 5 7600X4.7 - 5.3 GHz6 / 12 cores32 MB L3
AMD Ryzen 5 76003.8 - 5.1 GHz6 / 12 cores32 MB L3
Clock4200 - 5700 MHz2500 - 5600 MHz4200 - 5000 MHz
L1 Cache1 MB512 KB
L2 Cache16 MB28 MB8 MB
L3 Cache128 MB33 MB96 MB
Cores / Threads16 / 32
16 x 5.7 GHz AMD Zen 4
20 / 28
8 x 5.6 GHz Intel Raptor Cove P-Core
12 x 4.3 GHz Intel Gracemont E-Core
8 / 16
TDP120 Watt125 Watt120 Watt
Transistors13140 Million6570 Million
Technology5 nm10 nm5 nm
Die Size263 mm2193 mm2
max. Temp.89 °C100 °C89 °C
SocketAM5 (LGA 1718)LGA 1700AM5 (LGA 1718)
FeaturesMMX(+), SSE, SSE2, SSE3, SSSE3, SSE4.1, SSE4.2, SSE4A, x86-64, AMD-V, AES, AVX, AVX2, AVX512F, FMA3, SHA, XFR2, Precision Boost 2Intel UHD Graphics 770, DDR5 5600 MT/s, DDR4 3200 MT/sMMX, SSE, SSE2, SSE3, SSSE3, SSE4.1, SSE4.2, SSE4A, x86-64, AMD-V, AES, AVX, AVX2, AVX512, BMI1, BMI2, F16C, FMA3, AMD64, EVP, AMD-V, SMAP, SMEP, SMT SHA, XFR2, Precision Boost 2
iGPUAMD Radeon Graphics (Ryzen 7000) (400 - 2200 MHz)Intel UHD Graphics 770 (300 - 1600 MHz)AMD Radeon Graphics (Ryzen 7000) (400 - 2200 MHz)
Architecturex86x86x86
$699 U.S.$409 U.S.$449 U.S.
Announced
Manufacturerwww.amd.comark.intel.com
TDP Turbo PL2253 Watt162 Watt
Voltage1.1 - 1.2 V

Benchmarks

Performance Rating - CB R15 + R20 + 7-Zip + X265 + Blender + 3DM11 CPU - R9 7950X3D
49.9 pt (83%)
Restrict / Search: Model: Max. age: years
Performance Rating - CB R15 + R20 + 7-Zip + X265 + Blender + 3DM11 CPU - i7-14700K
47.5 pt (79%)
Restrict / Search: Model: Max. age: years
Performance Rating - CB R15 + R20 + 7-Zip + X265 + Blender + 3DM11 CPU - R7 7800X3D
42.3 pt (70%)
Restrict / Search: Model: Max. age: years
Cinebench 2024 - Cinebench 2024 CPU Single Core
min: 126     avg: 127     median: 127 (63%)     max: 127.9 Points
Cinebench 2024 - Cinebench 2024 CPU Multi Core
min: 1559     avg: 1771     median: 1770.5 (33%)     max: 1982 Points
Cinebench R23 - Cinebench R23 Multi Core
36291 Points (34%)
min: 30989     avg: 33441     median: 33440.5 (31%)     max: 35892 Points
min: 16688     avg: 17197     median: 16817 (16%)     max: 18086 Points
Cinebench R23 - Cinebench R23 Single Core
2053 Points (83%)
min: 2153     avg: 2160     median: 2160 (88%)     max: 2167 Points
min: 1646     avg: 1726     median: 1713 (70%)     max: 1820 Points
Cinebench R20 - Cinebench R20 CPU (Single Core)
795 Points (87%)
min: 832     avg: 836     median: 836 (91%)     max: 840 Points
min: 663     avg: 686     median: 686 (75%)     max: 709 Points
Cinebench R20 - Cinebench R20 CPU (Multi Core)
14188 Points (35%)
min: 11814     avg: 12743     median: 12743 (31%)     max: 13672 Points
min: 6488     avg: 6805     median: 6804.5 (17%)     max: 7121 Points
Cinebench R15 - Cinebench R15 CPU Multi 64 Bit
5974 Points (38%)
min: 4611     avg: 5035     median: 5035 (32%)     max: 5459 Points
min: 2783     avg: 2879     median: 2878.5 (18%)     max: 2974 Points
Cinebench R15 - Cinebench R15 CPU Single 64 Bit
326 Points (90%)
min: 313     avg: 313.5     median: 313.5 (87%)     max: 314 Points
min: 272     avg: 281.5     median: 281.5 (78%)     max: 291 Points
Cinebench R11.5 - Cinebench R11.5 CPU Multi 64 Bit
64.6 Points (84%)
min: 54.22     avg: 57.8     median: 57.8 (75%)     max: 61.44 Points
33.5 Points (43%)
Cinebench R11.5 - Cinebench R11.5 CPU Single 64 Bit
3.9 Points (92%)
min: 3.7     avg: 3.7     median: 3.7 (89%)     max: 3.77 Points
3.4 Points (81%)
Cinebench R10 - Cinebench R10 Rend. Single (32bit)
16551 Points (100%)
min: 11745     avg: 11886     median: 11886 (72%)     max: 12027 Points
8026 Points (48%)
Cinebench R10 - Cinebench R10 Rend. Multi (32bit)
138015 Points (100%)
min: 91081     avg: 91124     median: 91123.5 (66%)     max: 91166 Points
51950 Points (38%)
Cinebench R10 - Cinebench R10 Rend. Multi (64bit)
72361 Points (46%)
min: 124651     avg: 130357     median: 130356 (83%)     max: 136062 Points
94035 Points (60%)
Cinebench R10 - Cinebench R10 Rend. Single (64bit)
8853 Points (11%)
min: 17400     avg: 17429     median: 17429 (21%)     max: 17458 Points
14485 Points (18%)
wPrime 2.10 - wPrime 2.0 1024m *
33.9 s (0%)
min: 50.891     avg: 80.3     median: 80.3 (1%)     max: 109.801 s
62.7 s (1%)
wPrime 2.10 - wPrime 2.0 32m *
2 s (0%)
min: 2.147     avg: 2.2     median: 2.2 (0%)     max: 2.252 s
2.4 s (0%)
WinRAR - WinRAR 4.0
15779 Points (25%)
min: 12800     avg: 12813     median: 12812.5 (20%)     max: 12825 Points
16585 Points (26%)
7-Zip 18.03 - 7-Zip 18.03 Multi Thread 4 runs
159341 MIPS (91%)
min: 117224     avg: 126436     median: 126436 (73%)     max: 135648 MIPS
min: 75558     avg: 80313     median: 80312.5 (46%)     max: 85067 MIPS
7-Zip 18.03 - 7-Zip 18.03 Single Thread 4 runs
8321 MIPS (98%)
min: 7040     avg: 7196     median: 7195.5 (85%)     max: 7351 MIPS
min: 7412     avg: 7824     median: 7823.5 (92%)     max: 8235 MIPS
X264 HD Benchmark 4.0 - x264 Pass 2
265.5 fps (7%)
min: 225.5     avg: 243.3     median: 243.3 (6%)     max: 261 fps
169.3 fps (4%)
X264 HD Benchmark 4.0 - x264 Pass 1
392.5 fps (10%)
min: 393.5     avg: 406.3     median: 406.3 (10%)     max: 419 fps
344 fps (9%)
HWBOT x265 Benchmark v2.2 - HWBOT x265 4k Preset
42.4 fps (75%)
min: 32.3     avg: 34.6     median: 34.6 (61%)     max: 36.8 fps
min: 22.1     avg: 23.3     median: 23.3 (41%)     max: 24.4 fps
TrueCrypt - TrueCrypt Serpent
2.8 GB/s (82%)
min: 2.2     avg: 2.4     median: 2.4 (71%)     max: 2.6 GB/s
1.3 GB/s (38%)
TrueCrypt - TrueCrypt Twofish
4.2 GB/s (72%)
min: 4.4     avg: 4.5     median: 4.5 (78%)     max: 4.6 GB/s
2.1 GB/s (36%)
TrueCrypt - TrueCrypt AES
26.9 GB/s (70%)
min: 18     avg: 21.8     median: 21.8 (57%)     max: 25.6 GB/s
15.3 GB/s (40%)
Blender - Blender 3.3 Classroom CPU *
133 Seconds (2%)
min: 155     avg: 181.5     median: 181.5 (2%)     max: 208 Seconds
min: 266     avg: 282.5     median: 282.5 (4%)     max: 299 Seconds
Blender - Blender 2.79 BMW27 CPU *
86 Seconds (1%)
min: 91     avg: 100     median: 100 (1%)     max: 109 Seconds
min: 169     avg: 178     median: 178 (1%)     max: 187 Seconds
R Benchmark 2.5 - R Benchmark 2.5 *
0.4 sec (8%)
min: 0.3788     avg: 0.4     median: 0.4 (8%)     max: 0.3826 sec
min: 0.4152     avg: 0.4     median: 0.4 (9%)     max: 0.4479 sec
3DMark 06 - CPU - 3DMark 06 - CPU
20279 Points (43%)
min: 11741     avg: 16203     median: 16203 (34%)     max: 20665 Points
16892 Points (36%)
Super Pi mod 1.5 XS 1M - Super Pi mod 1.5 XS 1M *
6.1 s (1%)
min: 5.953     avg: 6     median: 6 (1%)     max: 5.98 s
7.1 s (2%)
Super Pi mod 1.5 XS 2M - Super Pi mod 1.5 XS 2M *
13.2 s (1%)
min: 12.844     avg: 12.9     median: 12.9 (1%)     max: 12.894 s
15.3 s (1%)
Super Pi Mod 1.5 XS 32M - Super Pi mod 1.5 XS 32M *
305.1 s (1%)
min: 305.942     avg: 311     median: 311 (1%)     max: 316.148 s
337.6 s (1%)
3DMark Vantage - 3DM Vant. Perf. CPU no Physx
99321 Points (76%)
96298 Points (74%)
97391 Points (75%)
3DMark 11 - 3DM11 Performance Physics
36991 Points (91%)
min: 28739     avg: 30538     median: 30537.5 (75%)     max: 32336 Points
min: 30767     avg: 32947     median: 32947 (81%)     max: 35127 Points
3DMark - 3DMark Ice Storm Physics
86389 Points (70%)
82048 Points (67%)
89617 Points (73%)
3DMark - 3DMark Ice Storm Extreme Physics
86306 Points (70%)
81495 Points (66%)
89287 Points (72%)
3DMark - 3DMark Ice Storm Unlimited Physics
87725 Points (70%)
85692 Points (69%)
91846 Points (74%)
3DMark - 3DMark Cloud Gate Physics
26168 Points (66%)
23358 Points (59%)
25510 Points (65%)
3DMark - 3DMark Fire Strike Standard Physics
44787 Points (80%)
min: 40312     avg: 44727     median: 44727 (80%)     max: 49142 Points
min: 30333     avg: 31455     median: 30687 (55%)     max: 33345 Points
3DMark - 3DMark Time Spy CPU
17206 Points (73%)
min: 15951     avg: 18746     median: 18746 (79%)     max: 21541 Points
min: 10908     avg: 12327     median: 11975 (50%)     max: 14098 Points
Geekbench 6.5 - Geekbench 6.5 Single-Core
2990 Points (69%)
min: 2902     avg: 2922     median: 2922 (68%)     max: 2942 Points
2634 Points (61%)
Geekbench 6.5 - Geekbench 6.5 Multi-Core
19960 Points (77%)
min: 18504     avg: 19147     median: 19147 (74%)     max: 19790 Points
14288 Points (55%)
Geekbench 6.0 - Geekbench 6.0 Single-Core
2175 Points (69%)
Geekbench 6.0 - Geekbench 6.0 Multi-Core
12046 Points (49%)
Geekbench 5.5 - Geekbench 5.1 - 5.5 64 Bit Single-Core
2311 Points (78%)
min: 2092     avg: 2107     median: 2106.5 (71%)     max: 2121 Points
min: 1856     avg: 1934     median: 1920 (65%)     max: 2027 Points
Geekbench 5.5 - Geekbench 5.1 - 5.5 64 Bit Multi-Core
24343 Points (44%)
min: 19971     avg: 21565     median: 21565 (39%)     max: 23159 Points
min: 12073     avg: 13013     median: 12715 (23%)     max: 14252 Points
Geekbench 5.0 - Geekbench 5.0 64 Bit Single-Core
2183 Points (9%)
min: 2039     avg: 2042     median: 2042 (9%)     max: 2045 Points
1938 Points (8%)
Geekbench 5.0 - Geekbench 5.0 64 Bit Multi-Core
23720 Points (75%)
min: 19766     avg: 21261     median: 21261 (67%)     max: 22756 Points
13888 Points (44%)
Geekbench 4.4 - Geekbench 4.1 - 4.4 64 Bit Single-Core
9240 Points (92%)
min: 8874     avg: 9089     median: 9089 (91%)     max: 9304 Points
9097 Points (91%)
Geekbench 4.4 - Geekbench 4.1 - 4.4 64 Bit Multi-Core
87922 Points (86%)
min: 72062     avg: 75782     median: 75781.5 (74%)     max: 79501 Points
54840 Points (54%)
Mozilla Kraken 1.1 - Kraken 1.1 Total Score *
437 ms (1%)
min: 439     avg: 439.5     median: 439.5 (1%)     max: 440 ms
min: 487     avg: 504     median: 503.5 (1%)     max: 520 ms
WebXPRT 4 - WebXPRT 4 Score
313 Points (82%)
min: 303     avg: 308.5     median: 308.5 (80%)     max: 314 Points
282 Points (73%)
WebXPRT 3 - WebXPRT 3 Score
383 Points (69%)
min: 311     avg: 325     median: 325 (58%)     max: 339 Points
353 Points (63%)
CrossMark - CrossMark Overall
2193 Points (82%)
min: 2194     avg: 2241     median: 2241 (84%)     max: 2288 Points
2216 Points (83%)
Power Consumption - Prime95 Power Consumption - external Monitor *
276 Watt (48%)
min: 191.9     avg: 296     median: 296 (51%)     max: 400 Watt
218 Watt (38%)
Power Consumption - Cinebench R15 Multi Power Consumption - external Monitor *
273 Watt (50%)
min: 287     avg: 357.5     median: 357.5 (65%)     max: 428 Watt
207 Watt (38%)
Power Consumption - Idle Power Consumption - external Monitor *
118.4 Watt (78%)
min: 22.4     avg: 63.6     median: 63.6 (42%)     max: 104.8 Watt
121.6 Watt (80%)
Power Consumption - Power Efficiency - Cinebench R15 Multi external Monitor
21.9 Points per Watt (16%)
min: 12.8     avg: 14.5     median: 14.5 (11%)     max: 16.1 Points per Watt
14.4 Points per Watt (11%)

Average Benchmarks AMD Ryzen 9 7950X3D → 100% n=50

Average Benchmarks Intel Core i7-14700K → 95% n=50

Average Benchmarks AMD Ryzen 7 7800X3D → 78% n=50

- Range of benchmark values for this graphics card
red legend - Average benchmark values for this graphics card
* Smaller numbers mean a higher performance
1 This benchmark is not used for the average calculation

v1.34
log 24. 15:10:29

#0 ran 0s before starting gpusingle class +0s ... 0s

#1 checking url part for id 15000 +0s ... 0s

#2 checking url part for id 16391 +0s ... 0s

#3 checking url part for id 15064 +0s ... 0s

#4 redirected to Ajax server, took 1761311429s time from redirect:0 +0s ... 0s

#5 did not recreate cache, as it is less than 5 days old! Created at Thu, 23 Oct 2025 11:39:17 +0200 +0s ... 0s

#6 composed specs +0.006s ... 0.006s

#7 did output specs +0s ... 0.006s

#8 getting avg benchmarks for device 15000 +0.004s ... 0.01s

#9 got single benchmarks 15000 +0.005s ... 0.015s

#10 getting avg benchmarks for device 16391 +0.004s ... 0.019s

#11 got single benchmarks 16391 +0.006s ... 0.025s

#12 getting avg benchmarks for device 15064 +0.004s ... 0.029s

#13 got single benchmarks 15064 +0.006s ... 0.034s

#14 got avg benchmarks for devices +0s ... 0.034s

#15 min, max, avg, median took s +0.078s ... 0.112s

#16 return log +0s ... 0.112s

Please share our article, every link counts!
Mail Logo
> Expert Reviews and News on Laptops, Smartphones and Tech Innovations > Benchmarks / Tech > Processor Comparison - Head 2 Head
Redaktion, 2017-09- 8 (Update: 2023-07- 1)