Notebookcheck Logo

AMD Ryzen 7 5800X vs AMD Ryzen 9 9950X

AMD Ryzen 7 5800X

► remove from comparison AMD R7 5800X

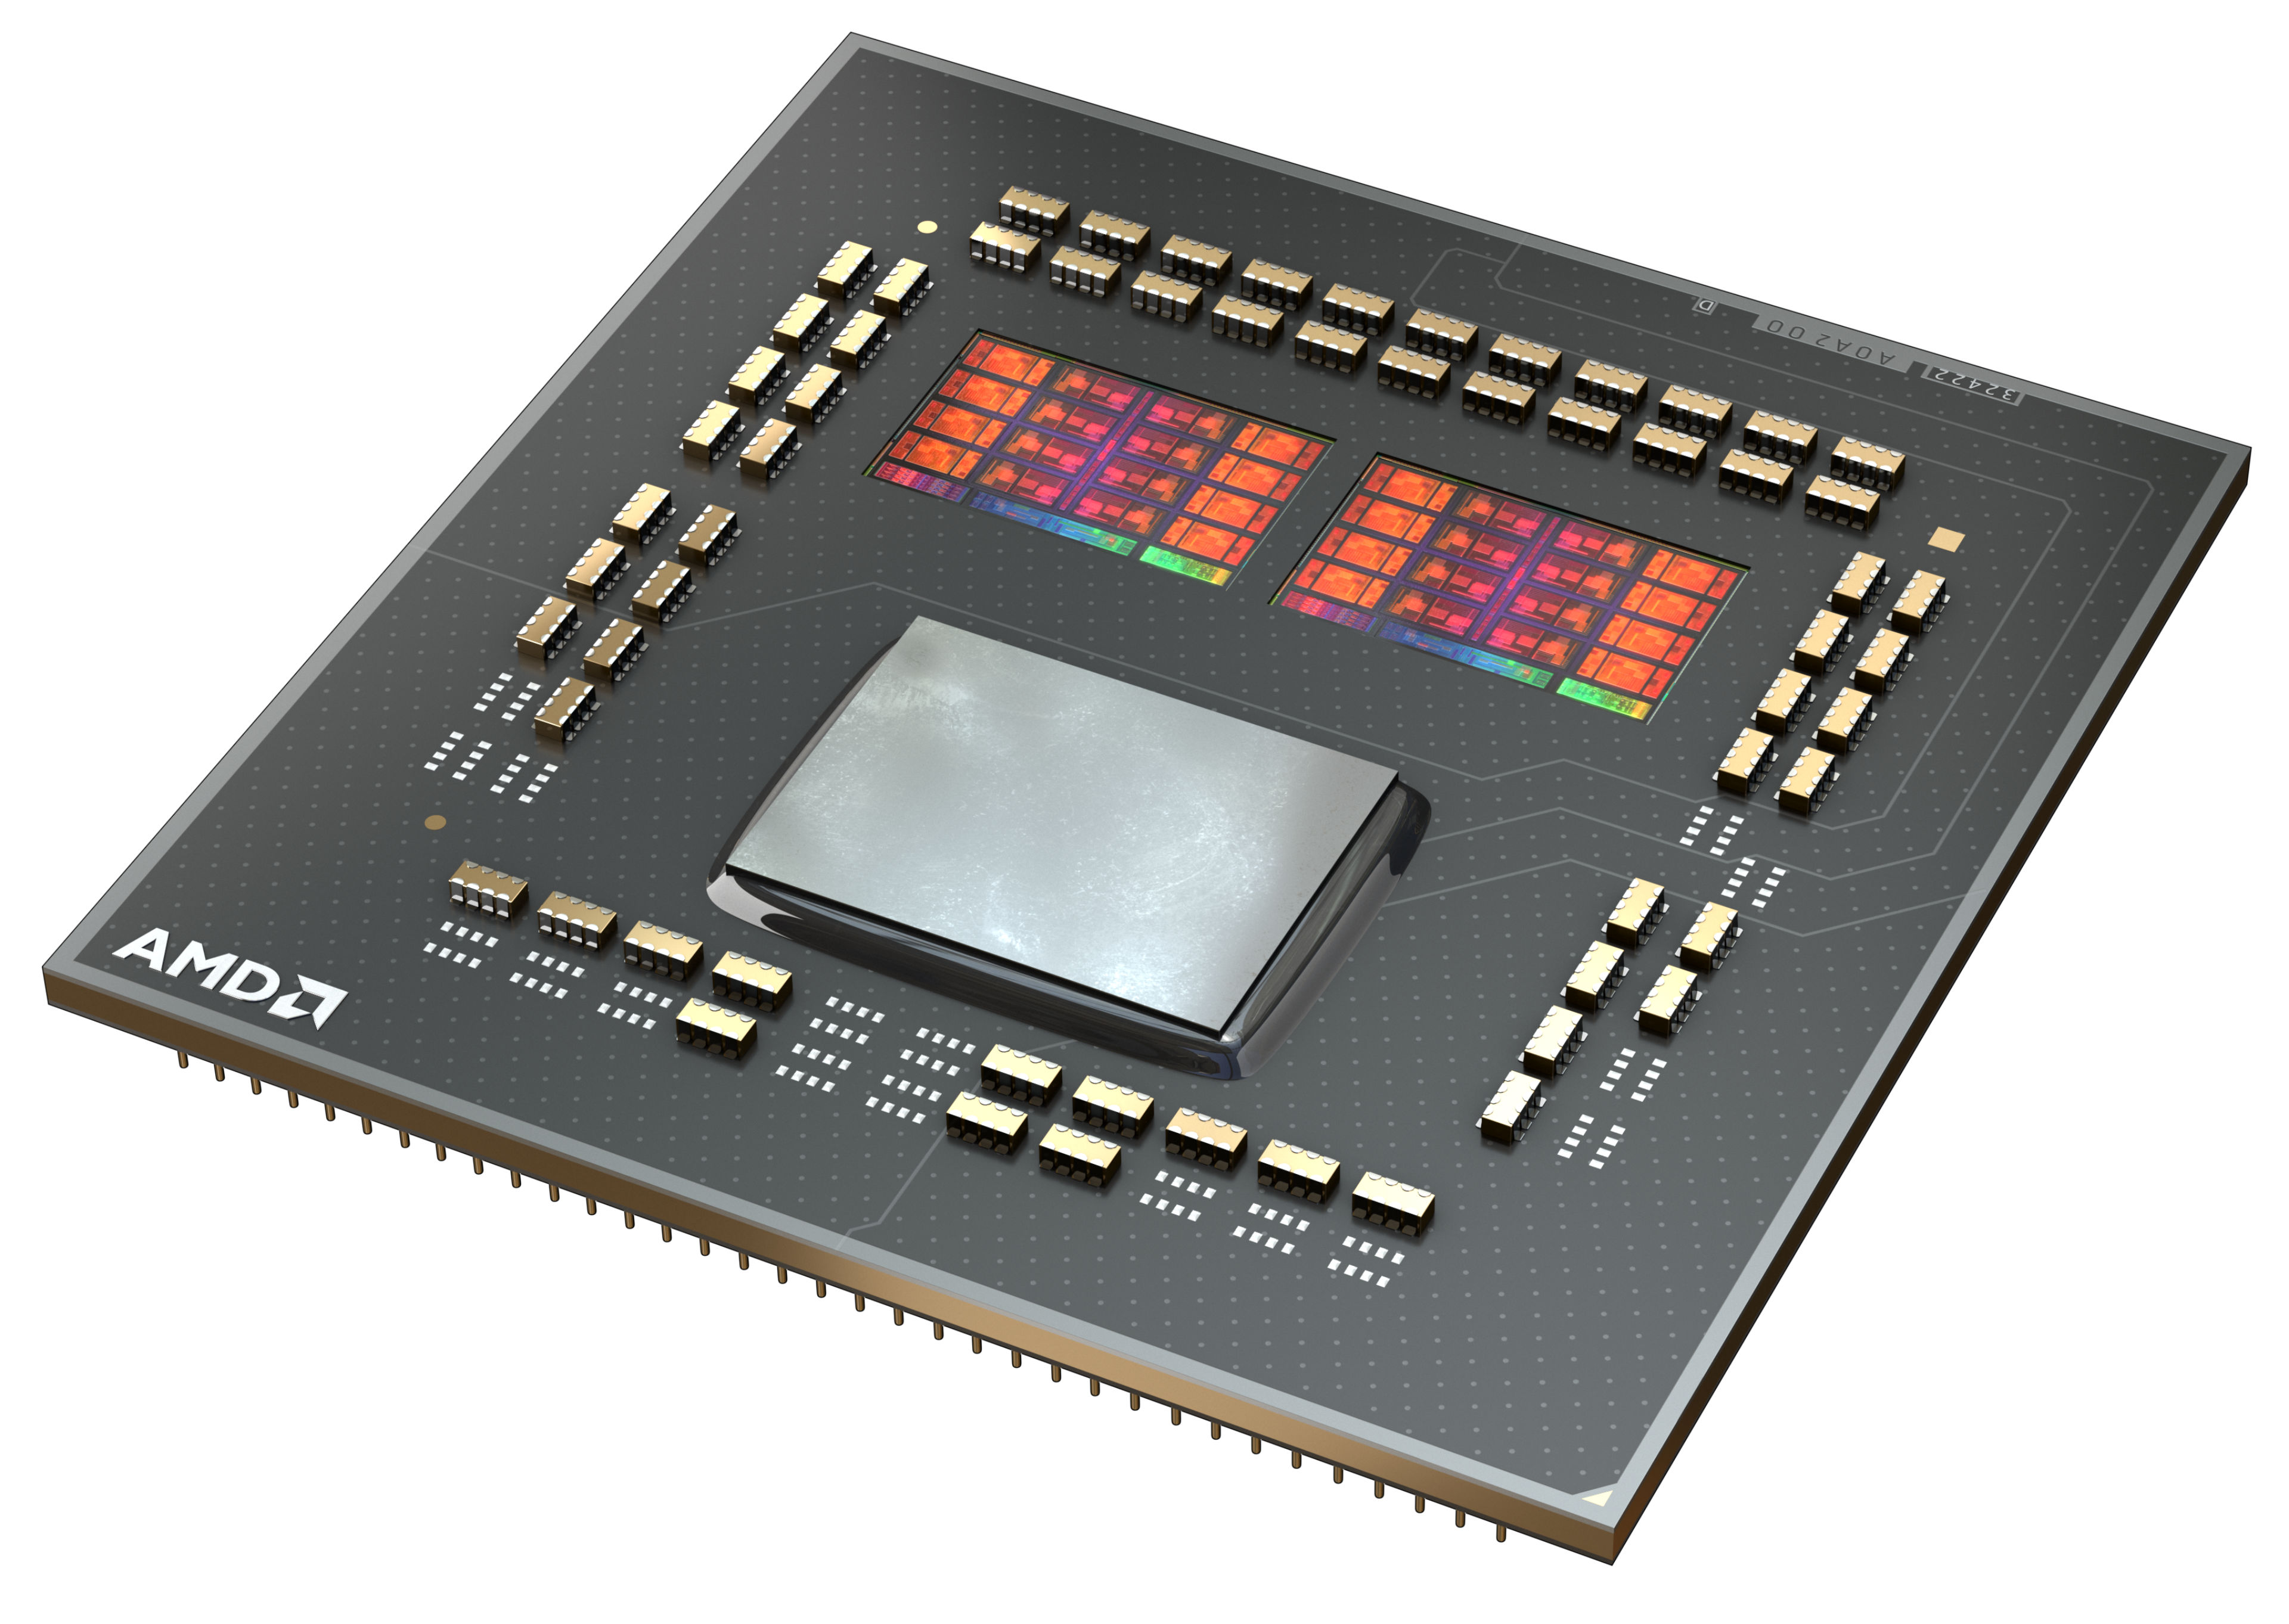
The AMD Ryzen 7 5800X is an 8-core desktop processor with Simultaneous Multithreading (SMT), which allows it to process 16 threads simultaneously. With its launch on 08.10.2020, it is the fastest 8-core processor from AMD. The second fastest 8-core processor will be the AMD Ryzen 7 3800XT, followed by the more economical AMD Ryzen 7 3700X, also with 8 cores and 16 threads.

The Ryzen 7 5800X clocks with a base clock of 3.8 GHz and reaches up to 4.7 GHz on one core in turbo mode. When all 8 cores are utilized, the AMD Ryzen 7 5800X, like the AMD Ryzen 9 5900X, achieves up to 4.5 GHz.

At first glance, the internal structure of the processor has not changed fundamentally. The CCX structure has changed somewhat compared to Zen2, because now a CCX consists of up to 8-CPU cores. So each individual core can access the complete L3 cache (32 MByte). Furthermore the CCX modules are connected to each other via the same I/O die, which we already know from Zen2. According to AMD, the Infinity-Fabric should now reach clock rates of up to 2Ghz, which in turn allows a RAM clock of 4.000 MHz without performance loss.

Performance

The average 5800X in our database is in the same league as the Core i9-10900K and also the Core i7-12700F, as far as multi-thread benchmark scores are concerned.

In games, AMD's Ryzen 7 5800X can convince with its significantly improved IPC and even put Intel in its place. With the AMD Ryzen 7 5800X, gamers are well prepared for the future as simultaneous streaming is no problem with the new Ryzen 7 5800X. Semi-professional content creators, who need even more power, can choose a Ryzen 9 5900X or the Ryzen 9 5950X on the shelf.

Power consumption

The Ryzen 7 has a default TDP (also known as the long-term power limit) of 105 W. This applies as long as the CPU runs at stock clock speeds.

Ryzen 7 5800X is built with TSMC's 7 nm process; as rumors have it, the I/O die is manufactured separately on the 12 nm Global Foundries process.

AMD Ryzen 9 9950X

► remove from comparison AMD Ryzen 9 9950X

The Ryzen 9 9950X is a very, very powerful desktop CPU of the Granite Ridge product family that features 16 Zen 5 cores (32 threads), PCIe 5 support and a basic iGPU. The Ryzen was launched in June 2024, with sales slated to start in August.

The 9950X shares some of the specifications with the mighty Zen 4-powered Ryzen 9 7950X, including (but not limited to) the 16 MB L2 cache, the 64 MB L3 cache, the 5.7 GHz top clock speed and the 170 W long-term TDP.

Architecture and Features

Just like Strix Point APUs, Granite Ridge processors make use of the new Zen 5 microarchitecture. However, there are no efficient cores here; all of 9950X's cores are full Zen 5 cores. Furthermore, Granite Ridge is a multi-die design with only the CPU cores produced using a fairly modern 4 nm TSMC process. Strix Point processors are a single-die design, from what we know.

According to AMD, Zen 5 delivers a 16% IPC improvement over Zen 4 thanks to branch prediction improvements and other refinements.

Elsewhere, the 9950X has an impressive 64 MB of L3 cache and 24 direct PCIe 5 lanes (3.93 GB/s throughput per lane) with up to 12 additional PCIe 4 lanes available depending on the motherboard. It supports DDR5 RAM as fast as 5,600 MT/s (up to 8,000 MT/s if overclocked).

The 9950X is unlocked for overclocking. Naturally, the AM5 socket CPU supports Windows 11, 64-bit Windows 10 as well as many Linux distros.

Performance

According to early July leaks, its multi-thread performance is about as good as that of the 24-core Core i9-14900K Intel CPU. We'll definitely update this section once we get our hands on a system powered by the 9950X.

Graphics

The Radeon 610M comes equipped with just 128 unified shaders running at up to 2,200 MHz. Its gaming performance is slated to be extremely low and only just sufficient for pre-2020 games in resolutions such as 1024x768.

Power consumption

The CPU cores are built with TSMC's N4P process for good, as of mid 2024, power efficiency. (Apple is the leader in this regard with the second-generation 3 nm process.)

The Ryzen 9's long-term TDP is 170 W. It'll probably consume up to 250 W when under heavy short-term loads. If overclocked, the power consumption figures will increase significantly.

ModelAMD Ryzen 7 5800XAMD Ryzen 9 9950X
CodenameVermeer (Zen 3)Granite Ridge
SeriesAMD Vermeer (Ryzen 5000)AMD Granite Ridge (Zen 5, AM5)
Series: Granite Ridge (Zen 5, AM5) Granite Ridge
AMD Ryzen 9 5950X compare3.4 - 4.9 GHz16 / 32 cores64 MB L3
AMD Ryzen 7 5800X « 3.8 - 4.7 GHz8 / 16 cores32 MB L3
AMD Ryzen 7 5700X compare3.4 - 4.6 GHz8 / 16 cores32 MB L3
AMD Ryzen 5 5600X compare3.7 - 4.6 GHz6 / 12 cores32 MB L3
AMD Ryzen 9 9950X3D compare4.3 - 5.7 GHz16 / 32 cores128 MB L3
AMD Ryzen 9 9950X « 4.3 - 5.7 GHz16 / 32 cores64 MB L3
AMD Ryzen 9 9900X compare4.4 - 5.6 GHz12 / 24 cores64 MB L3
AMD Ryzen 7 9700X compare3.8 - 5.5 GHz8 / 16 cores32 MB L3
AMD Ryzen 7 9800X3D compare4.7 - 5.2 GHz8 / 16 cores96 MB L3
AMD Ryzen 5 9600X compare3.9 - 5.4 GHz6 / 12 cores32 MB L3
Clock3800 - 4700 MHz4300 - 5700 MHz
L1 Cache512 KB1 MB
L2 Cache4 MB16 MB
L3 Cache32 MB64 MB
Cores / Threads8 / 1616 / 32
16 x 5.7 GHz AMD Zen 5
TDP105 Watt170 Watt
Technology7 nm4 nm & 6 nm
Die Size2 x 80.7 sq. mm; I/O = 125 mm2
max. Temp.90 °C95 °C
SocketAM4 (LGA1331)AM5
FeaturesDDR4-3200 RAM, PCIe 4, MMX (+), SSE, SSE2, SSE3, SSSE3, SSE4.1, SSE4.2, SSE4A, AES, AVX, AVX2, FMA3, SHADDR5-5600 RAM, PCIe 5 + PCIe 4, SMT, AES, AVX, AVX2, AVX512, FMA3, MMX (+), SHA, SSE, SSE2, SSE3, SSSE3, SSE4.1, SSE4.2, SSE4A
Architecturex86x86
$449 U.S.
Announced
Manufacturerwww.amd.comwww.amd.com
iGPUAMD Radeon 610M ( - 2200 MHz)

Benchmarks

Performance Rating - CB R15 + R20 + 7-Zip + X265 + Blender + 3DM11 CPU - R7 5800X
39.5 pt (66%)
Restrict / Search: Model: Max. age: years
Performance Rating - CB R15 + R20 + 7-Zip + X265 + Blender + 3DM11 CPU - Ryzen 9 9950X
51.5 pt (86%)
Restrict / Search: Model: Max. age: years
Cinebench 2024 - Cinebench 2024 CPU Single Core
136 Points (76%)
Cinebench 2024 - Cinebench 2024 CPU Multi Core
2254 Points (42%)
Cinebench R23 - Cinebench R23 Multi Core
min: 15241     avg: 15476     median: 15476 (14%)     max: 15711 Points
40924 Points (38%)
Cinebench R23 - Cinebench R23 Single Core
min: 1554     avg: 1575     median: 1574.5 (66%)     max: 1595 Points
2202 Points (93%)
Cinebench R20 - Cinebench R20 CPU (Single Core)
min: 624     avg: 625     median: 624.5 (68%)     max: 625 Points
871 Points (95%)
Cinebench R20 - Cinebench R20 CPU (Multi Core)
min: 6068     avg: 6075     median: 6074.5 (15%)     max: 6081 Points
15788 Points (38%)
Cinebench R15 - Cinebench R15 CPU Multi 64 Bit
min: 2601     avg: 2609     median: 2608.5 (16%)     max: 2616 Points
6335 Points (40%)
Cinebench R15 - Cinebench R15 CPU Single 64 Bit
min: 265     avg: 265.5     median: 265.5 (74%)     max: 266 Points
344 Points (95%)
Cinebench R11.5 - Cinebench R11.5 CPU Multi 64 Bit
29.3 Points (38%)
72.3 Points (94%)
Cinebench R11.5 - Cinebench R11.5 CPU Single 64 Bit
3.1 Points (73%)
min: 4.03     avg: 4     median: 4 (96%)     max: 4.21 Points
Cinebench R10 - Cinebench R10 Rend. Single (32bit)
6835 Points (41%)
9402 Points (57%)
Cinebench R10 - Cinebench R10 Rend. Multi (32bit)
45548 Points (33%)
71611 Points (52%)
Cinebench R10 - Cinebench R10 Rend. Multi (64bit)
83426 Points (53%)
Cinebench R10 - Cinebench R10 Rend. Single (64bit)
13039 Points (16%)
wPrime 2.10 - wPrime 2.0 1024m *
86.1 s (1%)
29.3 s (0%)
wPrime 2.10 - wPrime 2.0 32m *
3 s (1%)
2.1 s (0%)
WinRAR - WinRAR 4.0
15604 Points (25%)
13778 Points (22%)
7-Zip 18.03 - 7-Zip 18.03 Multi Thread 4 runs
min: 69921     avg: 72114     median: 72113.5 (41%)     max: 74306 MIPS
160423 MIPS (92%)
7-Zip 18.03 - 7-Zip 18.03 Single Thread 4 runs
min: 6843     avg: 6907     median: 6906.5 (81%)     max: 6970 MIPS
7852 MIPS (93%)
X264 HD Benchmark 4.0 - x264 Pass 2
152 fps (4%)
271 fps (7%)
X264 HD Benchmark 4.0 - x264 Pass 1
339 fps (9%)
392 fps (10%)
HWBOT x265 Benchmark v2.2 - HWBOT x265 4k Preset
min: 19.8     avg: 20.3     median: 20.3 (36%)     max: 20.8 fps
45.1 fps (79%)
TrueCrypt - TrueCrypt Serpent
1.3 GB/s (38%)
3.4 GB/s (100%)
TrueCrypt - TrueCrypt Twofish
2 GB/s (34%)
5.6 GB/s (97%)
TrueCrypt - TrueCrypt AES
15 GB/s (39%)
32.4 GB/s (84%)
Blender - Blender 3.3 Classroom CPU *
min: 331     avg: 336     median: 336 (4%)     max: 341 Seconds
118 Seconds (2%)
Blender - Blender 2.79 BMW27 CPU *
min: 196.8     avg: 196.9     median: 196.9 (1%)     max: 197 Seconds
77 Seconds (1%)
R Benchmark 2.5 - R Benchmark 2.5 *
min: 0.4509     avg: 0.5     median: 0.5 (10%)     max: 0.4545 sec
0.3 sec (7%)
3DMark 06 - CPU - 3DMark 06 - CPU
15873 Points (34%)
21838 Points (46%)
Super Pi mod 1.5 XS 1M - Super Pi mod 1.5 XS 1M *
7.3 s (2%)
7.3 s (2%)
Super Pi mod 1.5 XS 2M - Super Pi mod 1.5 XS 2M *
15.8 s (1%)
15.6 s (1%)
Super Pi Mod 1.5 XS 32M - Super Pi mod 1.5 XS 32M *
365.8 s (2%)
3DMark Vantage - 3DM Vant. Perf. CPU no Physx
86050 Points (66%)
3DMark 11 - 3DM11 Performance Physics
min: 23381     avg: 23704     median: 23703.5 (58%)     max: 24026 Points
38269 Points (94%)
3DMark - 3DMark Ice Storm Physics
94127 Points (76%)
3DMark - 3DMark Ice Storm Extreme Physics
94179 Points (76%)
3DMark - 3DMark Ice Storm Unlimited Physics
96702 Points (78%)
3DMark - 3DMark Cloud Gate Physics
22992 Points (58%)
3DMark - 3DMark Fire Strike Standard Physics
min: 29163     avg: 30051     median: 30050.5 (54%)     max: 30938 Points
49522 Points (88%)
3DMark - 3DMark Time Spy CPU
min: 11599     avg: 11652     median: 11652 (49%)     max: 11705 Points
16112 Points (68%)
Geekbench 6.4 - Geekbench 6.4 Single-Core
3408 Points (85%)
Geekbench 6.4 - Geekbench 6.4 Multi-Core
21383 Points (83%)
Geekbench 5.5 - Geekbench 5.1 - 5.5 64 Bit Single-Core
min: 1665     avg: 1683     median: 1683 (66%)     max: 1701 Points
2559 Points (100%)
Geekbench 5.5 - Geekbench 5.1 - 5.5 64 Bit Multi-Core
min: 10093     avg: 10724     median: 10723.5 (19%)     max: 11354 Points
23982 Points (43%)
Geekbench 5.0 - Geekbench 5.0 64 Bit Single-Core
1673 Points (7%)
2445 Points (11%)
Geekbench 5.0 - Geekbench 5.0 64 Bit Multi-Core
11246 Points (35%)
23387 Points (74%)
Geekbench 4.4 - Geekbench 4.1 - 4.4 64 Bit Single-Core
7333 Points (73%)
10016 Points (100%)
Geekbench 4.4 - Geekbench 4.1 - 4.4 64 Bit Multi-Core
44131 Points (44%)
100326 Points (100%)
Mozilla Kraken 1.1 - Kraken 1.1 Total Score *
min: 558     avg: 576     median: 575.5 (1%)     max: 593 ms
377 ms (0%)
WebXPRT 4 - WebXPRT 4 Score
245 Points (67%)
357 Points (98%)
WebXPRT 3 - WebXPRT 3 Score
min: 296     avg: 301.5     median: 301.5 (54%)     max: 307 Points
409 Points (73%)
CrossMark - CrossMark Overall
1541 Points (58%)
2451 Points (92%)
Power Consumption - Prime95 Power Consumption - external Monitor *
242.3 Watt (42%)
319 Watt (55%)
Power Consumption - Cinebench R15 Multi Power Consumption - external Monitor *
220.7 Watt (40%)
313 Watt (57%)
Power Consumption - Idle Power Consumption - external Monitor *
100 Watt (66%)
Power Consumption - Power Efficiency - Cinebench R15 Multi external Monitor
11.9 Points per Watt (9%)
20.2 Points per Watt (15%)

Average Benchmarks AMD Ryzen 7 5800X → 100% n=40

Average Benchmarks AMD Ryzen 9 9950X → 179% n=40

- Range of benchmark values for this graphics card
red legend - Average benchmark values for this graphics card
* Smaller numbers mean a higher performance
1 This benchmark is not used for the average calculation

Add one or more devices and compare

In the following list you can select (and also search for) devices that should be added to the comparison. You can select more than one device.

restrict list:
v1.33
log 12. 05:14:14

#0 ran 0s before starting gpusingle class +0s ... 0s

#1 checking url part for id 12783 +0s ... 0s

#2 checking url part for id 17637 +0s ... 0s

#3 redirected to Ajax server, took 1757646854s time from redirect:0 +0s ... 0s

#4 did not recreate cache, as it is less than 5 days old! Created at Wed, 10 Sep 2025 11:38:25 +0200 +0s ... 0s

#5 composed specs +0.006s ... 0.006s

#6 did output specs +0s ... 0.006s

#7 getting avg benchmarks for device 12783 +0.004s ... 0.01s

#8 got single benchmarks 12783 +0.007s ... 0.017s

#9 getting avg benchmarks for device 17637 +0.004s ... 0.02s

#10 got single benchmarks 17637 +0.004s ... 0.024s

#11 got avg benchmarks for devices +0s ... 0.024s

#12 min, max, avg, median took s +0.042s ... 0.067s

#13 return log +0.001s ... 0.068s

Please share our article, every link counts!
Mail Logo
> Expert Reviews and News on Laptops, Smartphones and Tech Innovations > Benchmarks / Tech > Processor Comparison - Head 2 Head
Redaktion, 2017-09- 8 (Update: 2023-07- 1)