Notebookcheck Logo

AMD Ryzen 5 6600U vs Intel Core i9-11900K

AMD Ryzen 5 6600U

► remove from comparison AMD R5 6600U

The AMD Ryzen 5 6600U is a processor for thin and light laptops based of the Rembrandt generation. The Ryzen packs six of the eight cores based on the Zen 3+ microarchitecture. They are clocked at 2.9 (guaranteed base clock) to 4.5 GHz (Turbo) and support SMT / Hyperthreading (12 threads). The chip is manufactured on the modern 6 nm process at TSMC. Compared to the similar R5 6600H, the 6600U offers a lower base clock speed and a lower TDP.

In the 6000 series, AMD finally switched to the current RDNA 2 graphics architecture for the iGPU. The 6600U only offers the small Radeon 660M with 6 of the 12 CUs enabled and 1.9 GHz max. clock rate.

The new Zen 3+ is a refresh of the Zen 3 architecture and should not offer a lot of changes. The chip itself however, offers a lot of new features, like support for USB 4 (40 Gbps), PCI-E Gen 4, DDR5-4800MT/s or LPDDR5-6400MT/s, WiFi 6E, Bluetooth LE 5.2, DisplayPort 2, and AV1 decode.

Performance

The average 6600U in our database matches the Ryzen 7 5800U in multi-thread performance, making this Ryzen 5 series chip a great CPU for most activities as of mid 2023.

Your mileage may vary depending on how competent the cooling solution of your system is and how high the CPU power limits are.

Power consumption

This Ryzen 5 series chip has a default TDP, also known as the long-term power limit, of 15 W to 28 W, the expectation being that laptop makers will go for a higher value in exchange for higher performance. Either way, that's too much to allow for passively cooled designs.

The R5 6600U is manufactured on TSMC's 6 nm manufacturing process for good, as of mid 2023, energy efficiency.

Intel Core i9-11900K

► remove from comparison Intel i9-11900K

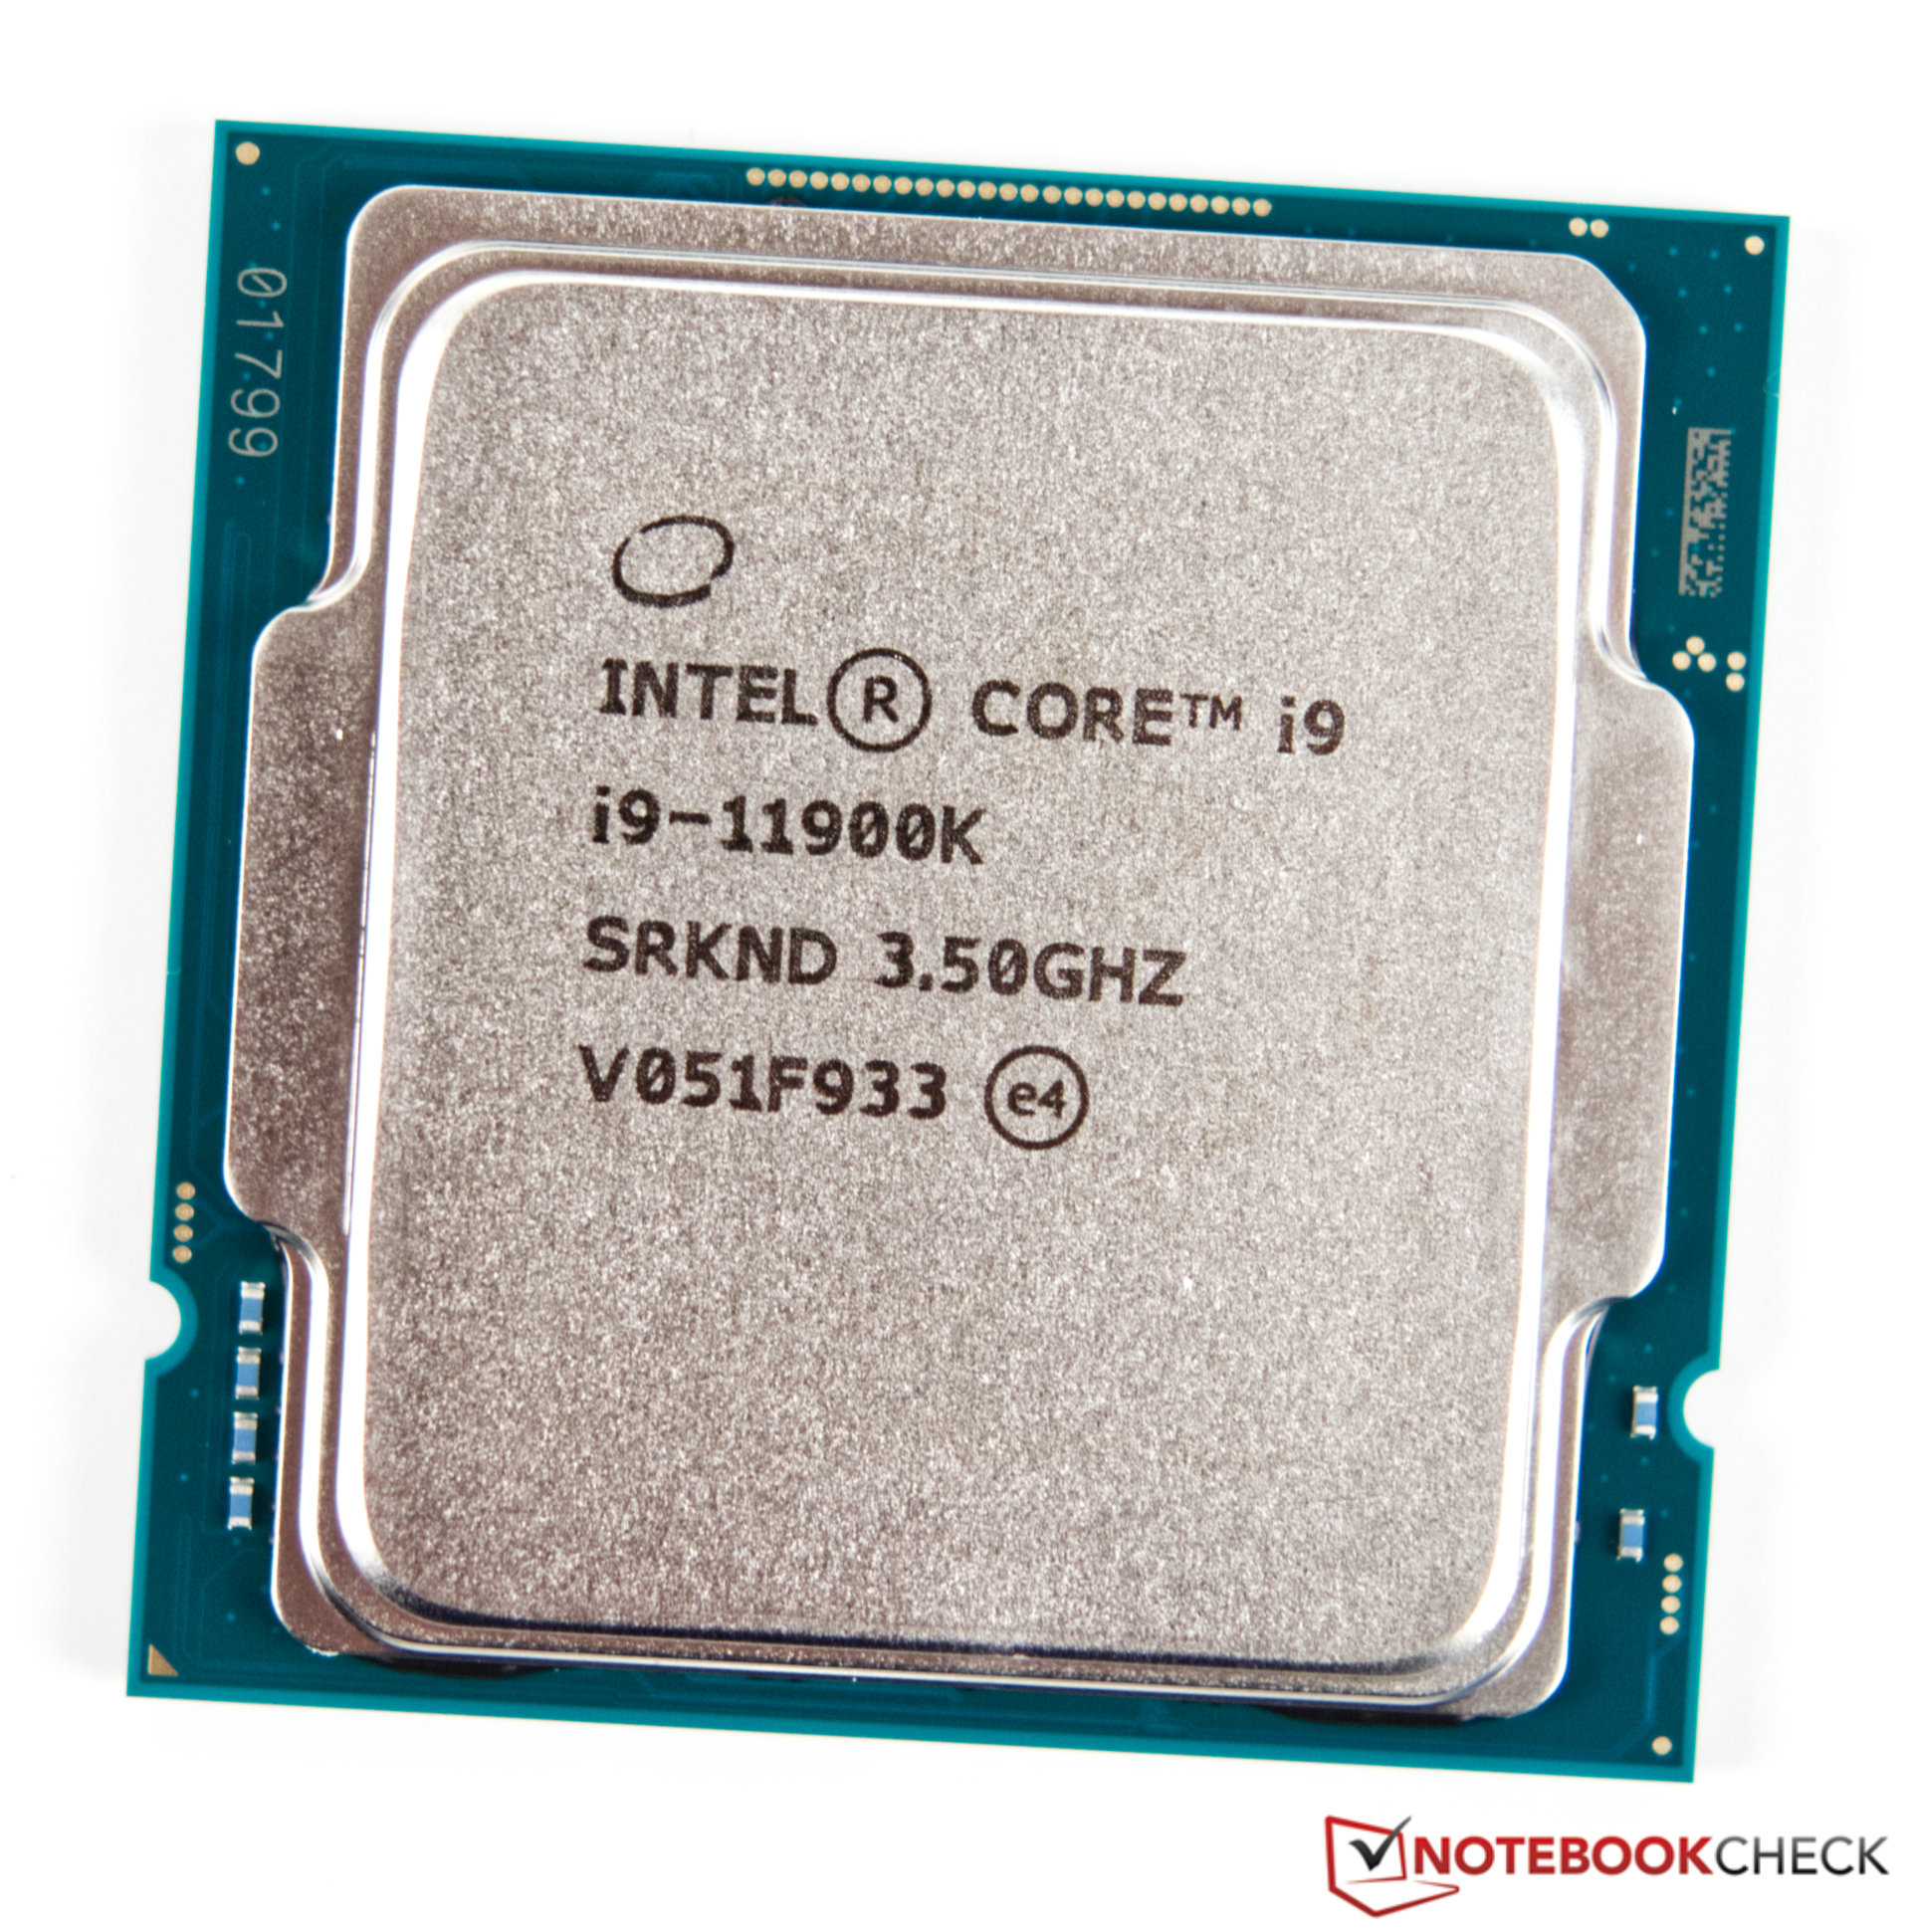
The Intel Core i9-11900K is a high-end desktop CPU based on the Rocket Lake architecture. The CPU offers 8 cores and 16 threads clocked at 3.5 - 5.3 GHz (Turbo Boost 3.0 / TVB). With Turbo Boost 2.0, 5.1 GHz can be reached with a single thread. Using all cores, the CPU can clock up to 4.8 GHz. Adaptive Boost enables even higher multi-core frequencies (5.1 GHz all core Turbo) but uses a lot more power.

The TDP is rated at 125 Watt (PL1, power limit sustained load) but the PL2 is set to around 250 Watt for short term boosts (up to 56 seconds).

The Sunny Cove processor cores (known from the Ice Lake mobile CPUs) offer larger caches and an improved IPC (up to 19%). Furthermore, the chip also includes (partly) integrated WiFi 6E and Thunderbolt 4. The platform supports PCIe 4.0 and Intel DL Boost for AI acceleration.

The faster Rocket Lake-S CPUs also integrate a new Intel UHD Graphics 750 that is based on the current Intel Xe architecture (e.g. mobile Tiger Lake) and offers 32 EUs. In the 11900K, the GPU is clocked from 350 - 1300 MHz.

Performance

The average 11900K in our database is in the same league as the Ryzen 7 5800X3D, as far as multi-thread benchmark scores are concerned. Which is an impressive result, as of mid 2022, and good enough for any task imaginable including content creation and professional gaming.

Power consumption

This Core i9 has a 125 W TDP, also known as the long-term power limit. Intel lets PC manufacturers reduce that value somewhat if required, 95 W being the lower limit, which would result in lower clock speeds and lower performance. The reality is, an 11900K can be much more power hungry than either of the two numbers imply simply because of its sheer might but also because it is manufactured on an old 14 nm Intel process that makes for lower-than-average, as of mid-2022, energy efficiency.

ModelAMD Ryzen 5 6600UIntel Core i9-11900K
CodenameRembrandt-U (Zen 3+)Rocket Lake
SeriesAMD Rembrandt (Zen 3+)Intel Rocket Lake
Series: Rocket Lake Rocket Lake
AMD Ryzen 7 6800U compare2.7 - 4.7 GHz8 / 16 cores16 MB L3
AMD Ryzen 5 6600U « 2.9 - 4.5 GHz6 / 12 cores16 MB L3
Intel Core i9-11900K « 3.5 - 5.3 GHz8 / 16 cores16 MB L3
Intel Core i7-11700K compare3.6 - 5 GHz8 / 16 cores16 MB L3
Intel Core i7-11700 compare2.5 - 4.9 GHz8 / 16 cores16 MB L3
Intel Core i5-11600K compare3.9 - 4.9 GHz6 / 12 cores12 MB L3
Intel Core i5-11400F compare2.6 - 4.4 GHz6 / 12 cores12 MB L3
Intel Core i5-11400T compare1.3 - 3.7 GHz6 / 12 cores12 MB L3
Clock2900 - 4500 MHz3500 - 5300 MHz
L1 Cache384 KB640 KB
L2 Cache3 MB4 MB
L3 Cache16 MB16 MB
Cores / Threads6 / 128 / 16
TDP28 Watt125 Watt
Technology6 nm14 nm
max. Temp.95 °C100 °C
SocketFP7/FP7r2LGA1200
FeaturesDDR5-4800/LPDDR5-6400 RAM (incl. ECC), PCIe 4, MMX, SSE, SSE2, SSE3, SSSE3, SSE4A, SSE4.1, SSE4.2, AVX, AVX2, BMI2, ABM, FMA, ADX, SMEP, SMAP, SMT, CPB, AES-NI, RDRAND, RDSEED, SHA, SMEDDR4-3200 RAM, PCIe 4, 8 GT/s bus, DL Boost, GNA, vPro, MMX, SSE, SSE2, SSE3, SSSE3, SSE4.1, SSE4.2, AES, AVX, AVX2, AVX512F, FMA3, SHA
iGPUAMD Radeon 660M ( - 1900 MHz)Intel UHD Graphics Xe 750 32EUs (Rocket Lake) (350 - 1300 MHz)
Architecturex86x86
Announced
Manufacturerwww.amd.comark.intel.com

Benchmarks

Performance Rating - CB R15 + R20 + 7-Zip + X265 + Blender + 3DM11 CPU - R5 6600U
34.3 pt (57%)
Restrict / Search: Model: Max. age: years
Performance Rating - CB R15 + R20 + 7-Zip + X265 + Blender + 3DM11 CPU - i9-11900K
38.1 pt (63%)
Restrict / Search: Model: Max. age: years
Cinebench 2024 - Cinebench 2024 CPU Single Core
80 Points (45%)
98 Points (55%)
Cinebench 2024 - Cinebench 2024 CPU Multi Core
408 Points (8%)
698 Points (13%)
Cinebench R23 - Cinebench R23 Multi Core
min: 8491     avg: 9160     median: 9159.5 (9%)     max: 9828 Points
min: 13825     avg: 14669     median: 14747 (14%)     max: 15519 Points
Cinebench R23 - Cinebench R23 Single Core
min: 1420     avg: 1457     median: 1456.5 (61%)     max: 1493 Points
min: 1604     avg: 1640     median: 1636 (69%)     max: 1693 Points
Cinebench R20 - Cinebench R20 CPU (Single Core)
min: 558     avg: 570     median: 570 (62%)     max: 582 Points
min: 619     avg: 633     median: 633 (69%)     max: 647 Points
Cinebench R20 - Cinebench R20 CPU (Multi Core)
min: 3419     avg: 3623     median: 3623 (9%)     max: 3827 Points
min: 5055     avg: 5499     median: 5306 (13%)     max: 5997 Points
Cinebench R15 - Cinebench R15 CPU Multi 64 Bit
min: 1361     avg: 1493     median: 1493 (9%)     max: 1625 Points
min: 2238     avg: 2358     median: 2379 (15%)     max: 2436 Points
Cinebench R15 - Cinebench R15 CPU Single 64 Bit
min: 227     avg: 233     median: 233 (65%)     max: 239 Points
min: 254     avg: 256.5     median: 255 (71%)     max: 262 Points
Cinebench R11.5 - Cinebench R11.5 CPU Multi 64 Bit
17.2 Points (22%)
26.8 Points (35%)
Cinebench R11.5 - Cinebench R11.5 CPU Single 64 Bit
2.7 Points (65%)
3.1 Points (74%)
Cinebench R10 - Cinebench R10 Rend. Single (32bit)
6242 Points (38%)
10545 Points (64%)
Cinebench R10 - Cinebench R10 Rend. Multi (32bit)
32097 Points (23%)
62024 Points (45%)
Cinebench R10 - Cinebench R10 Rend. Multi (64bit)
54792 Points (35%)
80613 Points (51%)
Cinebench R10 - Cinebench R10 Rend. Single (64bit)
11685 Points (14%)
14149 Points (17%)
wPrime 2.10 - wPrime 2.0 1024m *
146.6 s (2%)
77.9 s (1%)
wPrime 2.10 - wPrime 2.0 32m *
4.7 s (1%)
4 s (1%)
WinRAR - WinRAR 4.0
6937 Points (11%)
9030 Points (14%)
7-Zip 18.03 - 7-Zip 18.03 Multi Thread 4 runs
44320 MIPS (25%)
min: 54125     avg: 59047     median: 59658.5 (34%)     max: 62746 MIPS
7-Zip 18.03 - 7-Zip 18.03 Single Thread 4 runs
5486 MIPS (65%)
min: 6174     avg: 6380     median: 6347 (75%)     max: 6652 MIPS
X264 HD Benchmark 4.0 - x264 Pass 2
71.5 fps (24%)
137 fps (46%)
X264 HD Benchmark 4.0 - x264 Pass 1
212 fps (49%)
309.5 fps (71%)
HWBOT x265 Benchmark v2.2 - HWBOT x265 4k Preset
11.7 fps (21%)
min: 16.6     avg: 18.2     median: 18.2 (32%)     max: 19.8 fps
TrueCrypt - TrueCrypt Serpent
0.9 GB/s (25%)
1.2 GB/s (35%)
TrueCrypt - TrueCrypt Twofish
1.3 GB/s (22%)
1.9 GB/s (33%)
TrueCrypt - TrueCrypt AES
9.3 GB/s (24%)
13 GB/s (34%)
Blender - Blender 3.3 Classroom CPU *
min: 323     avg: 488.5     median: 488.5 (6%)     max: 654 Seconds
428 Seconds (5%)
Blender - Blender 2.79 BMW27 CPU *
415 Seconds (3%)
min: 190.3     avg: 210.8     median: 211.9 (1%)     max: 229 Seconds
R Benchmark 2.5 - R Benchmark 2.5 *
0.5 sec (11%)
min: 0.4733     avg: 0.5     median: 0.5 (11%)     max: 0.4981 sec
3DMark 06 - CPU - 3DMark 06 - CPU
min: 9435     avg: 9908     median: 9908 (21%)     max: 10381 Points
Super Pi mod 1.5 XS 1M - Super Pi mod 1.5 XS 1M *
8.1 s (2%)
6.3 s (1%)
Super Pi mod 1.5 XS 2M - Super Pi mod 1.5 XS 2M *
19.9 s (1%)
13.7 s (1%)
Super Pi Mod 1.5 XS 32M - Super Pi mod 1.5 XS 32M *
692 s (3%)
331.4 s (1%)
3DMark Vantage - 3DM Vant. Perf. CPU no Physx
min: 38061     avg: 41628     median: 41627.5 (32%)     max: 45194 Points
3DMark 11 - 3DM11 Performance Physics
min: 11630     avg: 12171     median: 12171 (30%)     max: 12712 Points
min: 20149     avg: 20662     median: 20662 (51%)     max: 21175 Points
3DMark - 3DMark Ice Storm Physics
min: 65694     avg: 66719     median: 66719 (54%)     max: 67744 Points
min: 74965     avg: 79326     median: 79325.5 (64%)     max: 83686 Points
3DMark - 3DMark Ice Storm Extreme Physics
min: 66512     avg: 67032     median: 67032 (54%)     max: 67552 Points
75316 Points (61%)
3DMark - 3DMark Ice Storm Unlimited Physics
min: 66942     avg: 70708     median: 70708 (57%)     max: 74474 Points
85348 Points (69%)
3DMark - 3DMark Cloud Gate Physics
min: 10347     avg: 10513     median: 10513 (27%)     max: 10679 Points
min: 18242     avg: 19567     median: 20094 (51%)     max: 20364 Points
3DMark - 3DMark Fire Strike Standard Physics
min: 15902     avg: 15918     median: 15918 (28%)     max: 15934 Points
min: 26699     avg: 27967     median: 28121 (50%)     max: 28927 Points
3DMark - 3DMark Time Spy CPU
min: 5114     avg: 5340     median: 5339.5 (23%)     max: 5565 Points
min: 11012     avg: 12563     median: 12902.5 (54%)     max: 13433 Points
Geekbench 6.4 - Geekbench 6.4 Single-Core
1977 Points (49%)
Geekbench 6.4 - Geekbench 6.4 Multi-Core
8310 Points (32%)
Geekbench 6.0 - Geekbench 6.0 Single-Core
1923 Points (61%)
Geekbench 6.0 - Geekbench 6.0 Multi-Core
7790 Points (32%)
Geekbench 5.5 - Geekbench 5.1 - 5.5 64 Bit Single-Core
min: 1445     avg: 1477     median: 1483 (58%)     max: 1504 Points
min: 1748     avg: 1796     median: 1787.5 (70%)     max: 1885 Points
Geekbench 5.5 - Geekbench 5.1 - 5.5 64 Bit Multi-Core
min: 7034     avg: 7407     median: 7529 (13%)     max: 7658 Points
min: 9547     avg: 10328     median: 10483 (19%)     max: 11035 Points
Geekbench 5.0 - Geekbench 5.0 64 Bit Single-Core
min: 1405     avg: 1481     median: 1481 (6%)     max: 1557 Points
1863 Points (8%)
Geekbench 5.0 - Geekbench 5.0 64 Bit Multi-Core
min: 6956     avg: 8603     median: 8602.5 (27%)     max: 10249 Points
11008 Points (35%)
Geekbench 4.4 - Geekbench 4.1 - 4.4 64 Bit Single-Core
min: 6067     avg: 6383     median: 6382.5 (64%)     max: 6698 Points
7976 Points (80%)
Geekbench 4.4 - Geekbench 4.1 - 4.4 64 Bit Multi-Core
min: 26824     avg: 33338     median: 33338 (33%)     max: 39852 Points
42329 Points (42%)
Geekbench 3 - Geekbench 3 64 Bit Multi-Core
7529 Points (12%)
Geekbench 3 - Geekbench 3 64 Bit Single-Core
1483 Points (22%)
Mozilla Kraken 1.1 - Kraken 1.1 Total Score *
619 ms (1%)
min: 544     avg: 566     median: 569.5 (1%)     max: 581 ms
WebXPRT 4 - WebXPRT 4 Score
217 Points (60%)
min: 244     avg: 247     median: 247 (68%)     max: 250 Points
WebXPRT 3 - WebXPRT 3 Score
274 Points (49%)
min: 217     avg: 268.5     median: 283.5 (51%)     max: 290 Points
CrossMark - CrossMark Overall
1517 Points (57%)
Power Consumption - Prime95 Power Consumption - external Monitor *
44.6 Watt (8%)
min: 197     avg: 235.6     median: 221.5 (38%)     max: 302.2 Watt
Power Consumption - Cinebench R15 Multi Power Consumption - external Monitor *
41.9 Watt (8%)
min: 243     avg: 274.3     median: 259.2 (47%)     max: 336 Watt
Power Consumption - Idle Power Consumption - external Monitor *
8.8 Watt (6%)
Power Consumption - Power Efficiency - Cinebench R15 Multi external Monitor
min: 7.03     avg: 8.4     median: 8.6 (6%)     max: 9.39 Points per Watt

Average Benchmarks AMD Ryzen 5 6600U → 100% n=47

Average Benchmarks Intel Core i9-11900K → 143% n=47

- Range of benchmark values for this graphics card
red legend - Average benchmark values for this graphics card
* Smaller numbers mean a higher performance
1 This benchmark is not used for the average calculation

Add one or more devices and compare

In the following list you can select (and also search for) devices that should be added to the comparison. You can select more than one device.

restrict list:
v1.33
log 23. 15:45:53

#0 ran 0s before starting gpusingle class +0s ... 0s

#1 checking url part for id 14090 +0s ... 0s

#2 checking url part for id 13161 +0s ... 0s

#3 redirected to Ajax server, took 1755956753s time from redirect:0 +0s ... 0s

#4 did not recreate cache, as it is less than 5 days old! Created at Fri, 22 Aug 2025 05:18:47 +0200 +0s ... 0s

#5 composed specs +0.005s ... 0.005s

#6 did output specs +0s ... 0.005s

#7 getting avg benchmarks for device 14090 +0.004s ... 0.009s

#8 got single benchmarks 14090 +0.007s ... 0.016s

#9 getting avg benchmarks for device 13161 +0.004s ... 0.02s

#10 got single benchmarks 13161 +0.008s ... 0.028s

#11 got avg benchmarks for devices +0s ... 0.028s

#12 min, max, avg, median took s +0.056s ... 0.084s

#13 return log +0.001s ... 0.085s

Please share our article, every link counts!
Mail Logo
> Expert Reviews and News on Laptops, Smartphones and Tech Innovations > Benchmarks / Tech > Processor Comparison - Head 2 Head
Redaktion, 2017-09- 8 (Update: 2023-07- 1)