Apple M1 8-Core GPU vs NVIDIA T550 Laptop GPU vs Apple M1 Pro 16-Core GPU
Apple M1 8-Core GPU ► remove from comparison
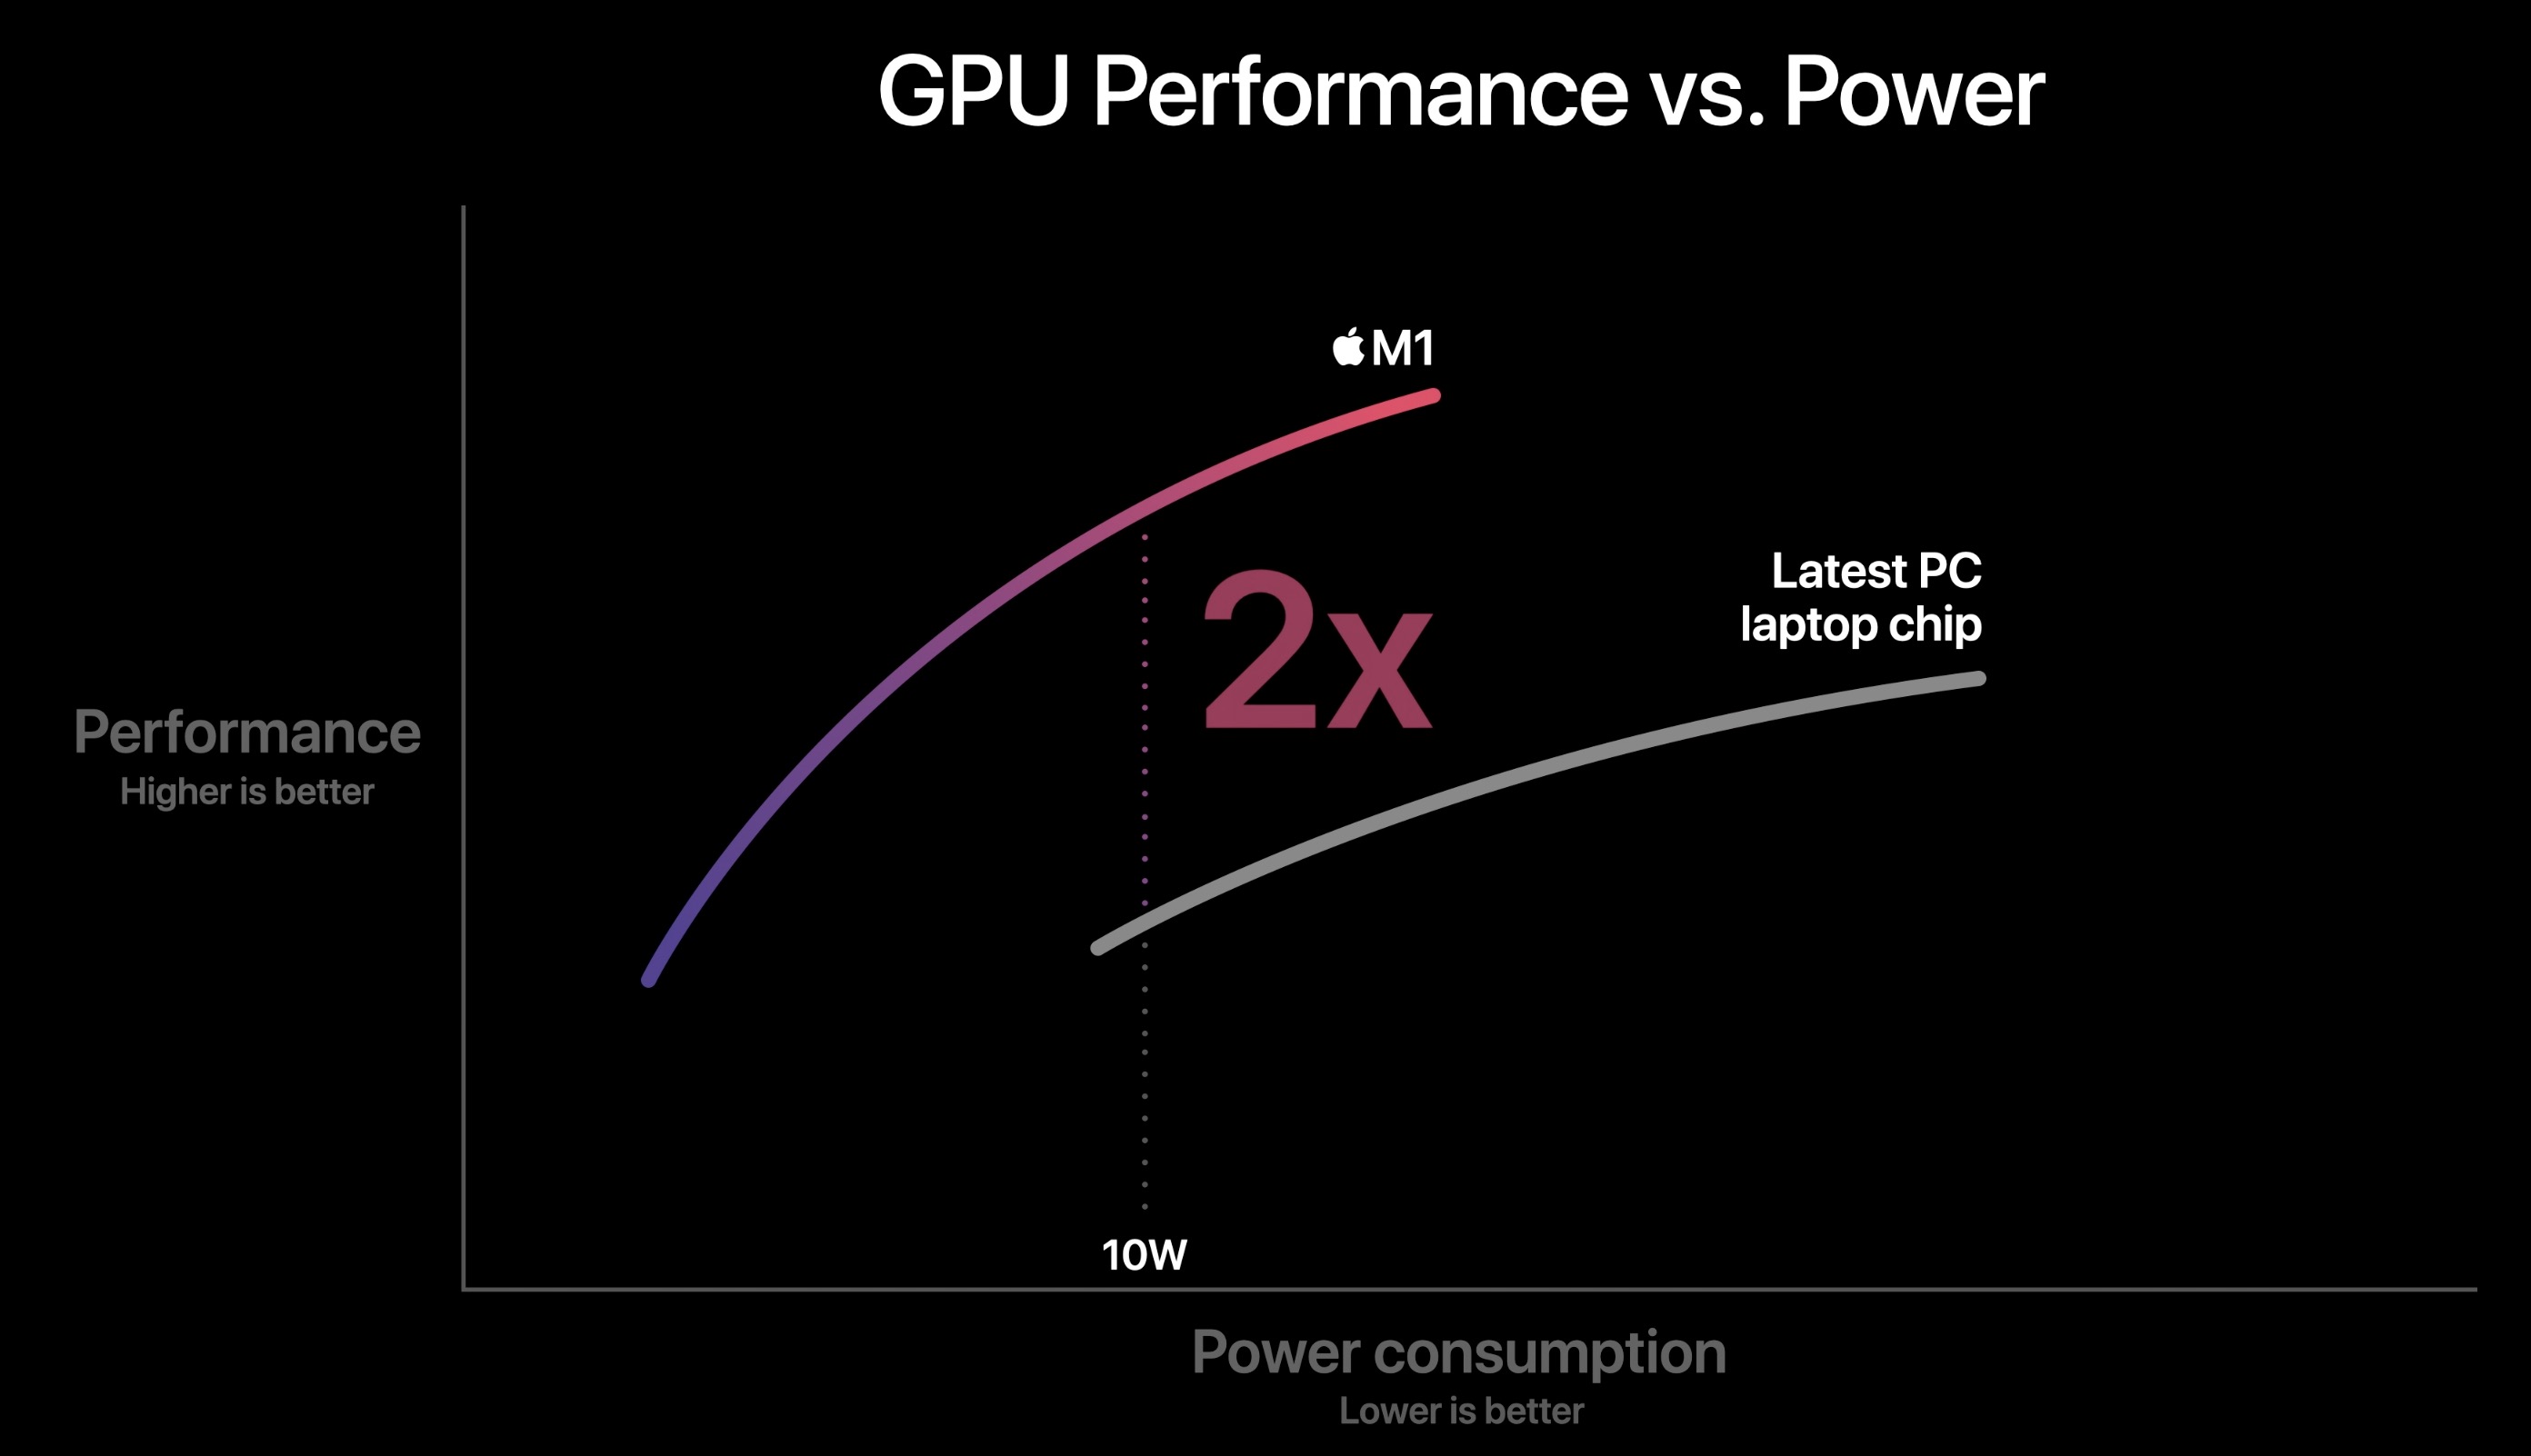
The Apple M1 GPU is an integrated graphics card offering 8 cores (1 deactivated core in the entry MacBook Air) designed by Apple and integrated in the Apple M1 SoC . According to Apple it is faster and more energy efficient as competing products (like the Tiger Lake Xe GPU ). The peak performance of the high end variant is 2.6 teraflops and thanks to the unified memory architecture it should have fast access to the RAM.
The Apple M1 is manufactured in the modern 5nm process at TSMC and should offer an excellent energy efficiency. According to internal tools, the M1 GPU uses under load approximately 10 Watt (11.5 Watt package power including the RAM).
NVIDIA T550 Laptop GPU ► remove from comparison
The Nvidia T550 Laptop GPU (formerly known as Quadro T550 Mobile) for laptops is a professional mobile graphics card that is based on the Turing architecture (TU117 chip). It is based on the consumer GeForce MX550 and features the same 1024 cores and a 64 Bit memory bus. The card offers 4 GB GDDR6 with a maximum bandwidth of 112 GB/s and no dedicated display outputs (iGPU display outputs used via Optimus). The chip is manufactured in 12nm FinFET at TSMC.
The professional GPUs offer certified drivers , which are optimized for stability and performance in professional applications (CAD, DCC, medical, prospection, and visualizing applications). The performance in these areas is therefore much better compared to corresponding consumer GPUs.
The Turing generation did not only introduce raytracing for the RTX cards, but also optimized the architecture of the cores and caches. According to Nvidia the CUDA cores offer now a concurrent execution of floating point and integer operations for increased performance in compute-heavy workloads of modern games. Furthermore, the caches were reworked (new unified memory architecture with twice the cache compared to Pascal). This leads to up to 50% more instructions per clock and a 40% more power efficient usage compared to Pascal. In contrary to the faster Quadro RTX cards, the T550 does not feature raytracing and Tensor cores.
Apple M1 Pro 16-Core GPU ► remove from comparison
The Apple M1 Pro 16-Core-GPU is an integrated graphics card by Apple offering all 16 cores in the M1 Pro Chip . The 2048 ALUs offer a theoretical performance of up to 5.3 Teraflops.
The graphics card has no dedicated graphics memory but can use the fast LPDDR5-6400 unified memory with a 256 bit bus (up to 200 GBit/s).
The GPU clocks between 389 and 1296 MHz and offers no short term boost (389, 486, 648, 778, 972, 1296 MHz steps according to Powermetrics). The GPU is intended to use Apple Metal 2 API and could still be based on the older PowerVR architectures (last used in the Apple A10).
The Apple M1 Pro is manufactured in the modern 5nm process at TSMC and offers an excellent energy efficiency. According to the internal sensors, the GPU uses 15 Watt (Valley) to 20.6 W (Eve Online) under full load.
Apple M1 8-Core GPU NVIDIA T550 Laptop GPU Apple M1 Pro 16-Core GPU Apple M1 Series Pipelines 8 - unified 1024 - unified 16 - unified Core Speed 1278 MHz 1065 - 1665 (Boost) MHz 1296 MHz Theoretical Performance 2.6 TFLOPS FP32 7.2 TFLOPS FP16, 3.7 TFLOPS FP32 Memory Type LPDDR4X-4266 GDDR5, GDDR6 LPDDR5-6400 Shared Memory no no no Power Consumption 10 Watt 25 Watt (20 - 60 Watt TGP) 10 Watt technology 5 nm 12 nm 5 nm Date of Announcement 10.11.2020 27.05.2022 10.11.2020 Codename TU117 Architecture Turing Memory Speed 12000 effective = 1500 MHz Memory Bus Width 64 Bit Max. Amount of Memory 4 GB Memory Bandwidth 112 GB/s API DirectX 12_1, Shader 6.7, OpenGL 4.6 Notebook Size medium sized Information Optimus only Link to Manufacturer Page nvdam.widen.net
CPU in M1 8-Core GPU GPU Base Speed GPU Boost / Turbo Apple M1 8 x 2064 MHz ? MHz ? MHz
CPU in M1 Pro 16-Core GPU GPU Base Speed GPU Boost / Turbo Apple M1 Pro 10 x 2064 MHz ? MHz ? MHz
Benchmarks 3DMark - 3DMark Time Spy Score
min: 2031 avg: 2187 median: 2066 (6%) max: 2465 Points
GPU TDP 20 W TDP 30 W 83% 100%
3DMark - 3DMark Time Spy Graphics
min: 1882 avg: 2021 median: 1928 (5%) max: 2252 Points
GPU TDP 20 W TDP 30 W 85% 100%
3DMark - 3DMark Ice Storm Unlimited Graphics
280200 Points (32%)
Model CPU GPU RAM Value Apple Mac Mini Late 2020 (M1, 16GB) M1 M1 8-Core GPU 16 GB 280200
3DMark - 3DMark Cloud Gate Score
min: 17399 avg: 17614 median: 17614 (19%) max: 17829 Points
3DMark - 3DMark Cloud Gate Graphics
min: 32743 avg: 33219 median: 33218.5 (9%) max: 33694 Points
3DMark - 3DMark Fire Strike Standard Score
min: 4559 avg: 4786 median: 4581 (8%) max: 5218 Points
GPU TDP 20 W TDP 30 W 88% 100%
3DMark - 3DMark Fire Strike Standard Graphics
min: 4816 avg: 5100 median: 4890 (6%) max: 5593 Points
GPU TDP 20 W TDP 30 W 87% 100%
3DMark - 3DMark Sling Shot (ES 3.0) Unlimited
min: 7588 avg: 10635 median: 10635 (46%) max: 13682 Points
3DMark - 3DMark Sling Shot (ES 3.0) Unlimited Graphics
min: 35978 avg: 39365 median: 39364.5 (87%) max: 42751 Points
3DMark - 3DMark Sling Shot Extreme (ES 3.1) Unlimited
min: 8911 avg: 9606 median: 9605.5 (48%) max: 10300 Points
3DMark - 3DMark Sling Shot Extreme (ES 3.1) Unlimited Graphics
25707 Points (77%)
3DMark - 3DMark Wild Life Unlimited
min: 17731 avg: 18099 median: 18177 (9%) max: 18326 Points
3DMark - 3DMark Wild Life Extreme Unlimited
min: 4144 avg: 4696 median: 4821 (6%) max: 4997 Points
min: 3530 avg: 3590 median: 3589.5 (4%) max: 3649 Points
GPU TDP ? TDP 20 W 100% 76%
10352 Points (12%)
GPU TDP ? TDP 20 W 100% 62%
3DMark 11 - 3DM11 Performance Score
min: 7405 avg: 8160 median: 8160 (11%) max: 8915 Points
GPU TDP 20 W TDP 30 W 83% 100%
3DMark 11 - 3DM11 Performance GPU
min: 7432 avg: 8067 median: 8066.5 (7%) max: 8701 Points
GPU TDP 20 W TDP 30 W 85% 100%
3DMark Vantage + NVIDIA T550 Laptop GPU 3DMark Vantage - 3DM Vant. Perf. total
25155 Points (7%)
3DM Vant. Perf. GPU no PhysX + NVIDIA T550 Laptop GPU 3DMark Vantage - 3DM Vant. Perf. GPU no PhysX
24697 Points (14%)
3DMark 06 3DMark 06 - Standard 1280x1024 + NVIDIA T550 Laptop GPU
31003 Points (41%)
Blender - Blender 3.3 Classroom CUDA *
min: 278 avg: 282 median: 283 (42%) max: 285 Seconds
GPU TDP 20 W TDP 30 W 100% 102%
Blender - Blender 3.3 Classroom OPTIX *
min: 256 avg: 263.3 median: 265 (99%) max: 269 Seconds
GPU TDP 20 W TDP 30 W 100% 650%
SPECviewperf 13 specvp13 sw-04 + NVIDIA T550 Laptop GPU SPECviewperf 13 - specvp13 sw-04
min: 95 avg: 98.8 median: 95.8 (26%) max: 105.68 fps
GPU TDP 20 W TDP 30 W 90% 100%
specvp13 snx-03 + NVIDIA T550 Laptop GPU SPECviewperf 13 - specvp13 snx-03
min: 95.8 avg: 101.7 median: 99.7 (11%) max: 109.67 fps
GPU TDP 20 W TDP 30 W 89% 100%
specvp13 showcase-02 + NVIDIA T550 Laptop GPU SPECviewperf 13 - specvp13 showcase-02
min: 24.8 avg: 26.1 median: 25.3 (6%) max: 28.06 fps
GPU TDP 20 W TDP 30 W 89% 100%
specvp13 medical-02 + NVIDIA T550 Laptop GPU SPECviewperf 13 - specvp13 medical-02
min: 34.5 avg: 37.2 median: 36.2 (8%) max: 40.74 fps
GPU TDP 20 W TDP 30 W 87% 100%
specvp13 maya-05 + NVIDIA T550 Laptop GPU SPECviewperf 13 - specvp13 maya-05
min: 77.5 avg: 82 median: 80.9 (9%) max: 87.57 fps
GPU TDP 20 W TDP 30 W 90% 100%
specvp13 energy-02 + NVIDIA T550 Laptop GPU SPECviewperf 13 - specvp13 energy-02
min: 11.7 avg: 12.4 median: 12 (4%) max: 13.37 fps
GPU TDP 20 W TDP 30 W 89% 100%
specvp13 creo-02 + NVIDIA T550 Laptop GPU SPECviewperf 13 - specvp13 creo-02
min: 82.4 avg: 86.2 median: 85.5 (13%) max: 90.66 fps
GPU TDP 20 W TDP 30 W 93% 100%
specvp13 catia-05 + NVIDIA T550 Laptop GPU SPECviewperf 13 - specvp13 catia-05
min: 104 avg: 110.4 median: 109 (12%) max: 118.22 fps
GPU TDP 20 W TDP 30 W 90% 100%
specvp13 3dsmax-06 + NVIDIA T550 Laptop GPU SPECviewperf 13 - specvp13 3dsmax-06
min: 61.6 avg: 63.7 median: 63 (11%) max: 66.38 fps
GPU TDP 20 W TDP 30 W 94% 100%
SPECviewperf 2020 specvp2020 solidworks-05 1080p + NVIDIA T550 Laptop GPU SPECviewperf 2020 - specvp2020 solidworks-05 1080p
min: 46.3 avg: 54 median: 54.3 (11%) max: 61.38 fps
GPU TDP 20 W TDP 30 W 82% 100%
specvp2020 snx-04 1080p + NVIDIA T550 Laptop GPU SPECviewperf 2020 - specvp2020 snx-04 1080p
min: 84 avg: 99.4 median: 99.3 (16%) max: 114.82 fps
GPU TDP 20 W TDP 30 W 80% 100%
specvp2020 medical-03 1080p + NVIDIA T550 Laptop GPU SPECviewperf 2020 - specvp2020 medical-03 1080p
min: 13.5 avg: 15.6 median: 15.4 (11%) max: 17.87 fps
GPU TDP 20 W TDP 30 W 81% 100%
specvp2020 maya-06 1080p + NVIDIA T550 Laptop GPU SPECviewperf 2020 - specvp2020 maya-06 1080p
min: 86.9 avg: 98.2 median: 98.1 (14%) max: 109.68 fps
GPU TDP 20 W TDP 30 W 84% 100%
specvp2020 energy-03 1080p + NVIDIA T550 Laptop GPU SPECviewperf 2020 - specvp2020 energy-03 1080p
min: 10.6 avg: 12.1 median: 12 (10%) max: 13.56 fps
GPU TDP 20 W TDP 30 W 83% 100%
specvp2020 creo-03 1080p + NVIDIA T550 Laptop GPU SPECviewperf 2020 - specvp2020 creo-03 1080p
min: 44.5 avg: 46.2 median: 45.7 (23%) max: 48.5 fps
GPU TDP 20 W TDP 30 W 100% 98%
specvp2020 catia-06 1080p + NVIDIA T550 Laptop GPU SPECviewperf 2020 - specvp2020 catia-06 1080p
min: 22.4 avg: 25.6 median: 24.9 (16%) max: 29.58 fps
GPU TDP 20 W TDP 30 W 80% 100%
specvp2020 3dsmax-07 1080p + NVIDIA T550 Laptop GPU SPECviewperf 2020 - specvp2020 3dsmax-07 1080p
min: 28.3 avg: 30 median: 29.6 (13%) max: 32.03 fps
GPU TDP 20 W TDP 30 W 90% 100%
Cinebench R15 + Apple M1 8-Core GPU Cinebench R15 - Cinebench R15 OpenGL 64 Bit
min: 88.1 avg: 89.1 median: 89.4 (5%) max: 89.8 fps
Cinebench R15 OpenGL 64 Bit + NVIDIA T550 Laptop GPU
min: 184.9 avg: 193 median: 189.2 (11%) max: 205 fps
GPU TDP ? TDP 20 W TDP 30 W 43% 91% 100%
Cinebench R15 OpenGL 64 Bit + Apple M1 Pro 16-Core GPU
85.5 fps (5%)
GPU TDP ? TDP 20 W TDP 30 W 43% 91% 100%
Cinebench R15 OpenGL Ref. Match 64 Bit + Apple M1 8-Core GPU Cinebench R15 - Cinebench R15 OpenGL Ref. Match 64 Bit
99.5 % (100%)
Cinebench R15 OpenGL Ref. Match 64 Bit + NVIDIA T550 Laptop GPU
99.6 % (100%)
GPU TDP ? TDP 20 W TDP 30 W 100% 100% 100%
Cinebench R15 OpenGL Ref. Match 64 Bit + Apple M1 Pro 16-Core GPU
99.5 % (100%)
GPU TDP ? TDP 20 W TDP 30 W 100% 100% 100%
GFXBench - GFXBench 5.0 4K Aztec Ruins High Tier Offscreen
71.7 fps (29%)
GFXBench - GFXBench 5.0 Aztec Ruins High Tier Offscreen
min: 60.9 avg: 74.3 median: 78.1 (14%) max: 81.7 fps
19 fps (3%)
GPU TDP ? TDP 20 W 100% 26%
166 fps (30%)
GPU TDP ? TDP 20 W 100% 22%
GFXBench - GFXBench 5.0 Aztec Ruins Normal Tier Offscreen
min: 149 avg: 196.9 median: 206 (15%) max: 216.1 fps
43.5 fps (3%)
GPU TDP ? TDP 20 W 100% 22%
436 fps (32%)
GPU TDP ? TDP 20 W 100% 19%
GFXBench - GFXBench Car Chase Offscreen
min: 150 avg: 167.4 median: 165.1 (19%) max: 197 fps
118.3 fps (13%)
GPU TDP ? TDP 20 W 100% 71%
345 fps (39%)
GPU TDP ? TDP 20 W 100% 61%
GFXBench 3.1 - GFXBench Manhattan ES 3.1 Offscreen
min: 216 avg: 248.2 median: 248.7 (5%) max: 275 fps
172.6 fps (4%)
GPU TDP ? TDP 20 W 100% 70%
544 fps (11%)
GPU TDP ? TDP 20 W 100% 59%
GFXBench 3.0 - GFXBench 3.0 Manhattan Offscreen
min: 317 avg: 358.5 median: 345 (20%) max: 408 fps
229.9 fps (13%)
GPU TDP ? TDP 20 W 100% 64%
869 fps (51%)
GPU TDP ? TDP 20 W 100% 52%
GFXBench (DX / GLBenchmark) 2.7 + Apple M1 8-Core GPU GFXBench (DX / GLBenchmark) 2.7 - GFXBench T-Rex HD Offscreen C24Z16
min: 557 avg: 610 median: 588 (5%) max: 670 fps
GFXBench T-Rex HD Offscreen C24Z16 + NVIDIA T550 Laptop GPU
449.9 fps (4%)
GPU TDP ? TDP 20 W 100% 74%
GFXBench T-Rex HD Offscreen C24Z16 + Apple M1 Pro 16-Core GPU
1561 fps (12%)
GPU TDP ? TDP 20 W 100% 59%
Antutu v9 - AnTuTu v9 GPU
min: 549301 avg: 598951 median: 598951 (75%) max: 648601 Points
Geekbench 6.2 - Geekbench 6.2 GPU OpenCL
42189 Points (12%)
Geekbench 6.2 - Geekbench 6.2 GPU Metal
69083 Points (44%)
ComputeMark v2.1 - ComputeMark v2.1 Result
5190 Points (6%)
Power Consumption - Furmark Stress Test Power Consumption - external Monitor *
min: 34.2 avg: 34.7 median: 34.7 (5%) max: 35.1 Watt
Power Consumption - The Witcher 3 Power Consumption - external Monitor *
min: 41.2 avg: 41.3 median: 41.3 (6%) max: 41.4 Watt
Power Consumption - Witcher 3 Power Consumption *
min: 19.6 avg: 39.4 median: 39.4 (9%) max: 59.2 Watt
min: 42.9 avg: 44.1 median: 44.1 (10%) max: 45.3 Watt
GPU TDP ? TDP 20 W 101% 100%
Power Consumption - GFXBench Aztec Ruins Normal Tier Offscreen Power Consumption 150cd *
min: 16 avg: 16.4 median: 16.5 (6%) max: 16.6 Watt
40.7 Watt (16%)
Power Consumption - Witcher 3 ultra Power Efficiency
min: 0.4393 avg: 0.4 median: 0.4 (40%) max: 0.4569 fps per Watt
Power Consumption - Witcher 3 ultra Power Efficiency - external Monitor
min: 0.4734 avg: 0.5 median: 0.5 (40%) max: 0.483 fps per Watt
Emissions Witcher 3 Fan Noise + NVIDIA T550 Laptop GPU Emissions - Witcher 3 Fan Noise
min: 38.2 avg: 40.4 median: 40.5 (65%) max: 42.5 dB(A)
GPU TDP 20 W TDP 30 W 93% 100%
Average Benchmarks Apple M1 8-Core GPU → 100% n=9 Average Benchmarks NVIDIA T550 Laptop GPU → 80% n=9 Average Benchmarks Apple M1 Pro 16-Core GPU → 198% n=9
- Range of benchmark values for this graphics card
- Average benchmark values for this graphics card
* Smaller numbers mean a higher performance
1 This benchmark is not used for the average calculation
Game Benchmarks The following benchmarks stem from our benchmarks of review laptops. The performance depends on the used graphics memory, clock rate, processor, system settings, drivers, and operating systems. So the results don't have to be representative for all laptops with this GPU. For detailed information on the benchmark results, click on the fps number.
100%
M1 8-Core GPU:
60 fps
100%
M1 8-Core GPU:
59 60 ~ 60 fps
100%
M1 8-Core GPU:
59 60 60 ~ 60 fps
100%
M1 8-Core GPU:
59 60 ~ 60 fps
100%
M1 8-Core GPU:
59 60 ~ 60 fps
118%
M1 Pro 16-Core GPU:
56.6 fps
166%
M1 Pro 16-Core GPU:
48 fps
174%
M1 Pro 16-Core GPU:
34.8 fps
M1 Pro 16-Core GPU:
26.2 fps
116%
M1 Pro 16-Core GPU:
114 fps
199%
M1 Pro 16-Core GPU:
69.6 fps
199%
M1 Pro 16-Core GPU:
43.8 fps
100%
M1 8-Core GPU:
15 15 ~ 15 fps
212%
M1 Pro 16-Core GPU:
31.8 fps
100%
M1 8-Core GPU:
64 66 78 ~ 69 fps
100%
M1 8-Core GPU:
25 27 45 ~ 32 fps
197%
M1 Pro 16-Core GPU:
63 fps
100%
M1 8-Core GPU:
23 25 43 ~ 30 fps
190%
M1 Pro 16-Core GPU:
57 fps
100%
M1 8-Core GPU:
38 fps
132%
M1 Pro 16-Core GPU:
50 fps
100%
M1 8-Core GPU:
39 fps
100%
M1 8-Core GPU:
39 44 ~ 42 fps
100%
M1 8-Core GPU:
59 fps
M1 Pro 16-Core GPU:
45.5 fps
M1 Pro 16-Core GPU:
45.5 fps
M1 Pro 16-Core GPU:
54.2 fps
M1 Pro 16-Core GPU:
43.1 fps
100%
M1 8-Core GPU:
39.6 [X] Apple Mac Mini Late 2020 (M1, 16GB) Metal
Apple M1 2.1GHz
M1 8-Core GPU
fps
T550 Laptop GPU:
73 75 78 ~ 75 fps
T550 Laptop GPU:
39 40 43 ~ 41 fps
Average Gaming Apple M1 8-Core GPU → 100% Average Gaming 30-70 fps → 100%
Average Gaming Apple M1 Pro 16-Core GPU → 170% Average Gaming 30-70 fps → 176%
NVIDIA T550 Laptop GPU low med. high ultra QHD 4K F1 22 69 62 43 31 F1 2021 153 74 59 37 Strange Brigade 131 52 42 36 Far Cry 5 75 41 38 35 X-Plane 11.11 70 63 57 Final Fantasy XV Benchmark 62 31 22 Dota 2 Reborn 117 105 95 88 The Witcher 3 128 75 41 21 GTA V 116 114 62 29 < 30 fps < 60 fps < 120 fps ≥ 120 fps 6 3 3 6 1 6 2 2 4 1
Apple M1 Pro 16-Core GPU low med. high ultra QHD 4K Borderlands 3 56.6 48 34.8 26.2 Total War: Three Kingdoms 114 69.6 43.8 31.8 Shadow of the Tomb Raider 63 57 50 Civilization VI 45.5 45.5 Deus Ex Mankind Divided 54.2 43.1 < 30 fps < 60 fps < 120 fps ≥ 120 fps 1 1 1 2 5 1 4
For more games that might be playable and a list of all games and graphics cards visit our Gaming List
v1.27
log 17. 19:25:42
#0 checking url part for id 10552 +0s ... 0s
#1 checking url part for id 11429 +0s ... 0s
#2 checking url part for id 10963 +0s ... 0s
#3 not redirecting to Ajax server +0s ... 0s
#4 did not recreate cache, as it is less than 5 days old! Created at Sun, 16 Jun 2024 05:38:48 +0200 +0.001s ... 0.001s
#5 composed specs +0.103s ... 0.104s
#6 did output specs +0s ... 0.104s
#7 start showIntegratedCPUs +0s ... 0.104s
#8 getting avg benchmarks for device 10552 +0.047s ... 0.151s
#9 got single benchmarks 10552 +0.011s ... 0.163s
#10 getting avg benchmarks for device 11429 +0.002s ... 0.165s
#11 got single benchmarks 11429 +0.014s ... 0.178s
#12 getting avg benchmarks for device 10963 +0.002s ... 0.18s
#13 got single benchmarks 10963 +0.005s ... 0.185s
#14 got avg benchmarks for devices +0s ... 0.185s
#15 min, max, avg, median took s +0.232s ... 0.417s
#16 before gaming benchmark output +0s ... 0.417s
#17 Got 162 rows for game benchmarks. +0.023s ... 0.44s
#18 composed SQL query for gamebenchmarks +0s ... 0.44s
#19 got data and put it in $dataArray +0.012s ... 0.452s
#20 benchmarks composed for output. +0.045s ... 0.497s
#21 calculated avg scores. +0s ... 0.497s
#22 return log +0.002s ... 0.499s
Please share our article, every link counts!
Redaktion, 2017-09- 8 (Update: 2023-07- 1)
 Deutsch
 English
 Español
 Français
 Italiano
 Nederlands
 Polski
 Português
 Русский
 Türkçe
 Svenska
 Chinese
 Magyar