Notebookcheck Logo

Mediatek Helio G99 vs Apple M2 vs Mediatek Helio G90T

Mediatek Helio G99

► remove from comparison Mediatek Helio G99

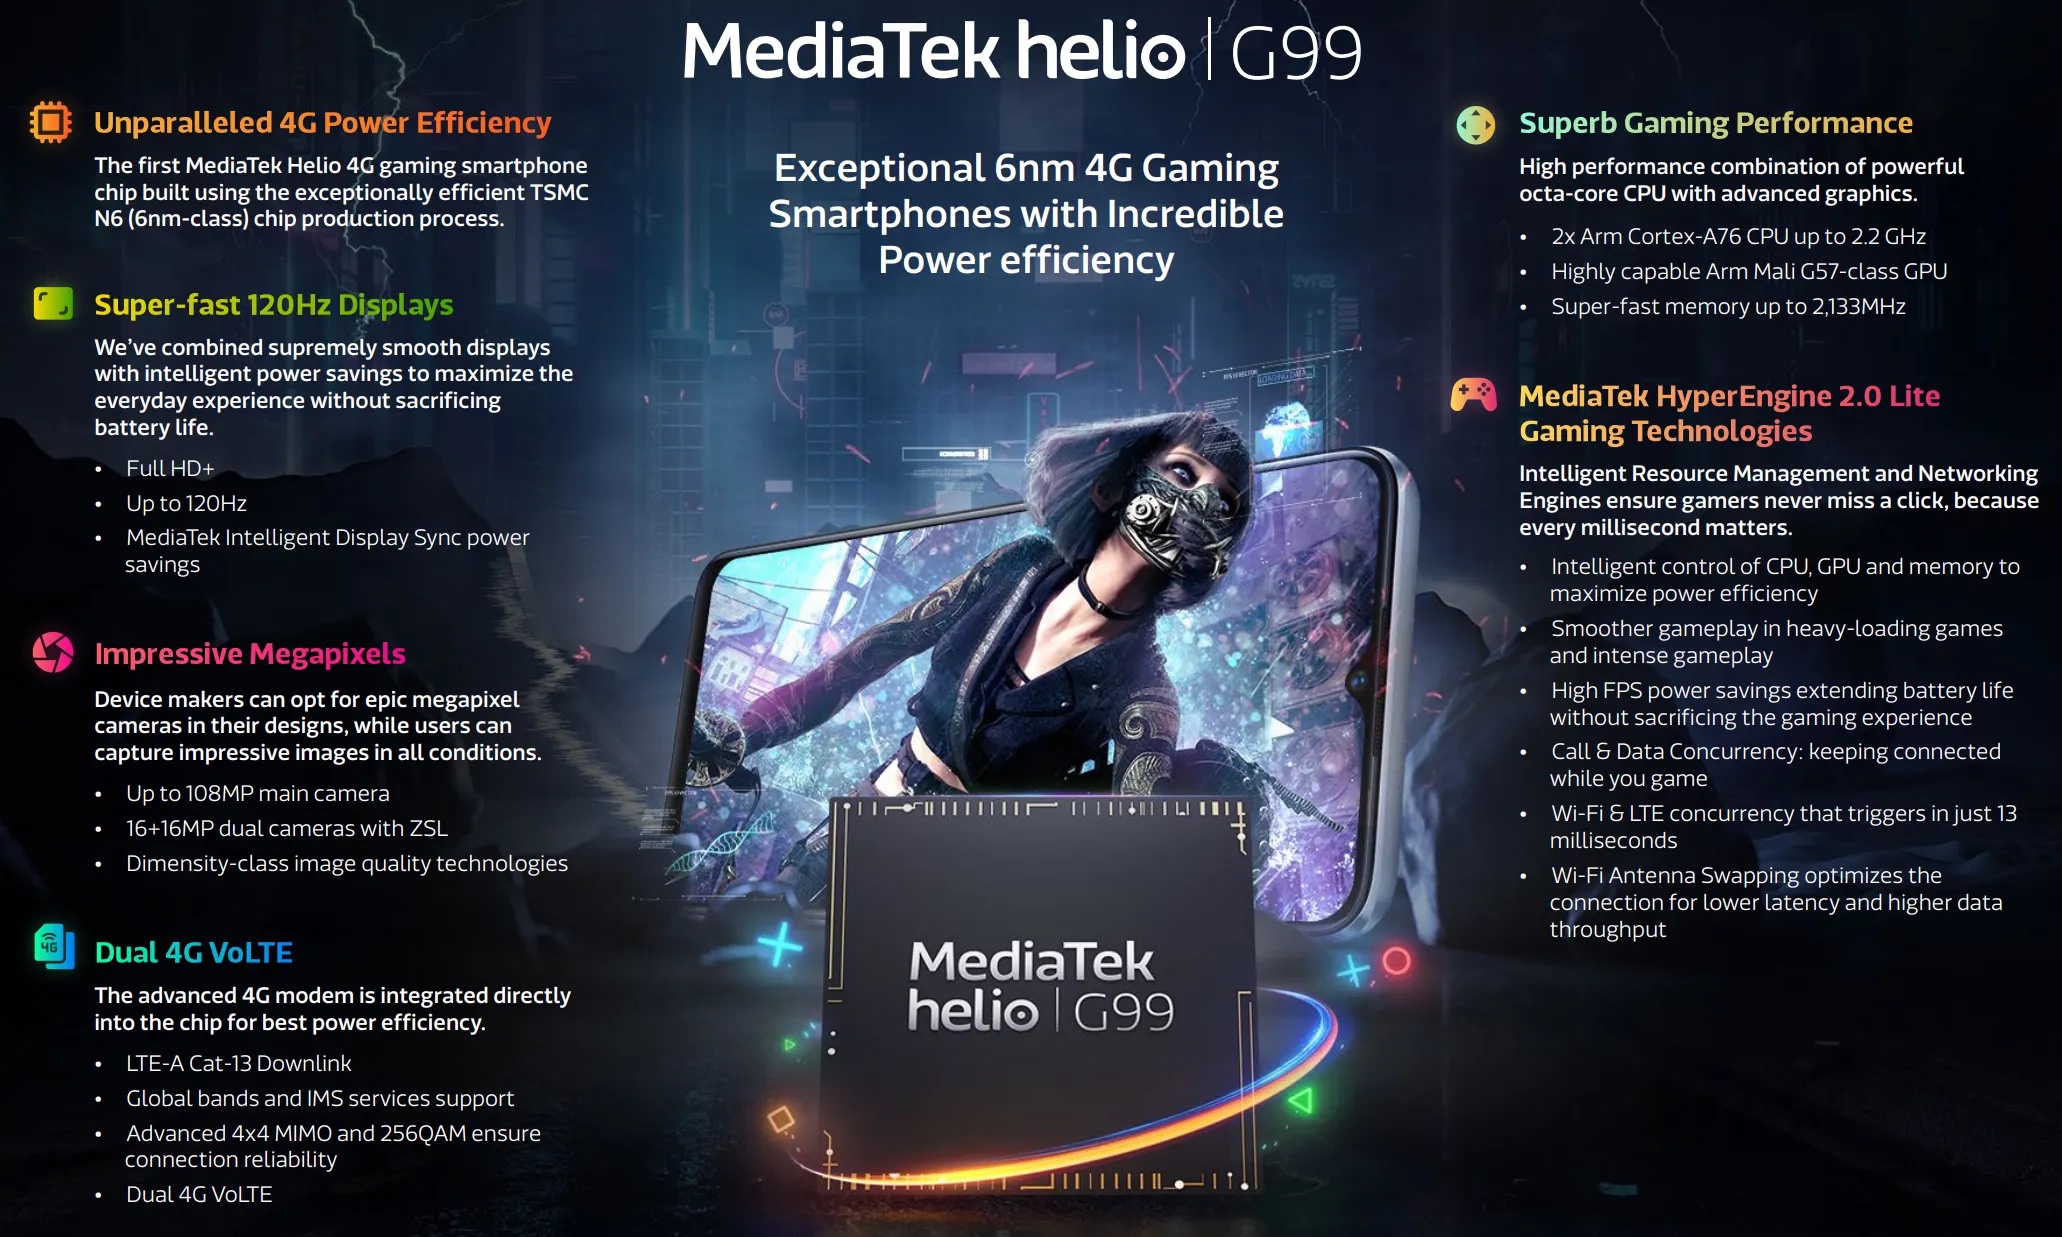
The Mediatek Helio G99 is a mainstream ARM SoC for smartphones (mainly Android based) that was introduced in 2022. It is manufactured in a 6 nm FinFET process and is equipped with 2x big ARM Cortex-A76 cores with up to 2.2 GHz and 6x small and power efficient ARM Cortex-A55 cores (max. 2 GHz) in two clusters (bigLITTLE). The chip integrates an ARM Mali-G57 MC2 (two cores). Compared to the older Helio G96, the G99 is manufactured in the more recent 6nm process and clocks higher.

Furthermore, the integrated LTE / 4G modem supports Cat-13 download speeds. Wi-Fi 5 is also integrated (a/b/g/n/ac). The memory controller supportsLPDDR4x with up to 4,266 Mbps.

Apple M2

► remove from comparison Apple M2

The Apple M2 is a System on a Chip (SoC) from Apple that is found in the late 2022 MacBook Air and, MacBook Pro 13. It offers 8 cores divided in four performance cores and four power-efficiency cores. The big cores offer 192 KB instruction cache, 128 KB data cache, and 16 MB shared L2 cache (up from 12 MB). The four efficiency cores are a lot smaller and offer only 128 KB instruction cache, 64 KB data cache, and 4 MB shared cache. The efficiency cores (E cluster) clock with  up to 2,4 GHz, the performance cores (P cluster) with up to 3,5 GHz and therefore higher than the M1 cores. The architecture should be similar to the A15 (iPhone 13) with Avalanche and Blizzard cores.

The chip features a unified memory architecture for the CPU and GPU cores and supports up to 24 GB LPDDR5-6400 for a bandwidth of up to 100GB/s.

According to Apple, the M2 offers a 18% higher CPU performance at the same power consumption level compared to the Apple M1. In our tests, the MacBook Pro 13 with active cooling was able to reach the 18% in Geekbench Multi. In other benchmarks we measured 12 to 15% gains compared to the M1. Therefore, the performance is now near the M1 Pro with 8 cores. The passively cooled MacBook Air may however suffer from throttling in longer load scenarios.

The integrated graphics card in the M2 offers 8 or 10 cores and a peak performance of 3.6 TFLOPs.

Furthermore, the SoC integrates a fast 16 core neural engine with a peak performance of 16 TOPS (for AI hardware acceleration), a secure enclave (e.g., for encryption), Thunderbolt / USB 4 controller, an ISP, and media de- and encoders.

The Apple M2 includes 20 billion transistors (up from the 16 billion of the M1) and is manufactured in the second generation 5nm process at TSMC (most likely N5P). The power consumption is rated at 20W what we also measured under CPU load.

Mediatek Helio G90T

► remove from comparison Mediatek Helio G90T

The Mediatek Helio G90T is an upper mainstream ARM SoC for smartphones (mainly Android based) that was introduced in 2019. It is manufactured in a 12 nm FinFET process and is equipped with 2x big ARM Cortex-A76 cores with up to 2.05 GHz and 6x small and power efficient ARM Cortex-A55 cores (max. 2 GHz) in two clusters (bigLITTLE). The chip also integrates a ARM Mali-G76 3EEMC4 (should be a MP4 - four cluster variant) clcoked at 800 MHz. Furthermore, the integrated LTE modem supports Cat-12 600 Mbps download and Cat-13 150 Mbps upload speeds. Wi-Fi 5 is also integrated (a/b/g/n/ac). The memory controller supports LPDDR3 and LPDDR4x with up to 2,133 MHz with up to 10 GB capacity.

ModelMediatek Helio G99Apple M2Mediatek Helio G90T
CodenameCortex-A76 / A55Cortex-A76 / A55
SeriesMediatek Mediatek Helio GApple M2Mediatek Mediatek Helio G
Series: Mediatek Helio G Cortex-A76 / A55
Mediatek Helio G1002 - 2.2 GHz8 / 8 cores Cortex-A76 / A55
Mediatek Helio G99 « 2 - 2.2 GHz8 / 8 cores Cortex-A76 / A55
Mediatek Helio G962 - 2.05 GHz8 / 8 cores Cortex-A76 / A55
Mediatek Helio G952 - 2.05 GHz8 / 8 cores Cortex-A76 / A55
Mediatek Helio G90T2.05 GHz8 / 8 cores Cortex-A76 / A55
Apple M2 Max2.42 - 3.7 GHz12 / 12 cores48 MB L3
Apple M2 Pro2.42 - 3.5 GHz12 / 12 cores24 MB L3
Apple M2 Pro 10-Core2.42 - 3.7 GHz10 / 10 cores24 MB L3
Apple M2 « 2.42 - 3.48 GHz8 / 8 cores8 MB L3
Mediatek Helio G1002 - 2.2 GHz8 / 8 cores Cortex-A76 / A55
Mediatek Helio G992 - 2.2 GHz8 / 8 cores Cortex-A76 / A55
Mediatek Helio G962 - 2.05 GHz8 / 8 cores Cortex-A76 / A55
Mediatek Helio G952 - 2.05 GHz8 / 8 cores Cortex-A76 / A55
Mediatek Helio G90T « 2.05 GHz8 / 8 cores Cortex-A76 / A55
Clock2000 - 2200 MHz2424 - 3480 MHz2050 MHz
Cores / Threads8 / 8
2 x 2.2 GHz ARM Cortex-A76
6 x 2.0 GHz ARM Cortex-A55
8 / 88 / 8
Technology6 nm5 nm12 nm
Features2x Cortex-A76, 6x Cortex-A55, 4G LTE Cat-12/13, 64MP AI-Camera support, LPDDR3/LPDDR4x-2133, eMMC 5.1, UFS 2.1, Beidou, Galileo, Glonass, GPS, Wi-Fi 5 (a/b/g/n/ac), AI Accelerator up to 1 TMACs, H.264 / H.265 / HEVC video encoding (4k30)ARMv8 Instruction Set2x Cortex-A76, 6x Cortex-A55, 4G LTE Cat-12/13, 64MP AI-Camera support, LPDDR3/LPDDR4x-2133, eMMC 5.1, UFS 2.1, Beidou, Galileo, Glonass, GPS, Wi-Fi 5 (a/b/g/n/ac), AI Accelerator up to 1 TMACs, H.264 / H.265 / HEVC video encoding (4k30)
iGPUARM Mali-G57 MP2Apple M2 10-Core GPU ( - 1398 MHz)ARM Mali-G76 MP4 ( - 800 MHz)
ArchitectureARMARMARM
Announced
Manufacturerwww.mediatek.comwww.apple.comwww.mediatek.com
L1 Cache2 MB
L2 Cache20 MB
L3 Cache8 MB
TDP20 Watt
Transistors20000 Million

Benchmarks

Performance Rating - Geekbench 5.5, PCM Work, Sling Shot Physics, Antutu v8 CPU - Helio G90T
0.6 pt (44%)
Restrict / Search: Model: Max. age: years
Cinebench 2024 - Cinebench 2024 CPU Single Core
100%
1 M2 +
121 Points (68%)
Cinebench 2024 - Cinebench 2024 CPU Multi Core
100%
1 M2 +
513 Points (10%)
Cinebench R23 - Cinebench R23 Multi Core
100%
1 M2 +
min: 8517     avg: 8654     median: 8667 (8%)     max: 8772 Points
Cinebench R23 - Cinebench R23 Single Core
100%
1 M2 +
min: 1580     avg: 1595     median: 1585 (67%)     max: 1638 Points
Cinebench R20 - Cinebench R20 CPU (Single Core)
100%
1 M2 +
min: 216     avg: 370.8     median: 381 (42%)     max: 446 Points
Cinebench R20 - Cinebench R20 CPU (Multi Core)
100%
1 M2 +
min: 2231     avg: 2325     median: 2324 (6%)     max: 2416 Points
Cinebench R15 - Cinebench R15 CPU Multi 64 Bit
100%
1 M2 +
min: 1209.9     avg: 1222     median: 1215 (8%)     max: 1243 Points
Cinebench R15 - Cinebench R15 CPU Single 64 Bit
100%
1 M2 +
min: 222     avg: 223.8     median: 223 (62%)     max: 229 Points
Blender - Blender 3.3 Classroom CPU *
100%
1 M2 +
min: 540     avg: 620     median: 619.5 (8%)     max: 702 Seconds
Blender - Blender 2.79 BMW27 CPU *
100%
1 M2 +
min: 549     avg: 614     median: 597 (4%)     max: 713 Seconds
3DMark - 3DMark Ice Storm Unlimited Physics
min: 19084     avg: 21006     median: 21006 (17%)     max: 22928 Points
min: 3188     avg: 3345     median: 3350.5 (32%)     max: 3492 Points
3DMark - 3DMark Sling Shot (ES 3.0) Unlimited Physics
min: 3438     avg: 3596     median: 3630.5 (41%)     max: 3685 Points
min: 3143     avg: 3322     median: 3354 (38%)     max: 3438 Points
357%
1 M2 +
min: 2587     avg: 2609     median: 2599 (65%)     max: 2650 Points
512%
1 M2 +
min: 10034     avg: 10083     median: 10089 (39%)     max: 10120 Points
Geekbench 6.0 - Geekbench 6.0 Single-Core
min: 714     avg: 717     median: 717 (23%)     max: 720 Points
Geekbench 6.0 - Geekbench 6.0 Multi-Core
min: 1916     avg: 1941     median: 1940.5 (8%)     max: 1965 Points
350%
M2 +
min: 1887     avg: 1914     median: 1915.5 (75%)     max: 1953 Points
min: 483     avg: 510     median: 503 (20%)     max: 545 Points
493%
M2 +
min: 8491     avg: 8812     median: 8956 (16%)     max: 8994 Points
min: 1557     avg: 1622     median: 1593 (3%)     max: 1715 Points
Geekbench 5.0 - Geekbench 5.0 64 Bit Single-Core
555 Points (2%)
391 Points (2%)
Geekbench 5.0 - Geekbench 5.0 64 Bit Multi-Core
1921 Points (6%)
1612 Points (5%)
Geekbench 4.4 - Geekbench 4.1 - 4.4 64 Bit Single-Core
min: 2512     avg: 2620     median: 2672 (27%)     max: 2675 Points
min: 2363     avg: 2452     median: 2424.5 (24%)     max: 2594 Points
Geekbench 4.4 - Geekbench 4.1 - 4.4 64 Bit Multi-Core
min: 7018     avg: 7608     median: 7896 (8%)     max: 7911 Points
min: 6043     avg: 6878     median: 6836.5 (7%)     max: 7795 Points
Geekbench 4.0 - Geekbench 4.0 64 Bit Single-Core
2625 Points (29%)
0 Points (0%)
Geekbench 4.0 - Geekbench 4.0 64 Bit Multi-Core
min: 7492     avg: 7532     median: 7531.5 (11%)     max: 7571 Points
Geekbench 3 - Geekbench 3 64 Bit Multi-Core
min: 7124     avg: 7934     median: 7933.5 (12%)     max: 8743 Points
6127 Points (10%)
Geekbench 3 - Geekbench 3 64 Bit Single-Core
min: 2334     avg: 2555     median: 2555 (38%)     max: 2776 Points
2097 Points (31%)
Geekbench 3 - Geekbench 3 32 Bit Single-Core
0 Points (0%)
Geekbench 2 - 32 Bit - Geekbench Stream
min: 1569     avg: 2038     median: 2038 (16%)     max: 2507 Points
Geekbench 2 - 32 Bit - Geekbench Memory
min: 3282     avg: 3645     median: 3644.5 (33%)     max: 4007 Points
Geekbench 2 - 32 Bit - Geekbench Floating Point
min: 11078     avg: 11322     median: 11322 (22%)     max: 11566 Points
Geekbench 2 - 32 Bit - Geekbench Integer
min: 5547     avg: 5566     median: 5566 (11%)     max: 5585 Points
Geekbench 2 - 32 Bit - Geekbench Total Score
min: 6632     avg: 6843     median: 6843 (18%)     max: 7054 Points
Mozilla Kraken 1.1 - Kraken 1.1 Total Score *
min: 1670.9     avg: 2038     median: 2009.6 (2%)     max: 2443.7 ms
447%
M2 +
min: 440     avg: 450.1     median: 449.2 (1%)     max: 466.8 ms
min: 2793     avg: 3223     median: 3159 (4%)     max: 3782 ms
Octane V2 - Octane V2 Total Score
min: 17228     avg: 21801     median: 22038.5 (17%)     max: 26476 Points
340%
M2 +
min: 72484     avg: 75019     median: 74878 (57%)     max: 78736 Points
min: 15061     avg: 15812     median: 15619 (12%)     max: 16947 Points
WebXPRT 4 - WebXPRT 4 Score
min: 39     avg: 71.8     median: 81 (22%)     max: 89 Points
290%
1 M2 +
min: 223     avg: 237.8     median: 235 (65%)     max: 256 Points
WebXPRT 3 - WebXPRT 3 Score
min: 80     avg: 95.4     median: 93.5 (17%)     max: 112 Points
402%
M2 +
min: 342     avg: 366.5     median: 376 (68%)     max: 387 Points
min: 46     avg: 52.3     median: 54 (10%)     max: 55 Points
AnTuTu v6 - AnTuTu v6 Total Score
0 Points (0%)
AnTuTu v8 - AnTuTu v8 UX
min: 45630     avg: 51080     median: 51080 (43%)     max: 56530 Points
AnTuTu v8 - AnTuTu v8 MEM
min: 56316     avg: 57772     median: 57771.5 (47%)     max: 59227 Points
AnTuTu v8 - AnTuTu v8 GPU
min: 79602     avg: 86146     median: 86146 (16%)     max: 92690 Points
AnTuTu v8 - AnTuTu v8 CPU
min: 95868     avg: 96747     median: 96747 (35%)     max: 97626 Points
AnTuTu v8 - AnTuTu v8 Total Score
min: 282085     avg: 291745     median: 291744 (28%)     max: 301404 Points
Antutu v9 - AnTuTu v9 Total Score
min: 229468     avg: 317183     median: 319204 (16%)     max: 375956 Points
419%
M2 +
min: 1257990     avg: 1337360     median: 1337360 (65%)     max: 1416730 Points
min: 322048     avg: 322607     median: 322607 (16%)     max: 323166 Points
Antutu v9 - AnTuTu v9 CPU
min: 83150     avg: 98532     median: 100624 (25%)     max: 106860 Points
296%
M2 +
min: 294643     avg: 298254     median: 298254 (74%)     max: 301865 Points
min: 87314     avg: 87801     median: 87801 (22%)     max: 88288 Points
Antutu v10 - AnTuTu v10 Total Score
min: 383511     avg: 403892     median: 401641 (13%)     max: 422936 Points
488%
1 M2 +
min: 1936540     avg: 1954930     median: 1961470 (65%)     max: 1966790 Points
Antutu v10 - AnTuTu v10 CPU
min: 120432     avg: 130929     median: 131438 (4%)     max: 139789 Points
409%
1 M2 +
min: 535127     avg: 540446     median: 537292 (16%)     max: 548919 Points
PassMark PerformanceTest Mobile V1 - PerformanceTest Mobile V1 CPU Tests
min: 17736     avg: 107245     median: 107245 (14%)     max: 196754 Points
PCMark for Android - PCM f. Android Storage 2.0 random write internal
min: 30.8     avg: 55.5     median: 64.1 (44%)     max: 71.8 MB/s
PCMark for Android - PCM f. Android Storage 2.0 seq write internal
min: 184.1     avg: 539     median: 595 (17%)     max: 826 MB/s
PCMark for Android - PCM f. Android Storage 2.0 random read internal
min: 17.6     avg: 33.6     median: 40.9 (20%)     max: 45.4 MB/s
PCMark for Android - PCM f. Android Storage 2.0 seq read internal
min: 719.36     avg: 781     median: 785.5 (22%)     max: 819 MB/s
PCMark for Android - PCM f. Android Storage 2.0 score
min: 14042     avg: 22277     median: 23442 (10%)     max: 28259 Points
min: 12938     avg: 12941     median: 12941 (6%)     max: 12944 Points
min: 8346     avg: 8391     median: 8390.5 (31%)     max: 8435 Points
PCMark for Android - PCM f. Android Computer Vision
min: 7642     avg: 7696     median: 7696 (41%)     max: 7750 Points
PCMark for Android - PCM f. Android Storage
min: 10157     avg: 11706     median: 11705.5 (25%)     max: 13254 Points
PCMark for Android - PCM f. Android Work Score 2.0
min: 9967     avg: 10240     median: 10239.5 (67%)     max: 10512 Points
PCMark for Android - PCM f. Android Work Score
min: 14669     avg: 14808     median: 14807.5 (74%)     max: 14946 Points
265%
1 M2 +
min: 1437     avg: 1515     median: 1507 (56%)     max: 1585 Points
Power Consumption - Cinebench R15 Multi Power Consumption - external Monitor *
100%
1 M2 +
29 Watt (5%)
44%
1 M2 +
min: 6.86     avg: 8.3     median: 8.4 (4%)     max: 9.71 Watt
min: 3.96     avg: 4.1     median: 4.1 (2%)     max: 4.24 Watt
Power Consumption - Idle Power Consumption - external Monitor *
100%
1 M2 +
min: 2.03     avg: 2.6     median: 2.4 (2%)     max: 3.98 Watt
35%
1 M2 +
min: 1.631     avg: 3.5     median: 3.6 (4%)     max: 5.32 Watt
min: 1.477     avg: 1.5     median: 1.5 (2%)     max: 1.483 Watt
Power Consumption - Power Efficiency - Cinebench R15 Multi external Monitor
100%
1 M2 +
42.4 Points per Watt (32%)

Average Benchmarks Mediatek Helio G99 → 100% n=7

Average Benchmarks Apple M2 → 392% n=7

Average Benchmarks Mediatek Helio G90T → 80% n=7

- Range of benchmark values for this graphics card
red legend - Average benchmark values for this graphics card
* Smaller numbers mean a higher performance
1 This benchmark is not used for the average calculation

v1.33
log 29. 00:05:44

#0 ran 0s before starting gpusingle class +0s ... 0s

#1 checking url part for id 14649 +0s ... 0s

#2 checking url part for id 14521 +0s ... 0s

#3 checking url part for id 11505 +0s ... 0s

#4 redirected to Ajax server, took 1753740344s time from redirect:0 +0s ... 0s

#5 did not recreate cache, as it is less than 5 days old! Created at Mon, 28 Jul 2025 05:17:35 +0200 +0s ... 0s

#6 composed specs +0.005s ... 0.005s

#7 did output specs +0s ... 0.005s

#8 getting avg benchmarks for device 14649 +0.001s ... 0.006s

#9 got single benchmarks 14649 +0.025s ... 0.03s

#10 getting avg benchmarks for device 14521 +0s ... 0.031s

#11 got single benchmarks 14521 +0.001s ... 0.032s

#12 getting avg benchmarks for device 11505 +0.004s ... 0.036s

#13 got single benchmarks 11505 +0.007s ... 0.043s

#14 got avg benchmarks for devices +0s ... 0.043s

#15 No cached benchmark found, getting uncached values +0.014s ... 0.056s

#16 No cached benchmark found, getting uncached values +0.002s ... 0.059s

#17 No cached benchmark found, getting uncached values +0.007s ... 0.066s

#18 min, max, avg, median took s +0.013s ... 0.079s

#19 return log +0s ... 0.079s

Please share our article, every link counts!
Mail Logo
> Expert Reviews and News on Laptops, Smartphones and Tech Innovations > Benchmarks / Tech > Processor Comparison - Head 2 Head
Redaktion, 2017-09- 8 (Update: 2023-07- 1)