

Lenovo Yoga Slim 7 14 laptop review - With Nvidia GPU against AMD
We already reviewed the Lenovo Yoga Slim 7 14 with a current Ryzen 4800U processor from AMD, but there's also a model with a combination of an Intel CPU and a dedicated Nvidia GPU. This is the Yoga Slim 7 14IIL05 and is equipped with the Intel Core i7-1065G7, the GeForce MX350, 8 GB of RAM, and a 512 GB NVMe SSD. The Intel model is a bit more expensive in terms of price, but the AMD models are hardly available at the time. We now want to clarify what differences there really are in everyday life apart from the price. Since the Ryzen 7 4800U has been very hard to get so far, we will also compare the CPU and GPU performance with the Ryzen 7 4700U, which is also available for the Yoga Slim 7.
Rating | Date | Model | Weight | Height | Size | Resolution | Price |
|---|---|---|---|---|---|---|---|
| 84.4 % v7 (old) | 10 / 2020 | Lenovo Yoga Slim 7-14IIL05 i7-1065G7, GeForce MX350 | 1.4 kg | 14.9 mm | 14.00" | 1920x1080 | |
| 85.3 % v7 (old) | 08 / 2020 | Lenovo Yoga Slim 7-14ARE R7 4800U, Vega 8 | 1.4 kg | 14.9 mm | 14.00" | 1920x1080 | |
| 82.4 % v7 (old) | 09 / 2020 | Asus ZenBook 14 UX434FL-DB77 i7-8565U, GeForce MX250 | 1.3 kg | 16.9 mm | 14.00" | 1920x1080 | |
| 80.7 % v7 (old) | 08 / 2020 | Asus VivoBook Flip 14 TM420IA R7 4700U, Vega 7 | 1.6 kg | 18.2 mm | 14.00" | 1920x1080 | |
| 86.5 % v7 (old) | 06 / 2020 | Acer Swift 3 SF314-42-R4XJ R7 4700U, Vega 7 | 1.2 kg | 16.55 mm | 14.00" | 1920x1080 |
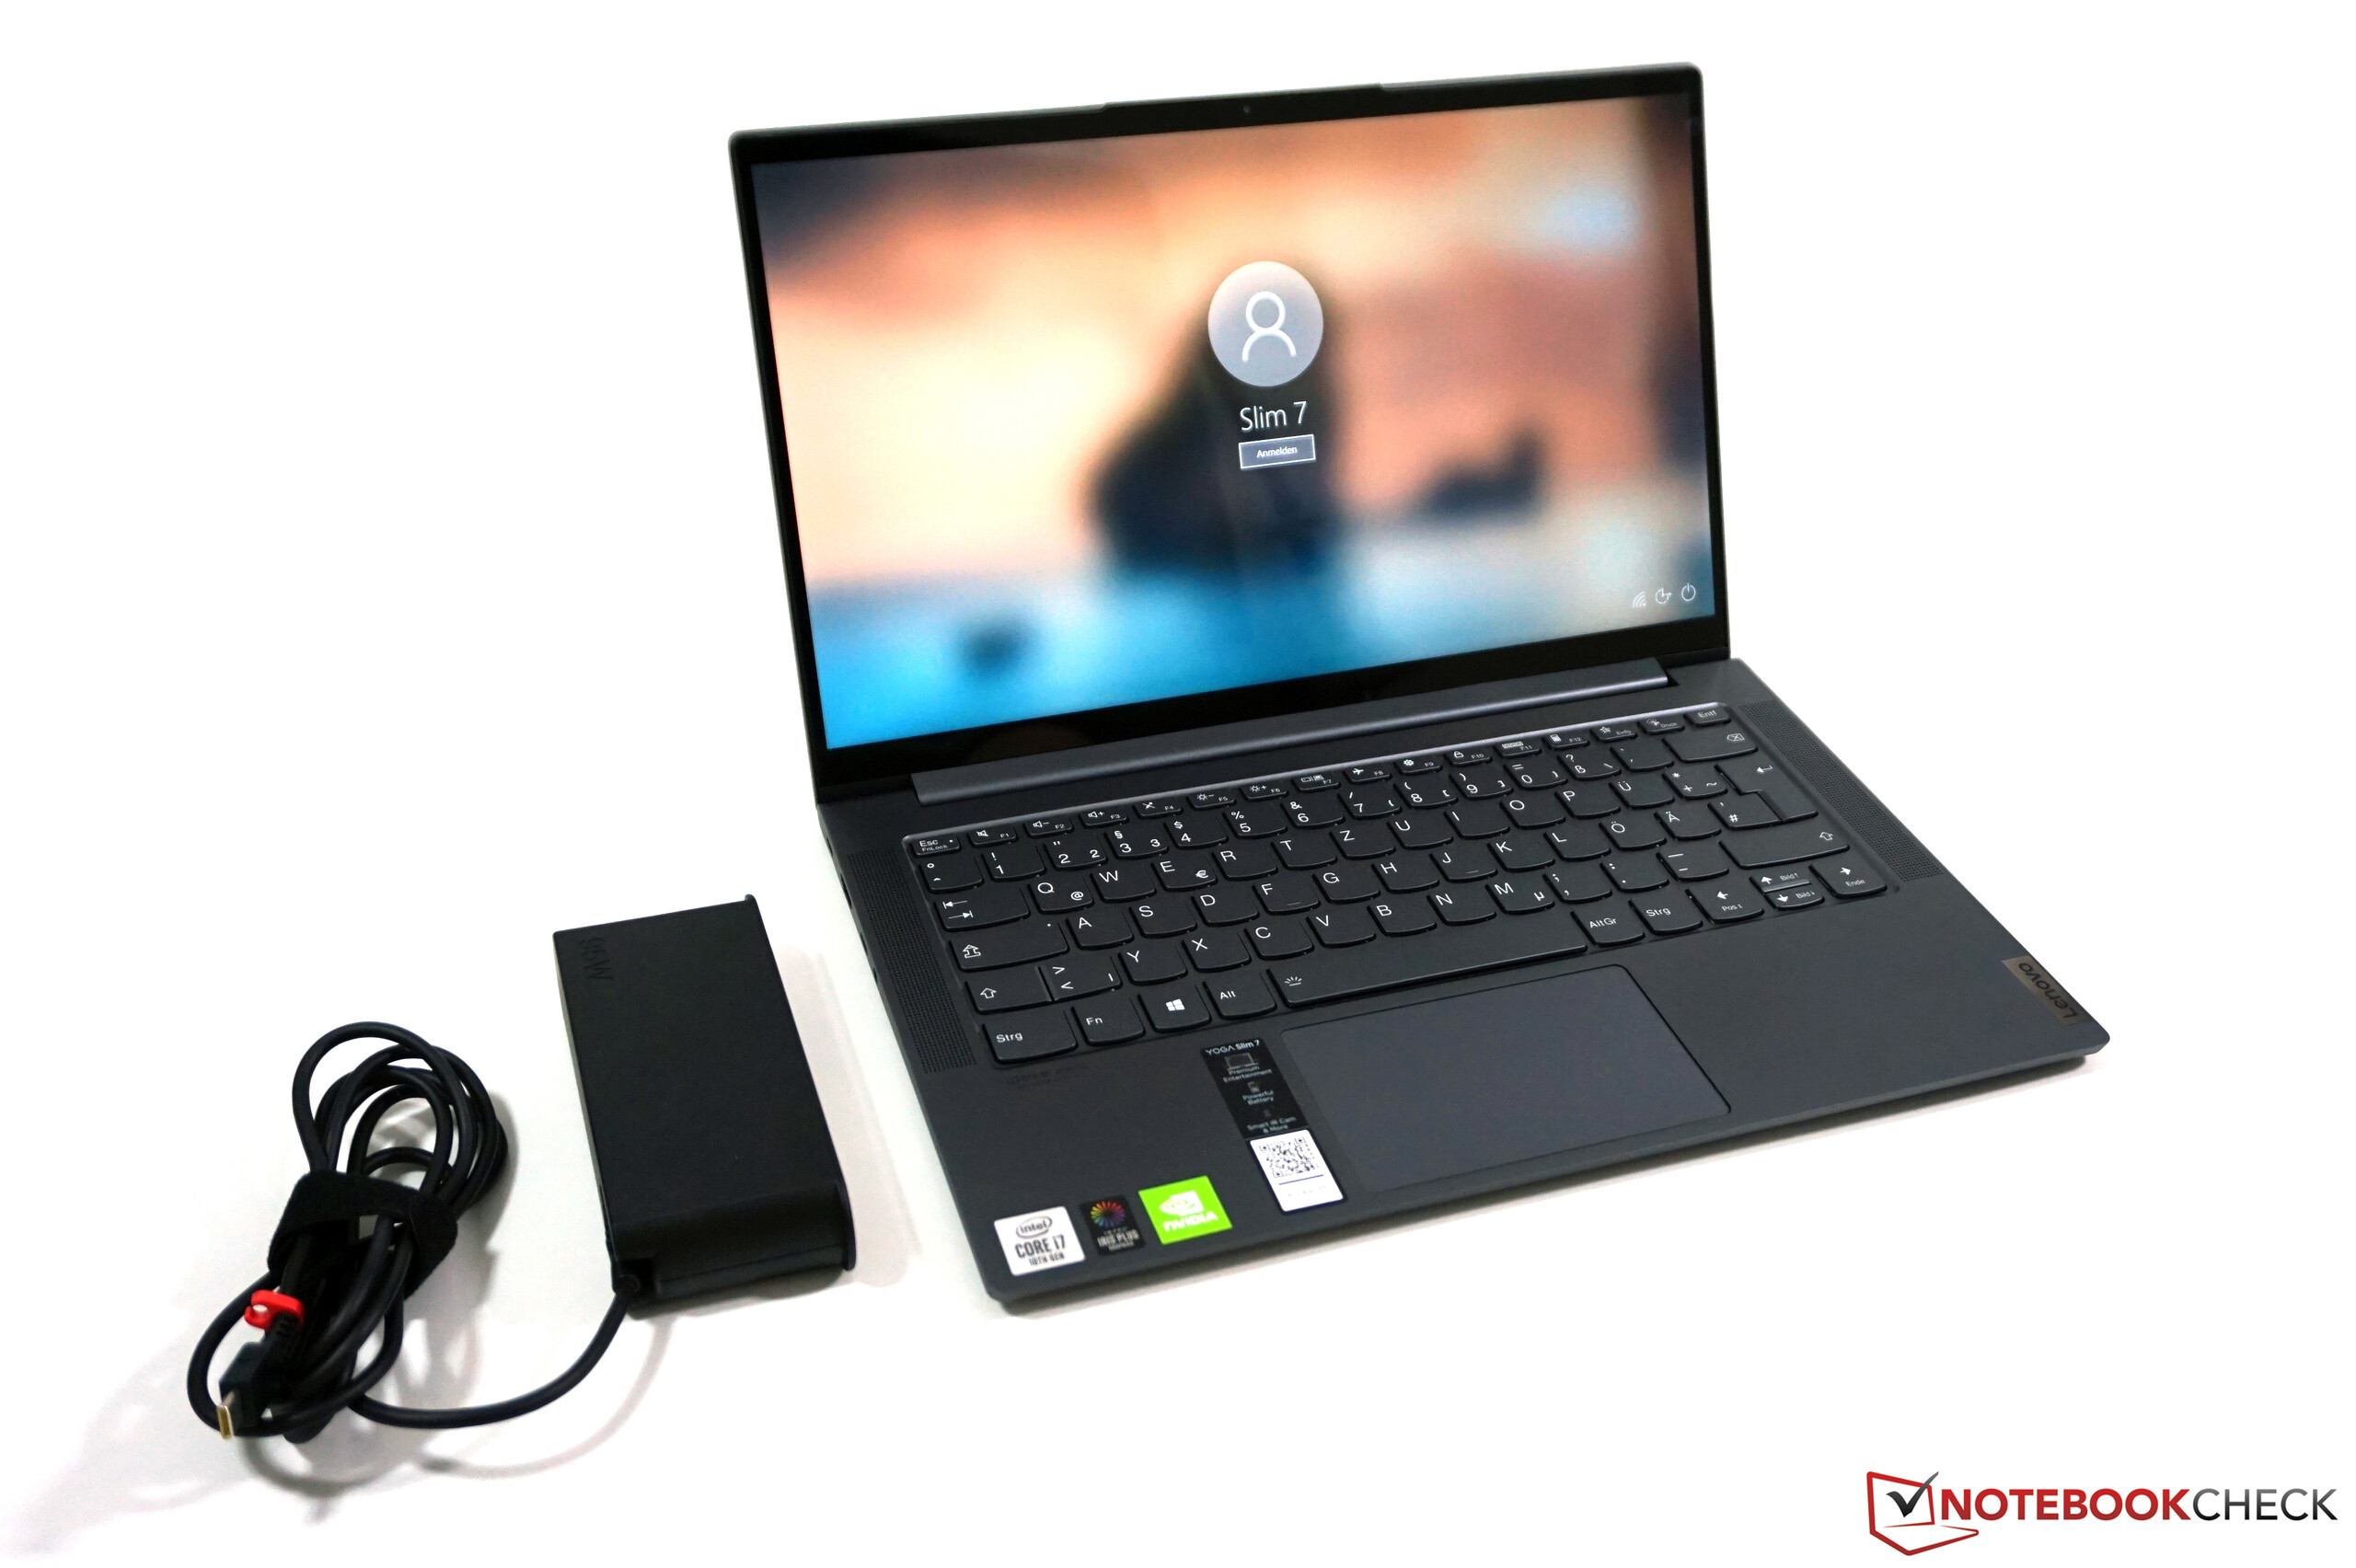
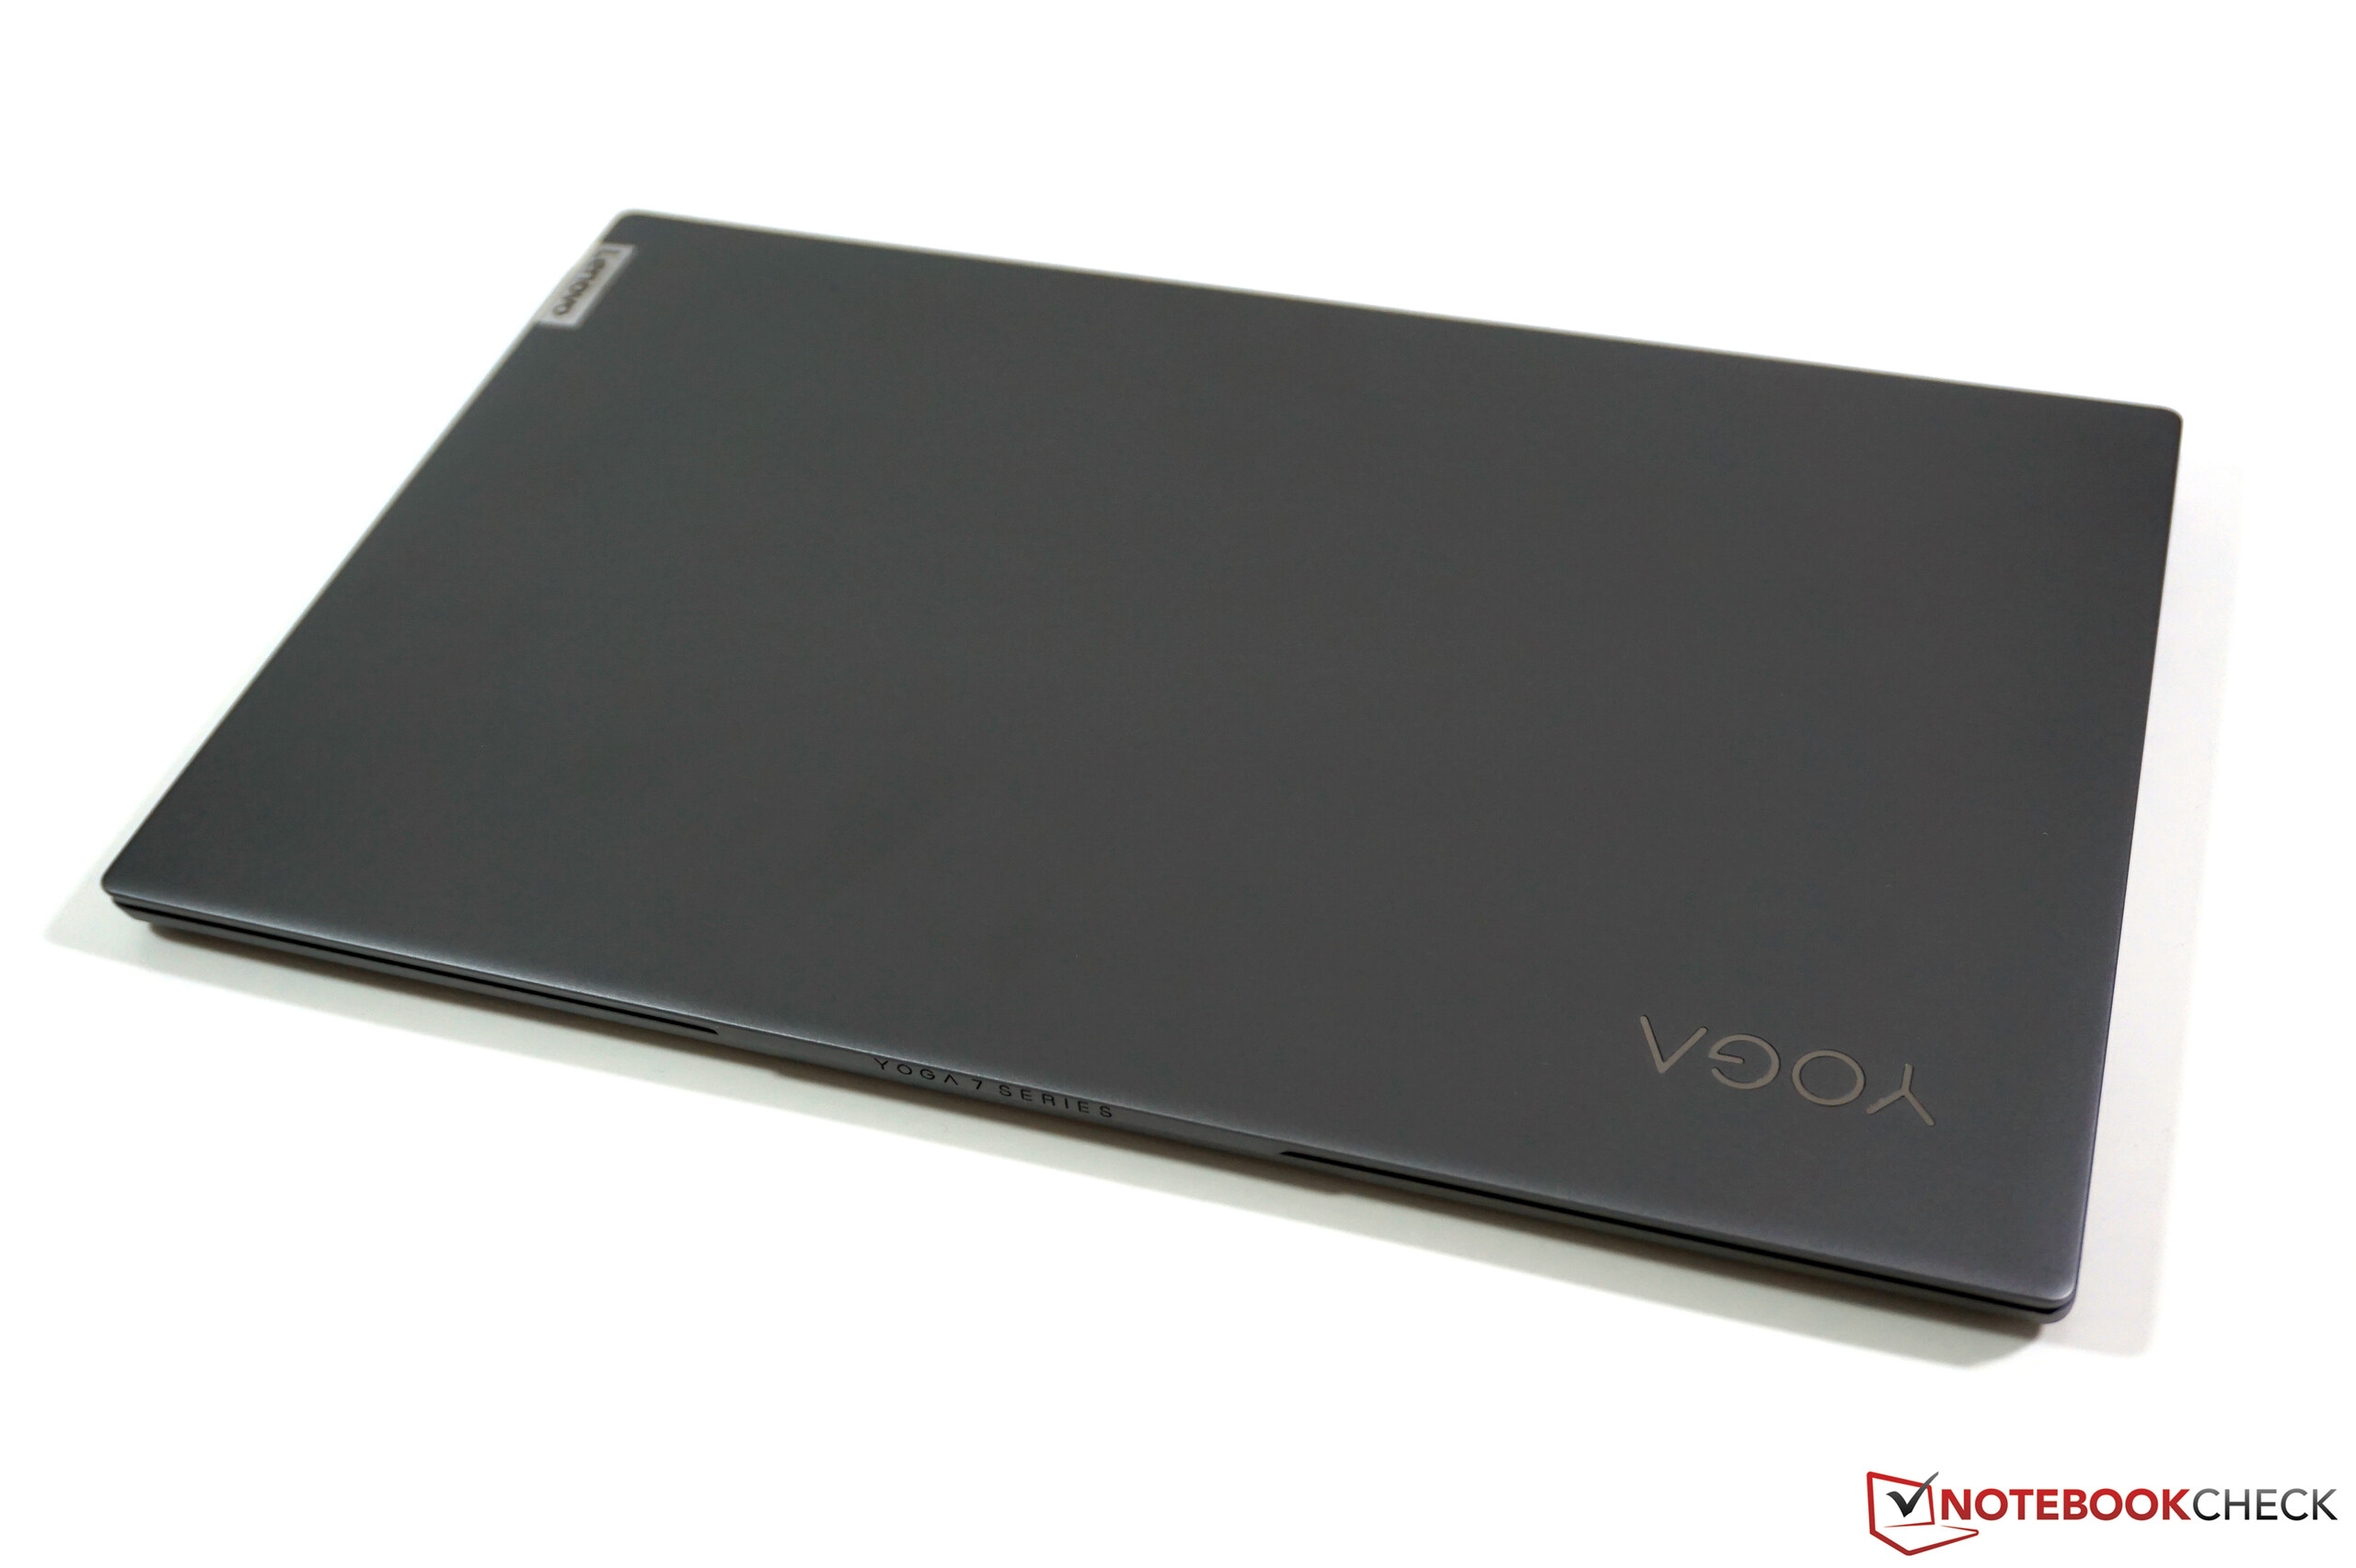
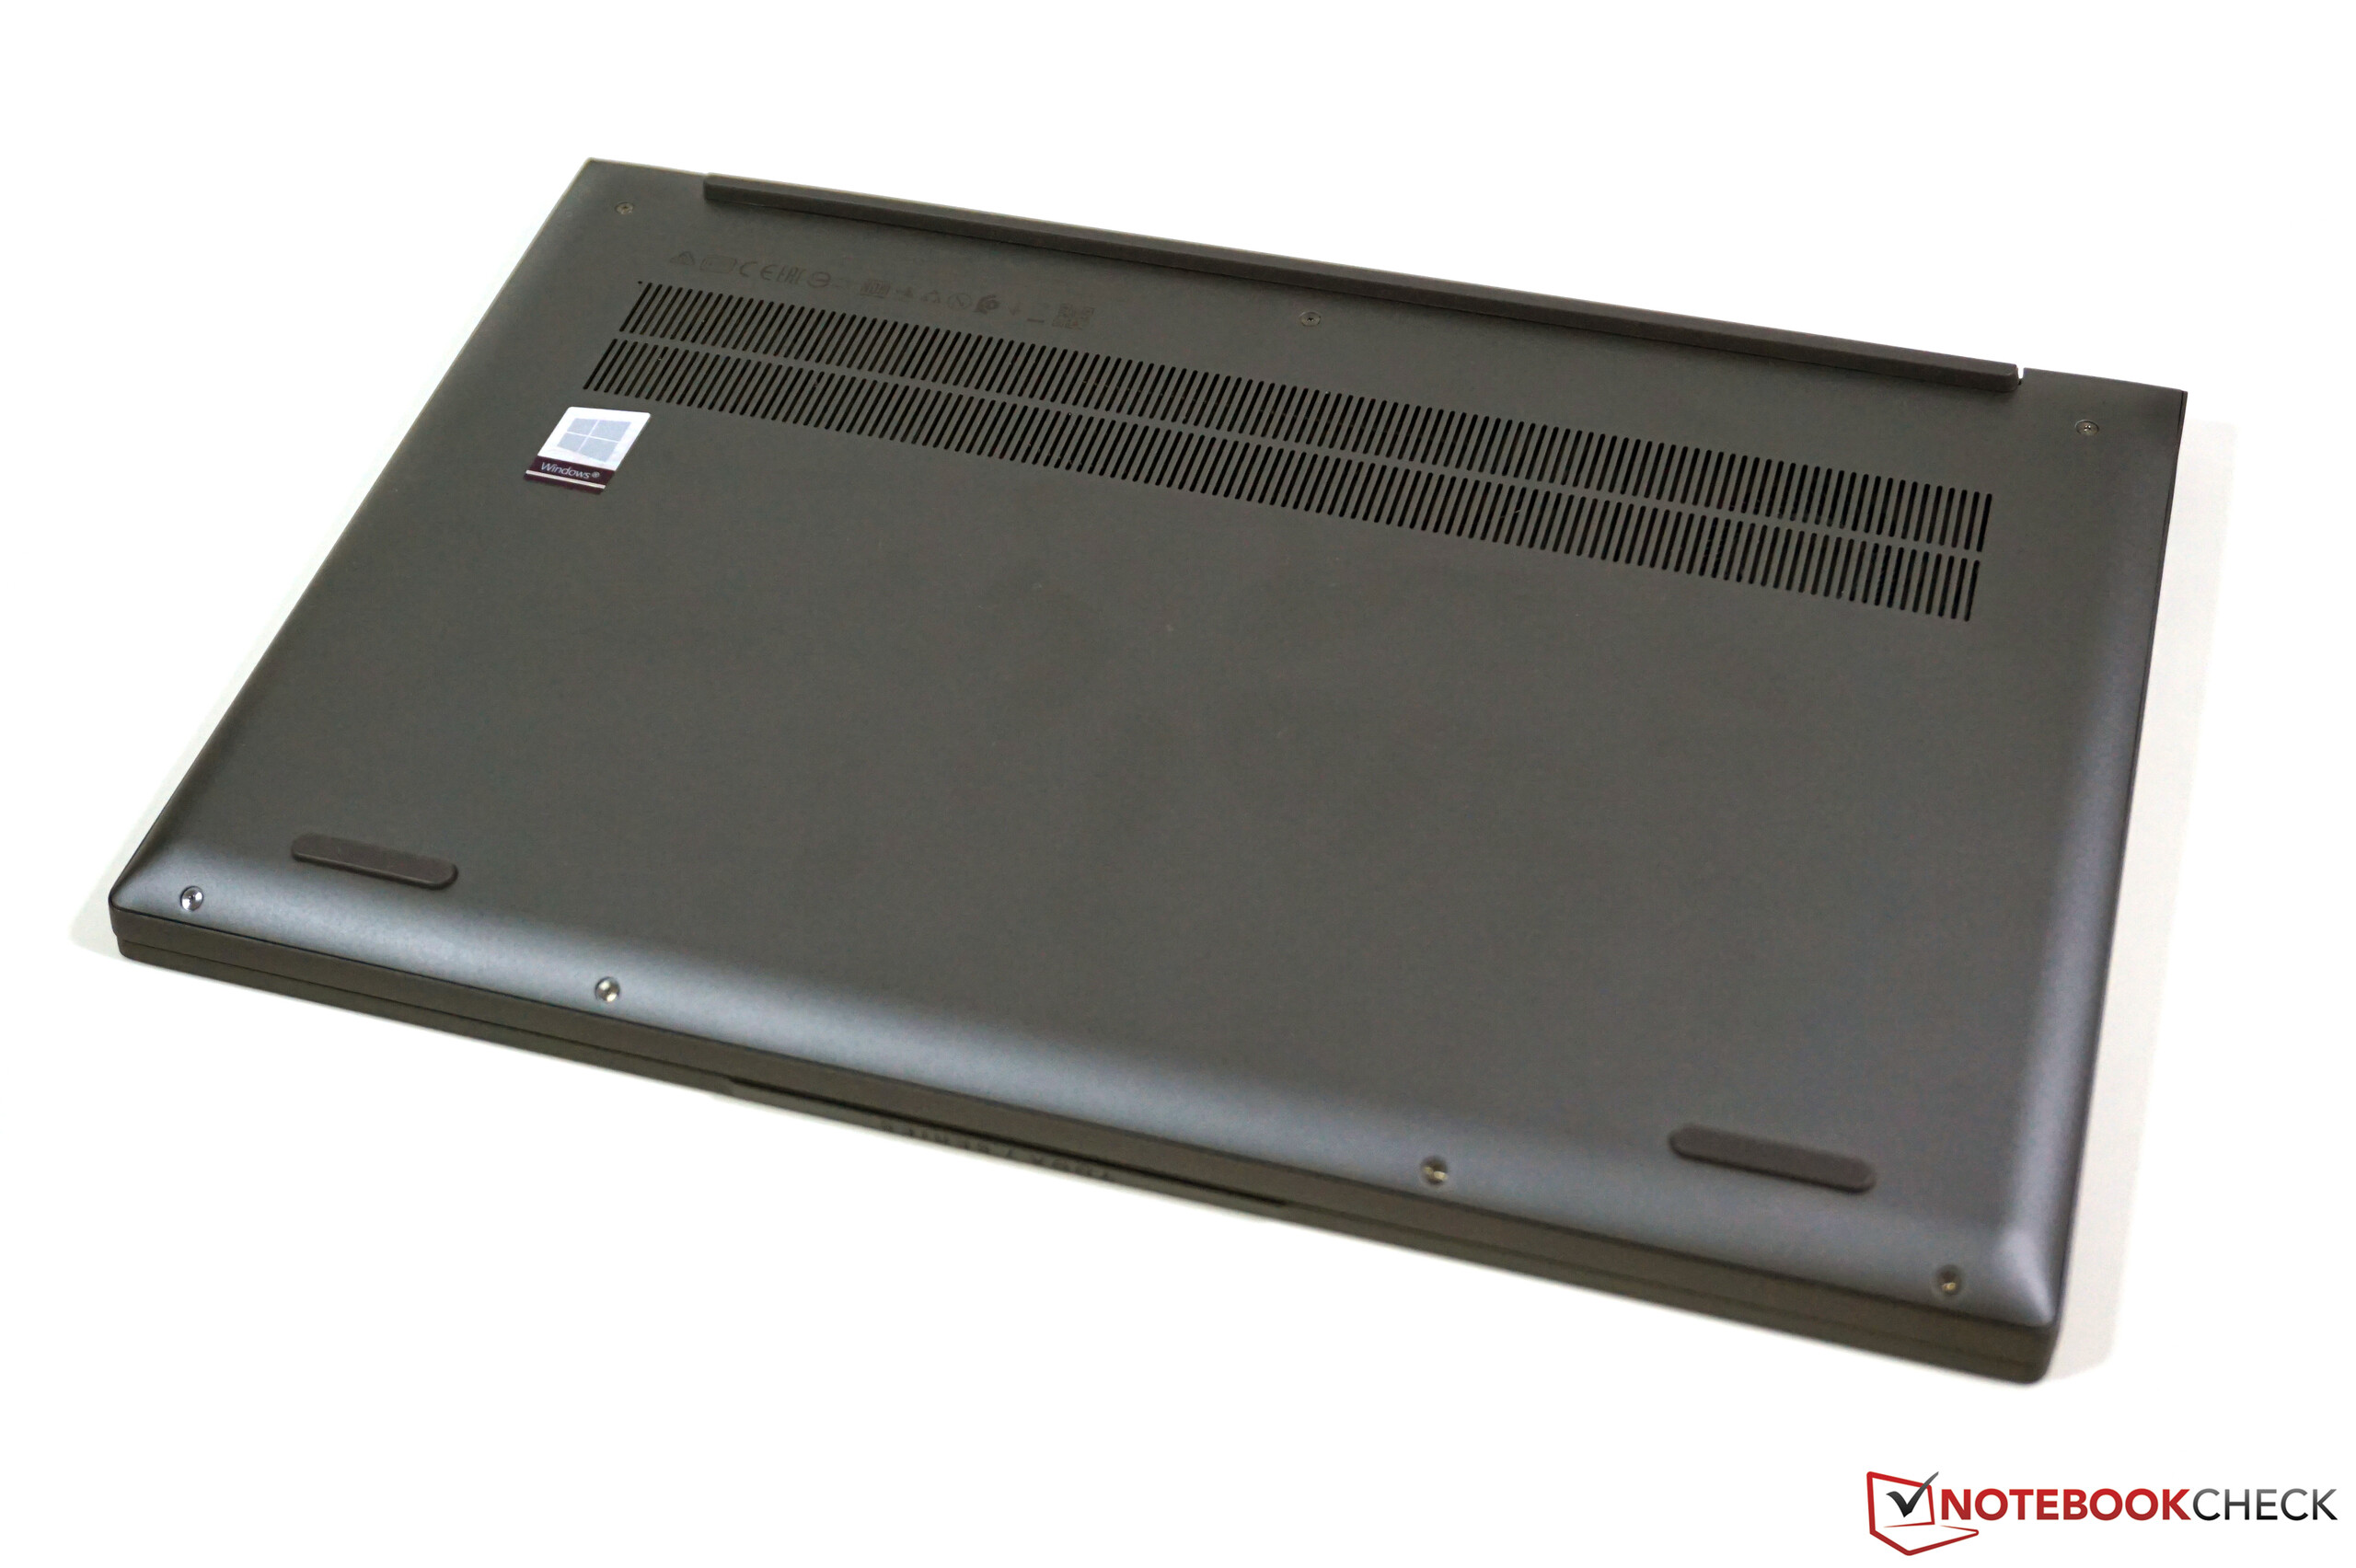
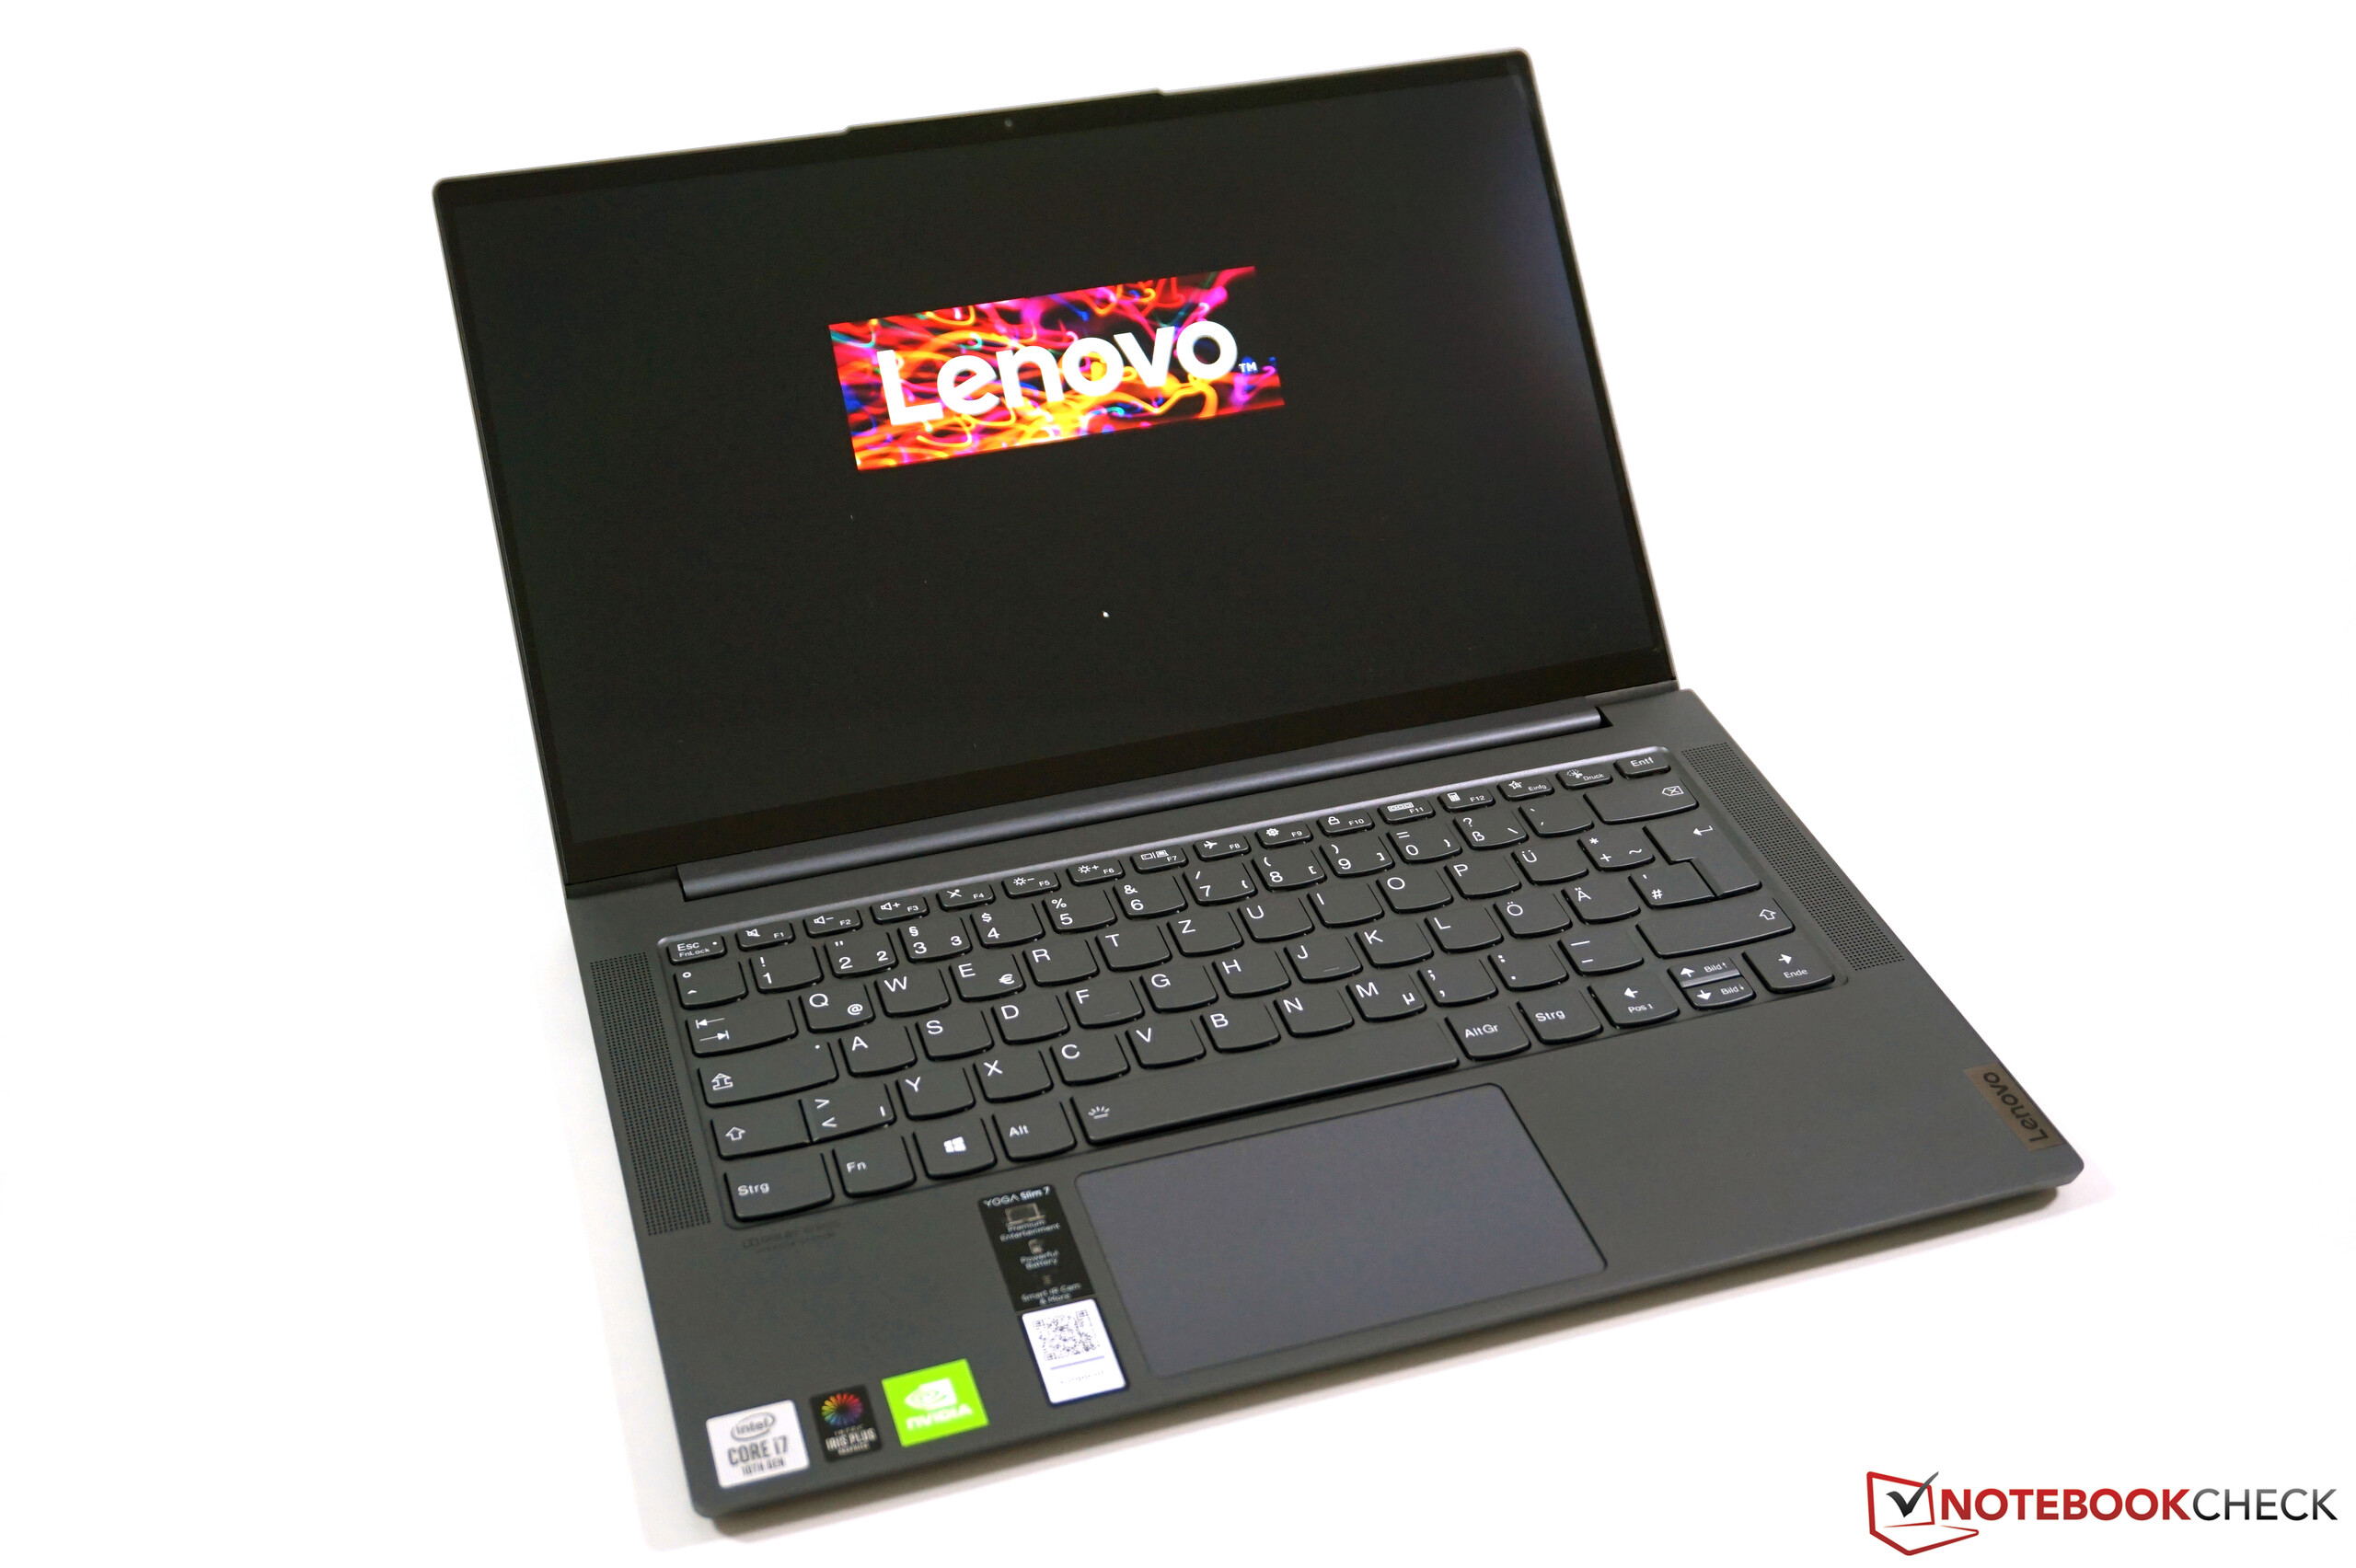
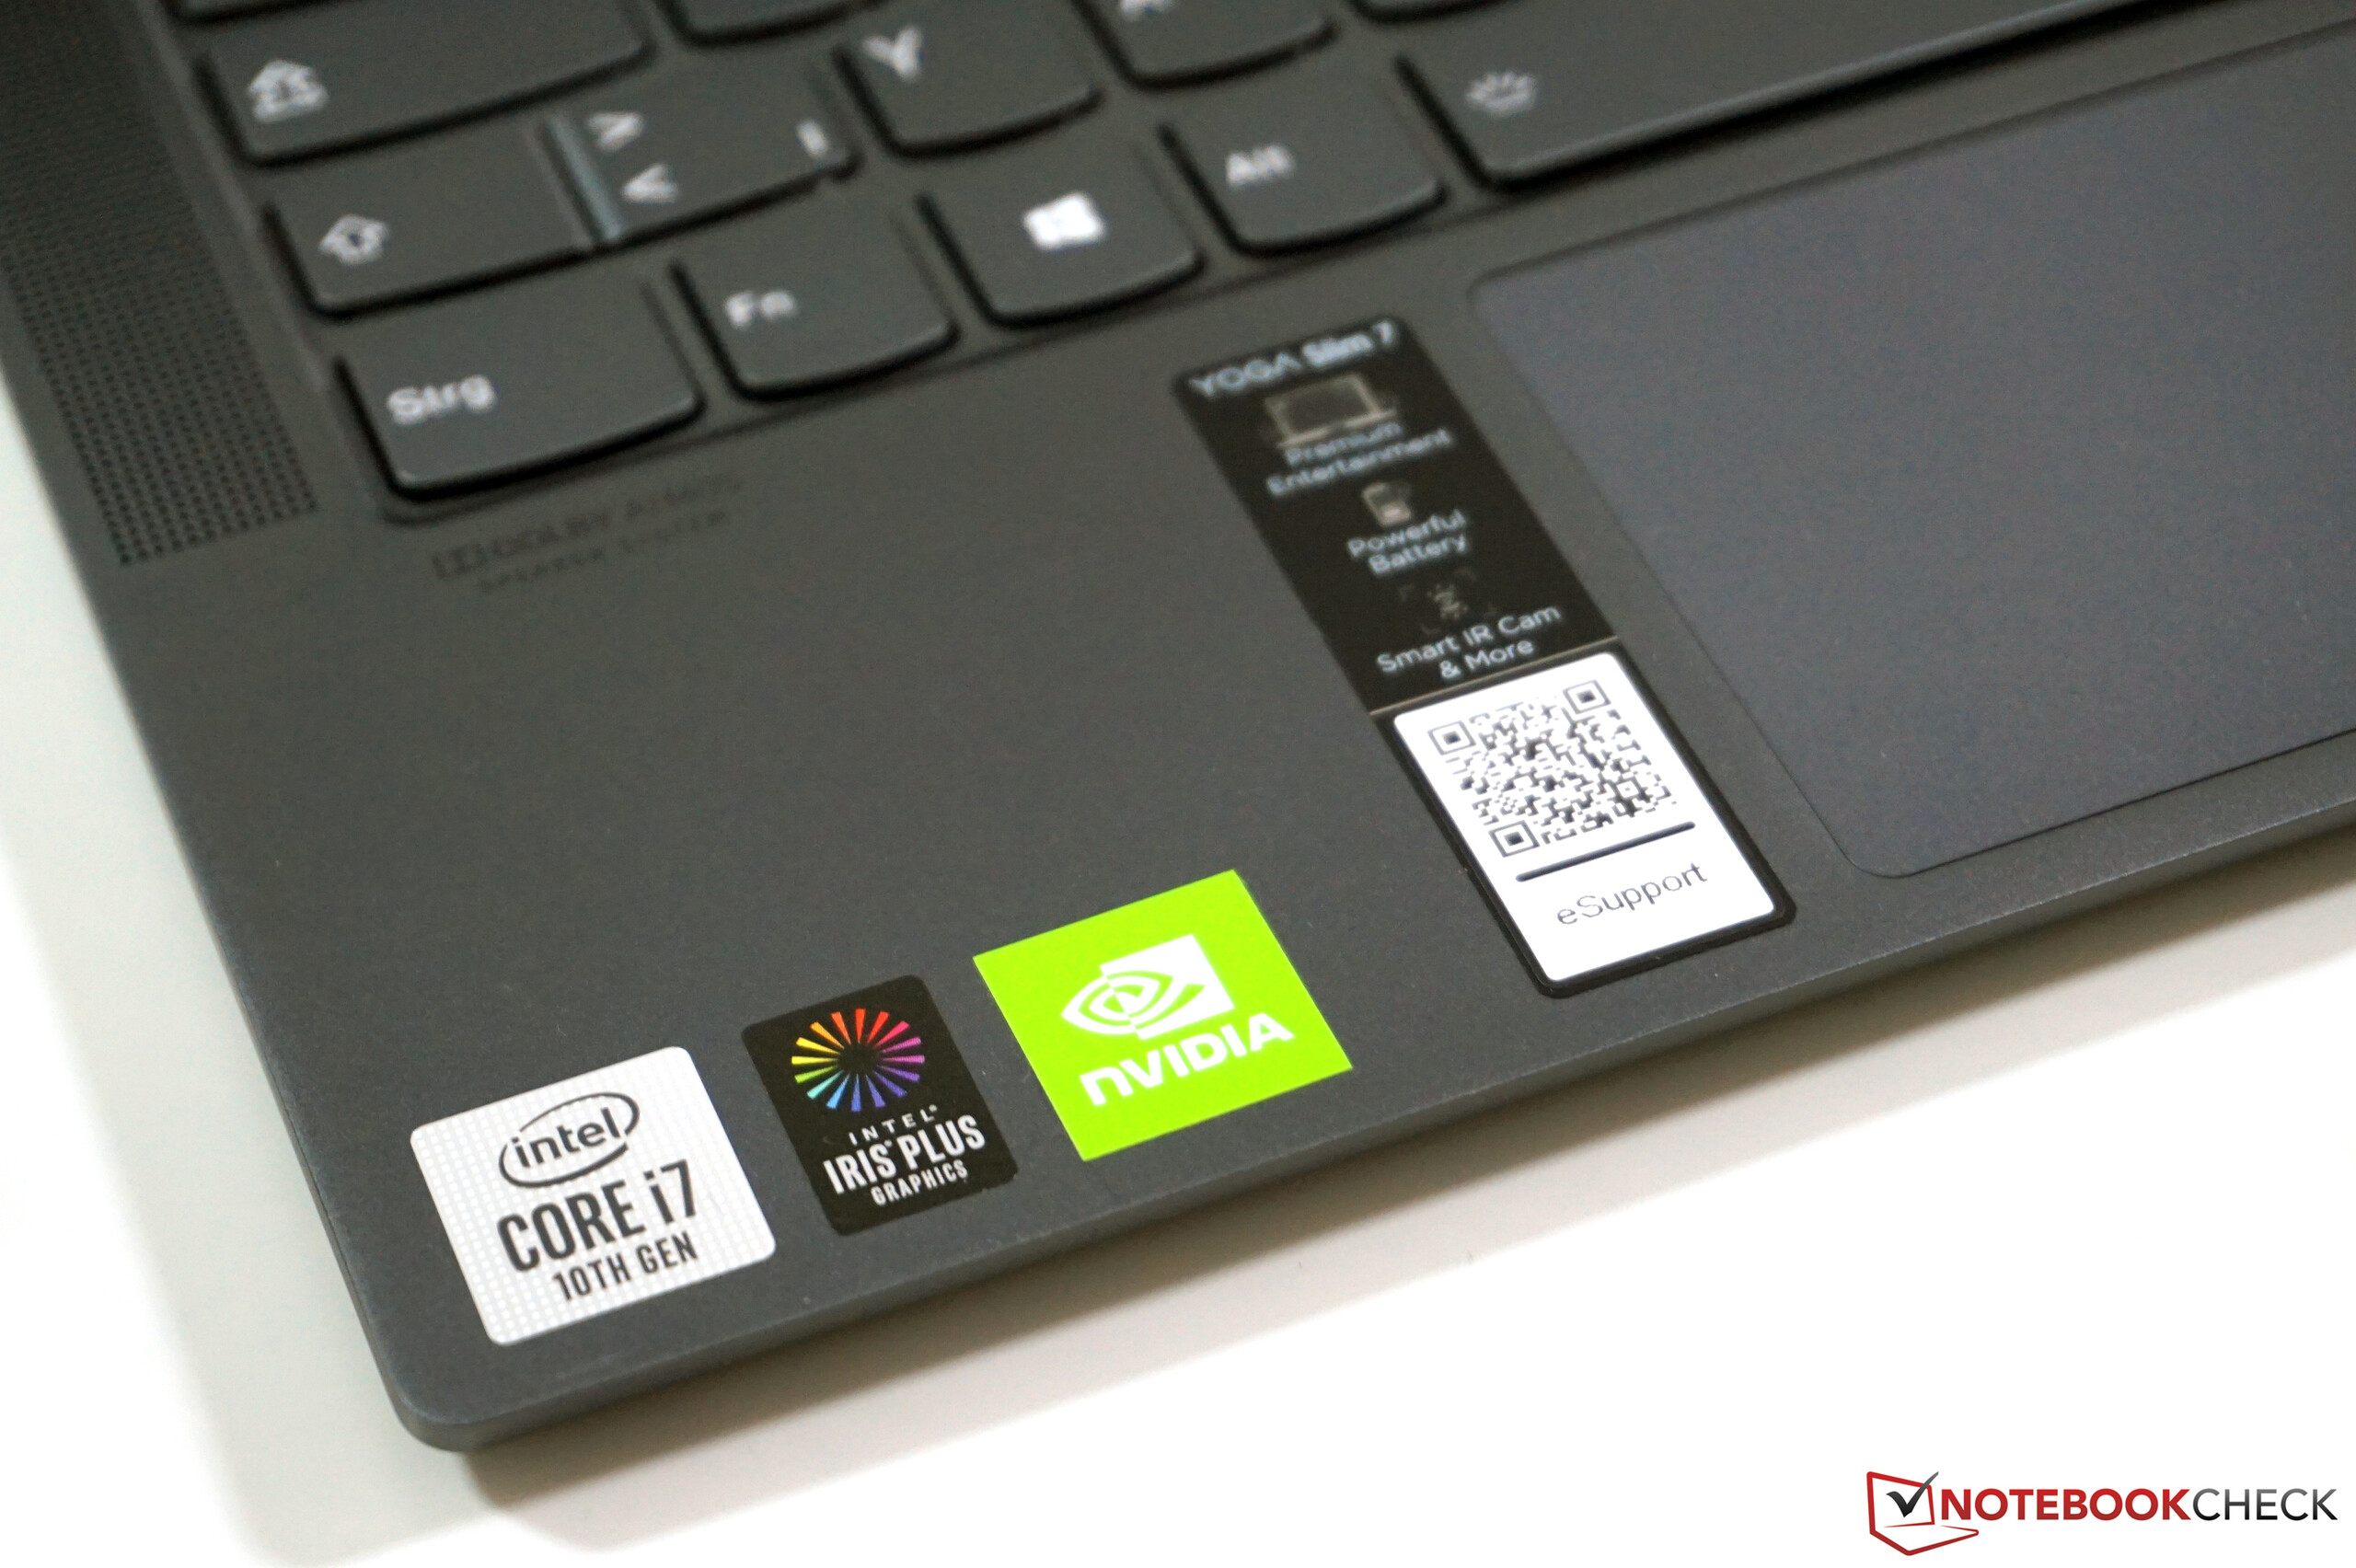
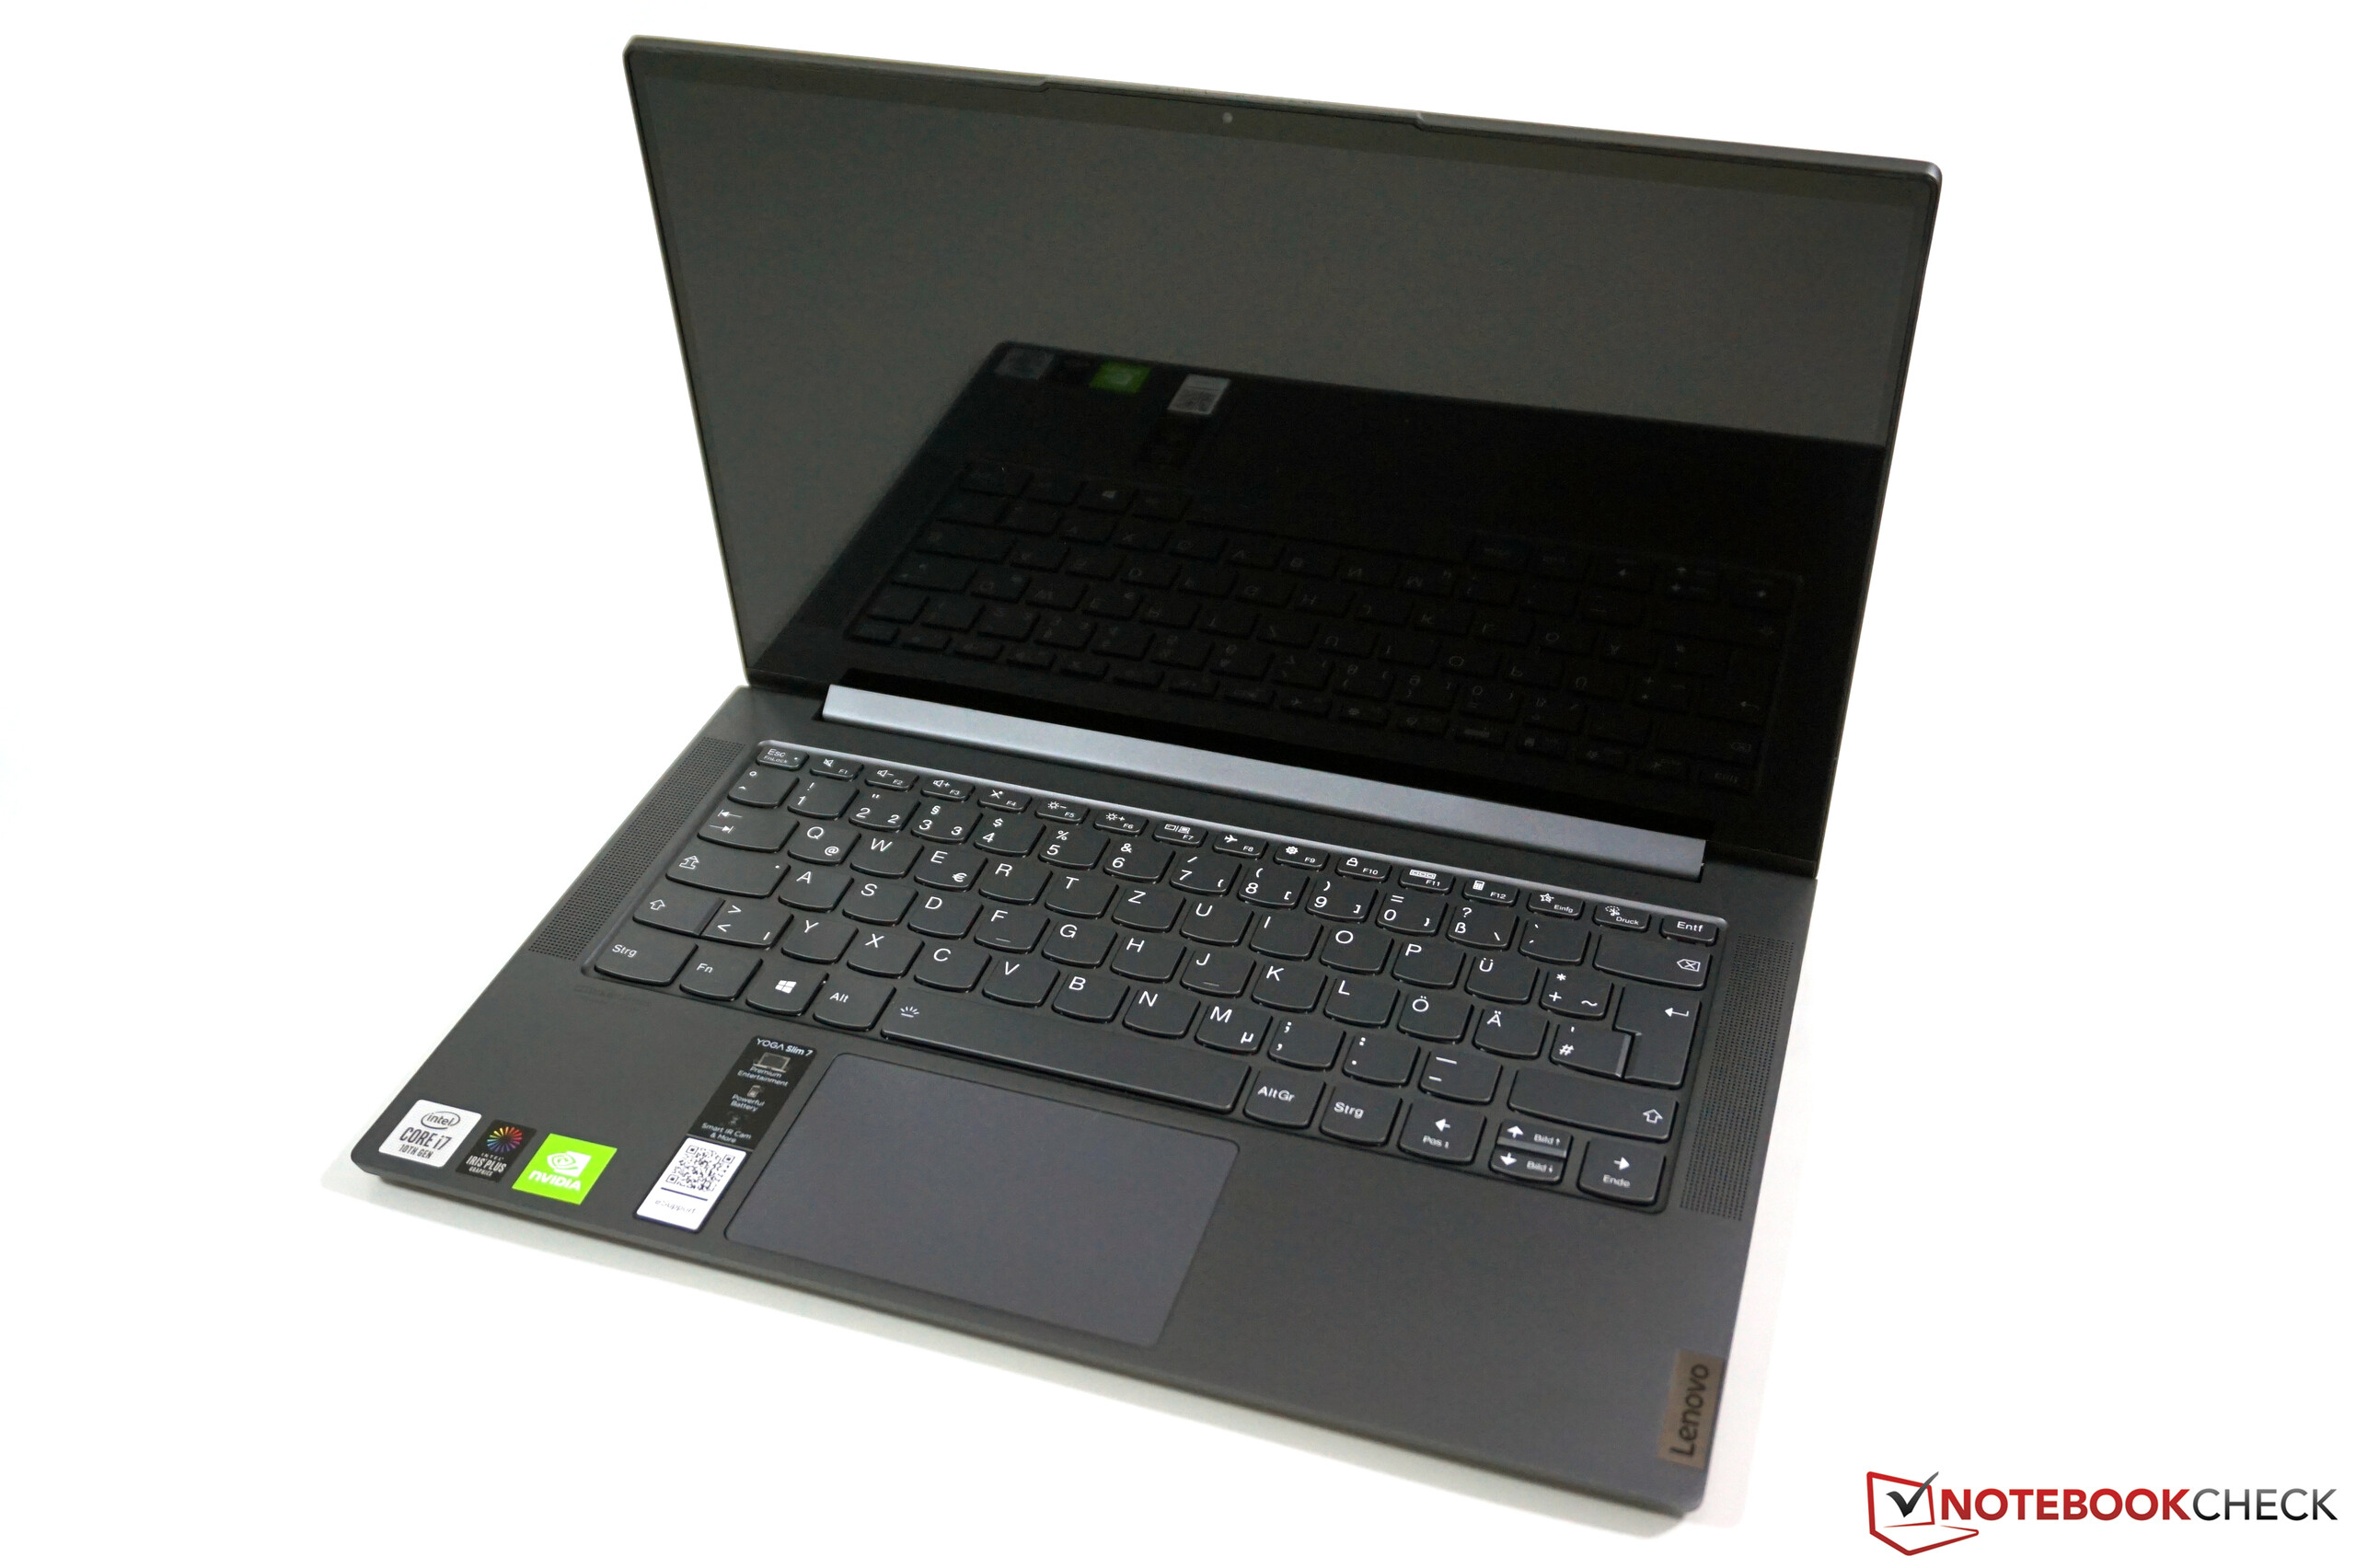
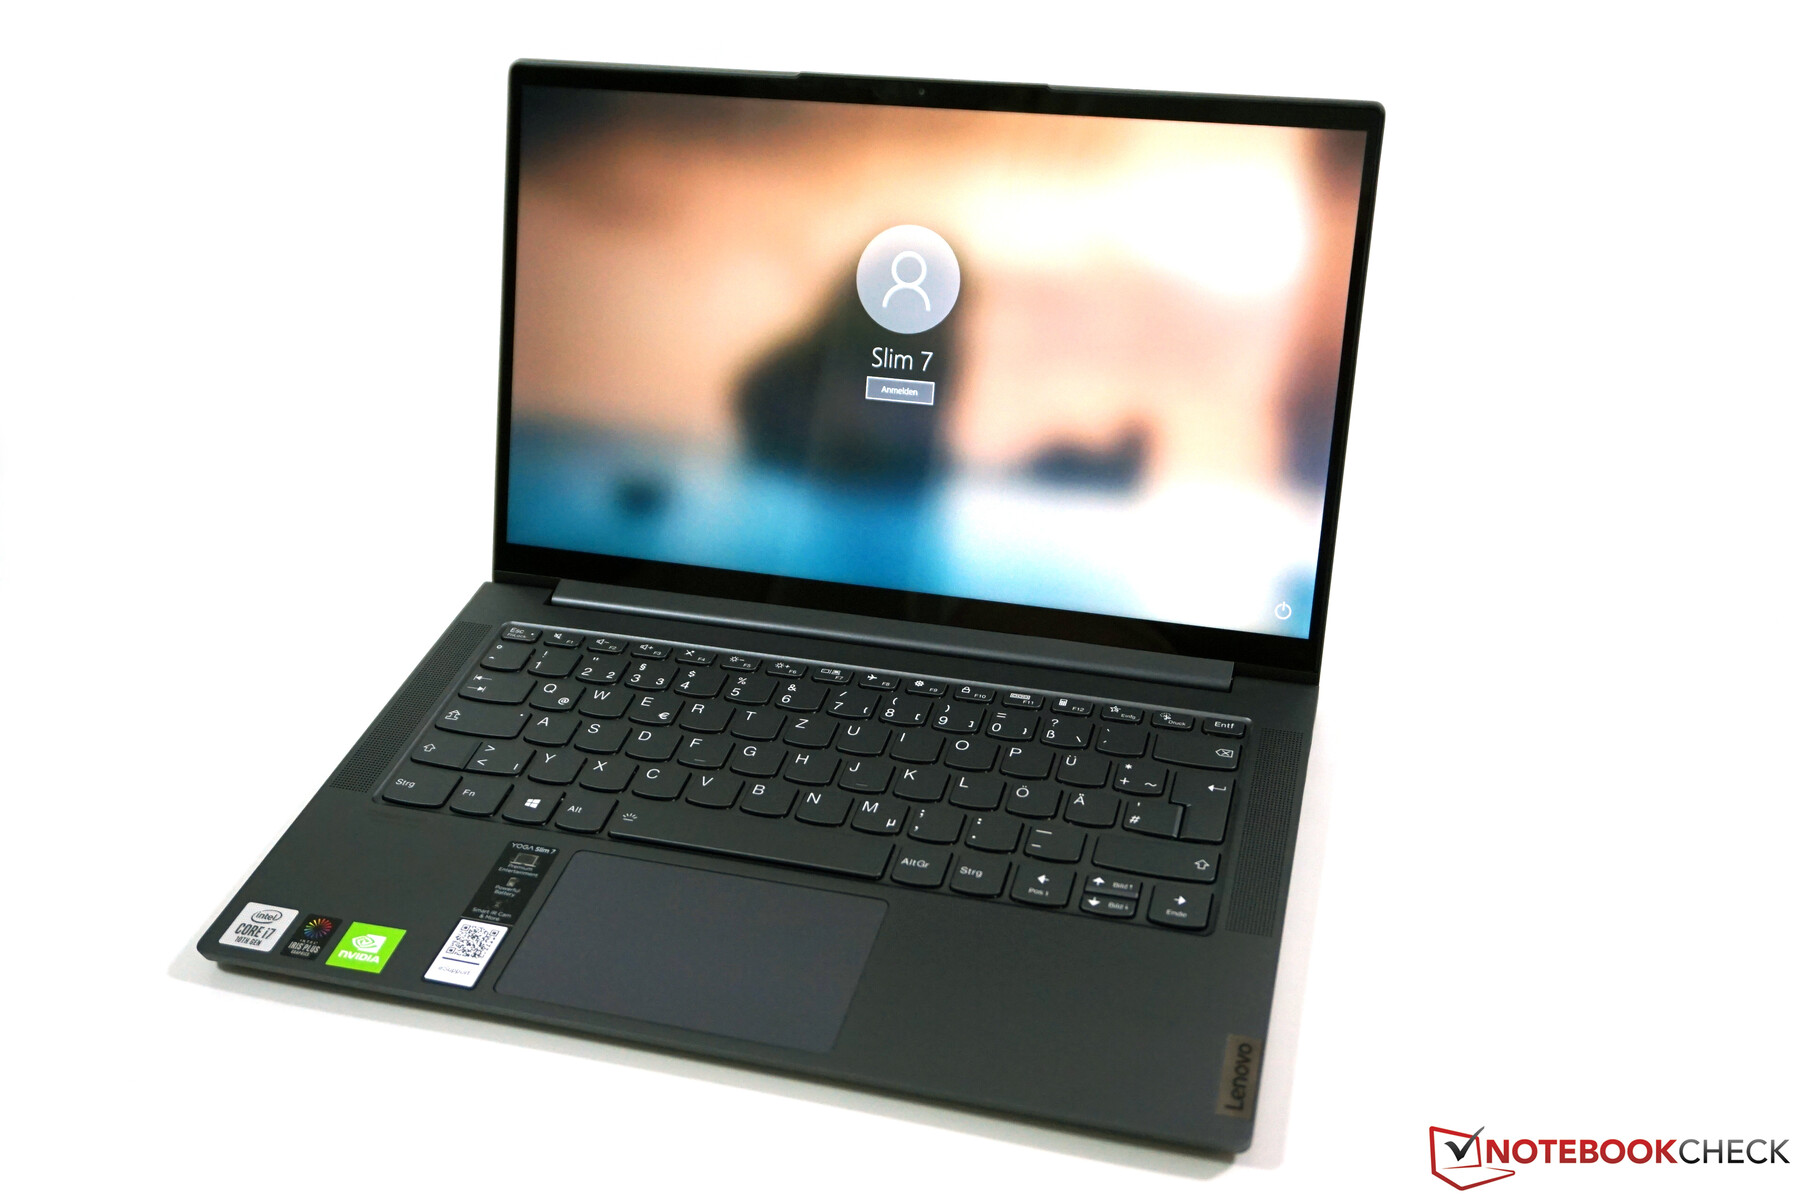
Case - Intel and AMD identical
Besides the manufacturer stickers on the palm rest, the case doesn't differ from the Yoga Slim 7 14 with the AMD processor (reviewed here). There's also only a marginal difference in weight, but you won't notice it even if you compare them directly. The only visible difference is the power adapter, because the power consumption increases due to the additional Nvidia GPU, and you get a 50-gram heavier 95-watt power adapter instead of the 65-watt model.
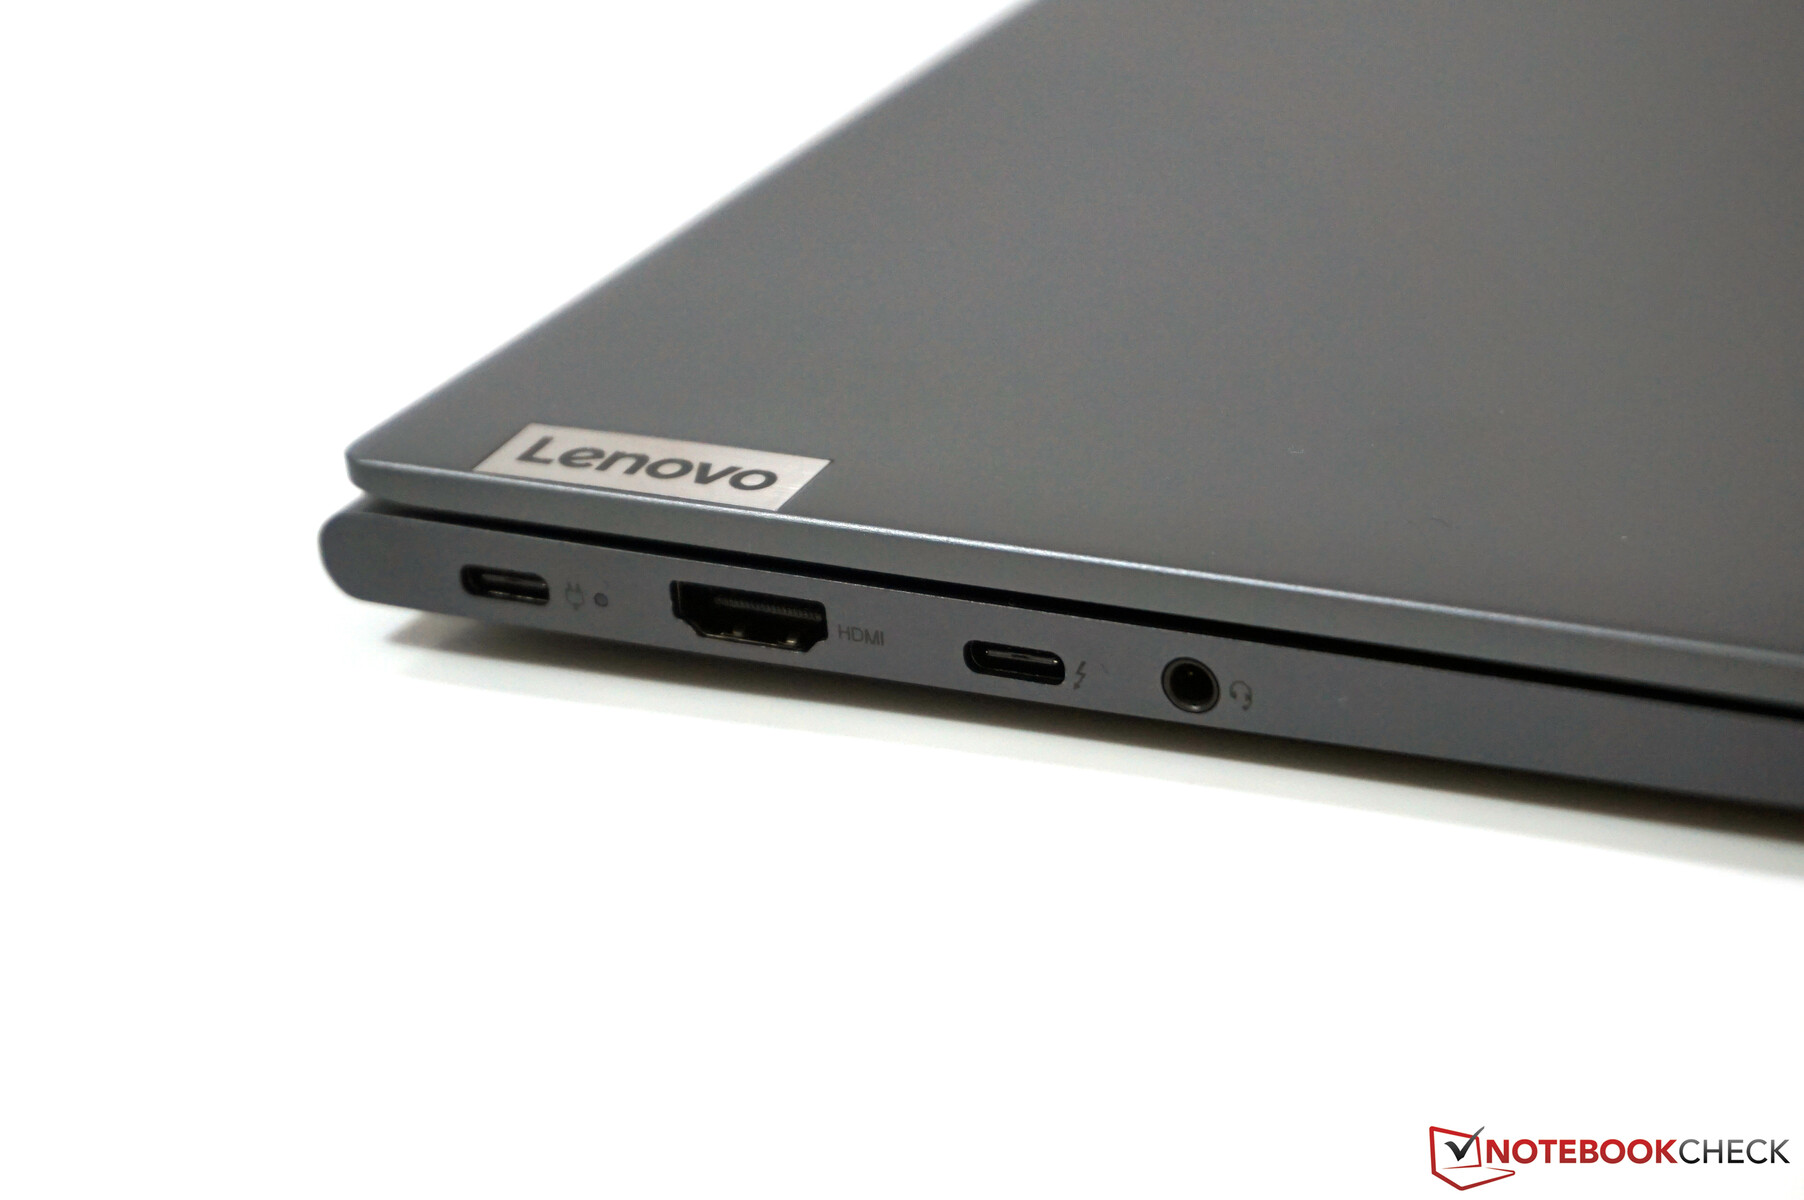
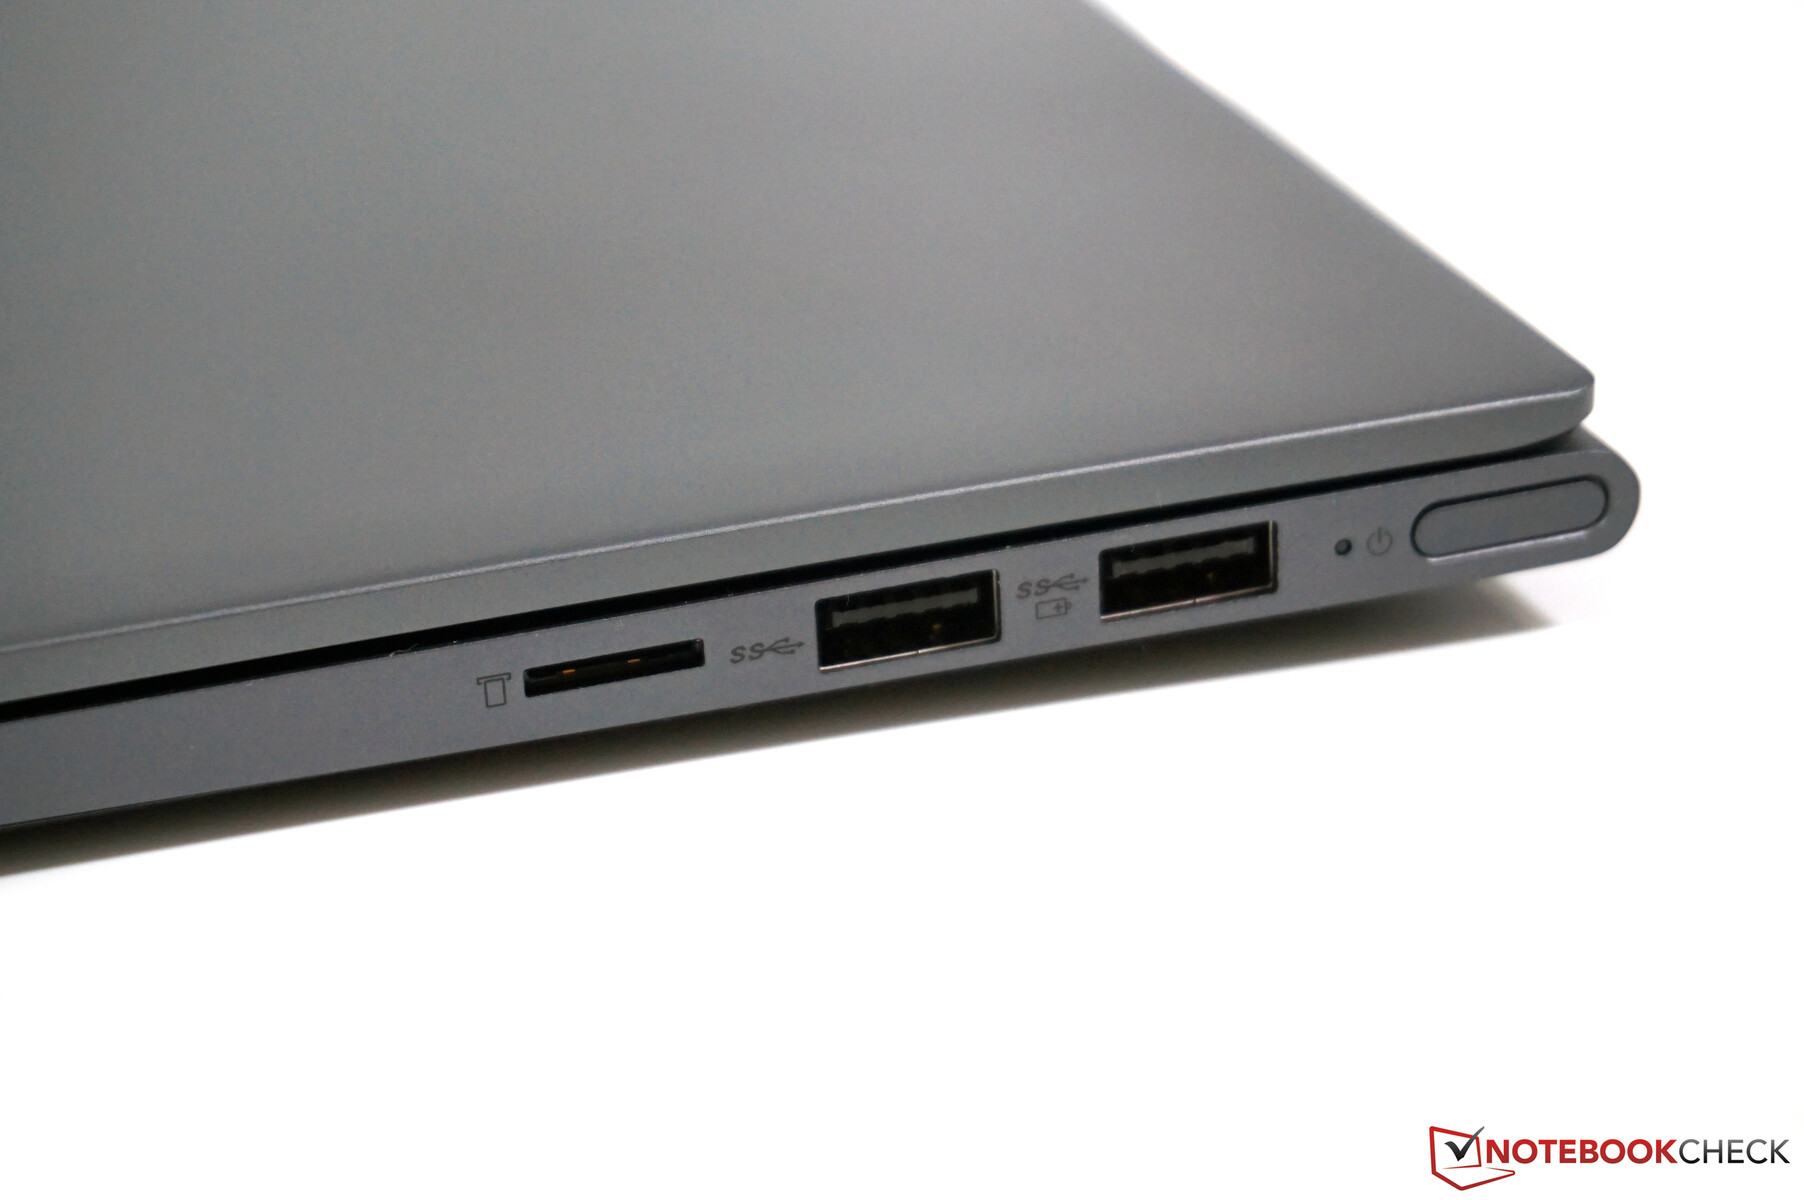
Connectivity - Intel version with Thunderbolt 3
When it comes to the ports, the Intel model of the Yoga Slim 7 14 has a big advantage, as one of the two USB-C ports supports Thunderbolt 3. The Intel model also offers an HDMI 2.0b output, so that 4K monitors can be run at 60 Hz.
| SD Card Reader | |
| average JPG Copy Test (av. of 3 runs) | |
| Average of class Multimedia (21.1 - 198, n=44, last 2 years) | |
| Lenovo Yoga Slim 7-14ARE (Toshiba Exceria Pro M501 64 GB UHS-II) | |
| Asus VivoBook Flip 14 TM420IA (Toshiba Exceria Pro M501 microSDXC 64GB) | |
| Lenovo Yoga Slim 7-14IIL05 (Toshiba Exceria Pro M501 64 GB UHS-II) | |
| Asus ZenBook 14 UX434FL-DB77 (Toshiba Exceria Pro M501 64 GB UHS-II) | |
| maximum AS SSD Seq Read Test (1GB) | |
| Average of class Multimedia (27.4 - 262, n=44, last 2 years) | |
| Lenovo Yoga Slim 7-14ARE (Toshiba Exceria Pro M501 64 GB UHS-II) | |
| Asus VivoBook Flip 14 TM420IA (Toshiba Exceria Pro M501 microSDXC 64GB) | |
| Lenovo Yoga Slim 7-14IIL05 (Toshiba Exceria Pro M501 64 GB UHS-II) | |
| Asus ZenBook 14 UX434FL-DB77 (Toshiba Exceria Pro M501 64 GB UHS-II) | |


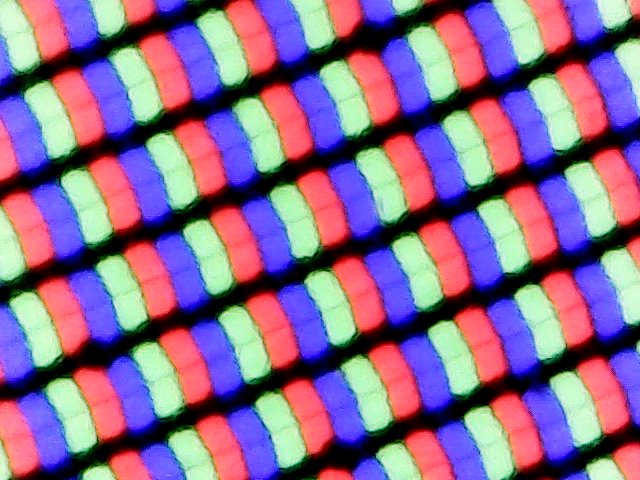
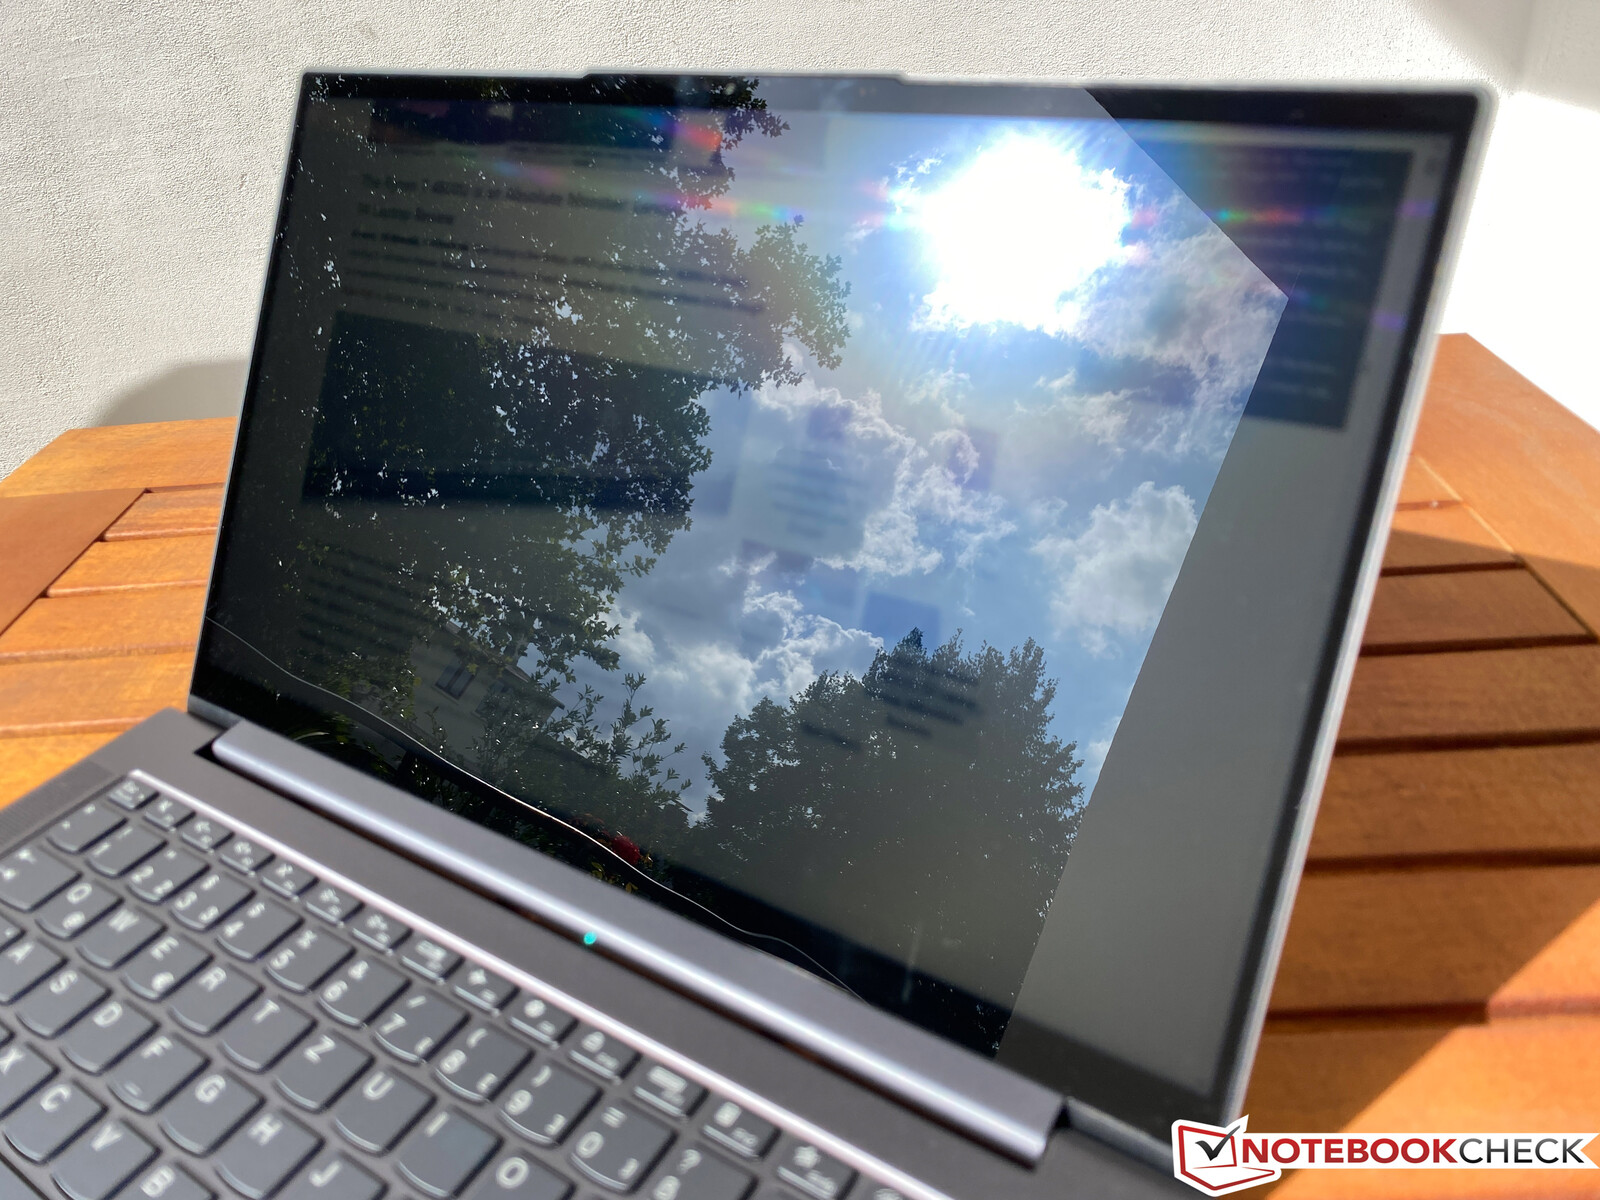
Display - Yoga with reflective 1080p panel
As with the AMD model, a matte Full HD display is built in, but this is a panel from another supplier. As with the ThinkPad models, Lenovo also uses different suppliers for the Yoga. On our current test device, however, the reflective display is significantly dimmer at around 290 cd/m², which is particularly noticeable in bright rooms and, of course, outdoors as well. Nonetheless, the subjective impression left by the display is good and benefits from the very low black value, which is why the contrast ratio is also excellent at 1,700:1.

| |||||||||||||||||||||||||
Brightness Distribution: 92 %
Center on Battery: 289 cd/m²
Contrast: 1700:1 (Black: 0.17 cd/m²)
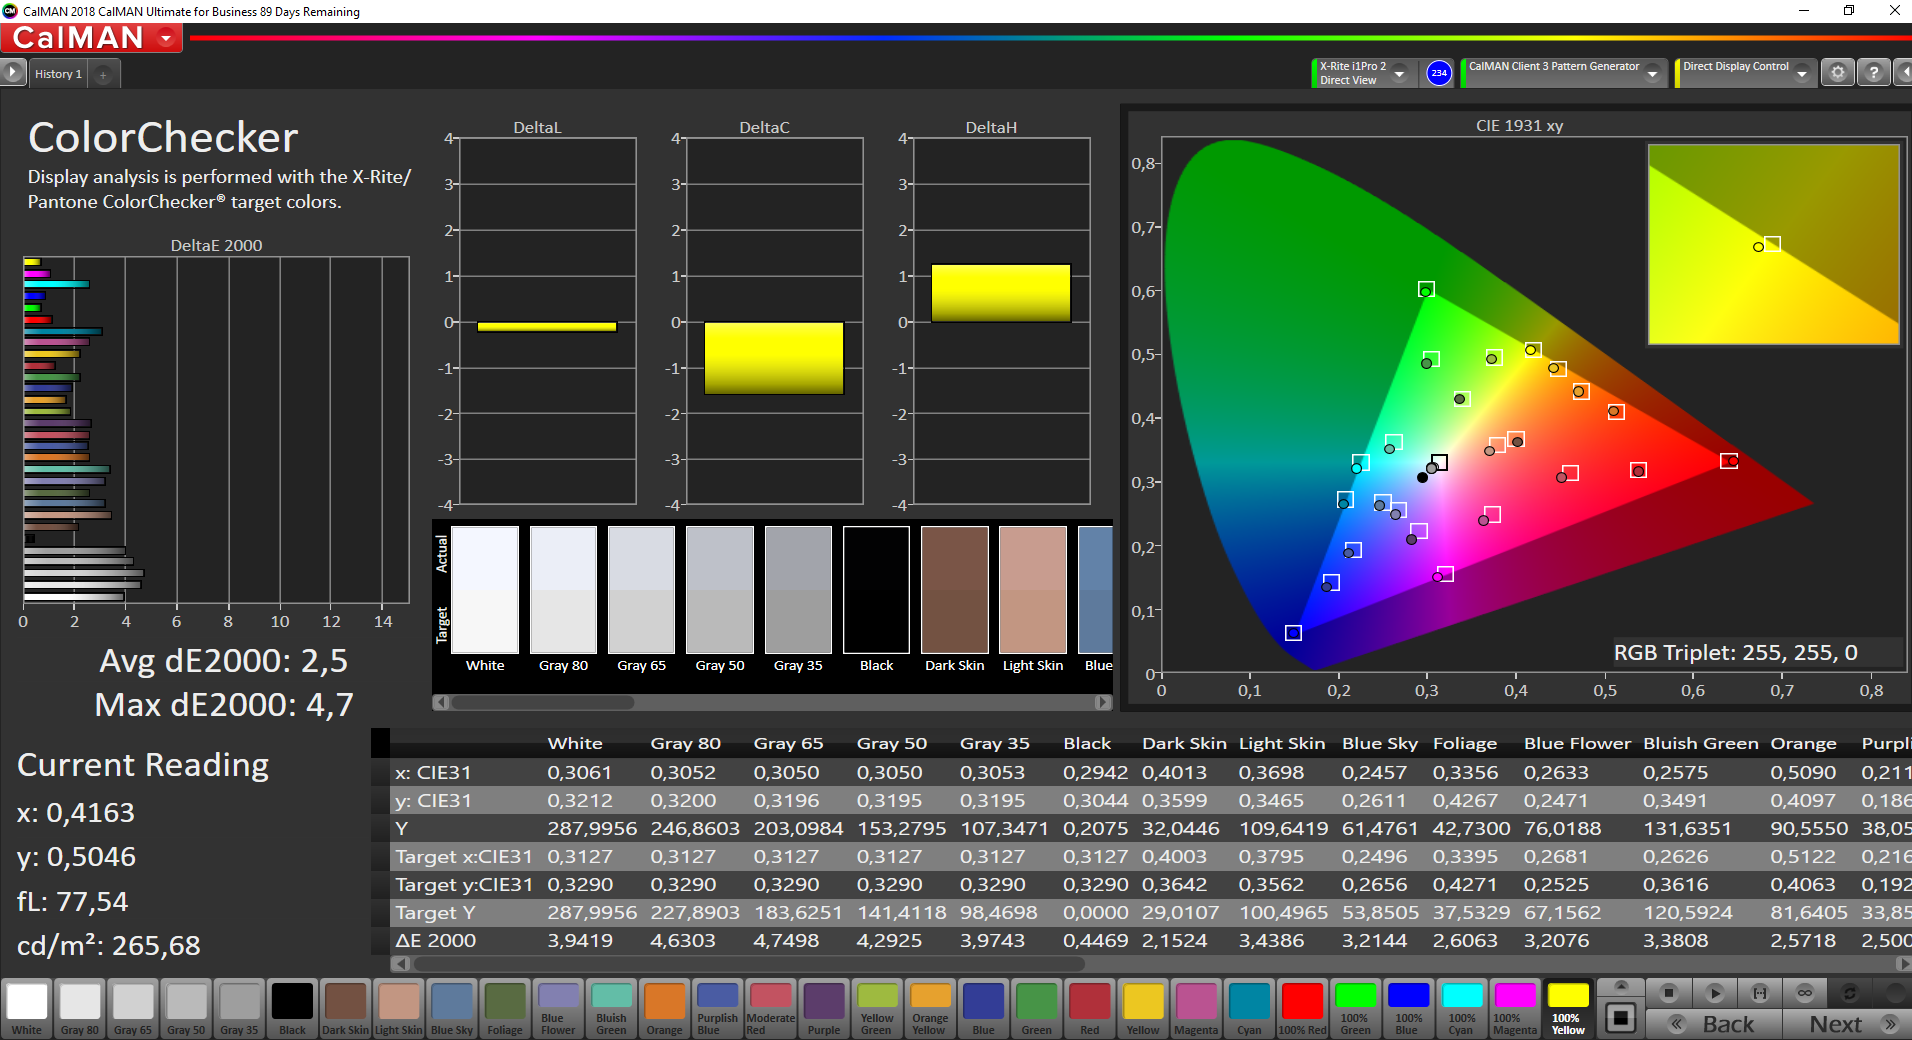
ΔE ColorChecker Calman: 2.5 | ∀{0.5-29.43 Ø4.81}
calibrated: 0.6
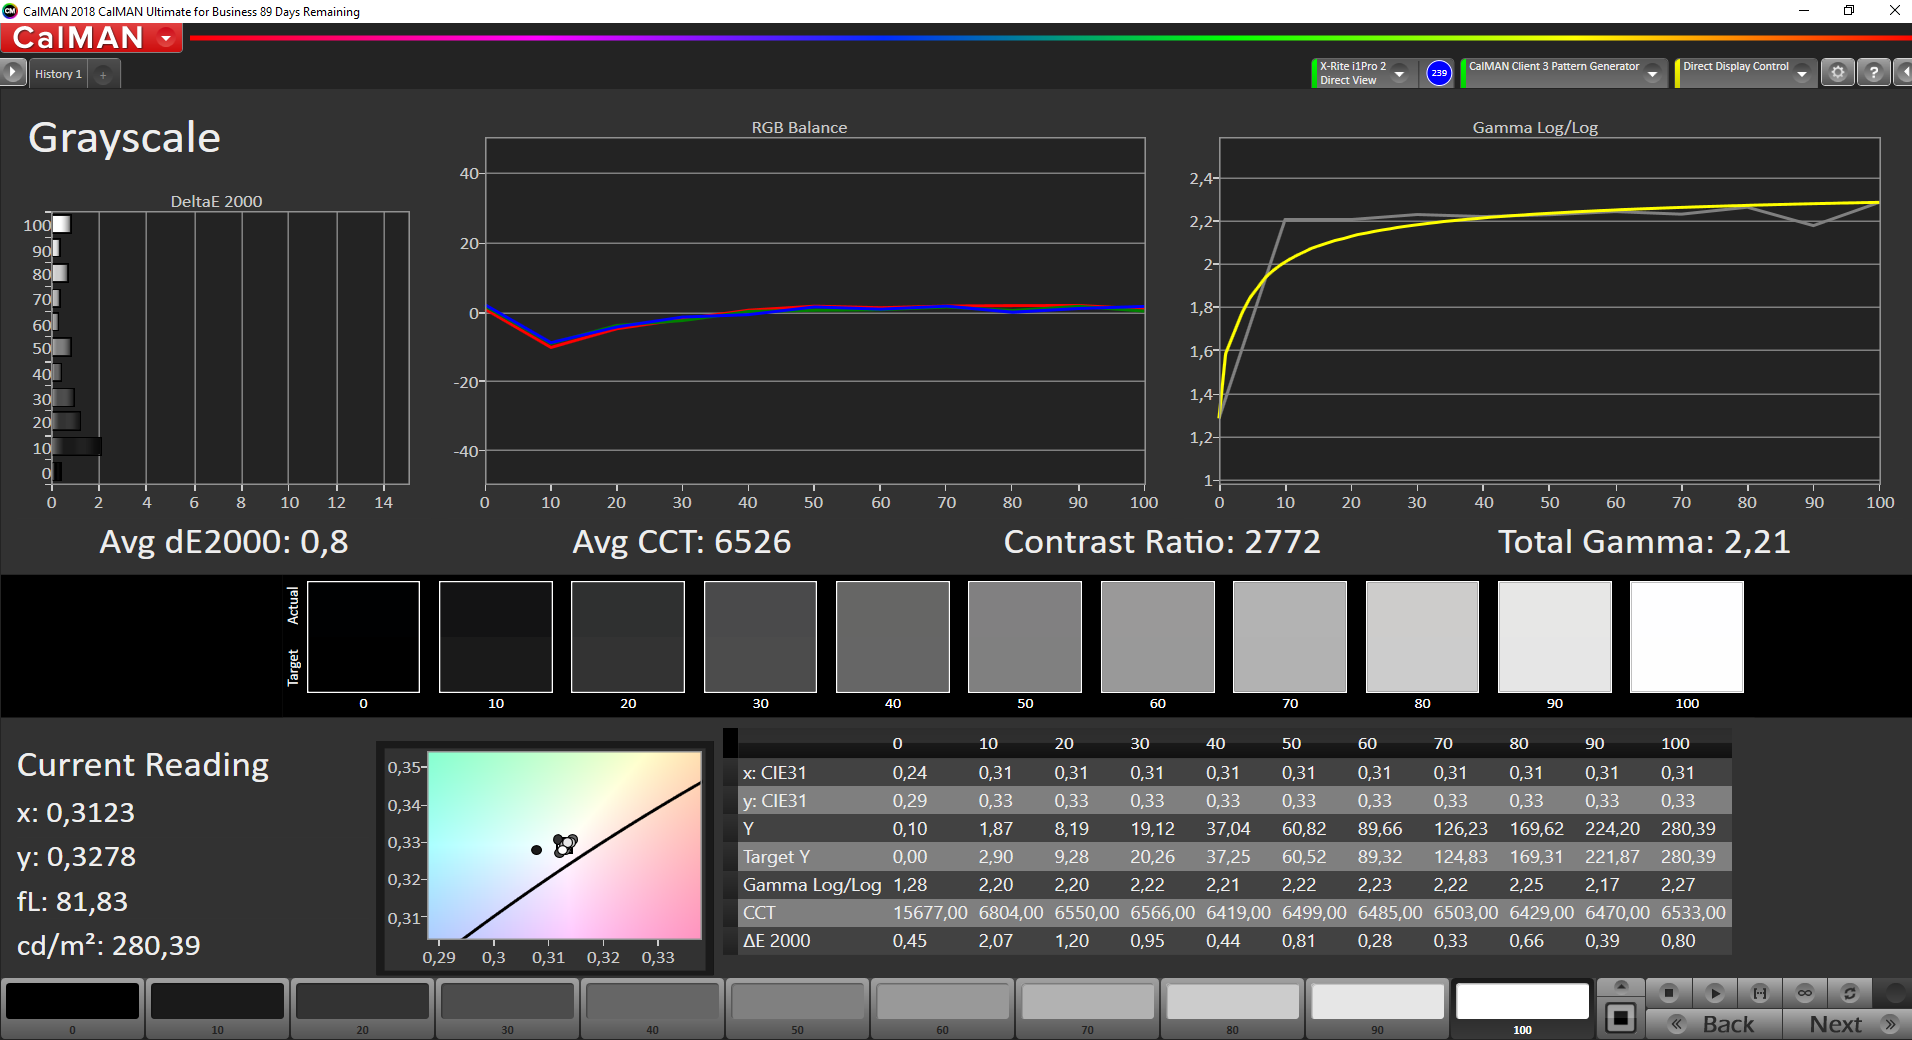
ΔE Greyscale Calman: 3.4 | ∀{0.09-98 Ø5.1}
98.9% sRGB (Argyll 1.6.3 3D)
62.6% AdobeRGB 1998 (Argyll 1.6.3 3D)
68.4% AdobeRGB 1998 (Argyll 3D)
98.8% sRGB (Argyll 3D)
66.4% Display P3 (Argyll 3D)
Gamma: 1.98
CCT: 7005 K
| Lenovo Yoga Slim 7-14IIL05 N140HCG-EQ1, , 1920x1080, 14" | Lenovo Yoga Slim 7-14ARE AU Optronics B140HAN06.8, IPS, 1920x1080, 14" | Asus ZenBook 14 UX434FL-DB77 AU Optronics B140HAN03.2, IPS, 1920x1080, 14" | Asus VivoBook Flip 14 TM420IA BOE NV140FHM-N49, IPS, 1920x1080, 14" | Acer Swift 3 SF314-42-R4XJ AU Optronics B140HAN04.0, IPS, 1920x1080, 14" | |
|---|---|---|---|---|---|
| Display | 5% | -5% | -39% | -44% | |
| Display P3 Coverage | 66.4 | 71.7 8% | 64 -4% | 40.47 -39% | 37.2 -44% |
| sRGB Coverage | 98.8 | 99.3 1% | 92 -7% | 60 -39% | 55.9 -43% |
| AdobeRGB 1998 Coverage | 68.4 | 72.9 7% | 65.3 -5% | 41.81 -39% | 38.43 -44% |
| Response Times | 14% | 23% | 22% | 25% | |
| Response Time Grey 50% / Grey 80% * | 51.2 ? | 45.6 ? 11% | 37.6 ? 27% | 36.4 ? 29% | 41 ? 20% |
| Response Time Black / White * | 35.2 ? | 29.6 ? 16% | 28.8 ? 18% | 30.4 ? 14% | 25 ? 29% |
| PWM Frequency | |||||
| Screen | -33% | -71% | -120% | -119% | |
| Brightness middle | 289 | 399.6 38% | 355.8 23% | 272.5 -6% | 269 -7% |
| Brightness | 286 | 385 35% | 341 19% | 260 -9% | 244 -15% |
| Brightness Distribution | 92 | 89 -3% | 88 -4% | 88 -4% | 83 -10% |
| Black Level * | 0.17 | 0.37 -118% | 0.38 -124% | 0.42 -147% | 0.23 -35% |
| Contrast | 1700 | 1080 -36% | 936 -45% | 649 -62% | 1170 -31% |
| Colorchecker dE 2000 * | 2.5 | 3.2 -28% | 4.47 -79% | 4.65 -86% | 4.94 -98% |
| Colorchecker dE 2000 max. * | 4.7 | 6.44 -37% | 9.12 -94% | 17.78 -278% | 20.37 -333% |
| Colorchecker dE 2000 calibrated * | 0.6 | 1.73 -188% | 2.89 -382% | 4.34 -623% | 5.03 -738% |
| Greyscale dE 2000 * | 3.4 | 4.7 -38% | 6.2 -82% | 4.4 -29% | 1.71 50% |
| Gamma | 1.98 111% | 2.21 100% | 2.27 97% | 2.2 100% | 2.52 87% |
| CCT | 7005 93% | 7184 90% | 8072 81% | 6984 93% | 6535 99% |
| Color Space (Percent of AdobeRGB 1998) | 62.6 | 66.3 6% | 59.3 -5% | 38.4 -39% | 35 -44% |
| Color Space (Percent of sRGB) | 98.9 | 99.5 1% | 91.6 -7% | 59.8 -40% | 56 -43% |
| Total Average (Program / Settings) | -5% /
-20% | -18% /
-47% | -46% /
-87% | -46% /
-87% |
* ... smaller is better
For the display measurements, we use the professional CalMAN software together with the X-Rite i2 Pro 2 spectrophotometer. Out of the box, there's a slight blue tint in the grayscales in combination with a color temperature that is a bit too cool. Otherwise, the deviations are not particularly high and only individual values are above the important limit of 3.
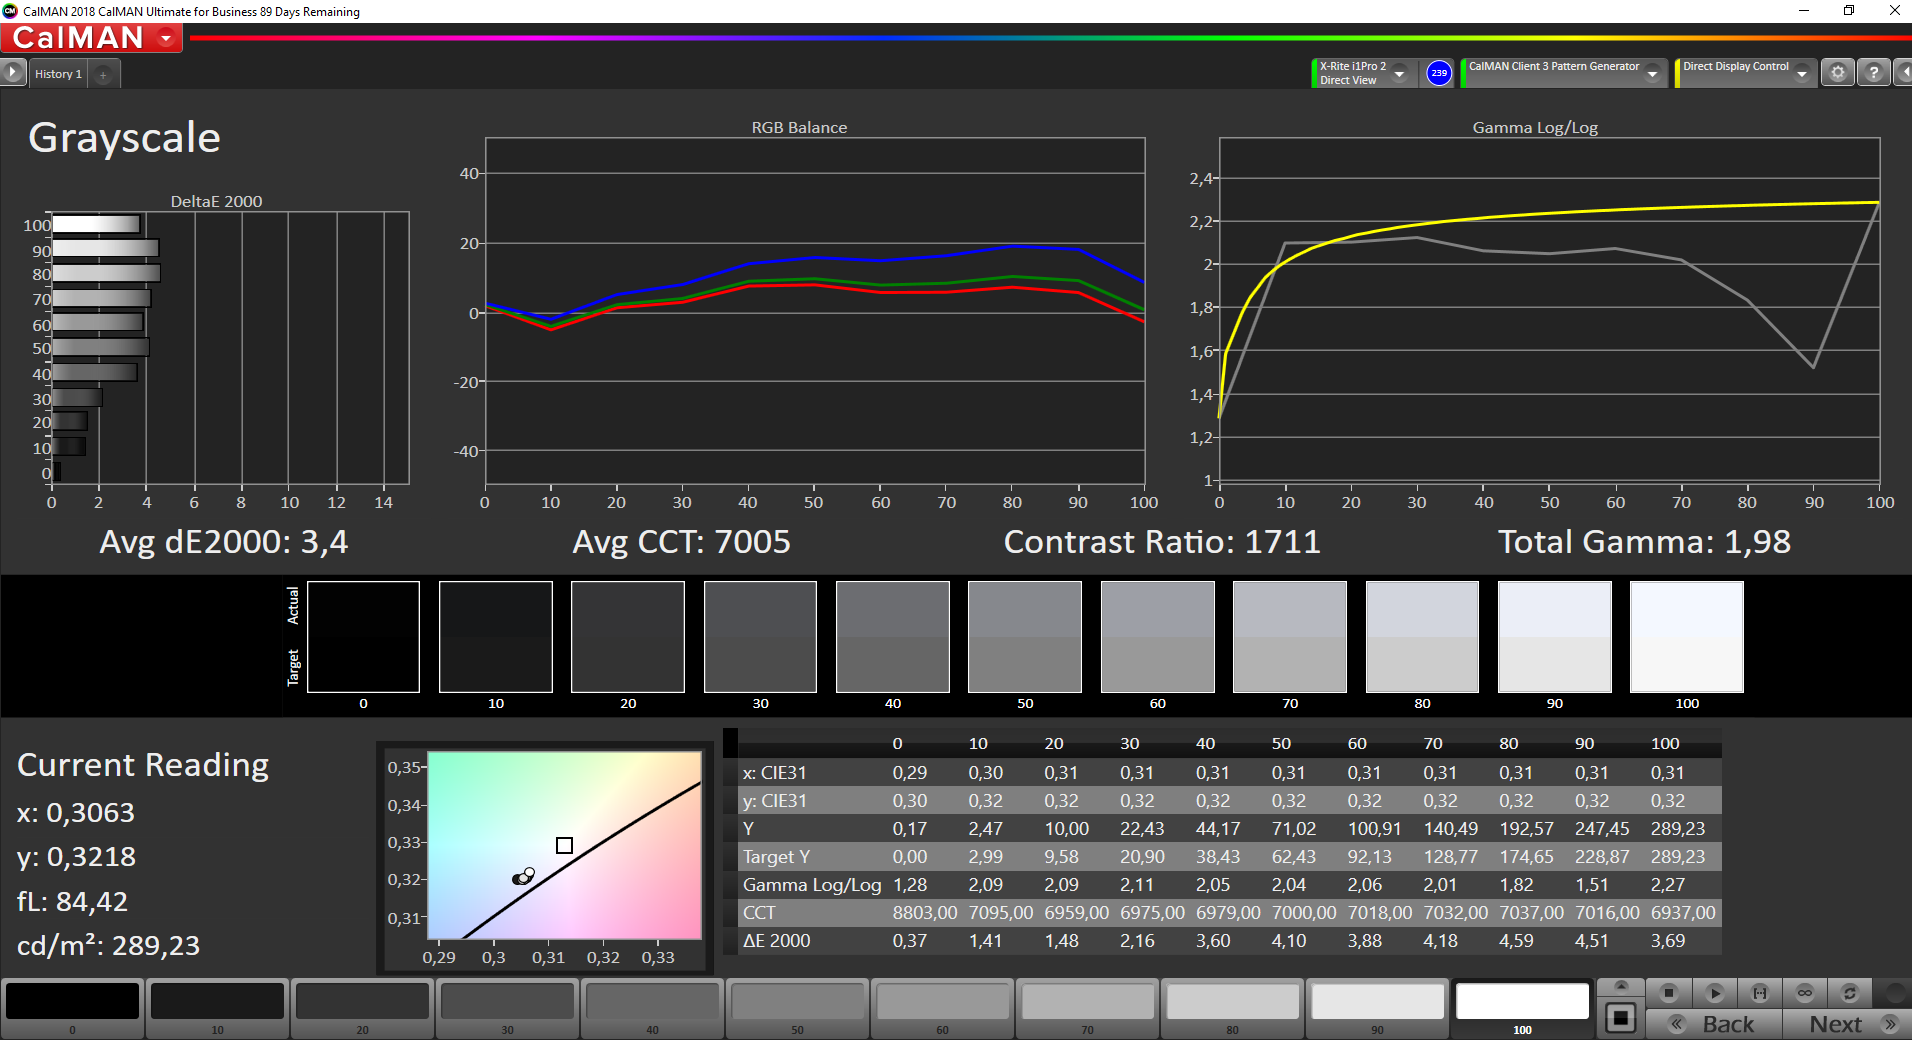
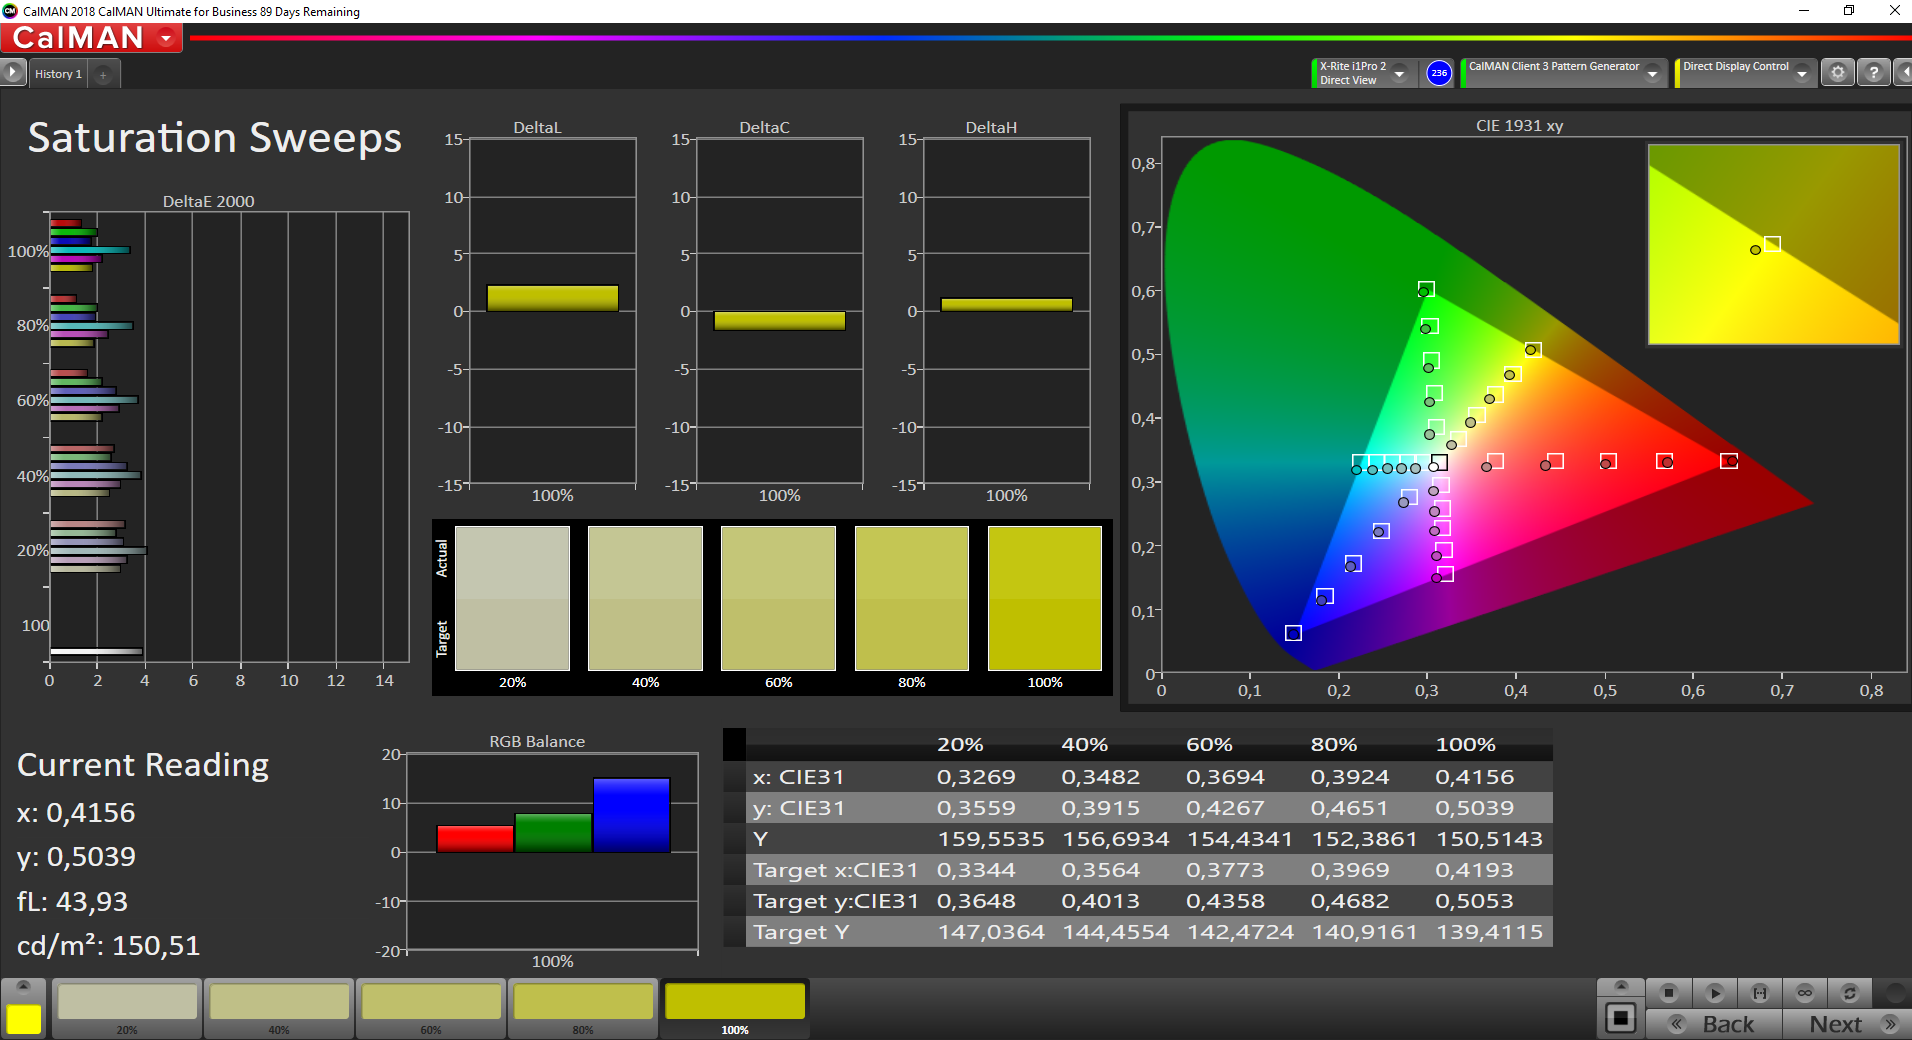
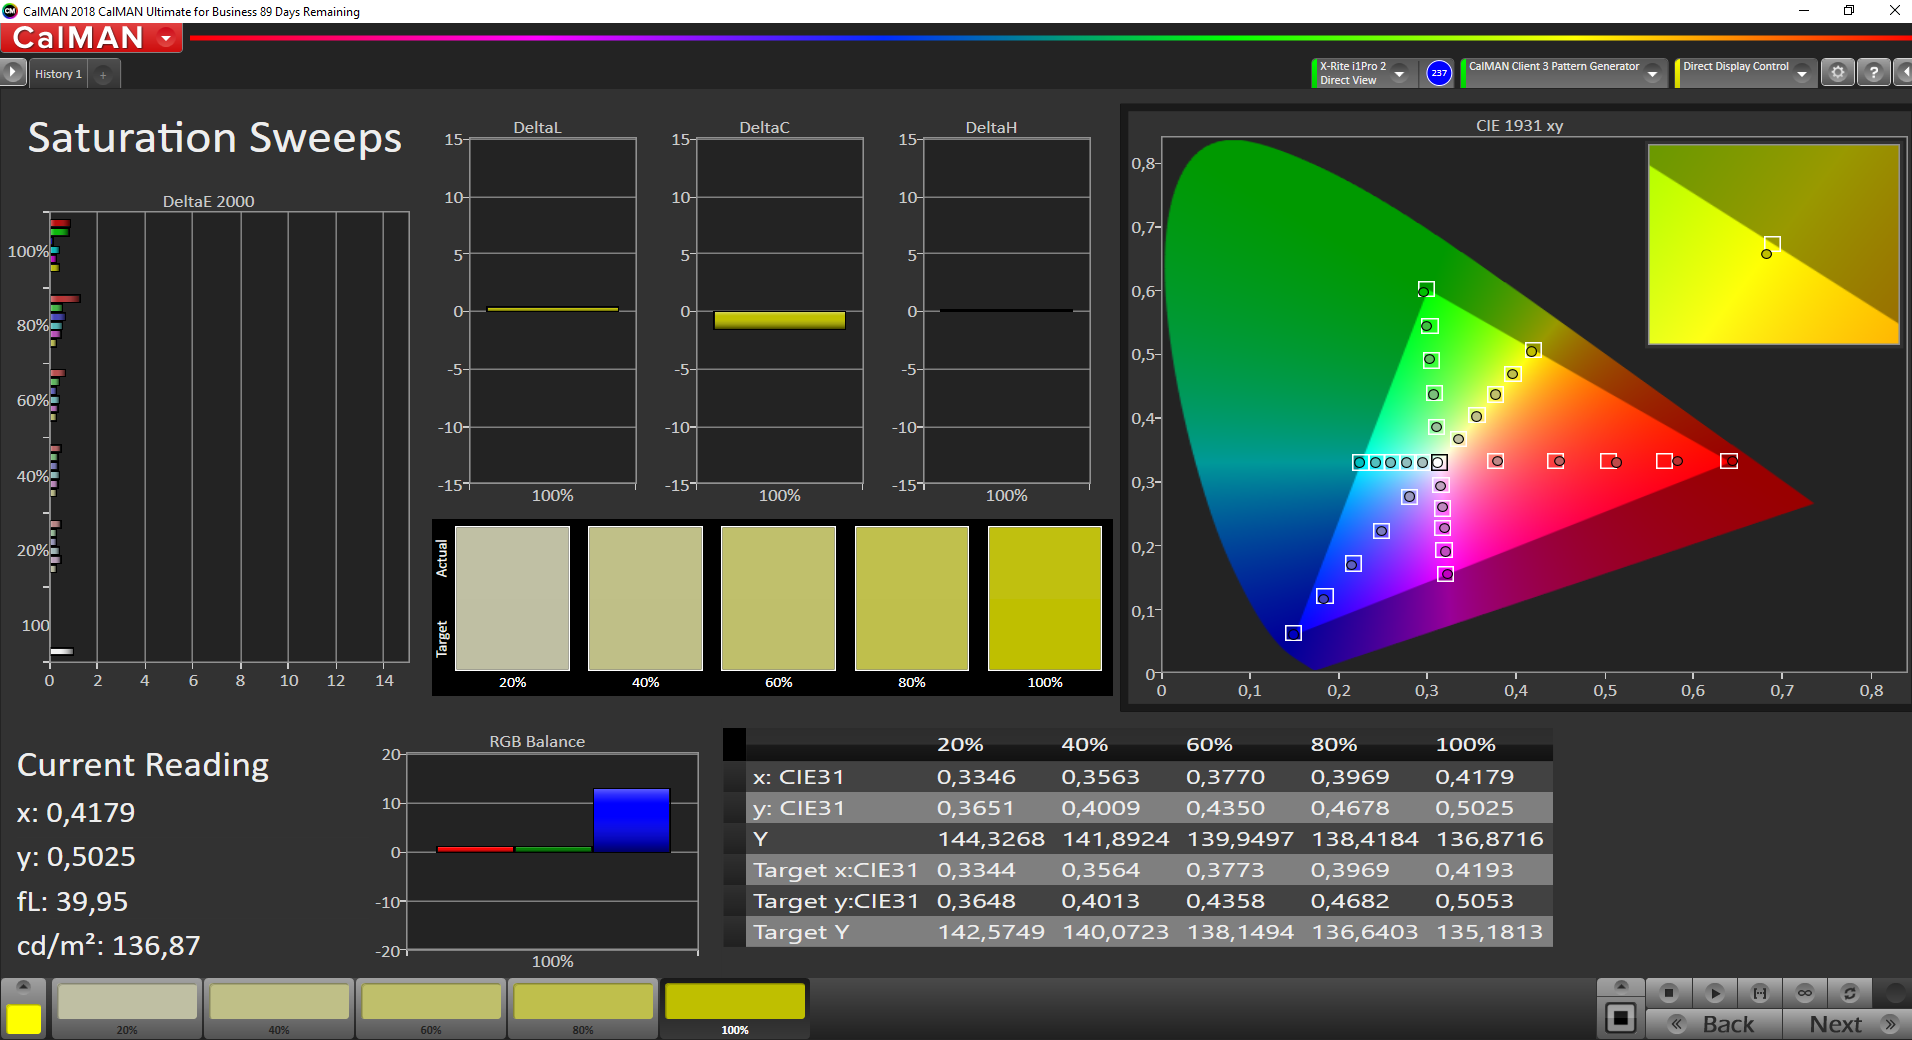
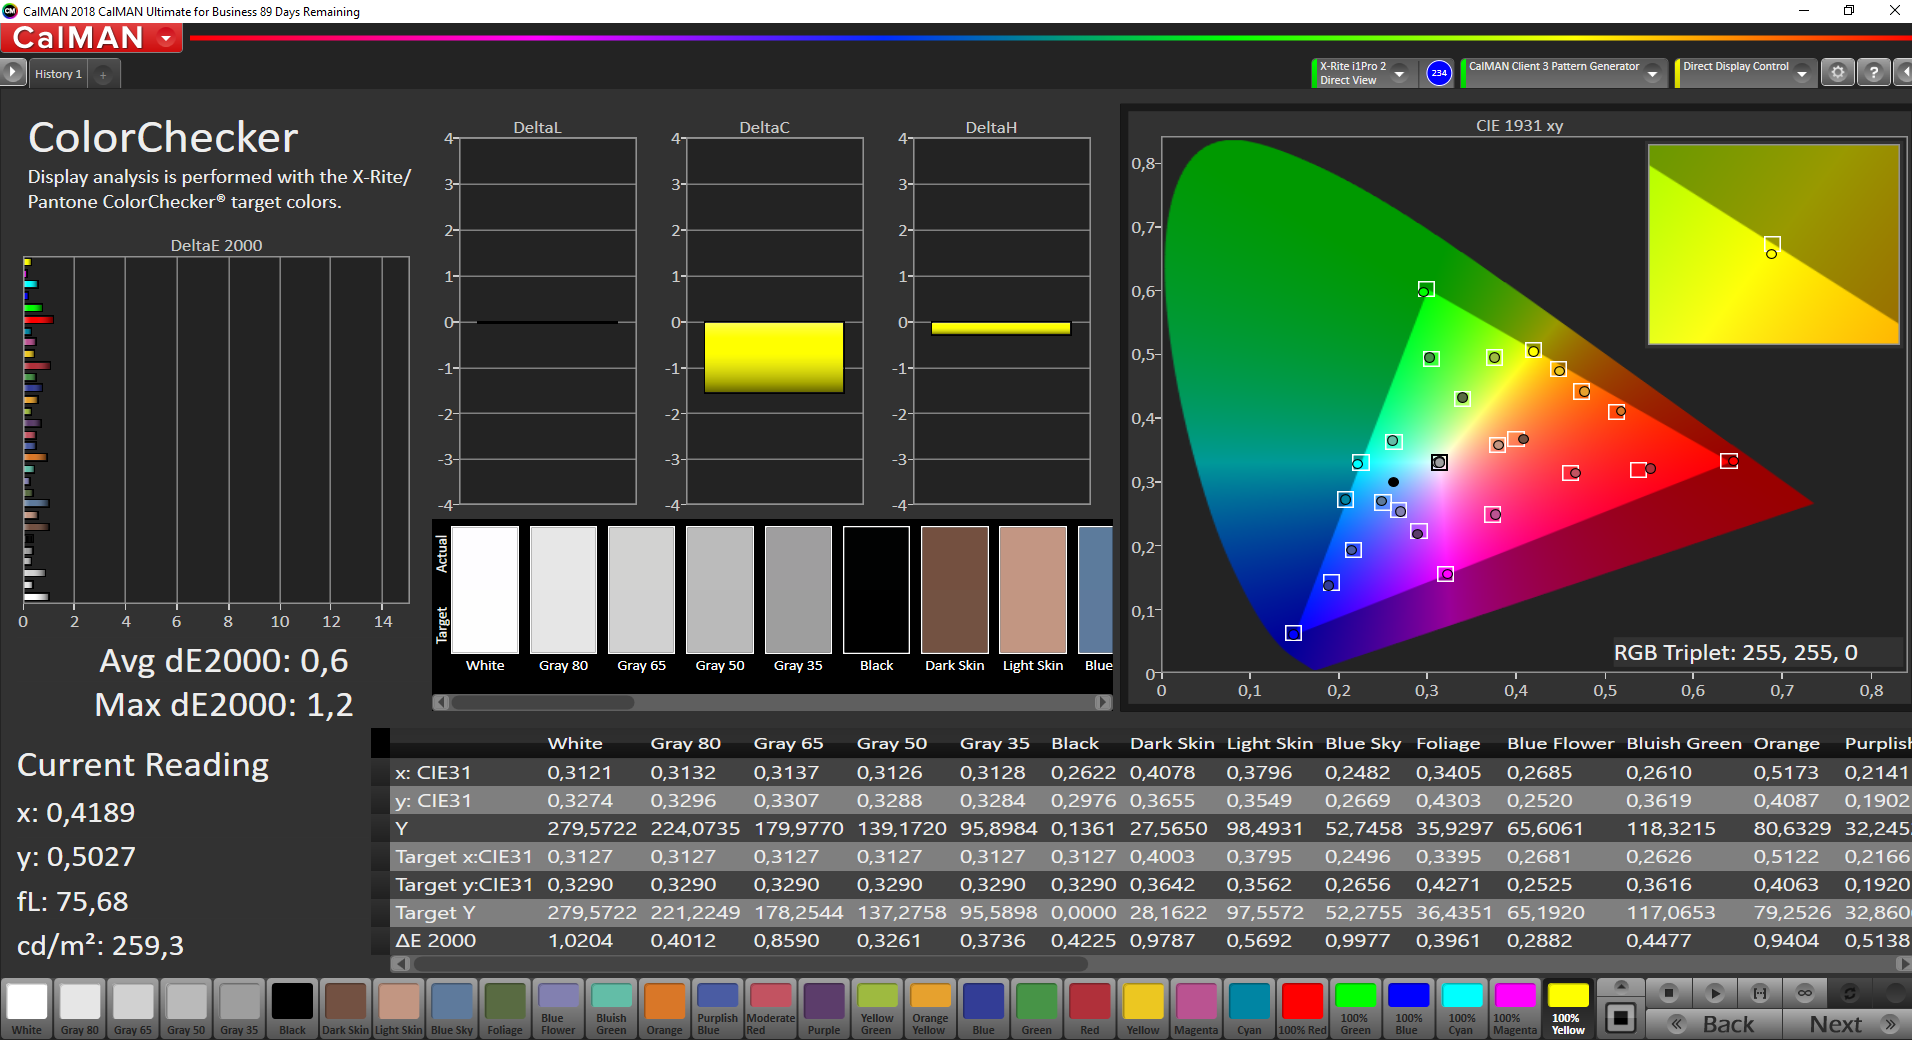
With our calibration (the profile is available above to download freely), we can make use of the panel's full potential and correct the color tint. In addition, all color deviations are also below 3. Together with the almost complete sRGB coverage, the Yoga Slim 7 is, therefore, also suitable for editing images and videos.
Display Response Times
| ↔ Response Time Black to White | ||
|---|---|---|
| 35.2 ms ... rise ↗ and fall ↘ combined | ↗ 17.2 ms rise | 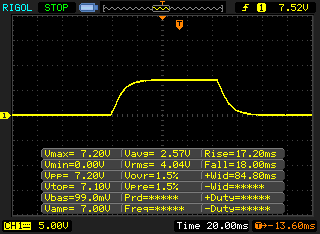 |
| ↘ 18 ms fall | ||
| The screen shows slow response rates in our tests and will be unsatisfactory for gamers. In comparison, all tested devices range from 0.1 (minimum) to 240 (maximum) ms. » 93 % of all devices are better. This means that the measured response time is worse than the average of all tested devices (20.4 ms). | ||
| ↔ Response Time 50% Grey to 80% Grey | ||
| 51.2 ms ... rise ↗ and fall ↘ combined | ↗ 22 ms rise | 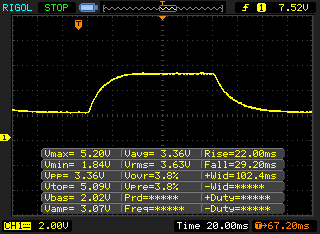 |
| ↘ 29.2 ms fall | ||
| The screen shows slow response rates in our tests and will be unsatisfactory for gamers. In comparison, all tested devices range from 0.165 (minimum) to 636 (maximum) ms. » 87 % of all devices are better. This means that the measured response time is worse than the average of all tested devices (31.9 ms). | ||
Screen Flickering / PWM (Pulse-Width Modulation)
| Screen flickering / PWM not detected | 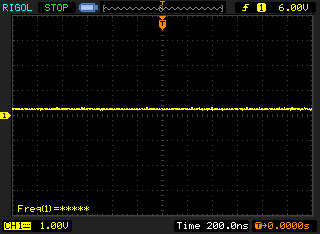 | ||
In comparison: 53 % of all tested devices do not use PWM to dim the display. If PWM was detected, an average of 8255 (minimum: 5 - maximum: 343500) Hz was measured. | |||
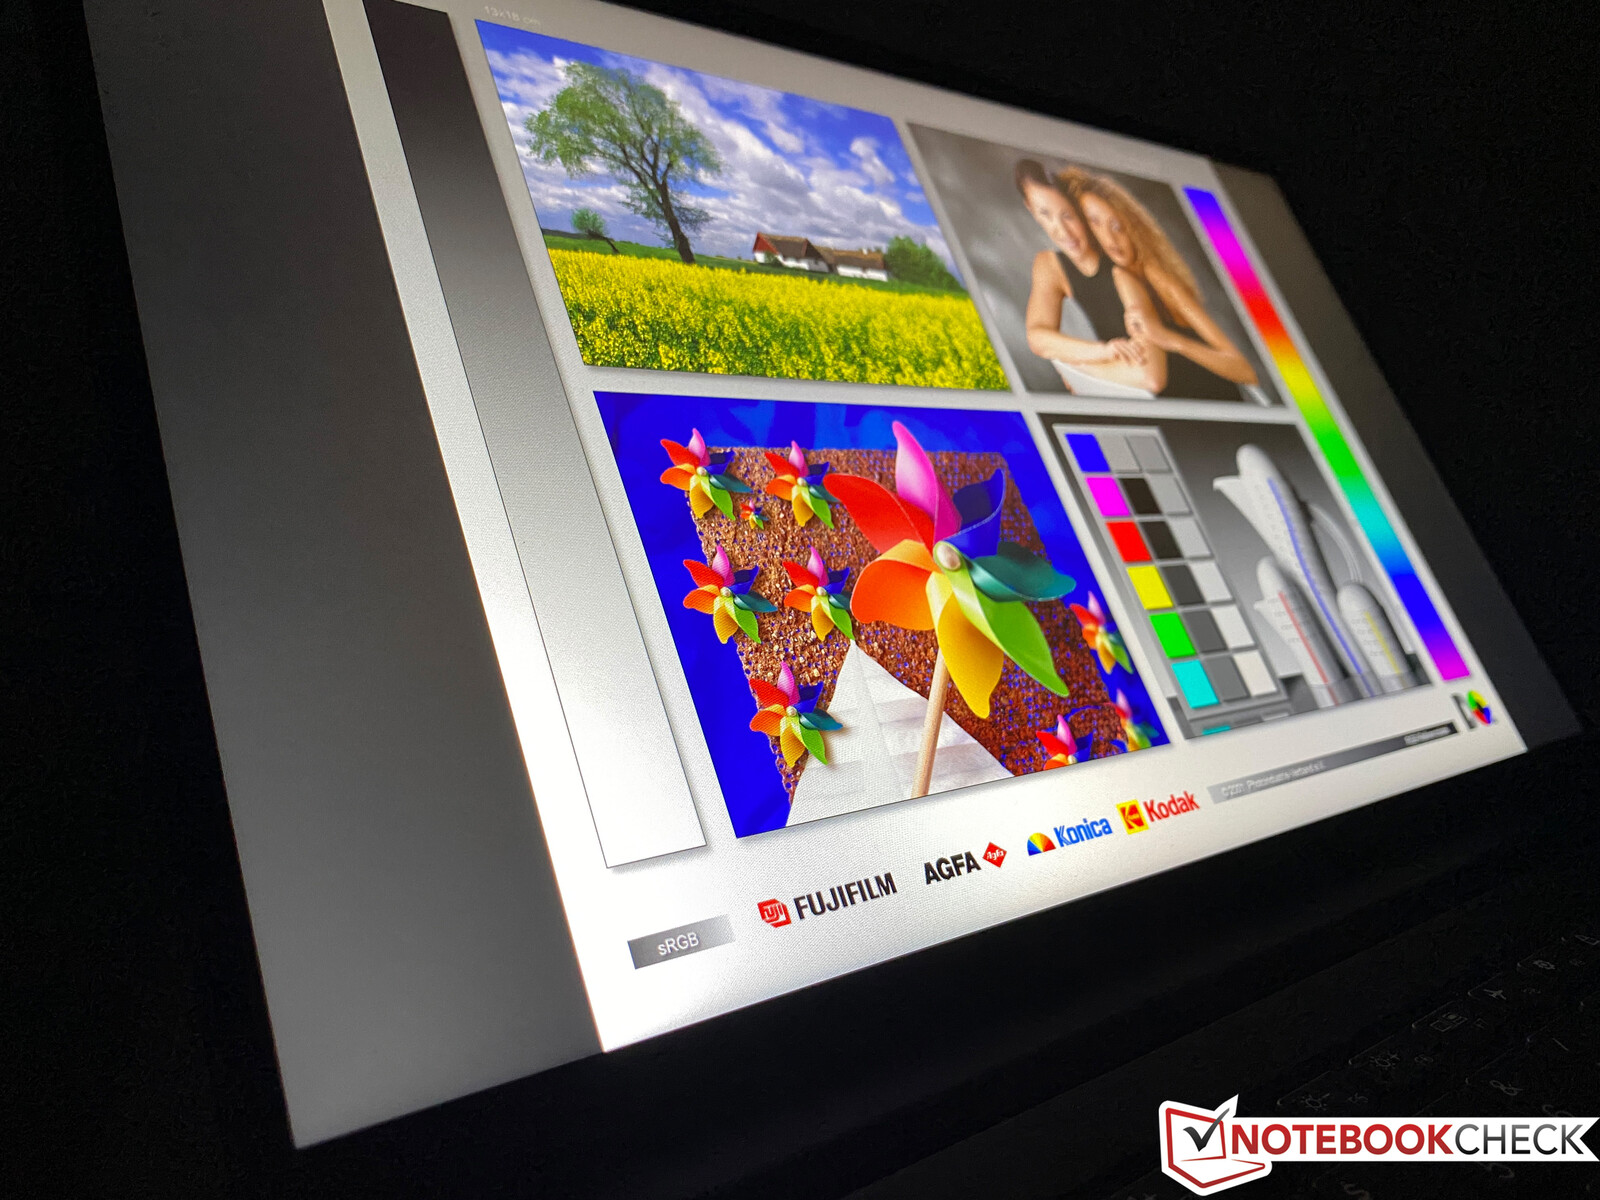
The reflective display is problematic outdoors, and you must try to avoid reflections from light sources or bright objects. However, working comfortably is only possible in the shade. But there is no criticism when it comes to the viewing-angle stability of the IPS panel.
Performance - Yoga Slim 7 with Intel and Nvidia
Processor - Intel is clearly outperformed
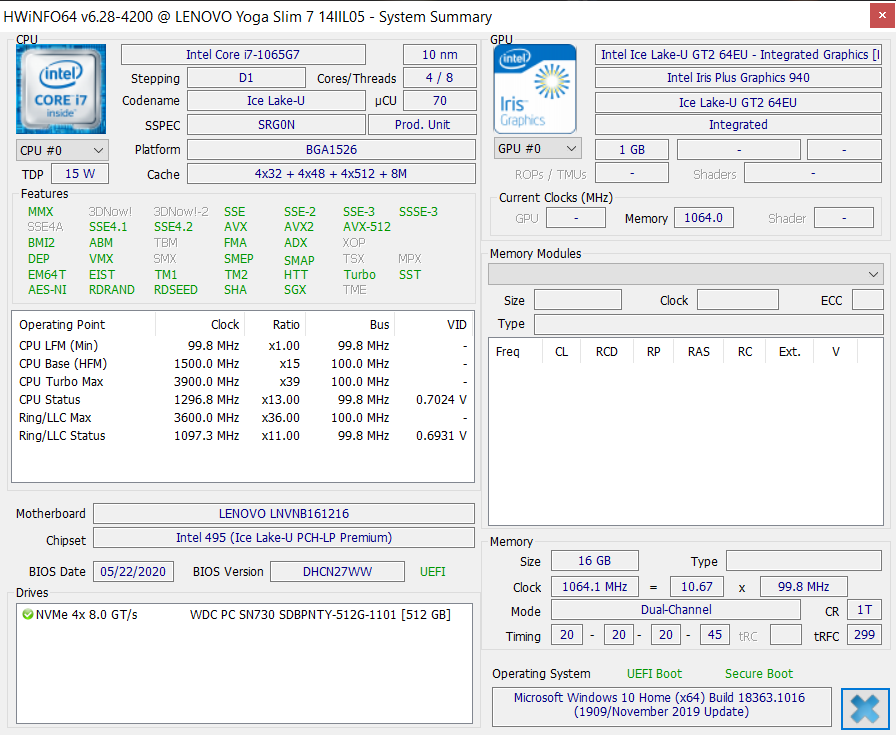
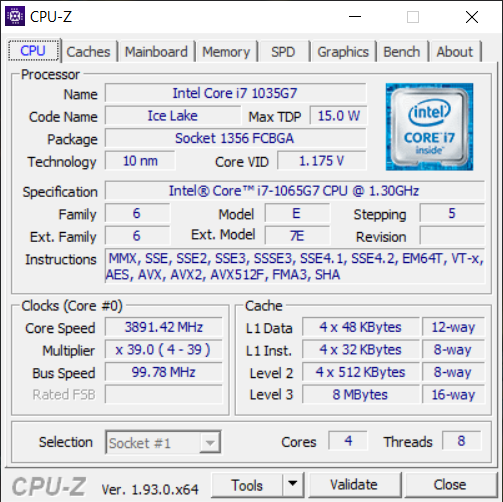
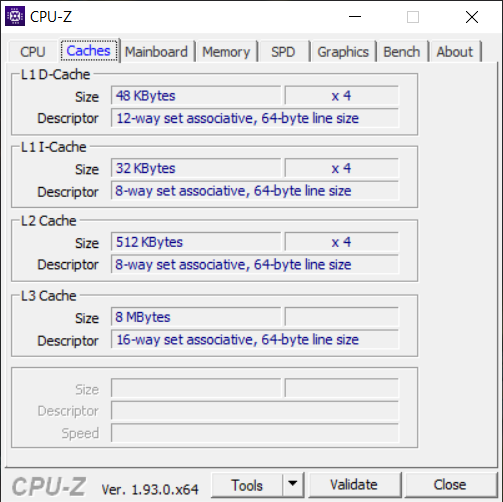
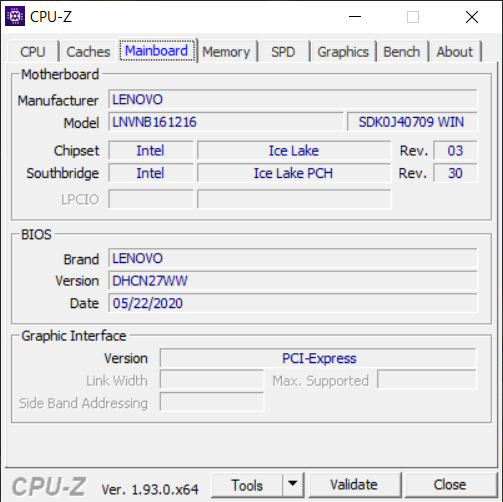
Our test device contains the Intel Core i7-1065G7 quad-core processor; its Ice Lake architecture is manufactured in a 10 nm process. Its four cores (eight threads) run at a maximum of 3.5 GHz (1 and 2 cores at a maximum of 3.9 GHz). The cooling of the Yoga Slim 7 also handles the processor quite well and allows a prolonged power consumption of about 28 watts (31 watts for a short time), which is sufficient for 4x 2.9 GHz.
In terms of single-core performance, the opponents are still almost on par, but when it comes to the usage of all cores, the Intel CPU doesn't stand a chance against the new AMD Ryzen chips; it's outperformed by both the Ryzen 7 4800U as well as the more widespread Ryzen 7 4700U.
CPU performance is practically identical on battery power.
Cinebench R15: CPU Single 64Bit | CPU Multi 64Bit
Blender: v2.79 BMW27 CPU
7-Zip 18.03: 7z b 4 -mmt1 | 7z b 4
Geekbench 5.5: Single-Core | Multi-Core
HWBOT x265 Benchmark v2.2: 4k Preset
LibreOffice : 20 Documents To PDF
R Benchmark 2.5: Overall mean
| Cinebench R20 / CPU (Single Core) | |
| Average of class Multimedia (420 - 853, n=66, last 2 years) | |
| Lenovo Yoga Slim 7-14ARE | |
| Acer Swift 3 SF314-42-R4XJ | |
| Asus VivoBook Flip 14 TM420IA | |
| Lenovo Yoga Slim 7-14IIL05 | |
| Asus ZenBook 14 UX434FL-DB77 | |
| Average Intel Core i7-1065G7 (358 - 474, n=31) | |
| Cinebench R20 / CPU (Multi Core) | |
| Average of class Multimedia (1887 - 11924, n=66, last 2 years) | |
| Lenovo Yoga Slim 7-14ARE | |
| Asus VivoBook Flip 14 TM420IA | |
| Acer Swift 3 SF314-42-R4XJ | |
| Lenovo Yoga Slim 7-14IIL05 | |
| Average Intel Core i7-1065G7 (1081 - 2024, n=31) | |
| Asus ZenBook 14 UX434FL-DB77 | |
| Cinebench R15 / CPU Single 64Bit | |
| Average of class Multimedia (99.6 - 323, n=69, last 2 years) | |
| Lenovo Yoga Slim 7-14IIL05 | |
| Lenovo Yoga Slim 7-14ARE | |
| Asus VivoBook Flip 14 TM420IA | |
| Acer Swift 3 SF314-42-R4XJ | |
| Asus ZenBook 14 UX434FL-DB77 | |
| Average Intel Core i7-1065G7 (141 - 190, n=35) | |
| Cinebench R15 / CPU Multi 64Bit | |
| Average of class Multimedia (856 - 5224, n=74, last 2 years) | |
| Lenovo Yoga Slim 7-14ARE | |
| Asus VivoBook Flip 14 TM420IA | |
| Acer Swift 3 SF314-42-R4XJ | |
| Lenovo Yoga Slim 7-14IIL05 | |
| Asus ZenBook 14 UX434FL-DB77 | |
| Average Intel Core i7-1065G7 (288 - 836, n=36) | |
| Blender / v2.79 BMW27 CPU | |
| Average Intel Core i7-1065G7 (675 - 1650, n=23) | |
| Asus ZenBook 14 UX434FL-DB77 | |
| Lenovo Yoga Slim 7-14IIL05 | |
| Acer Swift 3 SF314-42-R4XJ | |
| Asus VivoBook Flip 14 TM420IA | |
| Lenovo Yoga Slim 7-14ARE | |
| Average of class Multimedia (100 - 557, n=68, last 2 years) | |
| 7-Zip 18.03 / 7z b 4 -mmt1 | |
| Average of class Multimedia (3666 - 7545, n=61, last 2 years) | |
| Lenovo Yoga Slim 7-14ARE | |
| Lenovo Yoga Slim 7-14IIL05 | |
| Asus VivoBook Flip 14 TM420IA | |
| Acer Swift 3 SF314-42-R4XJ | |
| Average Intel Core i7-1065G7 (3289 - 4589, n=24) | |
| Asus ZenBook 14 UX434FL-DB77 | |
| 7-Zip 18.03 / 7z b 4 | |
| Average of class Multimedia (29095 - 130368, n=61, last 2 years) | |
| Lenovo Yoga Slim 7-14ARE | |
| Asus VivoBook Flip 14 TM420IA | |
| Acer Swift 3 SF314-42-R4XJ | |
| Lenovo Yoga Slim 7-14IIL05 | |
| Average Intel Core i7-1065G7 (10406 - 22898, n=24) | |
| Asus ZenBook 14 UX434FL-DB77 | |
| Geekbench 5.5 / Single-Core | |
| Average of class Multimedia (805 - 2555, n=66, last 2 years) | |
| Lenovo Yoga Slim 7-14IIL05 | |
| Average Intel Core i7-1065G7 (948 - 1348, n=18) | |
| Asus ZenBook 14 UX434FL-DB77 | |
| Asus VivoBook Flip 14 TM420IA | |
| Lenovo Yoga Slim 7-14ARE | |
| Lenovo Yoga Slim 7-14ARE | |
| Acer Swift 3 SF314-42-R4XJ | |
| Geekbench 5.5 / Multi-Core | |
| Average of class Multimedia (4652 - 23059, n=66, last 2 years) | |
| Lenovo Yoga Slim 7-14ARE | |
| Lenovo Yoga Slim 7-14ARE | |
| Asus VivoBook Flip 14 TM420IA | |
| Acer Swift 3 SF314-42-R4XJ | |
| Lenovo Yoga Slim 7-14IIL05 | |
| Average Intel Core i7-1065G7 (2464 - 4855, n=18) | |
| Asus ZenBook 14 UX434FL-DB77 | |
| HWBOT x265 Benchmark v2.2 / 4k Preset | |
| Average of class Multimedia (5.26 - 34.3, n=61, last 2 years) | |
| Lenovo Yoga Slim 7-14ARE | |
| Asus VivoBook Flip 14 TM420IA | |
| Acer Swift 3 SF314-42-R4XJ | |
| Lenovo Yoga Slim 7-14IIL05 | |
| Asus ZenBook 14 UX434FL-DB77 | |
| Average Intel Core i7-1065G7 (2.2 - 6.38, n=22) | |
| LibreOffice / 20 Documents To PDF | |
| Asus ZenBook 14 UX434FL-DB77 | |
| Average Intel Core i7-1065G7 (46.9 - 85.3, n=19) | |
| Acer Swift 3 SF314-42-R4XJ | |
| Lenovo Yoga Slim 7-14ARE | |
| Asus VivoBook Flip 14 TM420IA | |
| Lenovo Yoga Slim 7-14IIL05 | |
| Average of class Multimedia (23.9 - 146.7, n=63, last 2 years) | |
| R Benchmark 2.5 / Overall mean | |
| Asus ZenBook 14 UX434FL-DB77 | |
| Average Intel Core i7-1065G7 (0.661 - 0.798, n=18) | |
| Lenovo Yoga Slim 7-14IIL05 | |
| Acer Swift 3 SF314-42-R4XJ | |
| Lenovo Yoga Slim 7-14ARE | |
| Asus VivoBook Flip 14 TM420IA | |
| Average of class Multimedia (0.3604 - 0.998, n=62, last 2 years) | |
* ... smaller is better
System performance
The combination of a modern quad-core processor and fast NVMe SSD makes the Yoga Slim 7 a highly responsive system. Input is implemented without delay, and we didn't detect any problems during testing. The device performs averagely in the synthetic benchmarks, but there are no problems here either.
| PCMark 8 Home Score Accelerated v2 | 4523 points | |
| PCMark 8 Creative Score Accelerated v2 | 6109 points | |
| PCMark 8 Work Score Accelerated v2 | 5488 points | |
| PCMark 10 Score | 4352 points | |
Help | ||
| DPC Latencies / LatencyMon - interrupt to process latency (max), Web, Youtube, Prime95 | |
| Lenovo Yoga Slim 7-14ARE | |
| Asus ZenBook 14 UX434FL-DB77 | |
| Acer Swift 3 SF314-42-R4XJ | |
| Asus VivoBook Flip 14 TM420IA | |
| Lenovo Yoga Slim 7-14IIL05 | |
* ... smaller is better
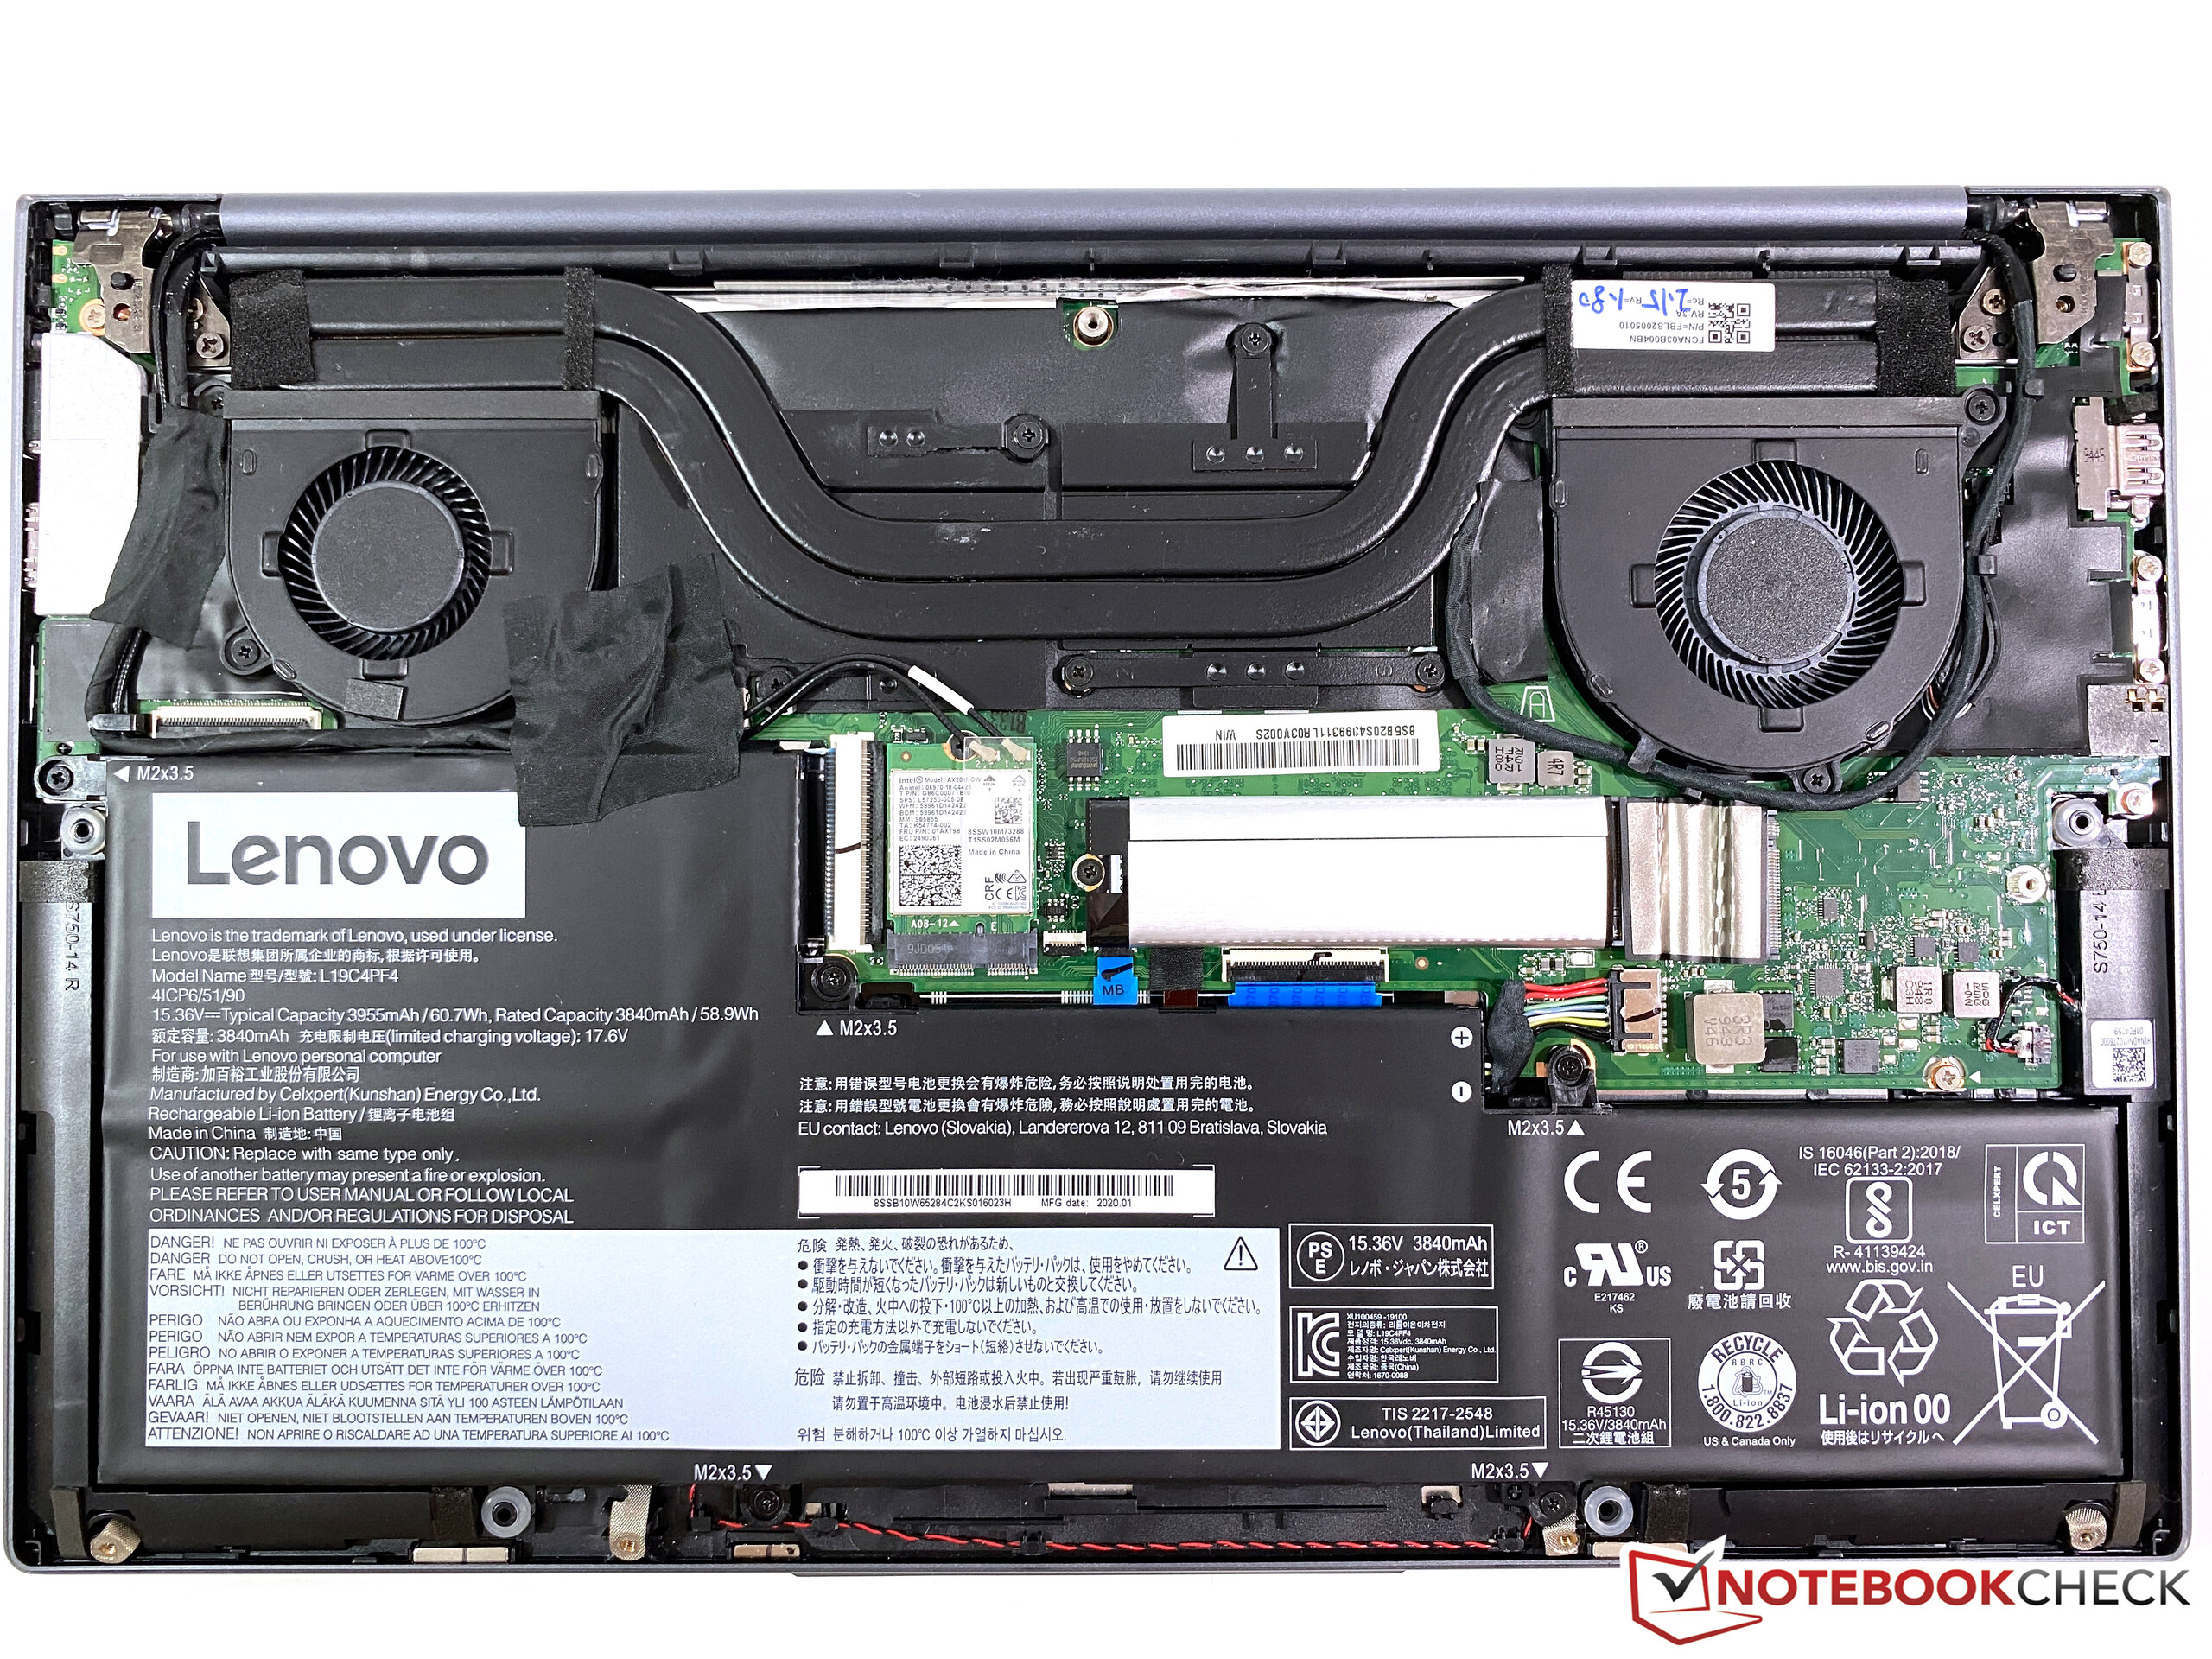
Storage - NVMe SSD from WD
Lenovo has installed an M.2 2280 NVMe SSD that is connected via a PCIe interface and can also be replaced. Lenovo relies on various suppliers for this. The SSD comes from Western Digital (SN730) in our test device, and it offers a capacity of 512 GB. 431 GB is still available to the user out of this after the initial start-up. If you want to expand the storage space, a free M.2 2242 slot is also available.
| Lenovo Yoga Slim 7-14IIL05 WDC PC SN730 SDBPNTY-512G | Lenovo Yoga Slim 7-14ARE Samsung SSD PM981a MZVLB512HBJQ | Asus ZenBook 14 UX434FL-DB77 WDC PC SN520 SDAPNUW-512G | Asus VivoBook Flip 14 TM420IA Samsung PM991 MZVLQ512HALU | Acer Swift 3 SF314-42-R4XJ Samsung PM991 MZVLQ1T0HALB | Average WDC PC SN730 SDBPNTY-512G | |
|---|---|---|---|---|---|---|
| CrystalDiskMark 5.2 / 6 | 18% | -25% | -21% | -20% | 8% | |
| Write 4K | 137 | 146.1 7% | 134.2 -2% | 121.2 -12% | 98.8 -28% | 164.3 ? 20% |
| Read 4K | 48.71 | 47.18 -3% | 45.41 -7% | 49.91 2% | 32.44 -33% | 48.2 ? -1% |
| Write Seq | 1785 | 2896 62% | 1080 -39% | 1090 -39% | 1582 -11% | 2096 ? 17% |
| Read Seq | 2057 | 2754 34% | 1168 -43% | 1533 -25% | 1471 -28% | 2123 ? 3% |
| Write 4K Q32T1 | 436.9 | 425.8 -3% | 412.5 -6% | 393.3 -10% | 375.4 -14% | 451 ? 3% |
| Read 4K Q32T1 | 389 | 514 32% | 357.2 -8% | 406 4% | 491.9 26% | 509 ? 31% |
| Write Seq Q32T1 | 2708 | 2989 10% | 1457 -46% | 1225 -55% | 1574 -42% | 2551 ? -6% |
| Read Seq Q32T1 | 3426 | 3568 4% | 1710 -50% | 2277 -34% | 2329 -32% | 3330 ? -3% |
| AS SSD | 19% | -33% | -37% | -36% | 9% | |
| Seq Read | 2703 | 1658 -39% | 1171 -57% | 1397 -48% | 1960 -27% | 2605 ? -4% |
| Seq Write | 1104 | 2464 123% | 868 -21% | 783 -29% | 1547 40% | 1905 ? 73% |
| 4K Read | 46.41 | 59.5 28% | 39.06 -16% | 48.08 4% | 31.56 -32% | 45.8 ? -1% |
| 4K Write | 154.1 | 128.6 -17% | 130.6 -15% | 134.6 -13% | 116.6 -24% | 155.6 ? 1% |
| 4K-64 Read | 835 | 1576 89% | 815 -2% | 835 0% | 454.7 -46% | 1181 ? 41% |
| 4K-64 Write | 1138 | 1986 75% | 709 -38% | 734 -36% | 262.1 -77% | 1372 ? 21% |
| Access Time Read * | 0.058 | 0.049 16% | 0.059 -2% | 0.081 -40% | 0.0801 ? -38% | |
| Access Time Write * | 0.028 | 0.087 -211% | 0.077 -175% | 0.084 -200% | 0.034 -21% | 0.04195 ? -50% |
| Score Read | 1151 | 1802 57% | 971 -16% | 1022 -11% | 682 -41% | 1488 ? 29% |
| Score Write | 1402 | 2361 68% | 926 -34% | 947 -32% | 533 -62% | 1718 ? 23% |
| Score Total | 3073 | 5133 67% | 2387 -22% | 2474 -19% | 1552 -49% | 3938 ? 28% |
| Copy ISO MB/s | 1626 | 1588 -2% | 1287 -21% | 1212 -25% | 974 -40% | 1718 ? 6% |
| Copy Program MB/s | 568 | 550 -3% | 417 -27% | 374.3 -34% | 356.5 -37% | 536 ? -6% |
| Copy Game MB/s | 1151 | 1329 15% | 1017 -12% | 829 -28% | 621 -46% | 1193 ? 4% |
| Total Average (Program / Settings) | 19% /
19% | -29% /
-30% | -29% /
-31% | -28% /
-30% | 9% /
9% |
* ... smaller is better

Continuous load read: DiskSpd Read Loop, Queue Depth 8
Graphics card - Intel Iris and Nvidia MX350
In everyday use, the integrated Iris Plus Graphics G7 takes care of graphics output. Thanks to the powerful video decoder, the reproduction of high-resolution videos is no problem. If you need more performance, for example when playing games, the system automatically switches to the dedicated Nvidia GeForce MX350.
The comparison with the new integrated GPUs from AMD is especially interesting here. In comparison with the RX Vega 8, the dedicated MX350 can only narrowly assert itself in the synthetic benchmarks, and it leads by only about 10-15%. In comparison with the RX Vega 7 of the Ryzen 7 4700, the lead of 26-47% is much larger in contrast. In addition, the performance yield of the MX350 is very good since it's just above the average values that we have for this GPU in our database.
The GPU's performance remains stable even under prolonged load, because the Yoga Slim 7 passes the demanding Time Spy stress test without any problems at 99%. GPU performance drops by about 15% on battery power.
| 3DMark 11 Performance | 6362 points | |
| 3DMark Ice Storm Standard Score | 82346 points | |
| 3DMark Fire Strike Score | 3909 points | |
| 3DMark Time Spy Score | 1469 points | |
Help | ||
Gaming performance
When it comes to actual gaming performance, the dedicated GeForce GPU can stand out a bit more and is, therefore, better suited for gaming. Overall, however, we're still dealing with a low mid-range graphics card here, so that only medium details are often possible with more demanding titles. Only older or less complex titles can be played at high details without problems.
| The Witcher 3 | |
| 1366x768 Medium Graphics & Postprocessing | |
| Average of class Multimedia (41 - 327, n=21, last 2 years) | |
| Lenovo Yoga Slim 7-14IIL05 | |
| Average NVIDIA GeForce MX350 (35.2 - 51.9, n=13) | |
| Asus VivoBook Flip 14 TM420IA | |
| Acer Swift 3 SF314-42-R4XJ | |
| Asus ZenBook 14 UX434FL-DB77 | |
| 1920x1080 High Graphics & Postprocessing (Nvidia HairWorks Off) | |
| Average of class Multimedia (22 - 242, n=37, last 2 years) | |
| Lenovo Yoga Slim 7-14IIL05 | |
| Average NVIDIA GeForce MX350 (20.6 - 29.9, n=13) | |
| Lenovo Yoga Slim 7-14ARE | |
| Asus VivoBook Flip 14 TM420IA | |
| Asus ZenBook 14 UX434FL-DB77 | |
| Acer Swift 3 SF314-42-R4XJ | |
| 1920x1080 Ultra Graphics & Postprocessing (HBAO+) | |
| Average of class Multimedia (11 - 121, n=41, last 2 years) | |
| Lenovo Yoga Slim 7-14IIL05 | |
| Average NVIDIA GeForce MX350 (10.1 - 17.5, n=12) | |
| Lenovo Yoga Slim 7-14ARE | |
| Asus VivoBook Flip 14 TM420IA | |
| Acer Swift 3 SF314-42-R4XJ | |
| Asus ZenBook 14 UX434FL-DB77 | |
| F1 2019 | |
| 1920x1080 Medium Preset AA:T AF:16x | |
| Lenovo Yoga Slim 7-14IIL05 | |
| Average NVIDIA GeForce MX350 (38 - 49, n=3) | |
| Lenovo Yoga Slim 7-14ARE | |
| Acer Swift 3 SF314-42-R4XJ | |
| 1920x1080 High Preset AA:T AF:16x | |
| Lenovo Yoga Slim 7-14IIL05 | |
| Average NVIDIA GeForce MX350 (28 - 39, n=3) | |
| Lenovo Yoga Slim 7-14ARE | |
| Acer Swift 3 SF314-42-R4XJ | |
| 1920x1080 Ultra High Preset AA:T AF:16x | |
| Lenovo Yoga Slim 7-14IIL05 | |
| Lenovo Yoga Slim 7-14ARE | |
| Average NVIDIA GeForce MX350 (17 - 33, n=3) | |
| Acer Swift 3 SF314-42-R4XJ | |
Our The Witcher 3 test confirms the results of the 3DMark stress test, since performance remains stable here too. Consequently, you don't have to expect performance drops while gaming.
| low | med. | high | ultra | 4K | |
|---|---|---|---|---|---|
| The Witcher 3 (2015) | 80.3 | 46.5 | 27.4 | 15.8 | |
| Dota 2 Reborn (2015) | 116 | 112 | 84.8 | 76.9 | 29.7 |
| X-Plane 11.11 (2018) | 77.8 | 65.1 | 59.1 | 29.4 | |
| Far Cry 5 (2018) | 59 | 30 | 25 | 21 | |
| F1 2019 (2019) | 110 | 49 | 37 | 31 |
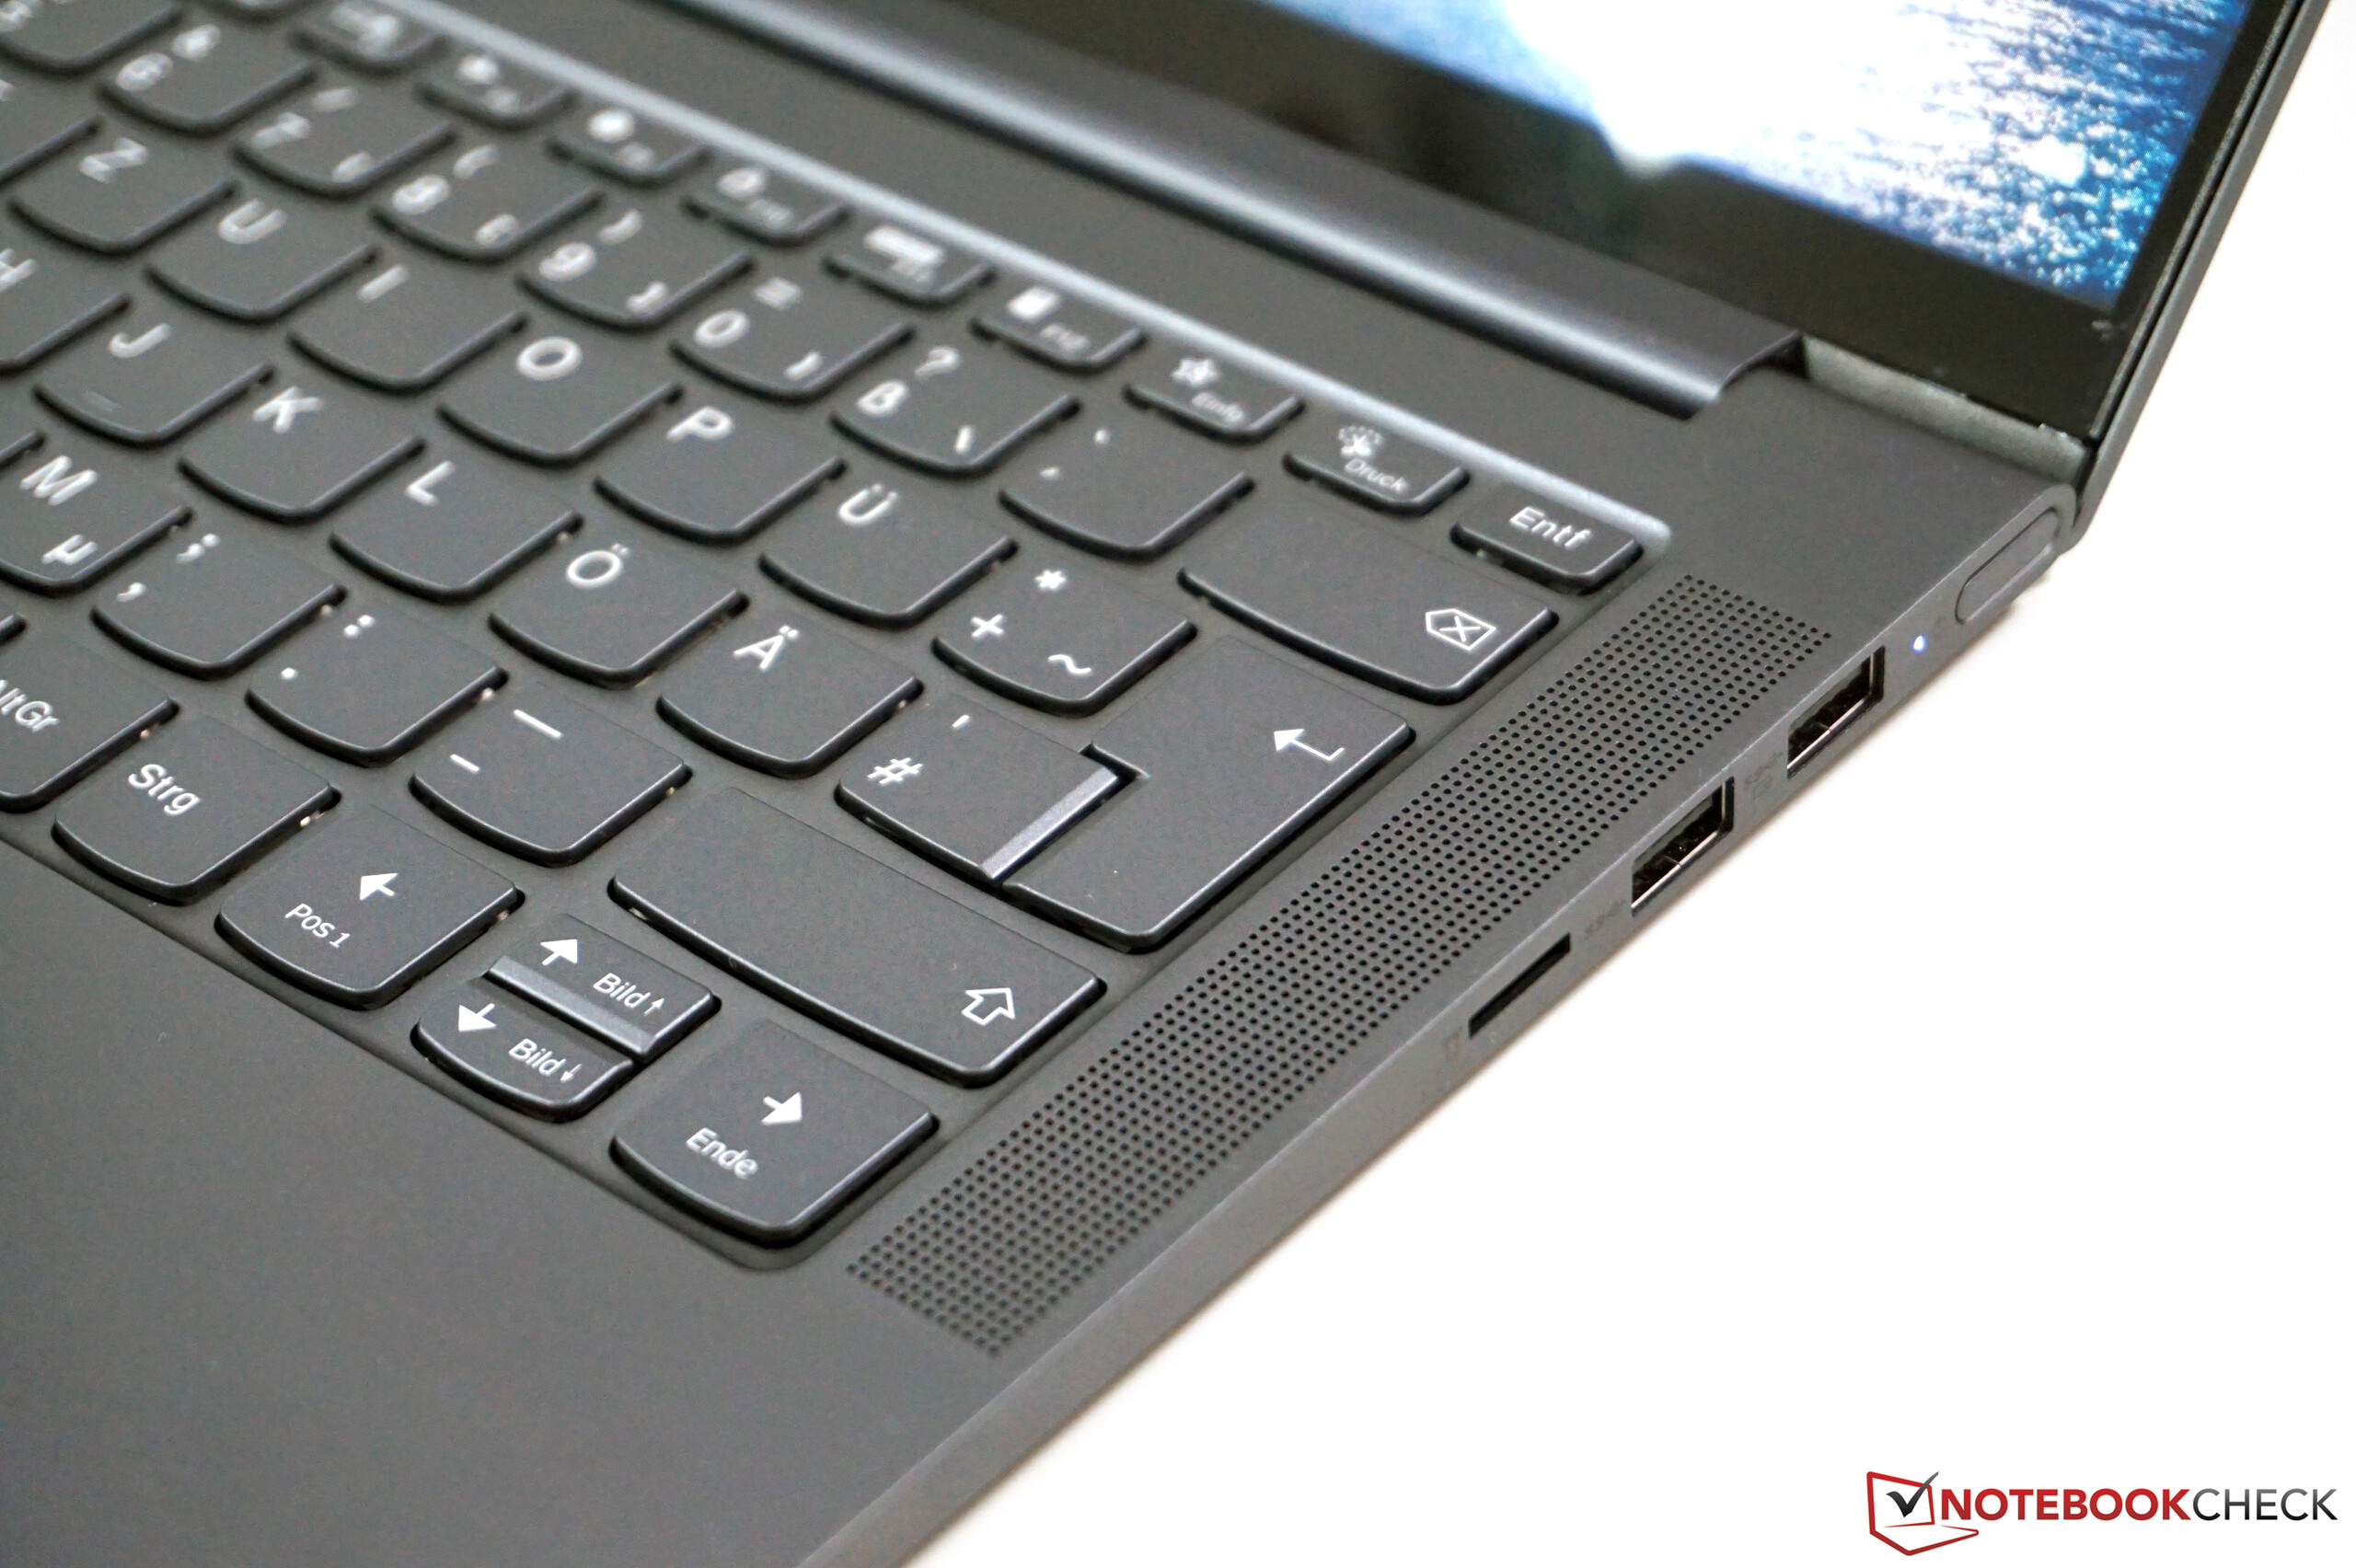
Emissions - The Yoga gets quite loud
Noise emissions
The fan is usually very quiet or disabled for simple tasks. But as soon as you put load either on the CPU or the GPU, it immediately jumps to the maximum level and also becomes very clearly audible at 41.5 dB(A); as a result, it's one step away from becoming annoying. Considering performance in particular, we would've expected a better result here. The AMD version of the Yoga Slim 7 has a clear advantage here too. At least we couldn't hear any coil whine.
Noise Level
| Idle |
| 29.3 / 29.3 / 30.5 dB(A) |
| Load |
| 41.5 / 41.5 dB(A) |
 | ||
30 dB silent 40 dB(A) audible 50 dB(A) loud |
||
min: | ||
| Lenovo Yoga Slim 7-14IIL05 GeForce MX350, i7-1065G7, WDC PC SN730 SDBPNTY-512G | Lenovo Yoga Slim 7-14ARE Vega 8, R7 4800U, Samsung SSD PM981a MZVLB512HBJQ | Asus ZenBook 14 UX434FL-DB77 GeForce MX250, i7-8565U, WDC PC SN520 SDAPNUW-512G | Asus VivoBook Flip 14 TM420IA Vega 7, R7 4700U, Samsung PM991 MZVLQ512HALU | Acer Swift 3 SF314-42-R4XJ Vega 7, R7 4700U, Samsung PM991 MZVLQ1T0HALB | |
|---|---|---|---|---|---|
| Noise | 13% | 6% | 7% | 4% | |
| off / environment * | 29.3 | 26.3 10% | 26.2 11% | 27.1 8% | 31.2 -6% |
| Idle Minimum * | 29.3 | 26.5 10% | 26.2 11% | 27.1 8% | 31.2 -6% |
| Idle Average * | 29.3 | 26.5 10% | 27.2 7% | 27.1 8% | 31.2 -6% |
| Idle Maximum * | 30.5 | 26.5 13% | 27.2 11% | 27.1 11% | 31.2 -2% |
| Load Average * | 41.5 | 31.8 23% | 41.5 -0% | 35 16% | 33.8 19% |
| Witcher 3 ultra * | 41.5 | 35.9 13% | 39.7 4% | 41.3 -0% | 36.3 13% |
| Load Maximum * | 41.5 | 35.9 13% | 41.1 1% | 41.3 -0% | 33.5 19% |
* ... smaller is better
Temperature
The Intel model clearly has the disadvantage when it comes to surface temperatures too; the additional dedicated graphics card is simply an additional processor that needs to be cooled. As a result, we register over 45 °C (~113 °F) at several measuring points under load, both at the top and bottom.
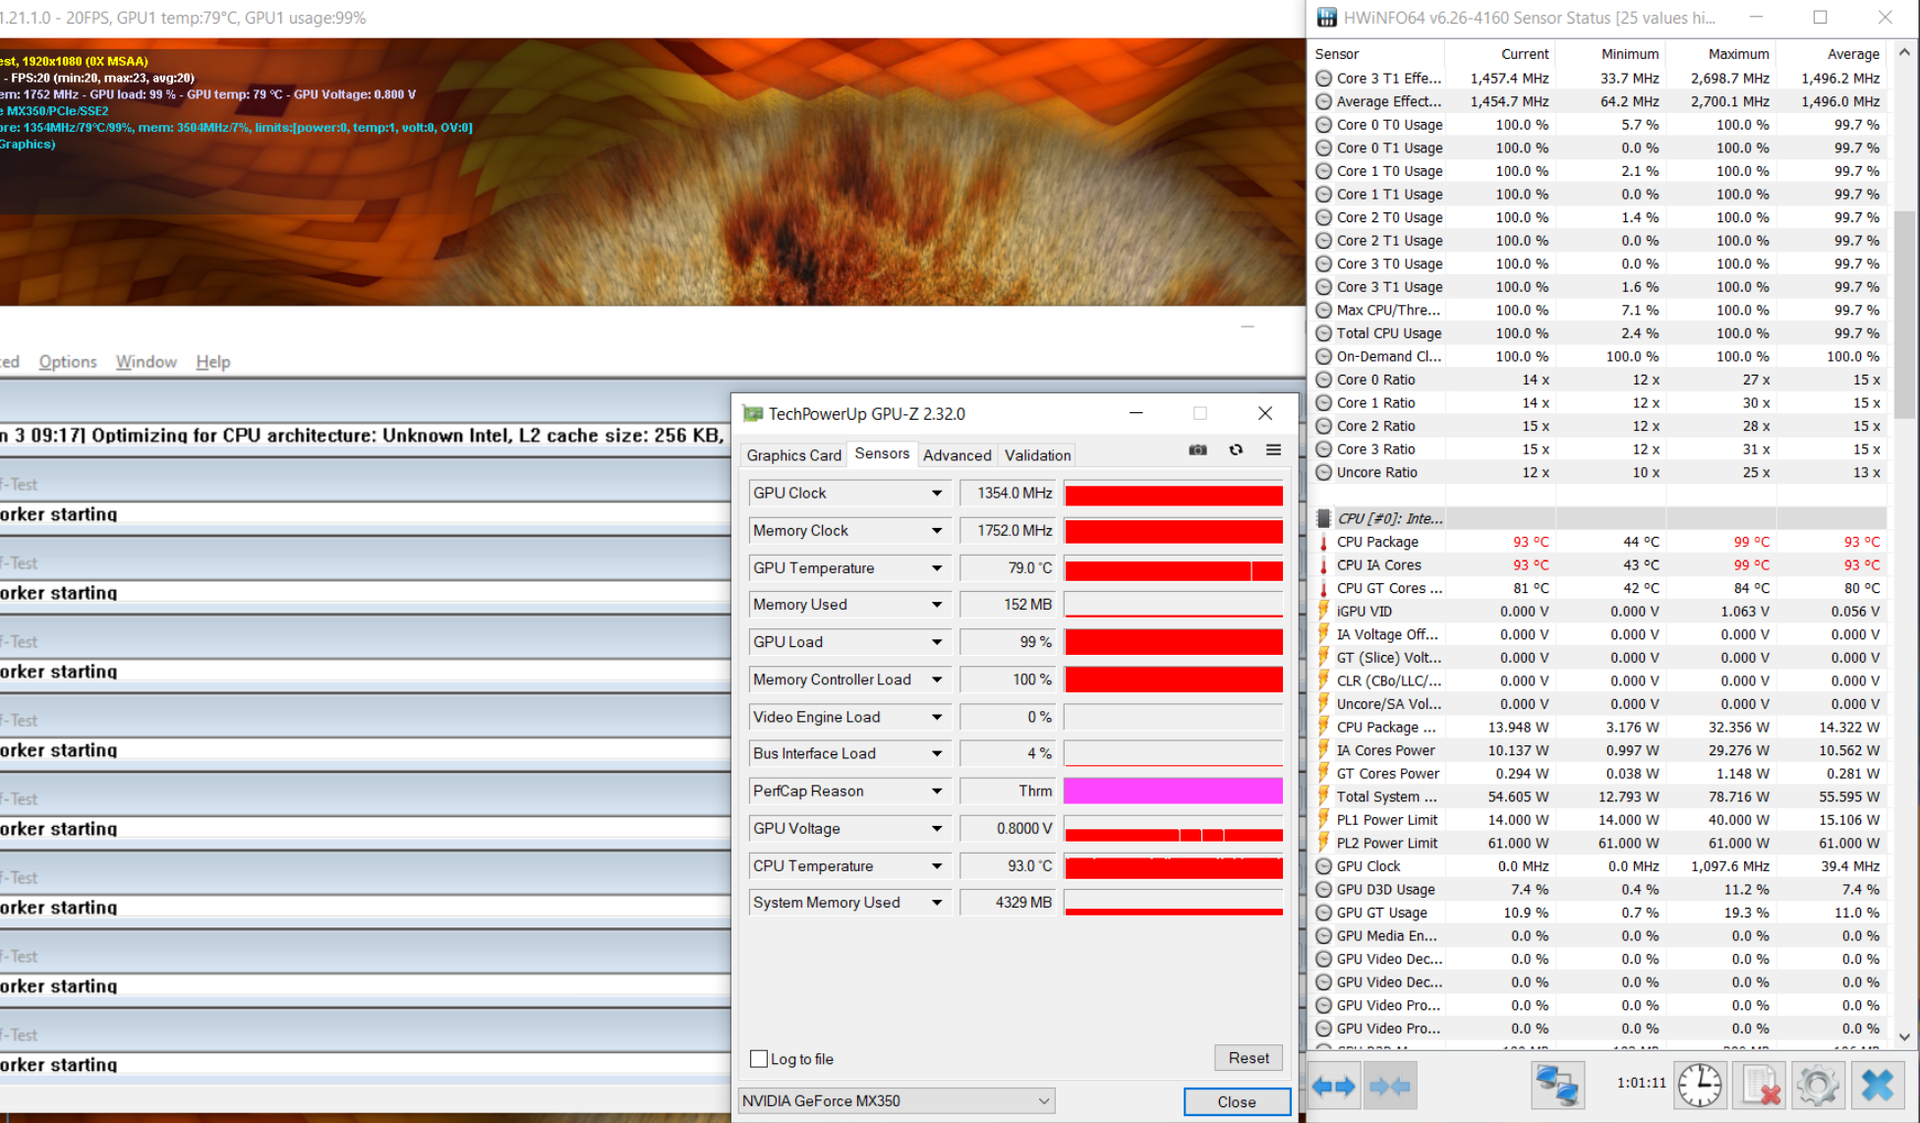
During the stress test, the graphics card's clock speed drops from just under 1,600 to 1,350 MHz, but the CPU cores undergo a sharper decline from 2.4-2.5 GHz to 1.4-1.5 GHz (14 watts). But there are no limitations after the stress test.
(-) The maximum temperature on the upper side is 47 °C / 117 F, compared to the average of 36.9 °C / 98 F, ranging from 21.1 to 71 °C for the class Multimedia.
(-) The bottom heats up to a maximum of 56.3 °C / 133 F, compared to the average of 39.2 °C / 103 F
(+) In idle usage, the average temperature for the upper side is 25.8 °C / 78 F, compared to the device average of 31.3 °C / 88 F.
(±) Playing The Witcher 3, the average temperature for the upper side is 36 °C / 97 F, compared to the device average of 31.3 °C / 88 F.
(+) The palmrests and touchpad are reaching skin temperature as a maximum (32.3 °C / 90.1 F) and are therefore not hot.
(-) The average temperature of the palmrest area of similar devices was 28.7 °C / 83.7 F (-3.6 °C / -6.4 F).
Speakers
Lenovo Yoga Slim 7-14IIL05 audio analysis
(±) | speaker loudness is average but good (75.1 dB)
Bass 100 - 315 Hz
(±) | reduced bass - on average 11.4% lower than median
(±) | linearity of bass is average (10.3% delta to prev. frequency)
Mids 400 - 2000 Hz
(±) | higher mids - on average 5.3% higher than median
(+) | mids are linear (5.9% delta to prev. frequency)
Highs 2 - 16 kHz
(+) | balanced highs - only 3.9% away from median
(+) | highs are linear (6.7% delta to prev. frequency)
Overall 100 - 16.000 Hz
(±) | linearity of overall sound is average (20% difference to median)
Compared to same class
» 64% of all tested devices in this class were better, 8% similar, 28% worse
» The best had a delta of 5%, average was 18%, worst was 45%
Compared to all devices tested
» 50% of all tested devices were better, 8% similar, 42% worse
» The best had a delta of 4%, average was 24%, worst was 134%
Asus ZenBook 14 UX434FL-DB77 audio analysis
(±) | speaker loudness is average but good (75.6 dB)
Bass 100 - 315 Hz
(±) | reduced bass - on average 12% lower than median
(±) | linearity of bass is average (14% delta to prev. frequency)
Mids 400 - 2000 Hz
(+) | balanced mids - only 4.3% away from median
(+) | mids are linear (6.2% delta to prev. frequency)
Highs 2 - 16 kHz
(+) | balanced highs - only 1.9% away from median
(+) | highs are linear (6.5% delta to prev. frequency)
Overall 100 - 16.000 Hz
(+) | overall sound is linear (14.6% difference to median)
Compared to same class
» 29% of all tested devices in this class were better, 6% similar, 65% worse
» The best had a delta of 5%, average was 19%, worst was 53%
Compared to all devices tested
» 18% of all tested devices were better, 4% similar, 78% worse
» The best had a delta of 4%, average was 24%, worst was 134%
Energy management - On par in terms of battery life
Energy consumption
The additional graphics card also has a negative effect on power consumption. Especially under load, power consumption is significantly higher, but the two versions are almost equal in idle usage. The value settles at around 60 watts during the stress test. The included power adapter (95 watts) is completely adequate.
| Off / Standby | |
| Idle | |
| Load |
|
Key:
min: | |
| Lenovo Yoga Slim 7-14IIL05 i7-1065G7, GeForce MX350, WDC PC SN730 SDBPNTY-512G, , 1920x1080, 14" | Lenovo Yoga Slim 7-14ARE R7 4800U, Vega 8, Samsung SSD PM981a MZVLB512HBJQ, IPS, 1920x1080, 14" | Asus ZenBook 14 UX434FL-DB77 i7-8565U, GeForce MX250, WDC PC SN520 SDAPNUW-512G, IPS, 1920x1080, 14" | Asus VivoBook Flip 14 TM420IA R7 4700U, Vega 7, Samsung PM991 MZVLQ512HALU, IPS, 1920x1080, 14" | Acer Swift 3 SF314-42-R4XJ R7 4700U, Vega 7, Samsung PM991 MZVLQ1T0HALB, IPS, 1920x1080, 14" | Average NVIDIA GeForce MX350 | Average of class Multimedia | |
|---|---|---|---|---|---|---|---|
| Power Consumption | 7% | 18% | 19% | 28% | -12% | -50% | |
| Idle Minimum * | 3.7 | 4 -8% | 2.9 22% | 4 -8% | 2.8 24% | 3.97 ? -7% | 5.9 ? -59% |
| Idle Average * | 5.7 | 6.3 -11% | 6.2 -9% | 6.4 -12% | 4.8 16% | 8.26 ? -45% | 10.6 ? -86% |
| Idle Maximum * | 8.2 | 7.7 6% | 7 15% | 7 15% | 6.7 18% | 10.7 ? -30% | 12.6 ? -54% |
| Load Average * | 57.1 | 48.3 15% | 47.1 18% | 34.6 39% | 28 51% | 55.2 ? 3% | 67.6 ? -18% |
| Witcher 3 ultra * | 54 | 49 9% | 34.7 36% | 35 35% | 57 -6% | ||
| Load Maximum * | 82.8 | 57.6 30% | 62.8 24% | 45.1 46% | 31 63% | 65.8 ? 21% | 110.1 ? -33% |
* ... smaller is better
Battery life
The two versions aren't that different either when it comes to our WLAN test, and you can expect about 10 hours. If we increase the brightness to the maximum, battery life is reduced by one hour. Especially when playing videos, however, the test device leaves a good impression with a runtime of over 13 hours.
| Lenovo Yoga Slim 7-14IIL05 i7-1065G7, GeForce MX350, 61 Wh | Lenovo Yoga Slim 7-14ARE R7 4800U, Vega 8, 61 Wh | Asus ZenBook 14 UX434FL-DB77 i7-8565U, GeForce MX250, 50 Wh | Asus VivoBook Flip 14 TM420IA R7 4700U, Vega 7, 42 Wh | Acer Swift 3 SF314-42-R4XJ R7 4700U, Vega 7, 48.85 Wh | Average of class Multimedia | |
|---|---|---|---|---|---|---|
| Battery Runtime | -1% | 40% | -19% | 25% | 19% | |
| H.264 | 818 | 968 18% | 954 ? 17% | |||
| WiFi v1.3 | 593 | 619 4% | 440 -26% | 479 -19% | 715 21% | 690 ? 16% |
| Load | 83 | 79 -5% | 171 106% | 114 37% | 102.6 ? 24% | |
| Reader / Idle | 1623 | 966 | 1392 | 1285 ? |
Pros
Cons
Verdict - The Yoga Slim 7 with AMD is the better all-rounder

Lenovo doesn't make many changes when it comes to the AMD and Intel versions of its Yoga Slim 7. Apart from the Thunderbolt 3 port in the Intel Yoga, both the case and the connectivity are identical. The Chinese manufacturer installs an additional dedicated GPU from Nvidia so as to provide a somewhat better graphics performance. This offers a slight advantage, especially when playing games, but also leads to increased emissions. The fan speed increases very quickly under load and gets comparatively loud as well. In addition, the surface temperatures are higher than on the AMD model.
The CPU performance is not bad for a quad-core processor, but AMD is very clearly ahead with its current Ryzen processors, especially if you can make use of the additional computing cores. Other advantages are the lower temperatures and the quieter fan noise.
With the Intel/Nvidia combination, the Yoga Slim 7 14 has an advantage when it comes to gaming performance, but overall, the AMD model is the much better all-rounder.
The Yoga Slim 7 with the Ryzen 7 4800U made a good impression on us in the test, but the model with this processor is currently very difficult to get due to supply bottlenecks. Alternatively, the Slim 7 14 is also available with the somewhat weaker Ryzen 7 4700U and the slower Vega 7 iGPU. If you want to game a lot, you can take a calm look at the Intel model of the Yoga Slim 7 14, but the AMD models are the better all-rounders and thus the better choice for many users.
Lenovo Yoga Slim 7-14IIL05
- 10/22/2020 v7 (old)
Andreas Osthoff
More articles related to this device
Lenovo Yoga Slim 7-14IIL05 (Yoga Slim 7 14 Series)Related Articles


Price comparison

