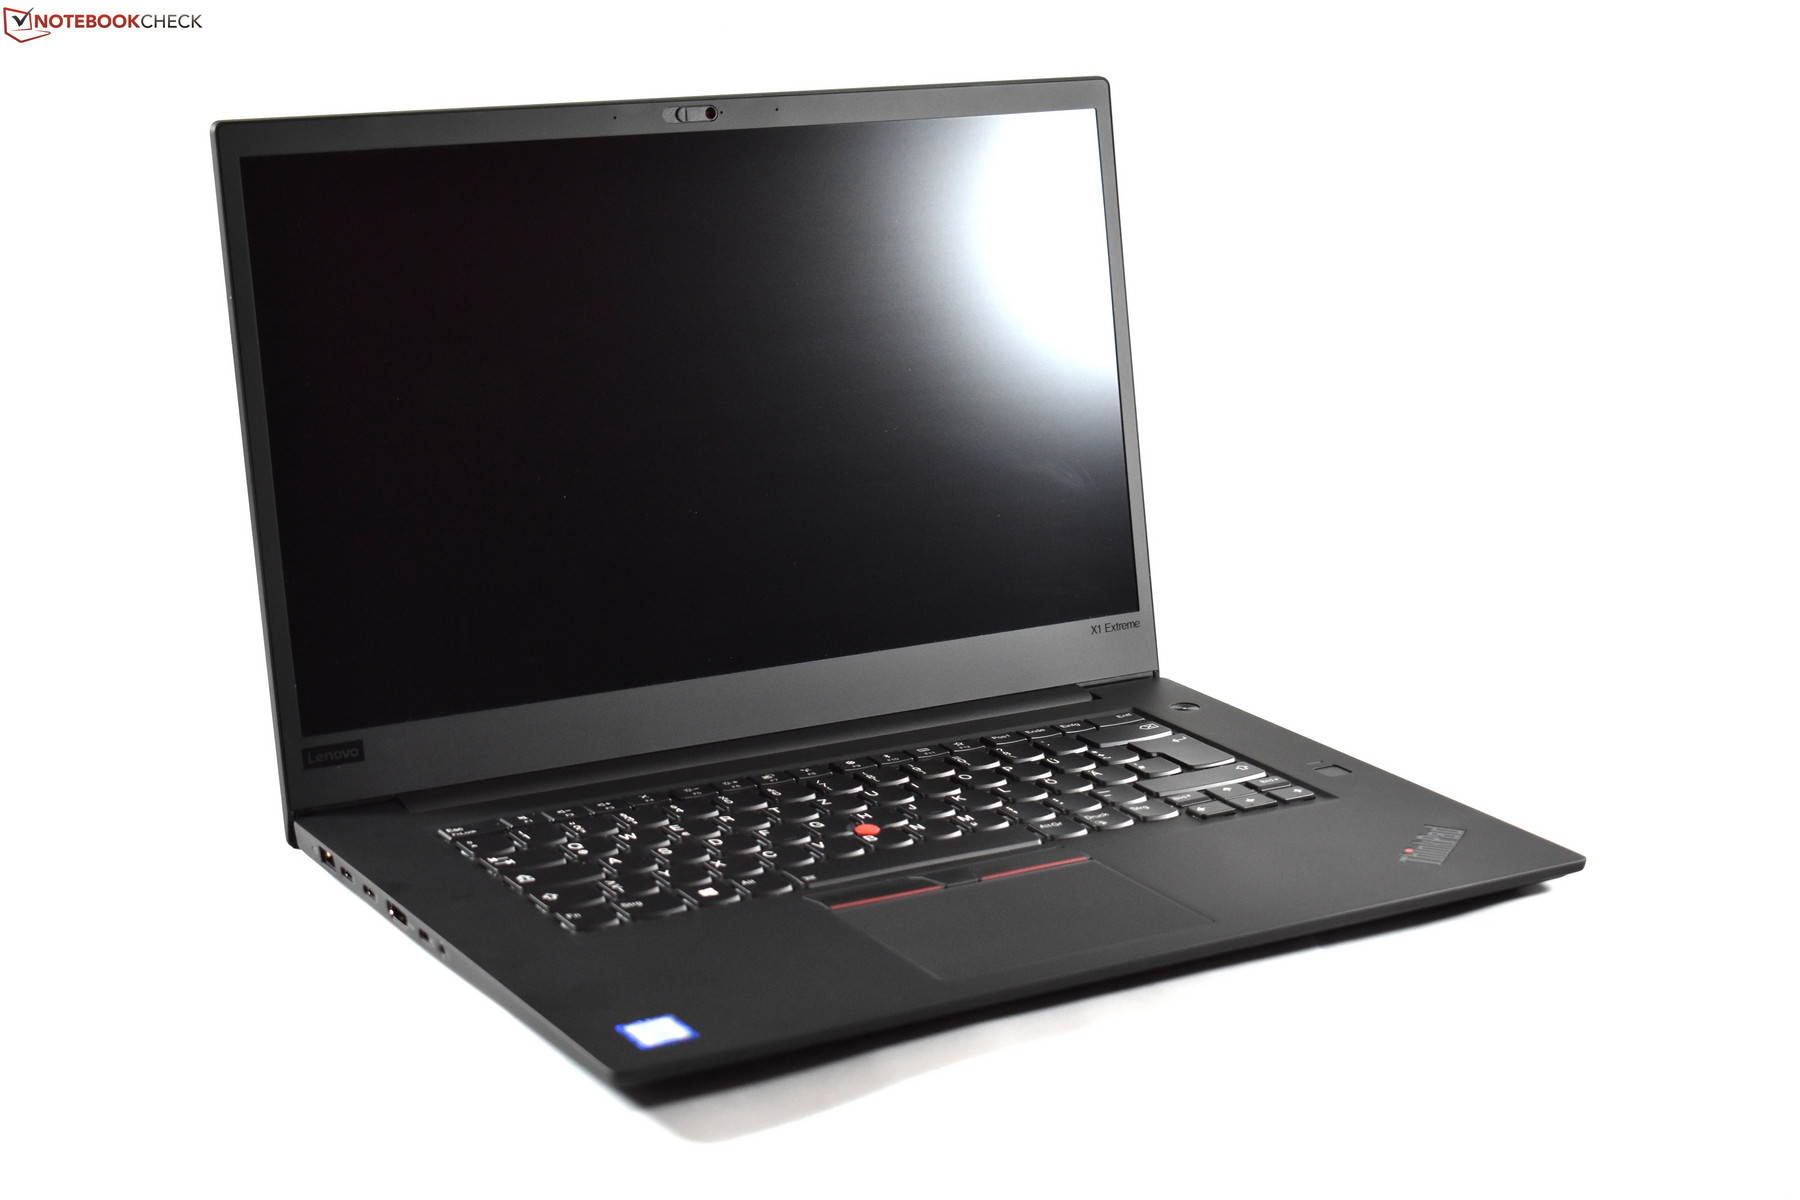
Lenovo ThinkPad X1 Extreme (i5, FHD, GTX 1050 Ti Max-Q) Laptop Review
The PC market is changing, and this change also affects the business laptop submarket. Unit sales are falling, which is why the PC manufacturers have started to focus more on expensive premium models with better margins. The new Lenovo ThinkPad X1 Extreme is exemplary for this change: The venerable ThinkPad brand, normally mostly associated with genuine business laptops, will now go head to head with high-end multimedia laptops such as the Apple MacBook Pro 15 2018 and the Dell XPS 15 9570.
A short while ago, we reviewed a high-end configuration of the ThinkPad X1 Extreme. Today, we will test a low-end model of the Lenovo laptop. Of course, a low-end configuration of the X1 Extreme is still pricey in its own right: The model we are reviewing today includes an Intel Core i5-8300H, a 256 GB SSD, 8 GB of RAM, the Nvidia GeForce GTX 1050 Ti Max-Q as well as the FHD IPS display option. With these components, the X1 Extreme still costs around 2,100 Euros (~$2,400). In the USA, such a model would be significantly cheaper, although it must be noted that German prices include VAT as well as a three-year warranty package – US models of the X1 Extreme sometimes have a one-year standard warranty only. Please see our Guarantees, Return policies and Warranties FAQ for country-specific information.
Since we have already have reviewed the ThinkPad X1 Extreme with the 4K UHD screen exhaustively, this review is just an update that mostly focuses on the display and internal differences. For detailed information about the chassis, the connectivity, the speakers and the input-devices, we refer to the review of the high-end X1 Extreme.
Case
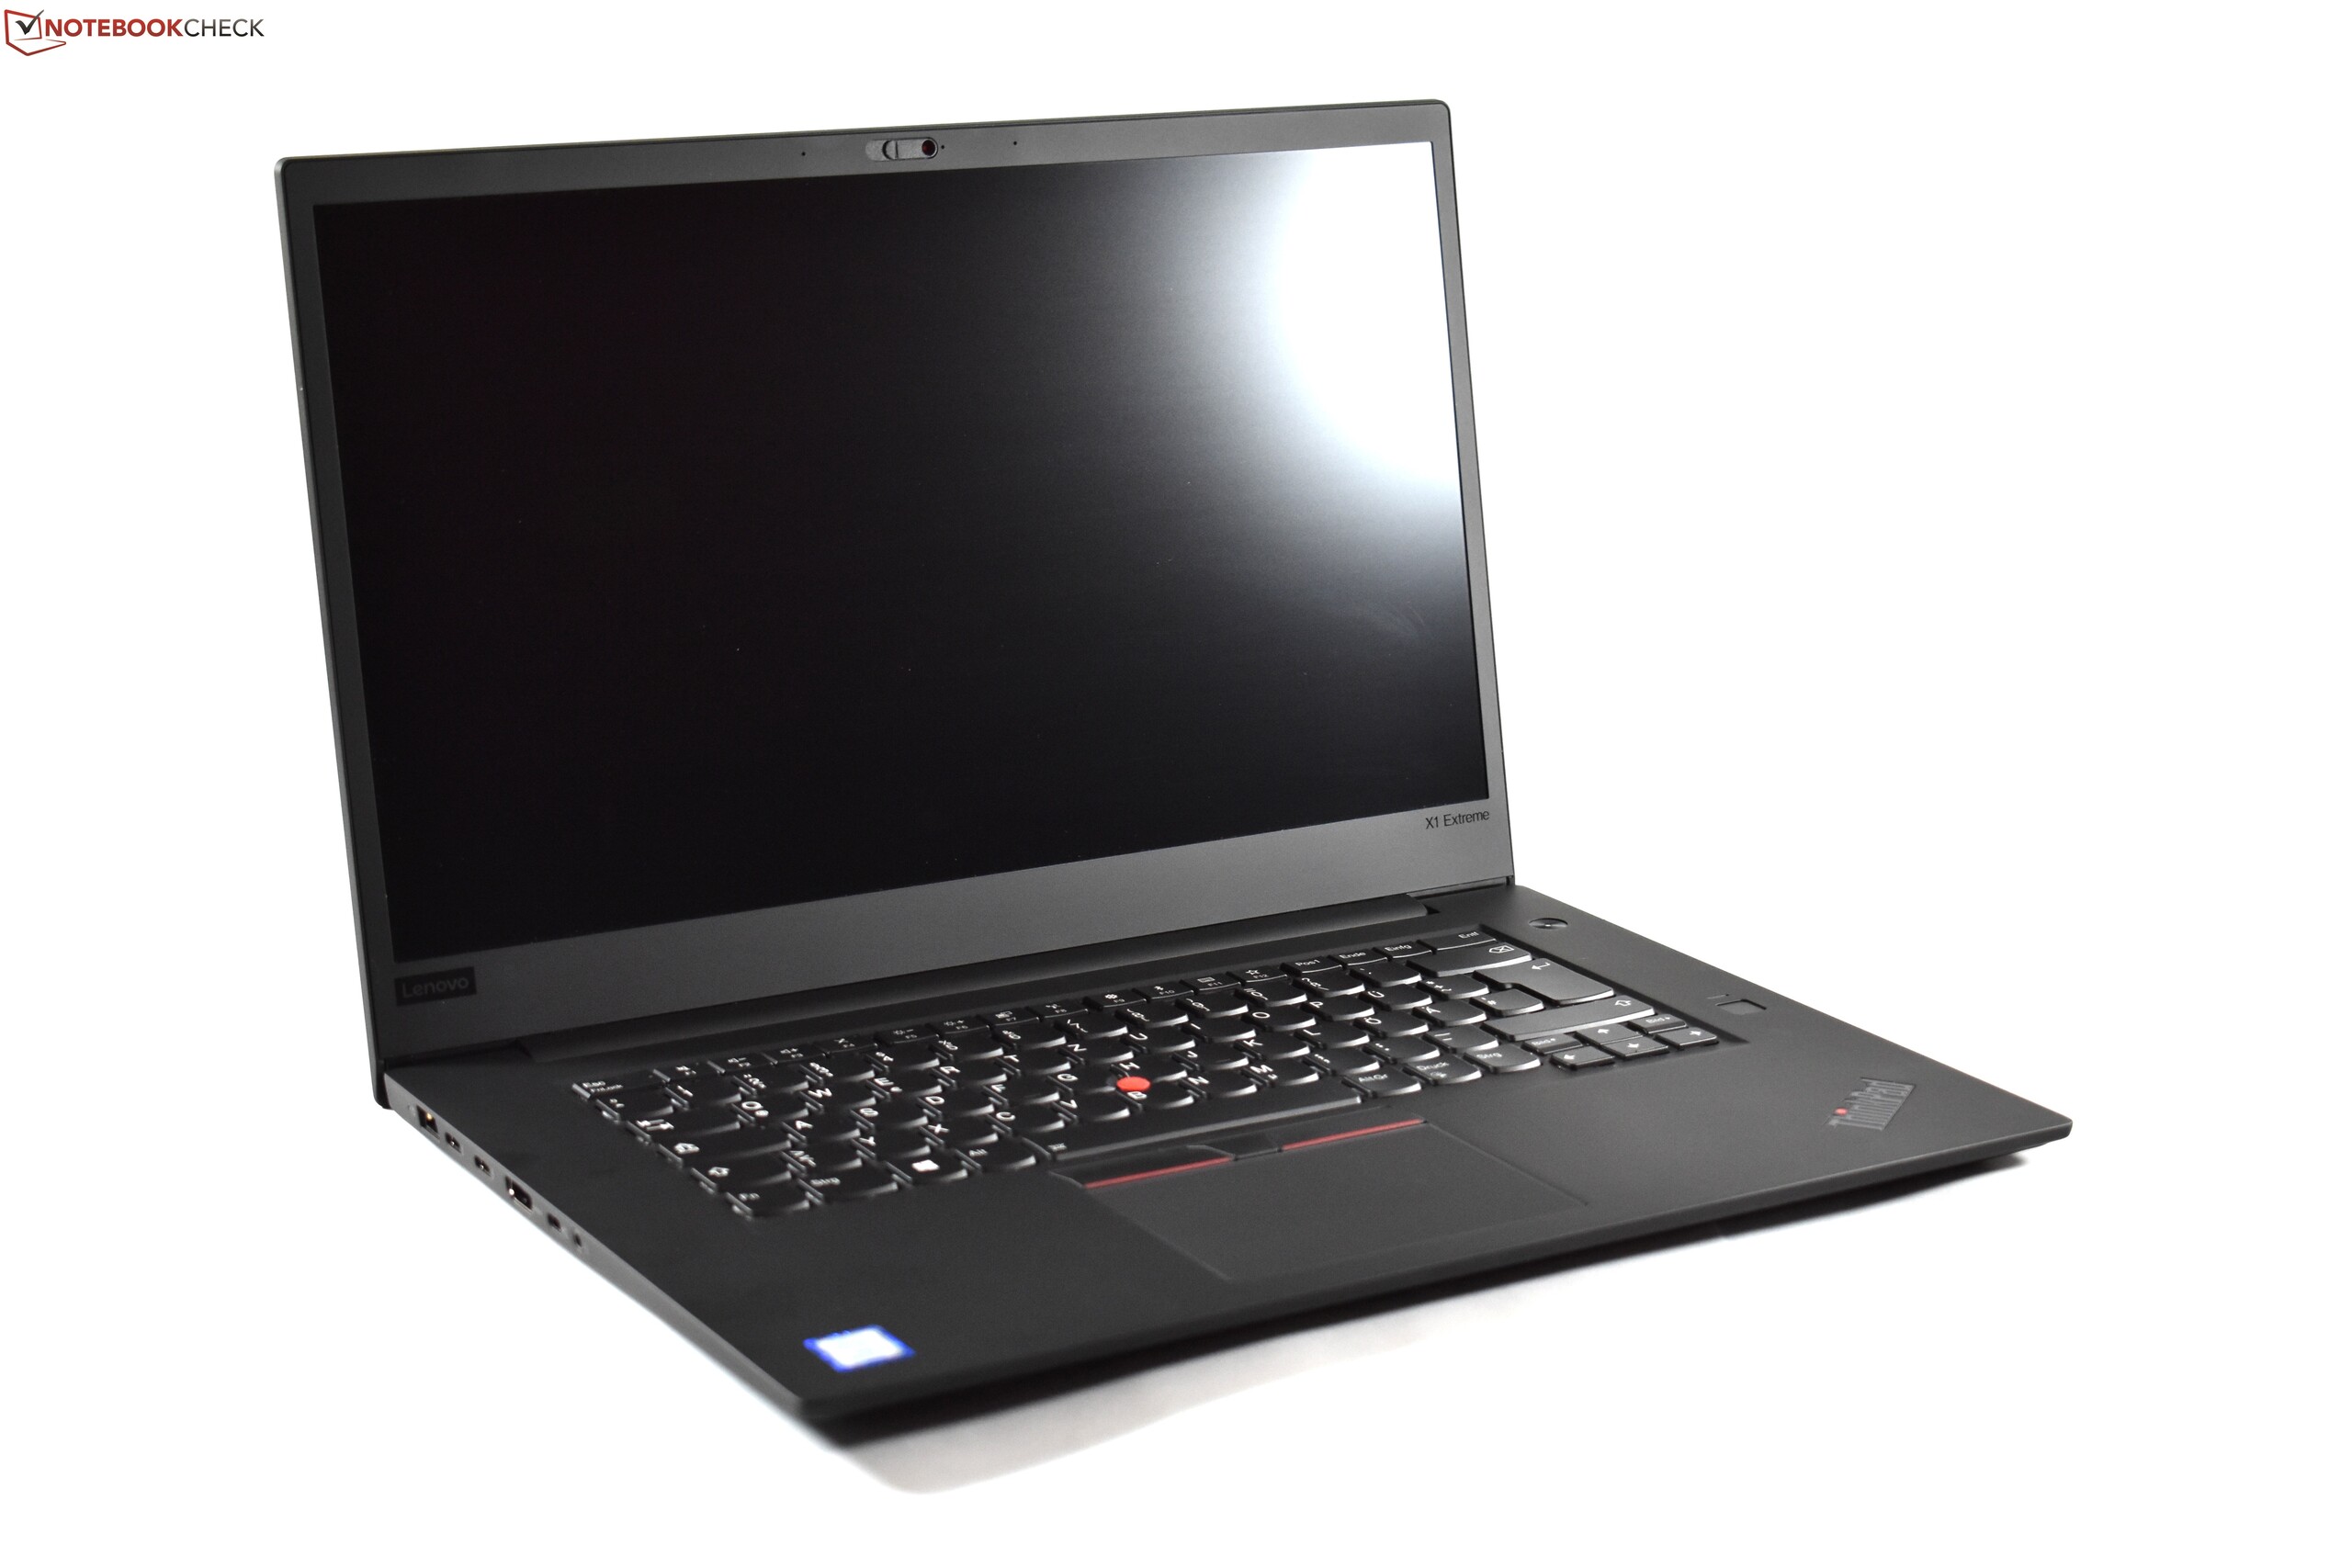
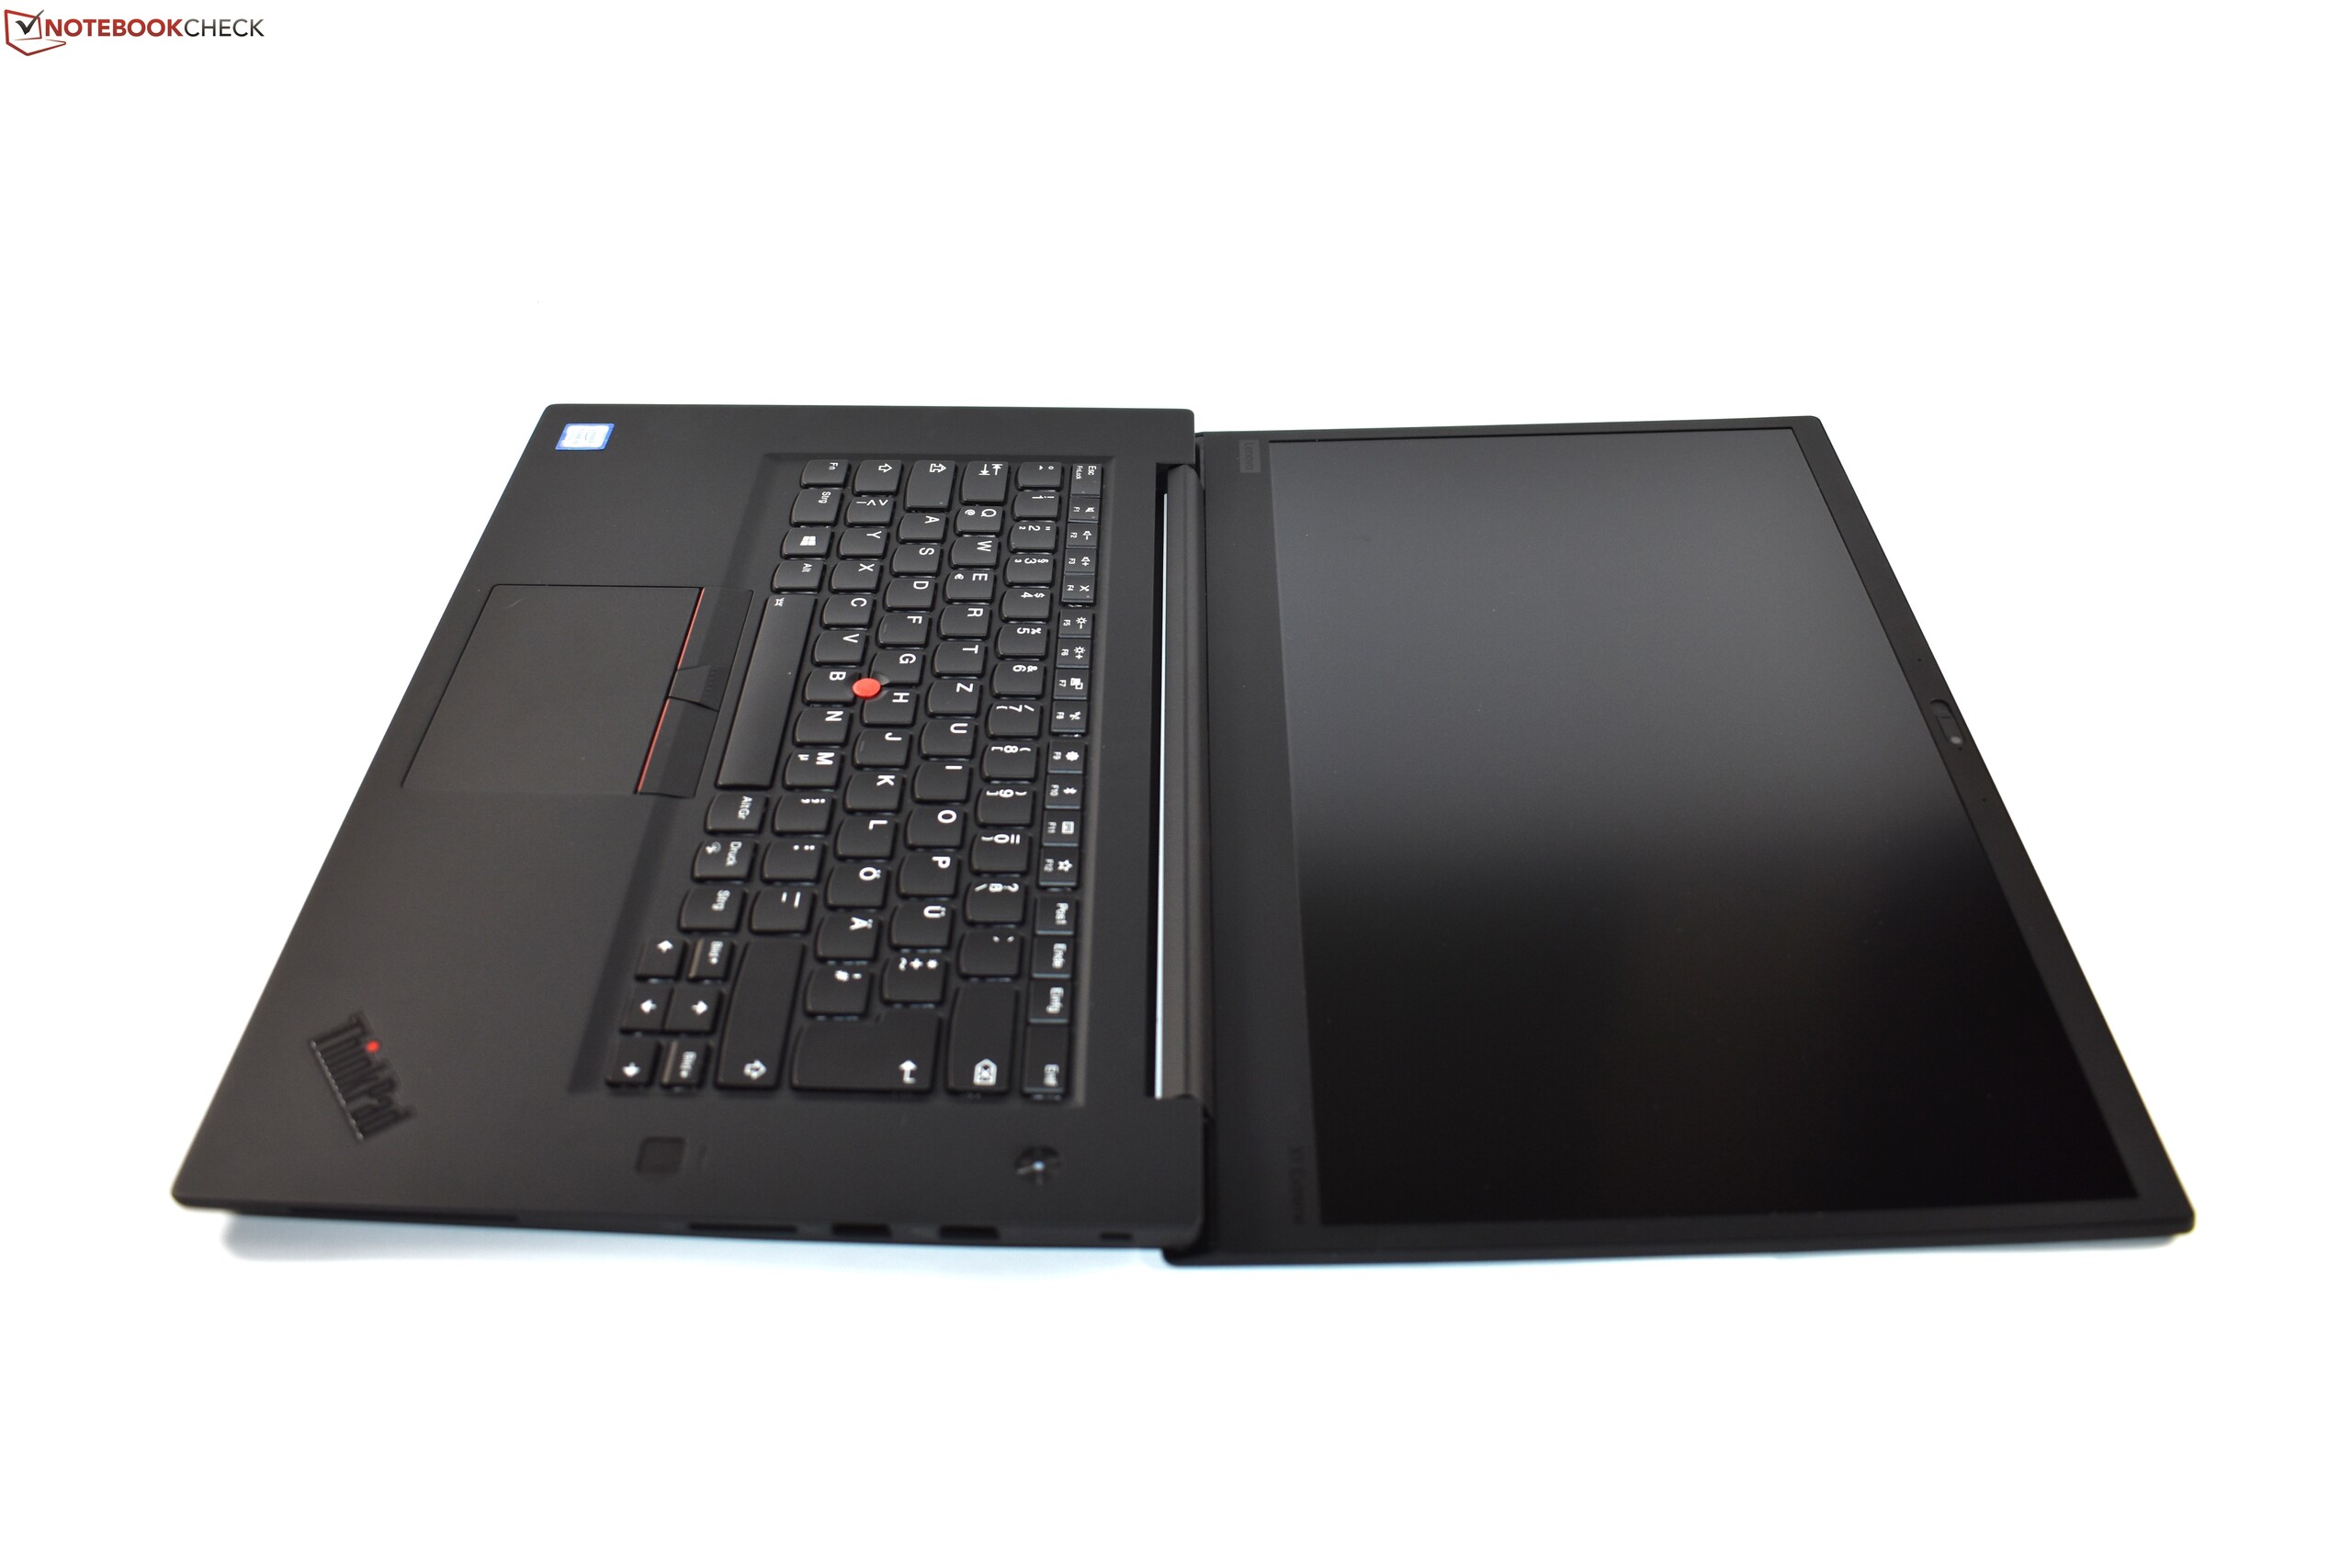
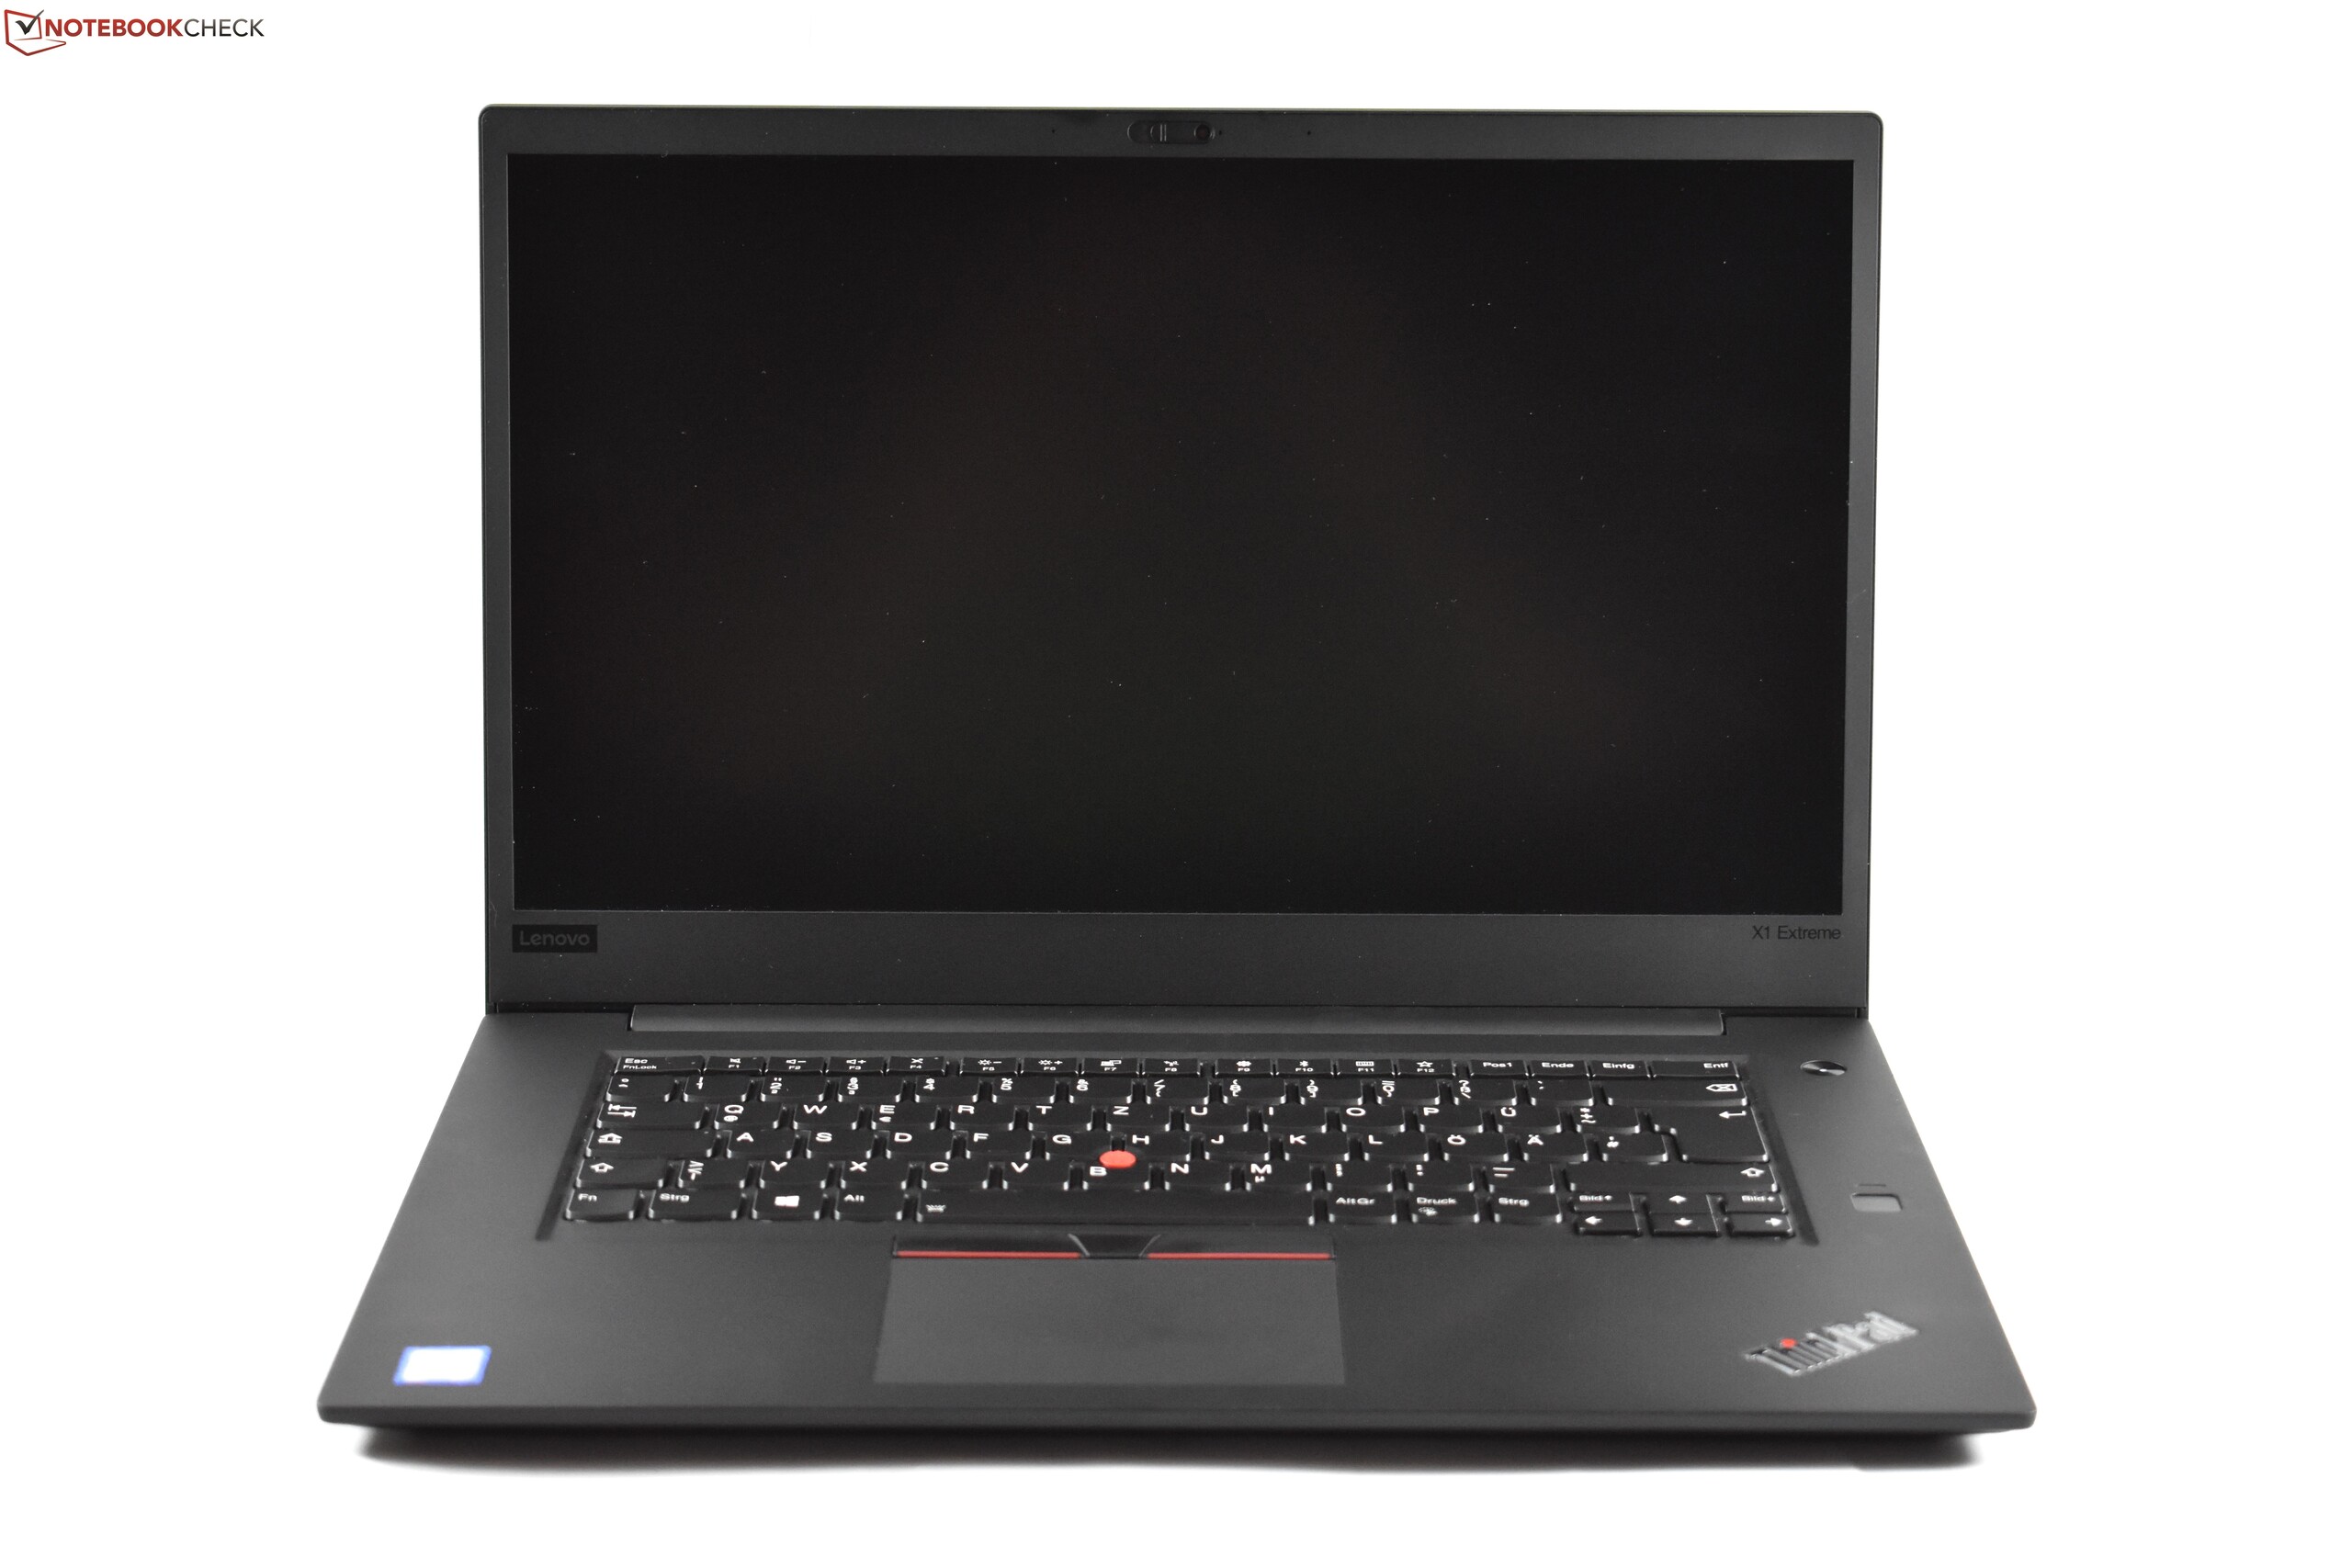
The chassis of today’s unit is mostly identical with the first X1 Extreme we reviewed. But there is one very important difference: The base-model of the X1 Extreme with the FHD display has a matte display without a touch-layer and also without the glass-layer in front of the screen. Because of this difference, the case is a little bit lighter (roughly 100 g / 0.3 lbs) and slightly thinner (0.3 mm / 0.02 inches) as well. Also, the audible lid creaking sounds that we noticed with the 4K SKU are nowhere to be found here. The stability of the display cover is pretty good for such a thin lid. The rubberized Carbon and Aluminium chassis is overall very stable and it has a premium feel.
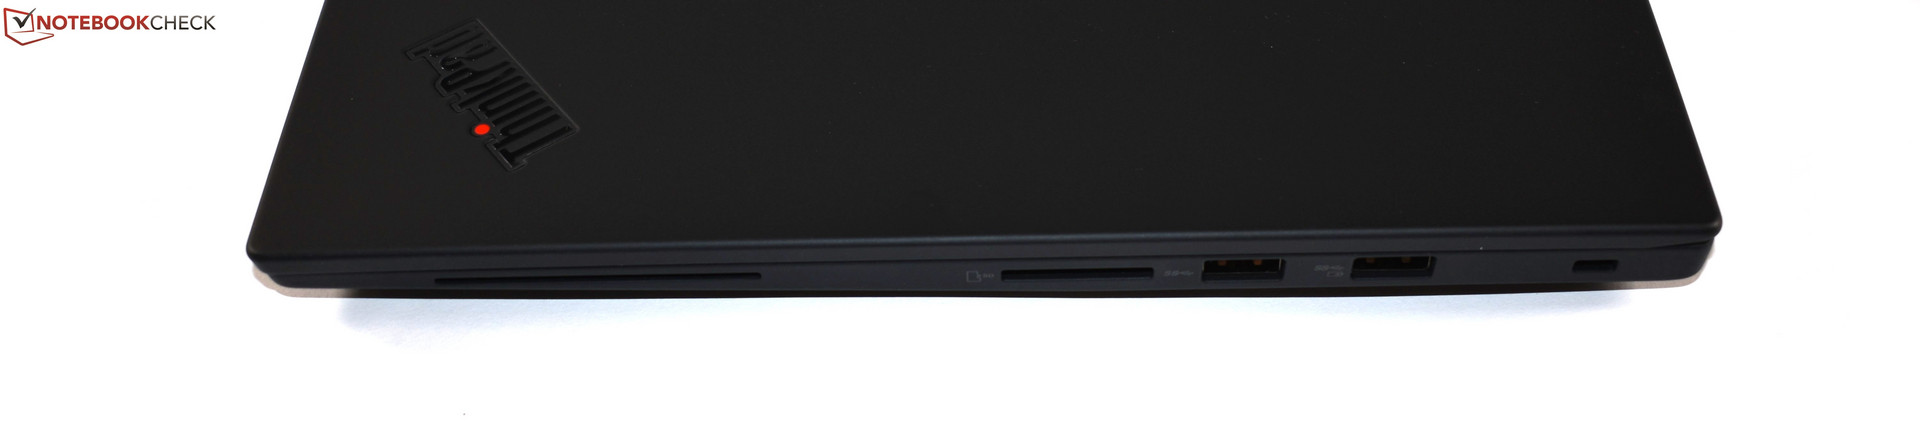
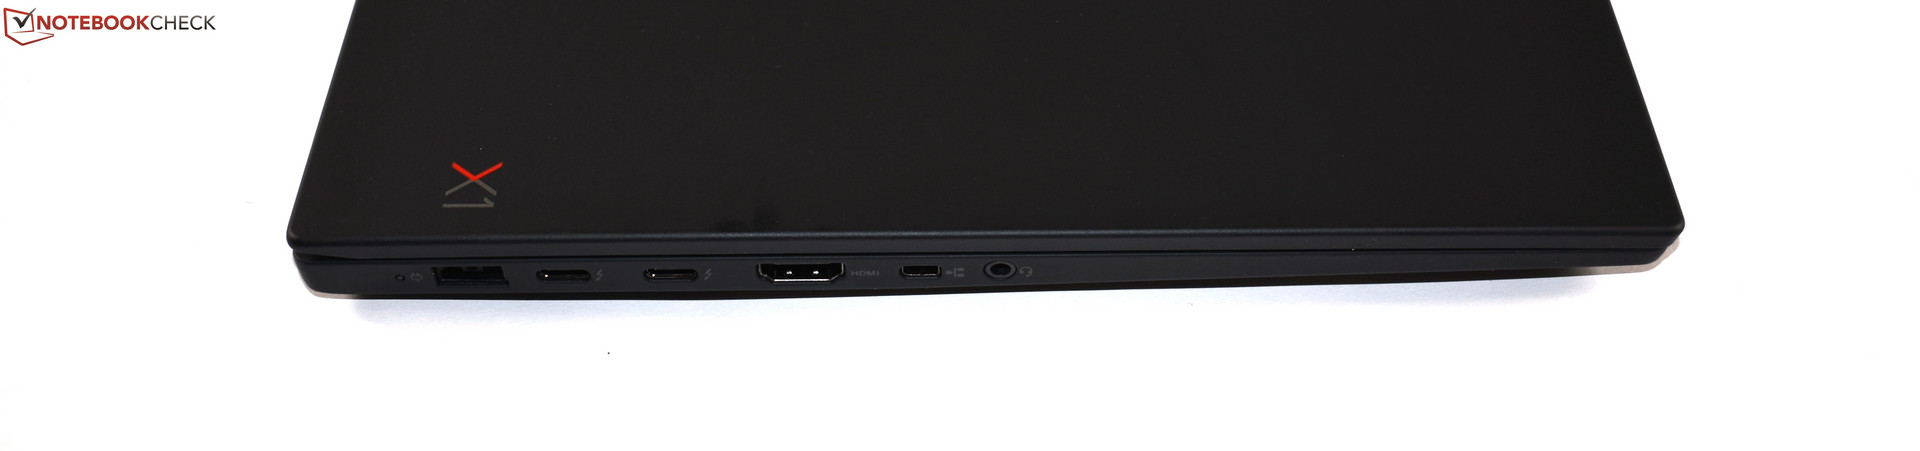
Connectivity
| SD Card Reader | |
| average JPG Copy Test (av. of 3 runs) | |
| Lenovo ThinkPad X1 Extreme-20MF000RGE (Toshiba Exceria Pro SDXC 64 GB UHS-II) | |
| Lenovo ThinkPad P52 20MAS03N00 (Toshiba Exceria Pro SDXC 64 GB UHS-II) | |
| Dell XPS 15 2018 i5 FHD 97Wh | |
| Average of class Multimedia (21.1 - 198, n=40, last 2 years) | |
| Lenovo ThinkPad T580-20L9001AUS (Toshiba Exceria Pro SDXC 64 GB UHS-II) | |
| maximum AS SSD Seq Read Test (1GB) | |
| Lenovo ThinkPad X1 Extreme-20MF000RGE (Toshiba Exceria Pro SDXC 64 GB UHS-II) | |
| Dell XPS 15 2018 i5 FHD 97Wh | |
| Lenovo ThinkPad P52 20MAS03N00 (Toshiba Exceria Pro SDXC 64 GB UHS-II) | |
| Average of class Multimedia (27.4 - 262, n=40, last 2 years) | |
| Lenovo ThinkPad T580-20L9001AUS (Toshiba Exceria Pro SDXC 64 GB UHS-II) | |
| Networking | |
| iperf3 receive AX12 | |
| Lenovo ThinkPad X1 Extreme-20MF000RGE (iperf 3.1.3) | |
| Dell XPS 15 2018 i5 FHD 97Wh (I210-T1) | |
| HP EliteBook 1050 G1-4QY20EA (I210-T1) | |
| iperf3 transmit AX12 | |
| HP EliteBook 1050 G1-4QY20EA (I210-T1) | |
| Lenovo ThinkPad X1 Extreme-20MF000RGE (iperf 3.1.3) | |
| Dell XPS 15 2018 i5 FHD 97Wh (I210-T1) | |
Display

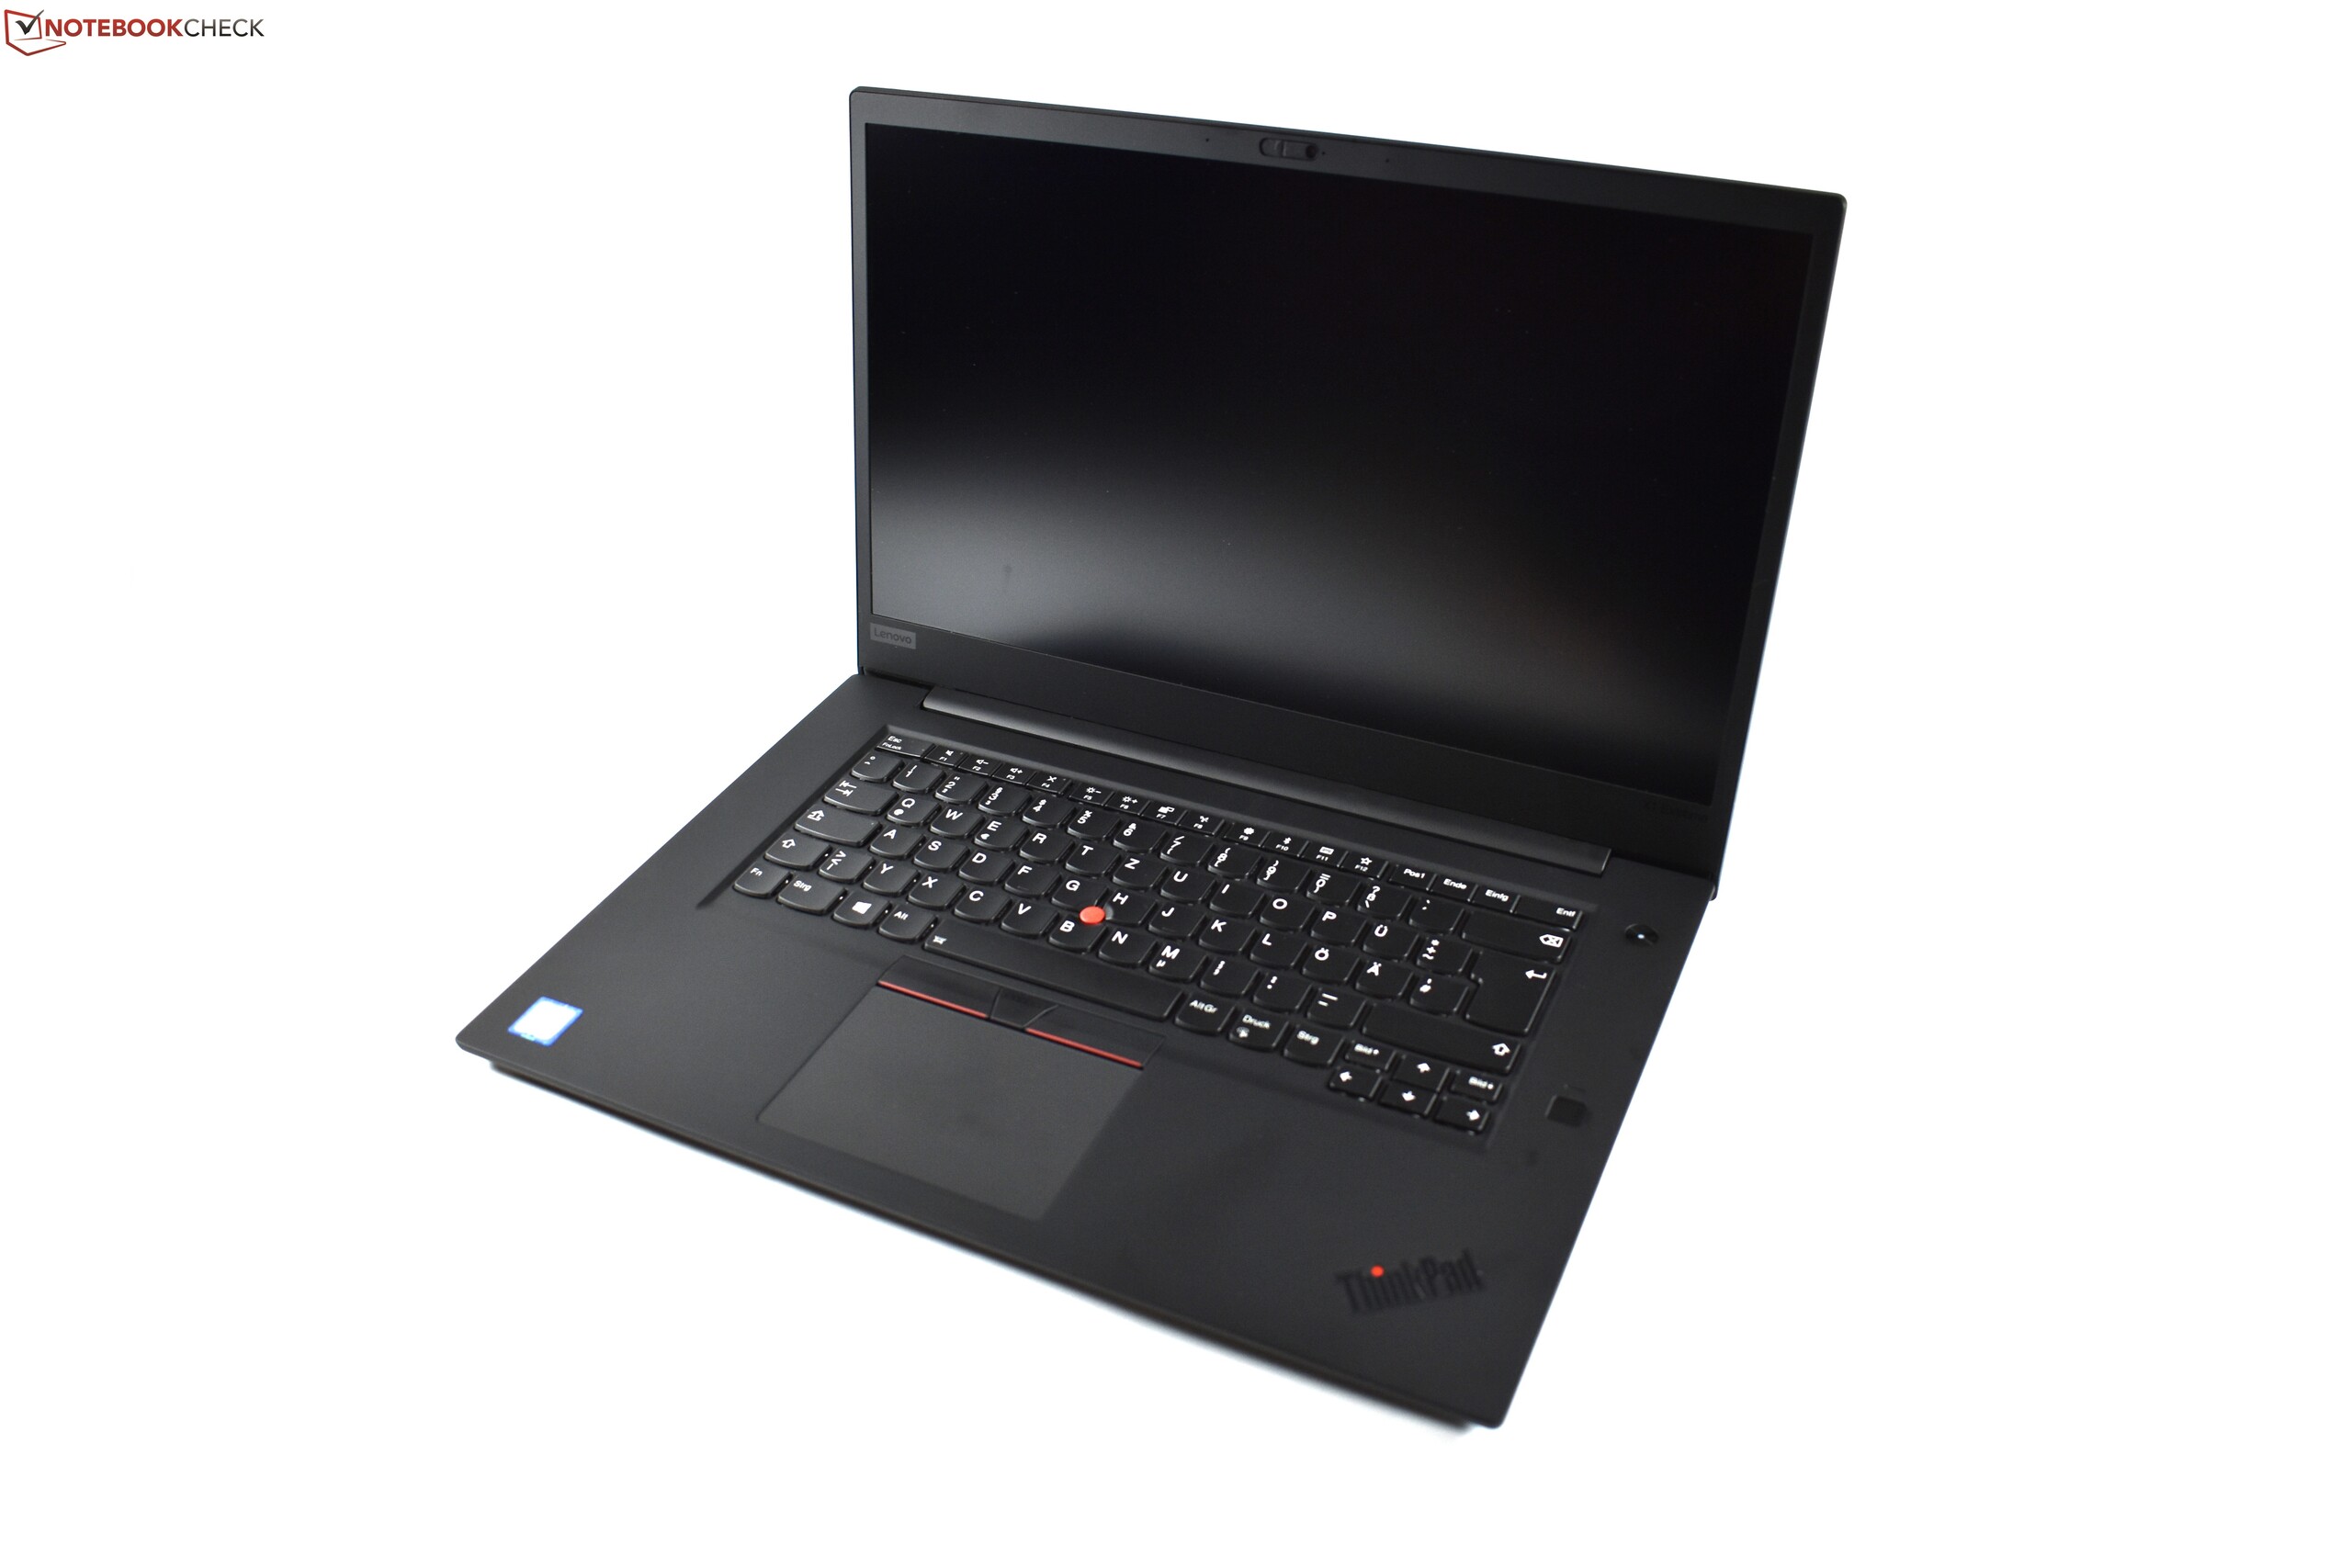
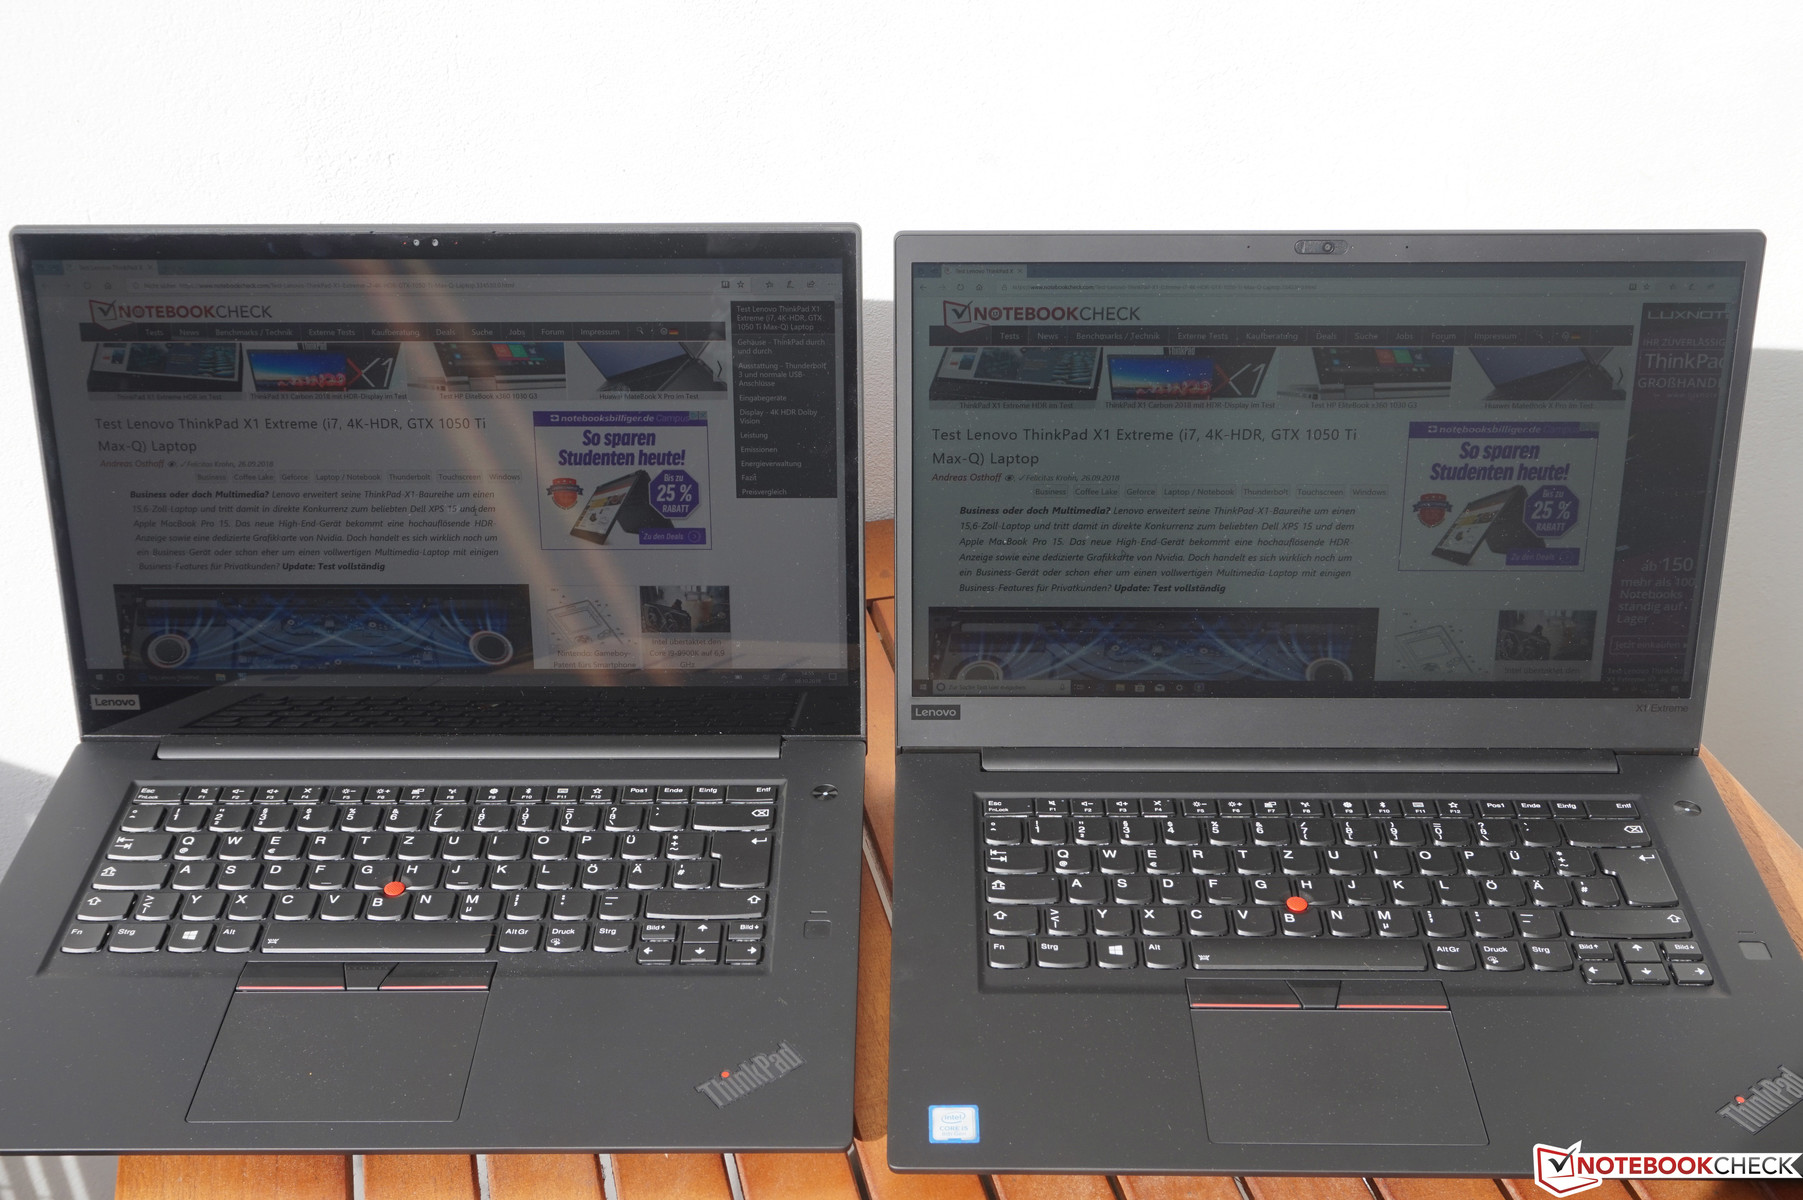
The matte 15.6-inch FHD (1,920x1,080) non-touch screen is undoubtedly the biggest differentiator between today's review-unit and the already reviewed Lenovo ThinkPad X1 Extreme, which sported a glossy 4K-UHD (3,840x2,160) display with touch. Both display options are based on IPS technology.
However, by choosing the FHD option, the buyer is playing the display lottery, as so often is the case: Our unit contained an LCD made by BOE (panel-number NV156FHM-N61) – alternatively, Lenovo uses an LCD panel made by Innolux (N156HCE-EN1) as well, so buyers never know which FHD panel they will get before buying. Luckily, we were already able to throughly measure the alternative Innolux display in the Lenovo ThinkPad P52, allowing us to compare both screens. As far as brightness goes, Lenovo promises 300 cd/m²; both screens pretty much reach this goal. The BOE screen is slightly brighter and has a marginally better contrast, while the Innolux panel scores better at the response times and color-gamut. All around, both panels are very similar, which means that Lenovo has done a good enough job to source panels from different manufacturers that are equivalent to one another.
The BOE FHD panel used in the Lenovo ThinkPad X1 Extreme (i7, 4K-HDR, GTX 1050 Ti Max-Q) Laptop ReviewX1 Extreme has an average brightness of 305 cd/m² – not bad, but with the pricing of the X1 Extreme in mind, we expect more. The Dell XPS 15 9570 shows how its done: Its low-end FHD option still achieves roughly 380 cd/m². That is the same brightness value that Lenovo's expensive 4K-UHD display option in the X1 Extreme offers. When compared with the cheaper business-class laptops such as the Lenovo ThinkPad T580, the Lenovo notebook X1 Extreme clearly has the better FHD display, although HP's EliteBook 850 G5 also outshines the X1 Extreme with a brighter FHD screen.
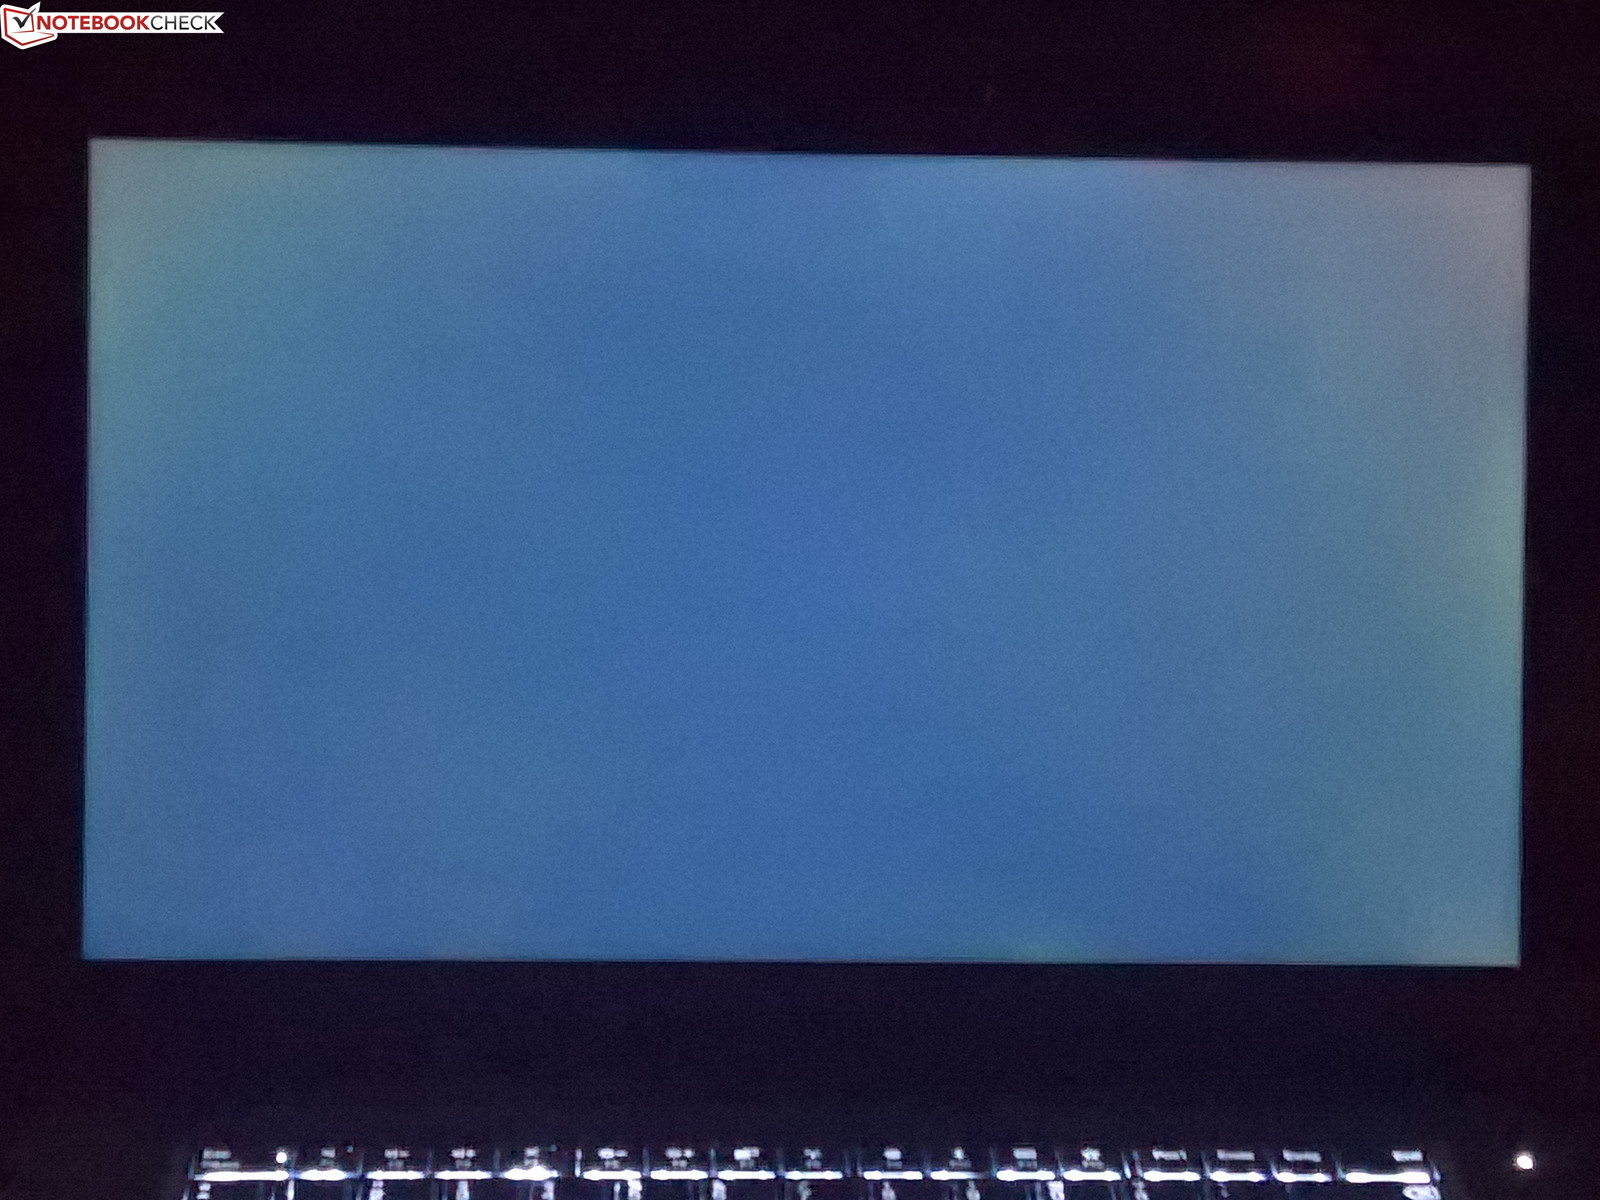
We measured PWM, but the frequency was so high that it should not result in headaches for anyone. Also, there was little backlight-bleeding and the brightness distribution was sufficient at 84%.
| |||||||||||||||||||||||||
Brightness Distribution: 84 %
Center on Battery: 332 cd/m²
Contrast: 1379:1 (Black: 0.24 cd/m²)
ΔE ColorChecker Calman: 5.6 | ∀{0.5-29.43 Ø4.78}
calibrated: 3
ΔE Greyscale Calman: 6.3 | ∀{0.09-98 Ø5}
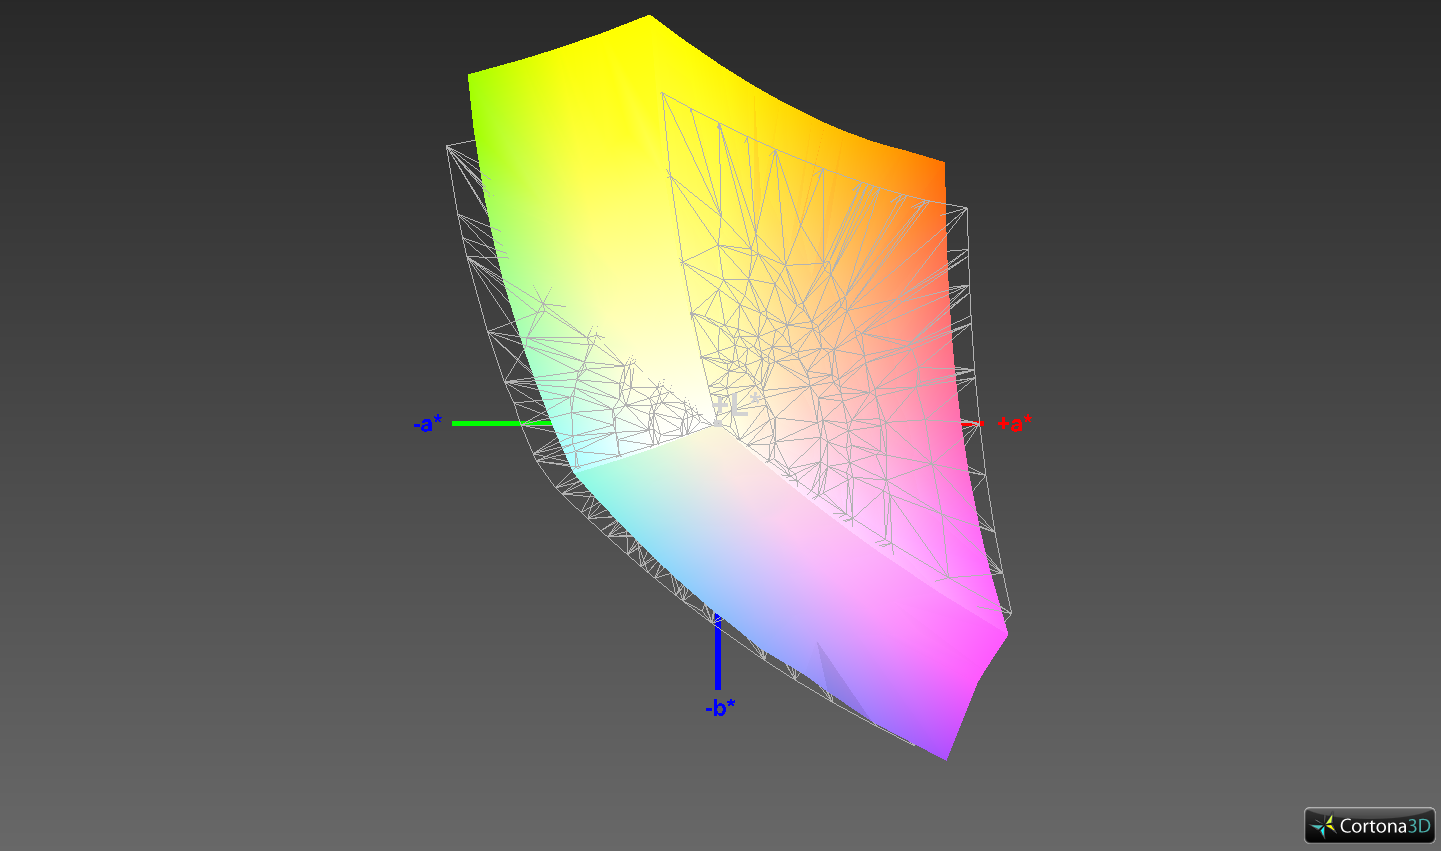
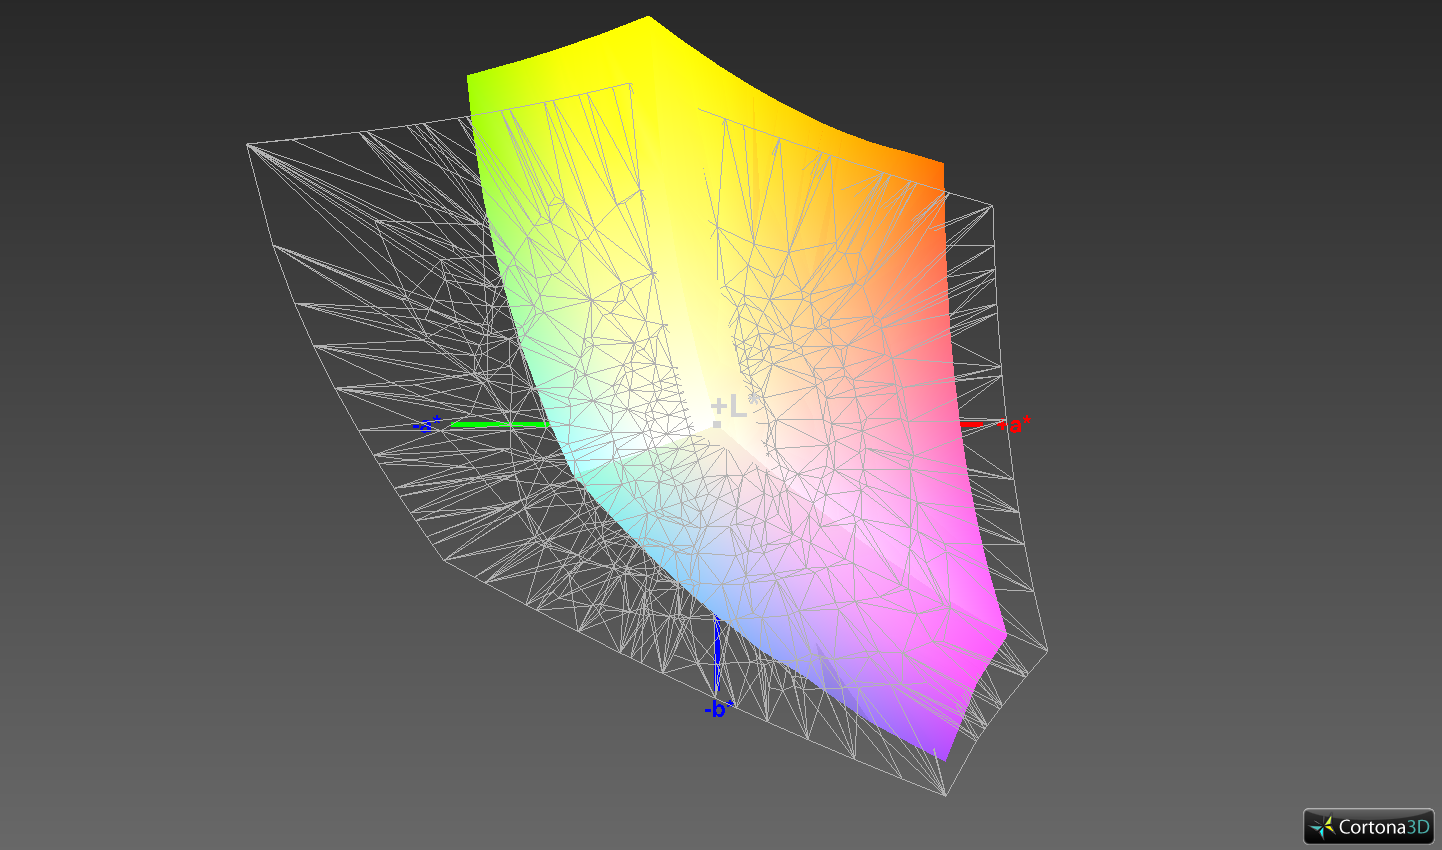
88.6% sRGB (Argyll 1.6.3 3D)
58% AdobeRGB 1998 (Argyll 1.6.3 3D)
64.8% AdobeRGB 1998 (Argyll 3D)
88.7% sRGB (Argyll 3D)
68.6% Display P3 (Argyll 3D)
Gamma: 2.33
CCT: 7152 K
| Lenovo ThinkPad X1 Extreme-20MF000RGE NV156FHM-N61, , 1920x1080, 15.6" | Dell XPS 15 2018 i5 FHD 97Wh Sharp SHP149A LQ156M1, , 1920x1080, 15.6" | Lenovo ThinkPad P52 20MAS03N00 N156HCE-EN1, , 1920x1080, 15.6" | Lenovo ThinkPad X1 Extreme-20MF000XGE B156ZAN03.2, , 3840x2160, 15.6" | Lenovo ThinkPad T580-20L9001AUS B156HAK02.0, , 1920x1080, 15.6" | HP EliteBook 850 G5 3JX58EA AUO24ED, , 1920x1080, 15.6" | |
|---|---|---|---|---|---|---|
| Display | 3% | 0% | 31% | -42% | -3% | |
| Display P3 Coverage (%) | 68.6 | 66 -4% | 65.6 -4% | 86.3 26% | 36.94 -46% | 63.4 -8% |
| sRGB Coverage (%) | 88.7 | 96.5 9% | 90.3 2% | 100 13% | 55.3 -38% | 88.8 0% |
| AdobeRGB 1998 Coverage (%) | 64.8 | 66.7 3% | 65.9 2% | 99.4 53% | 38.16 -41% | 64.4 -1% |
| Response Times | 12% | 27% | -3% | 30% | 26% | |
| Response Time Grey 50% / Grey 80% * (ms) | 52.8 ? | 49 ? 7% | 39.2 ? 26% | 61.6 ? -17% | 33.2 ? 37% | 42 ? 20% |
| Response Time Black / White * (ms) | 36 ? | 30 ? 17% | 26 ? 28% | 32 ? 11% | 27.6 ? 23% | 25 ? 31% |
| PWM Frequency (Hz) | 21370 ? | 961 ? | 25250 ? | |||
| Screen | 22% | 4% | 21% | -20% | -6% | |
| Brightness middle (cd/m²) | 331 | 413 25% | 304 -8% | 396 20% | 254.5 -23% | 402 21% |
| Brightness (cd/m²) | 305 | 378 24% | 293 -4% | 380 25% | 238 -22% | 383 26% |
| Brightness Distribution (%) | 84 | 86 2% | 88 5% | 90 7% | 87 4% | 88 5% |
| Black Level * (cd/m²) | 0.24 | 0.29 -21% | 0.26 -8% | 0.28 -17% | 0.27 -13% | 0.41 -71% |
| Contrast (:1) | 1379 | 1424 3% | 1169 -15% | 1414 3% | 943 -32% | 980 -29% |
| Colorchecker dE 2000 * | 5.6 | 2.44 56% | 4.5 20% | 4 29% | 4.58 18% | 5.25 6% |
| Colorchecker dE 2000 max. * | 9.9 | 4.46 55% | 7.7 22% | 7.6 23% | 17.99 -82% | 8.65 13% |
| Colorchecker dE 2000 calibrated * | 3 | 2.48 17% | 2.4 20% | 0.9 70% | 4.34 -45% | 5.19 -73% |
| Greyscale dE 2000 * | 6.3 | 2.48 61% | 5.2 17% | 6.1 3% | 3.3 48% | 4 37% |
| Gamma | 2.33 94% | 2.43 91% | 2.26 97% | 2.25 98% | 2.403 92% | 2.68 82% |
| CCT | 7152 91% | 7006 93% | 6789 96% | 7786 83% | 6355 102% | 6756 96% |
| Color Space (Percent of AdobeRGB 1998) (%) | 58 | 62 7% | 53.8 -7% | 88.5 53% | 35 -40% | 58 0% |
| Color Space (Percent of sRGB) (%) | 88.6 | 96 8% | 90.1 2% | 100 13% | 55 -38% | 89 0% |
| Total Average (Program / Settings) | 12% /
17% | 10% /
6% | 16% /
20% | -11% /
-18% | 6% /
-1% |
* ... smaller is better
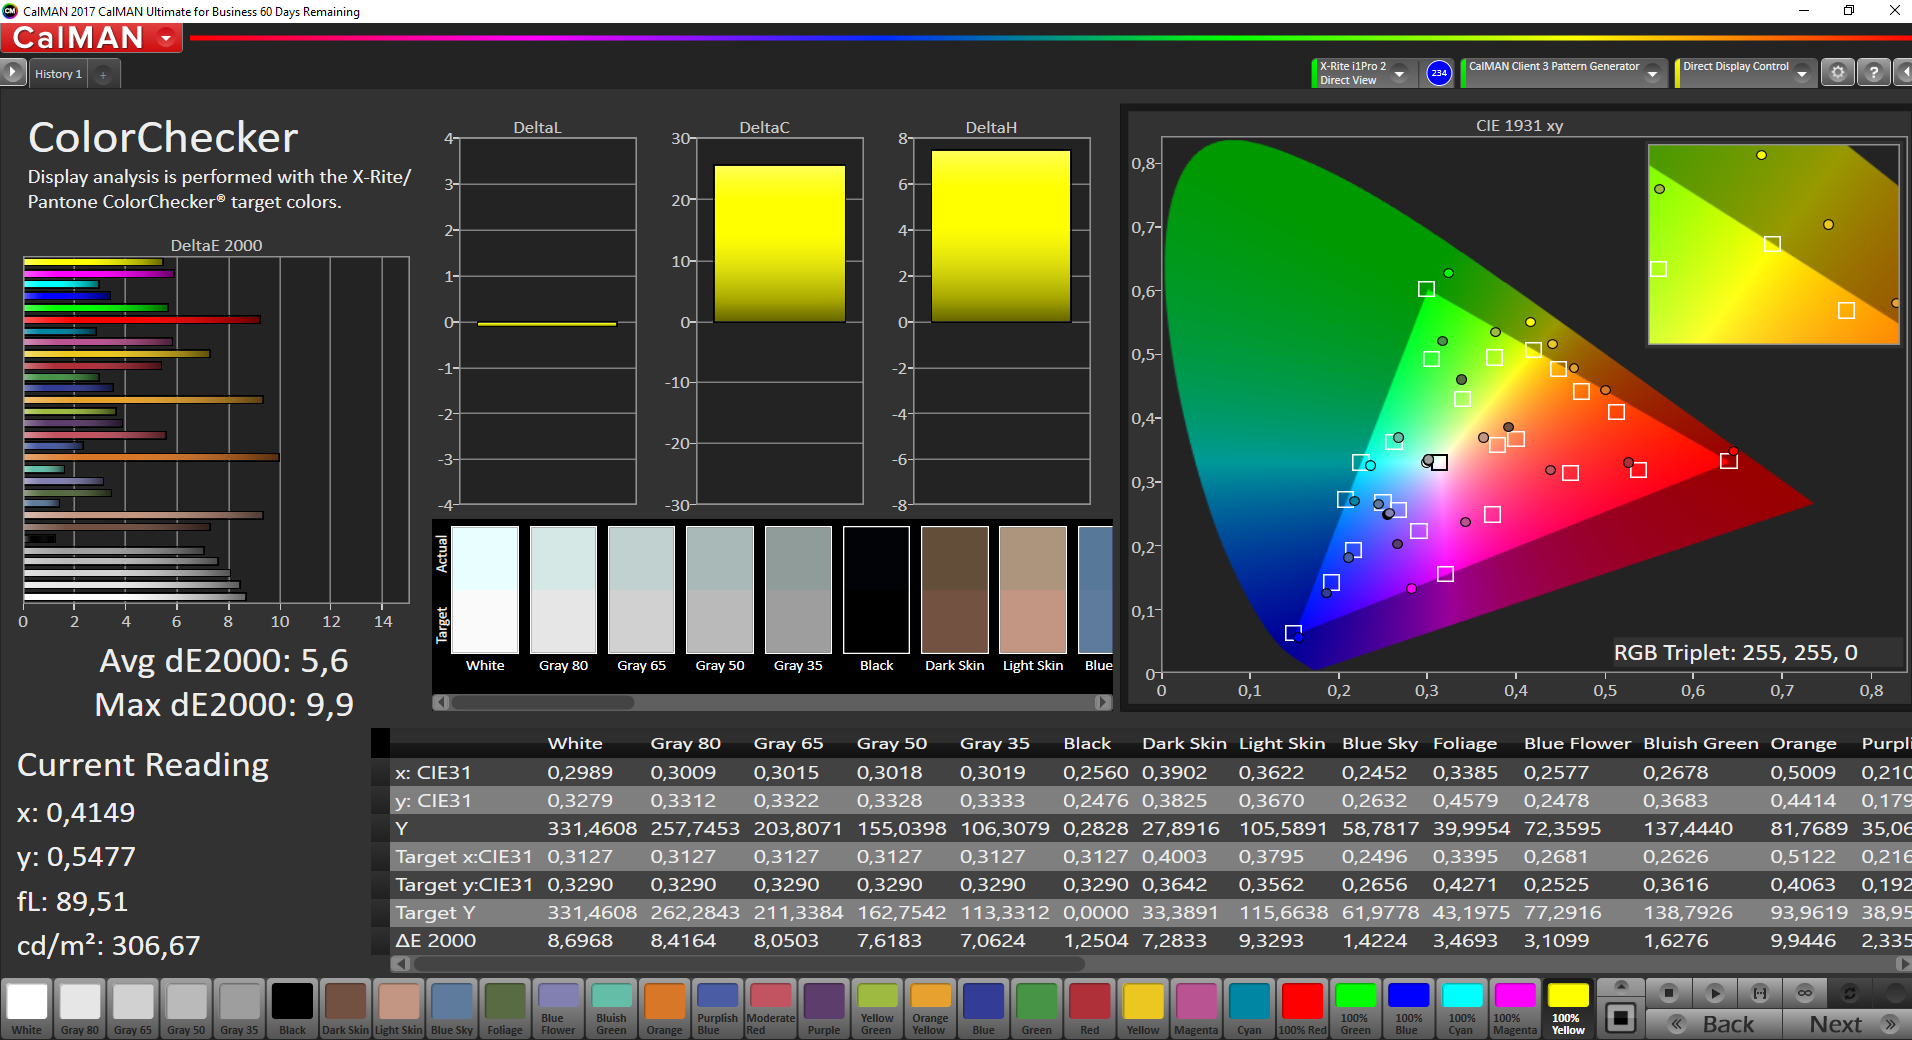
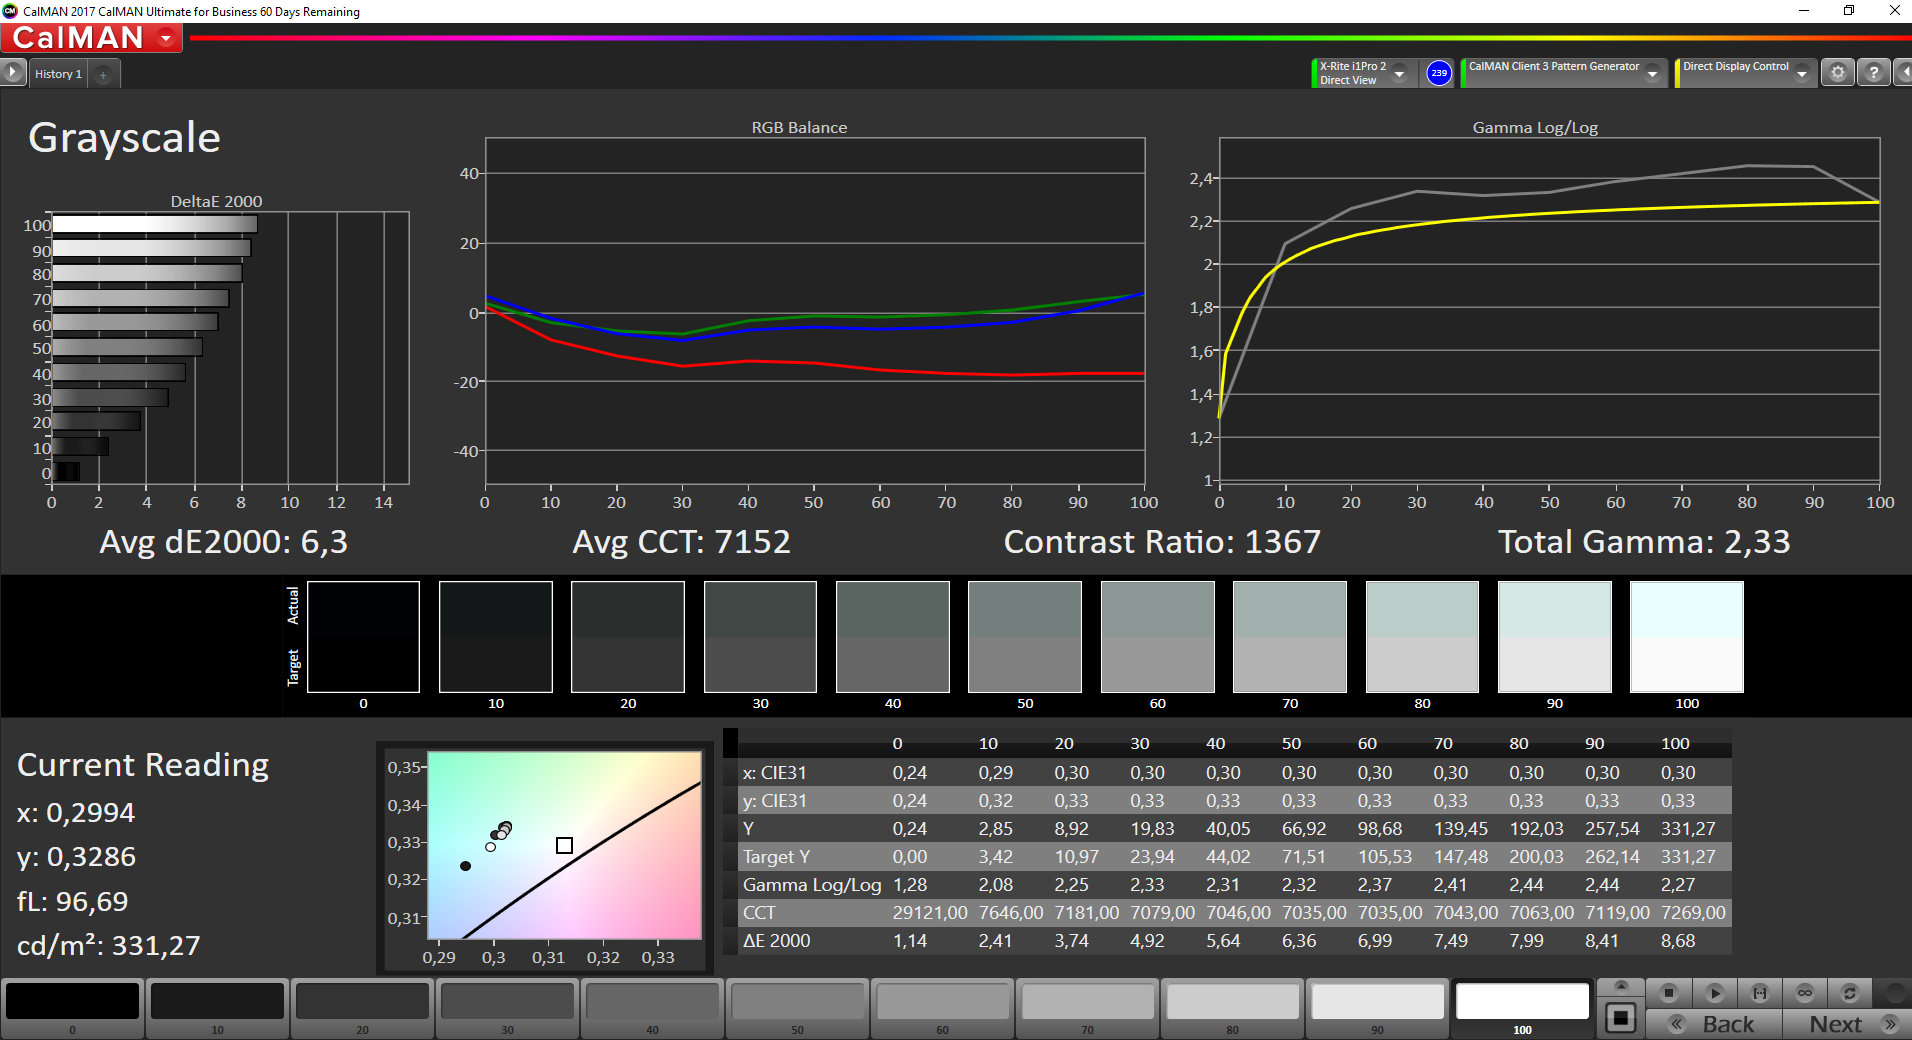
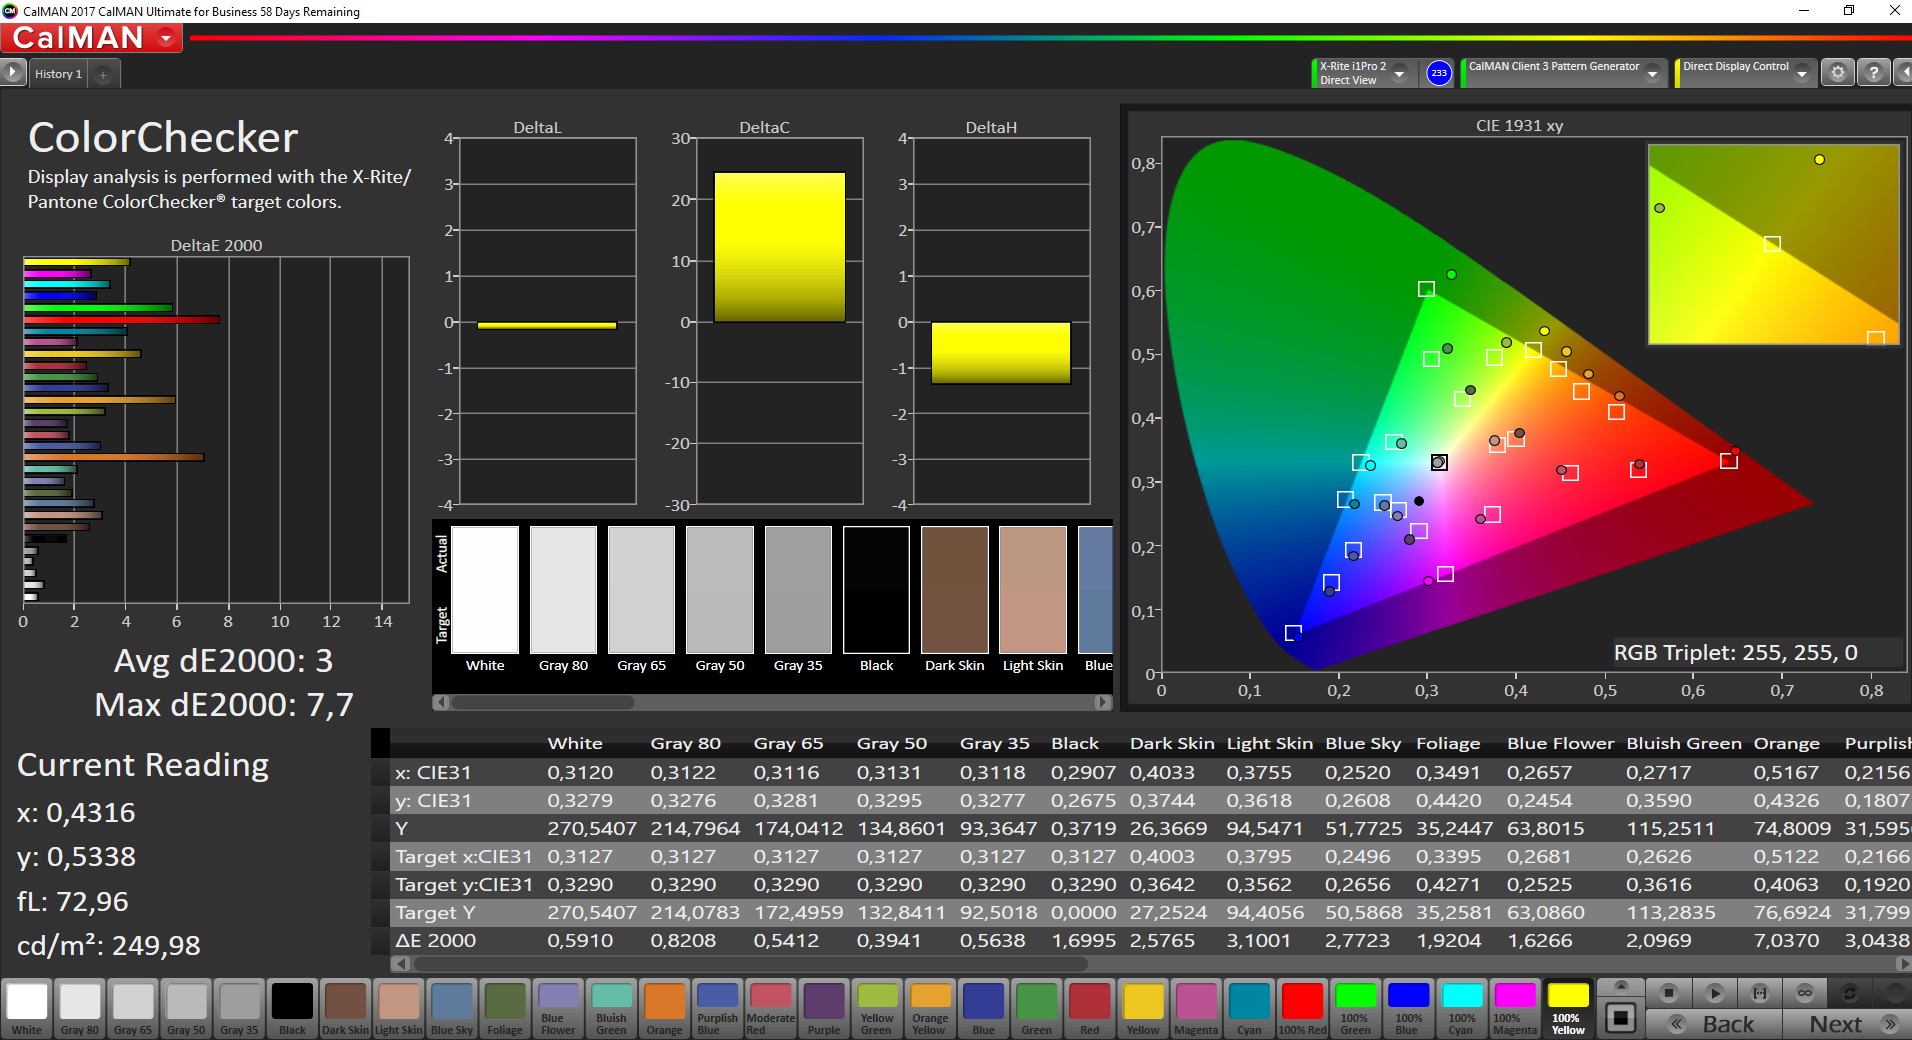
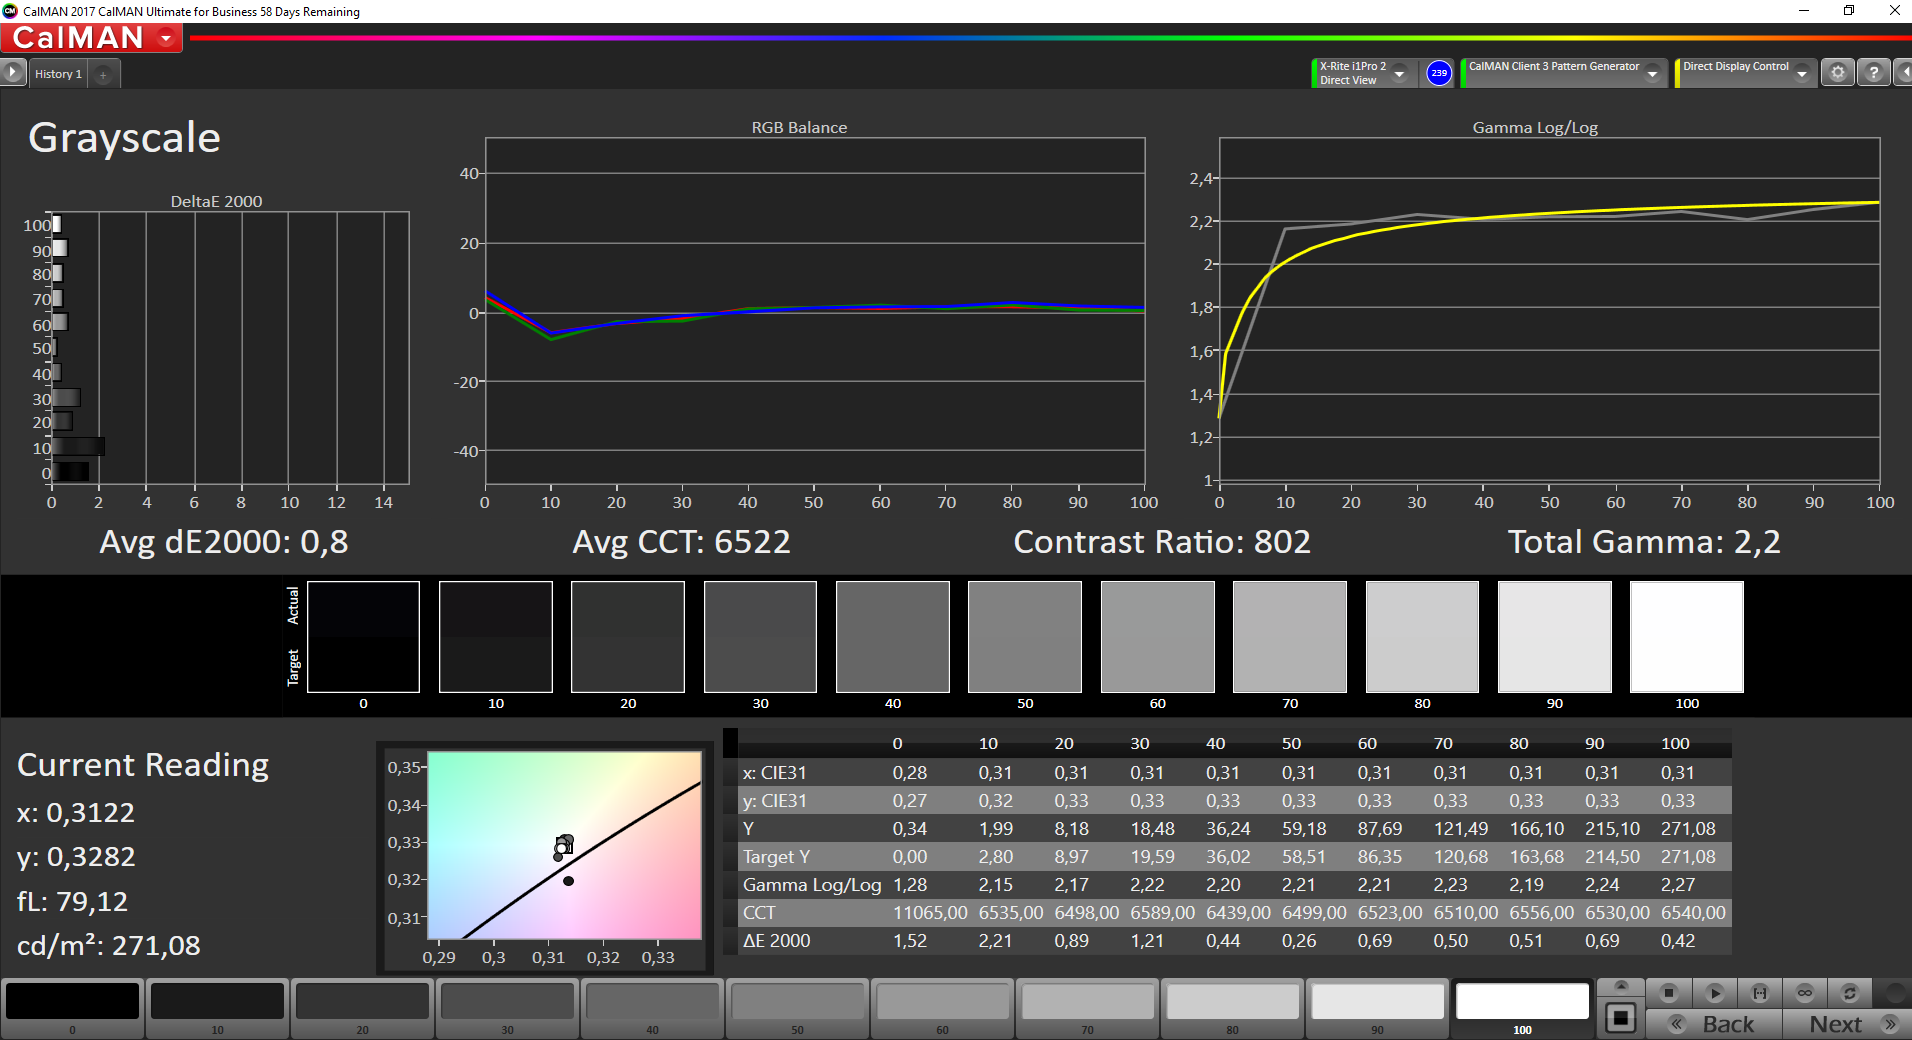
There is not a lot to complain about when it comes to the subjective picture-quality. Although the display has some color-variances when uncalibrated, a calibration corrects most of them. As always, we provide the needed ICC profile for everyone to download for free. The overall quality of the screen is good, which is attributable to the low black value (0.24 cd/m²), resulting in a high contrast value of 1,379:1 – though it should be noted that the FHD screen cannot possibly reach the 4K-UHD screen when it comes to brightness, of course. The response times are pretty much the same as they are on the 4K-UHD screen, meaning that they are not good. The alternative FHD screen by Innolux fares slightly better in this respect.
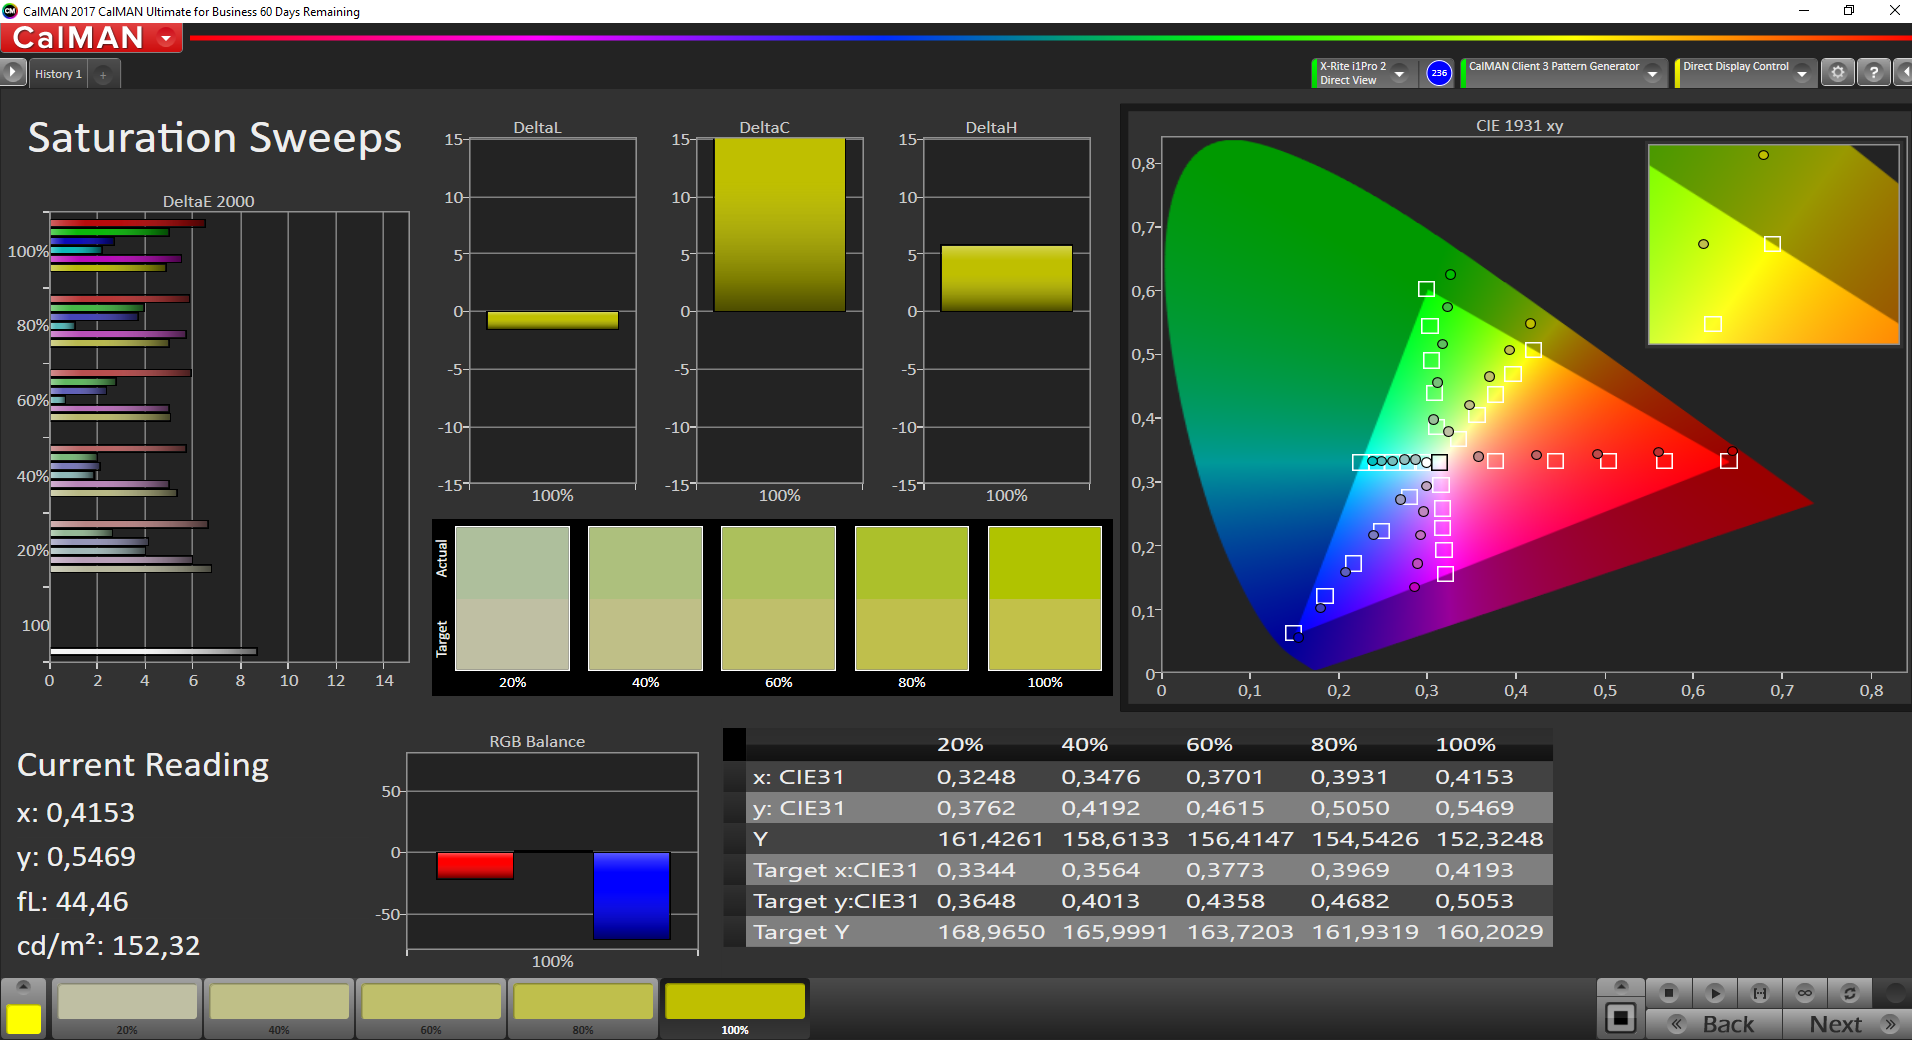
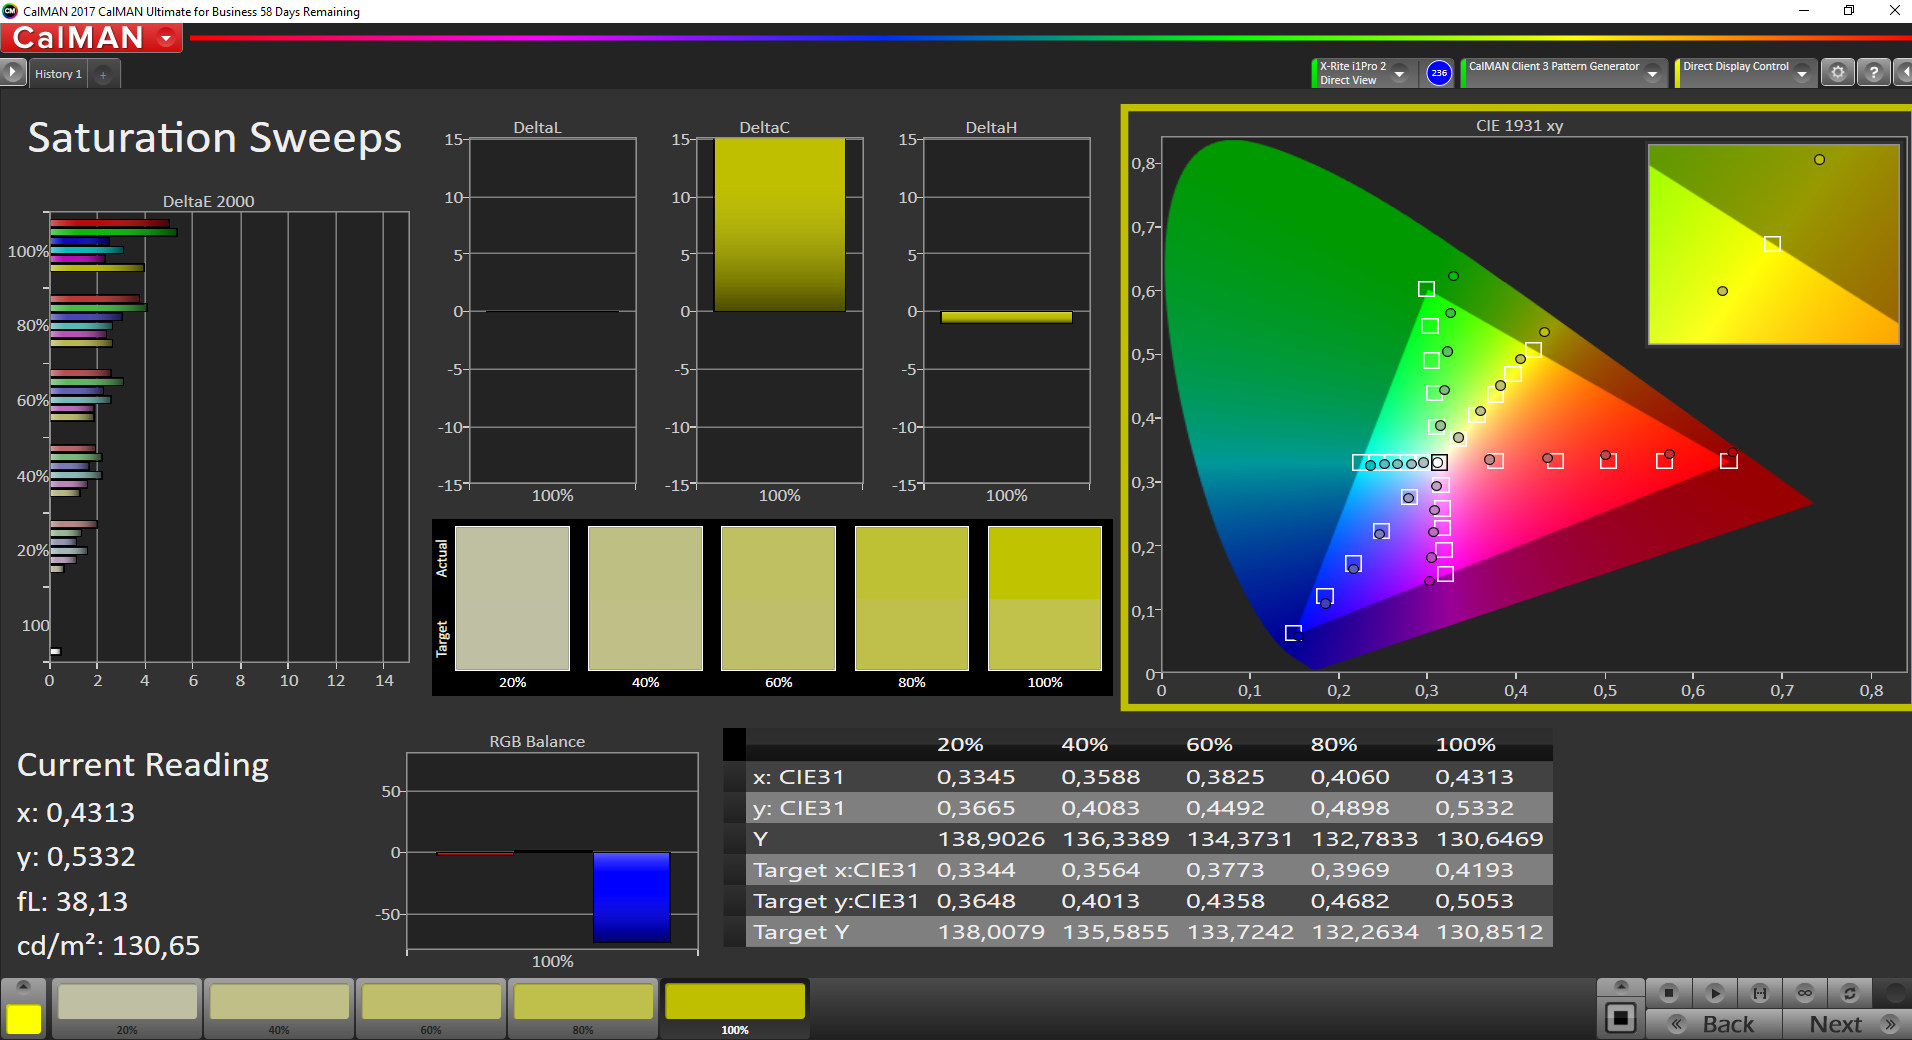
The color gamut is the area where the quality difference between the Lenovo notebook X1 Extreme with the 4K-UHD screen and the model with the FHD screen becomes most obvious. While the expensive 4K display covers 100% of the sRGB color space, the BOE panel used here manages just 88%. Unfortunately, the alternatively used Innolux screen is not much better in this area, as it reaches 90% sRGB. This pretty much rules out the screen for serious color related work. The reason for the insufficient sRGB coverage: The screen can display many colors and even some that are not included in either sRGB or AdobeRGB, but some of the colors needed for sRGB are missing.
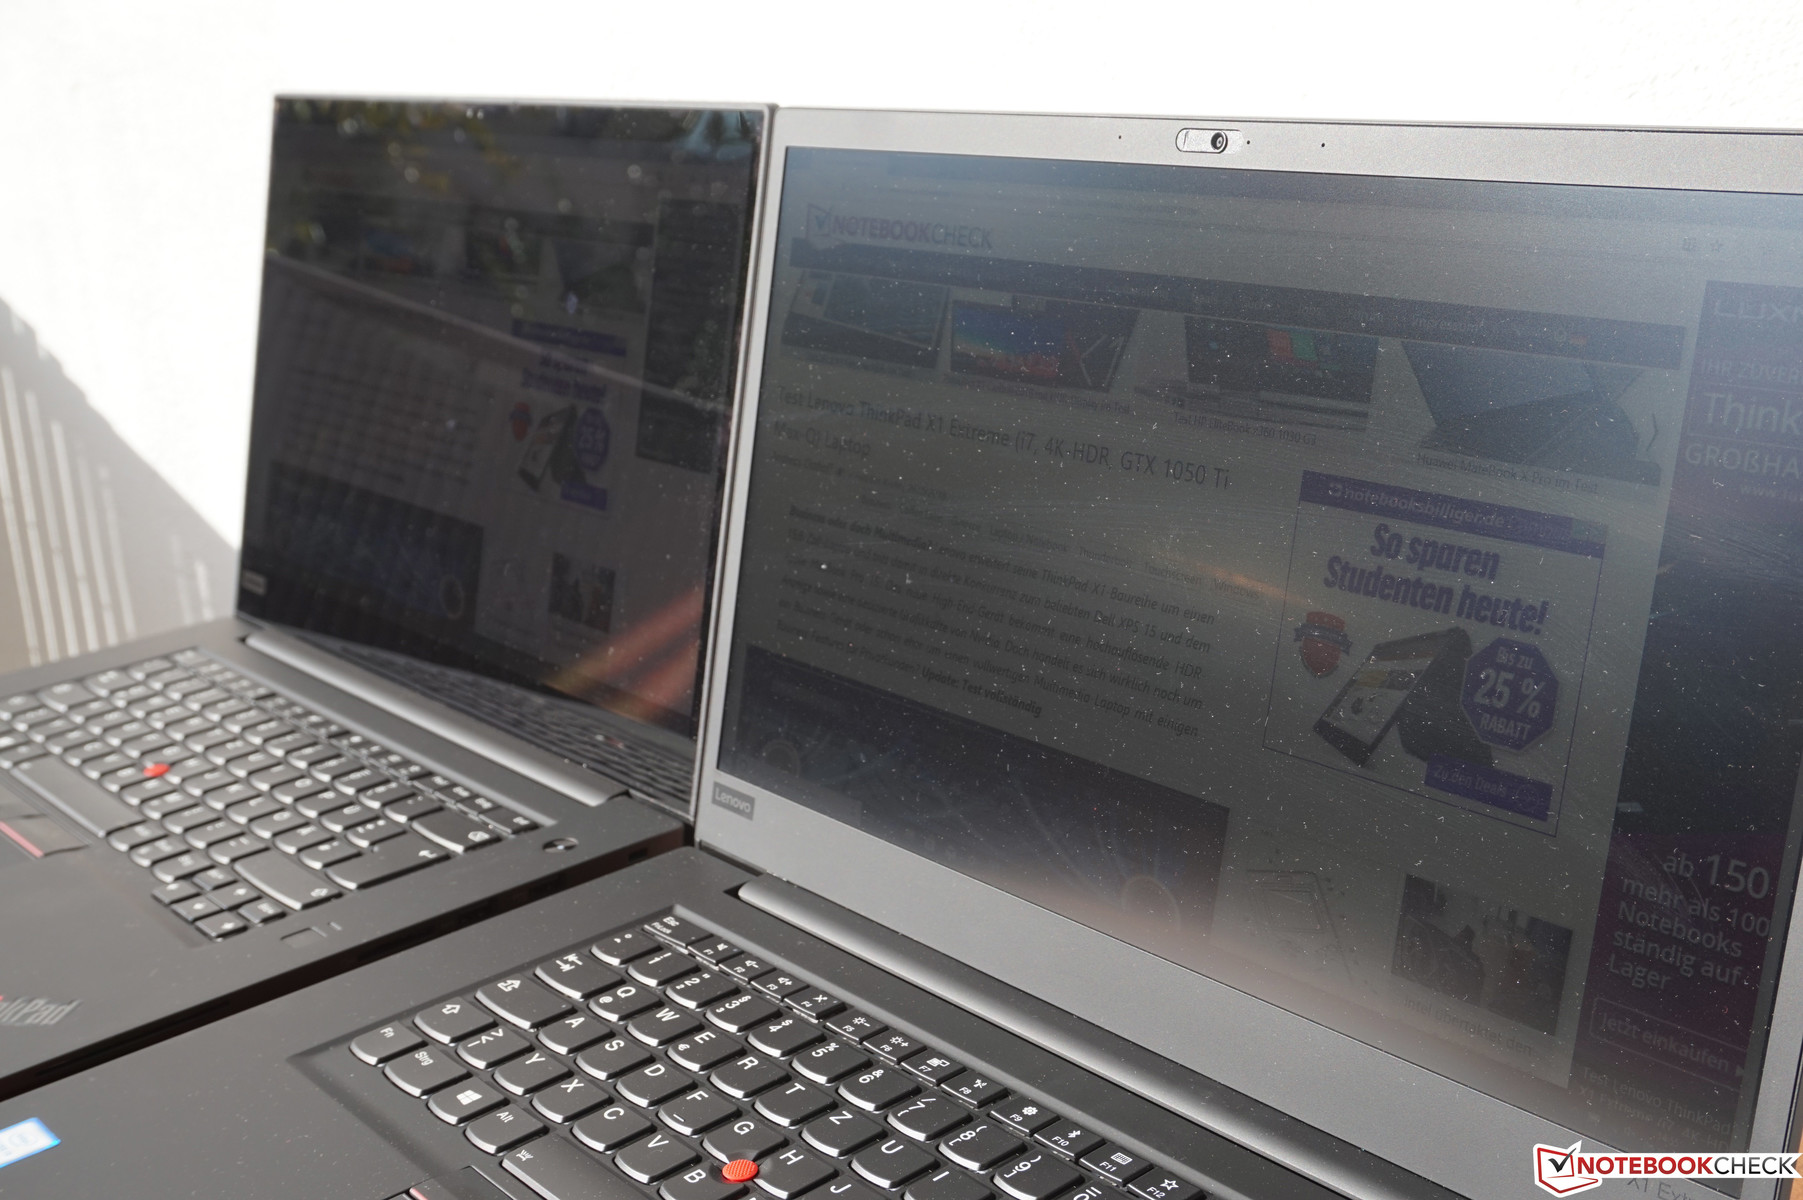
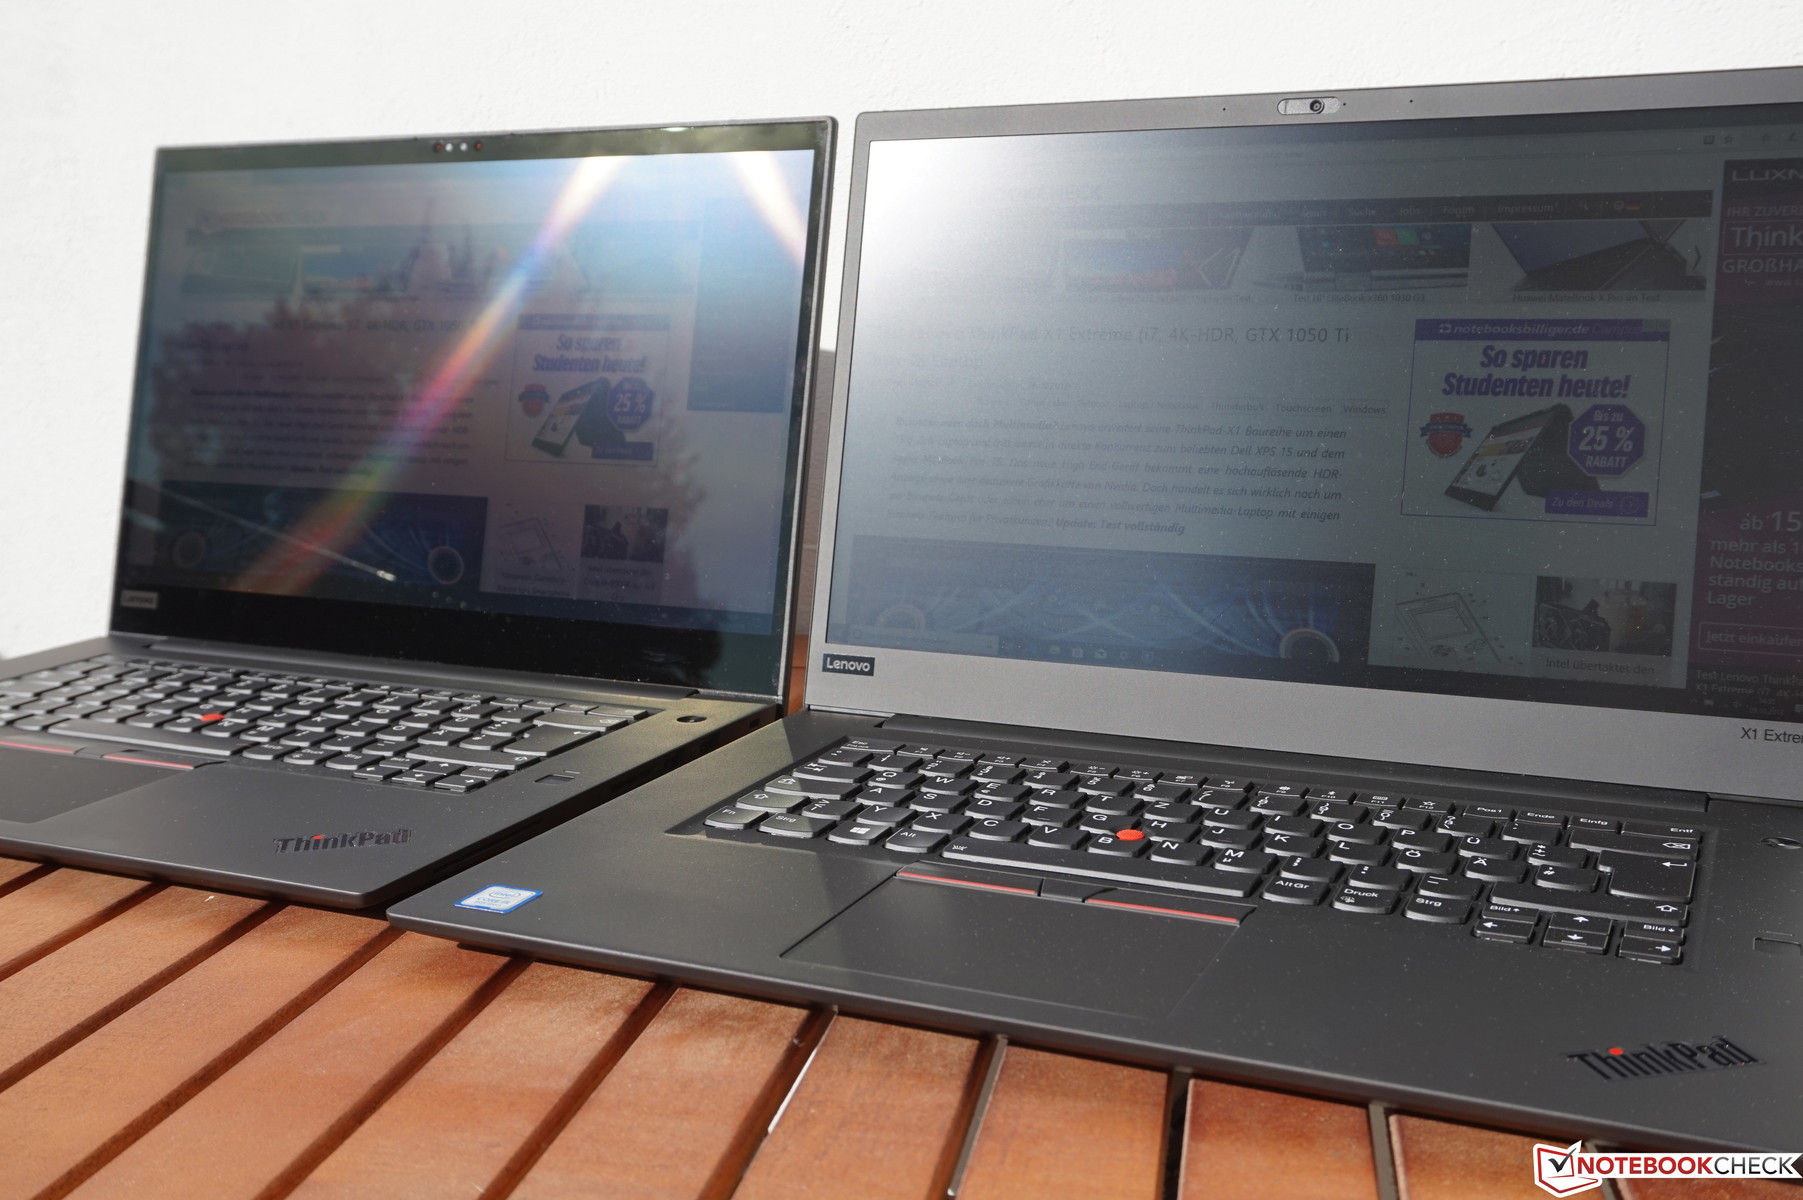
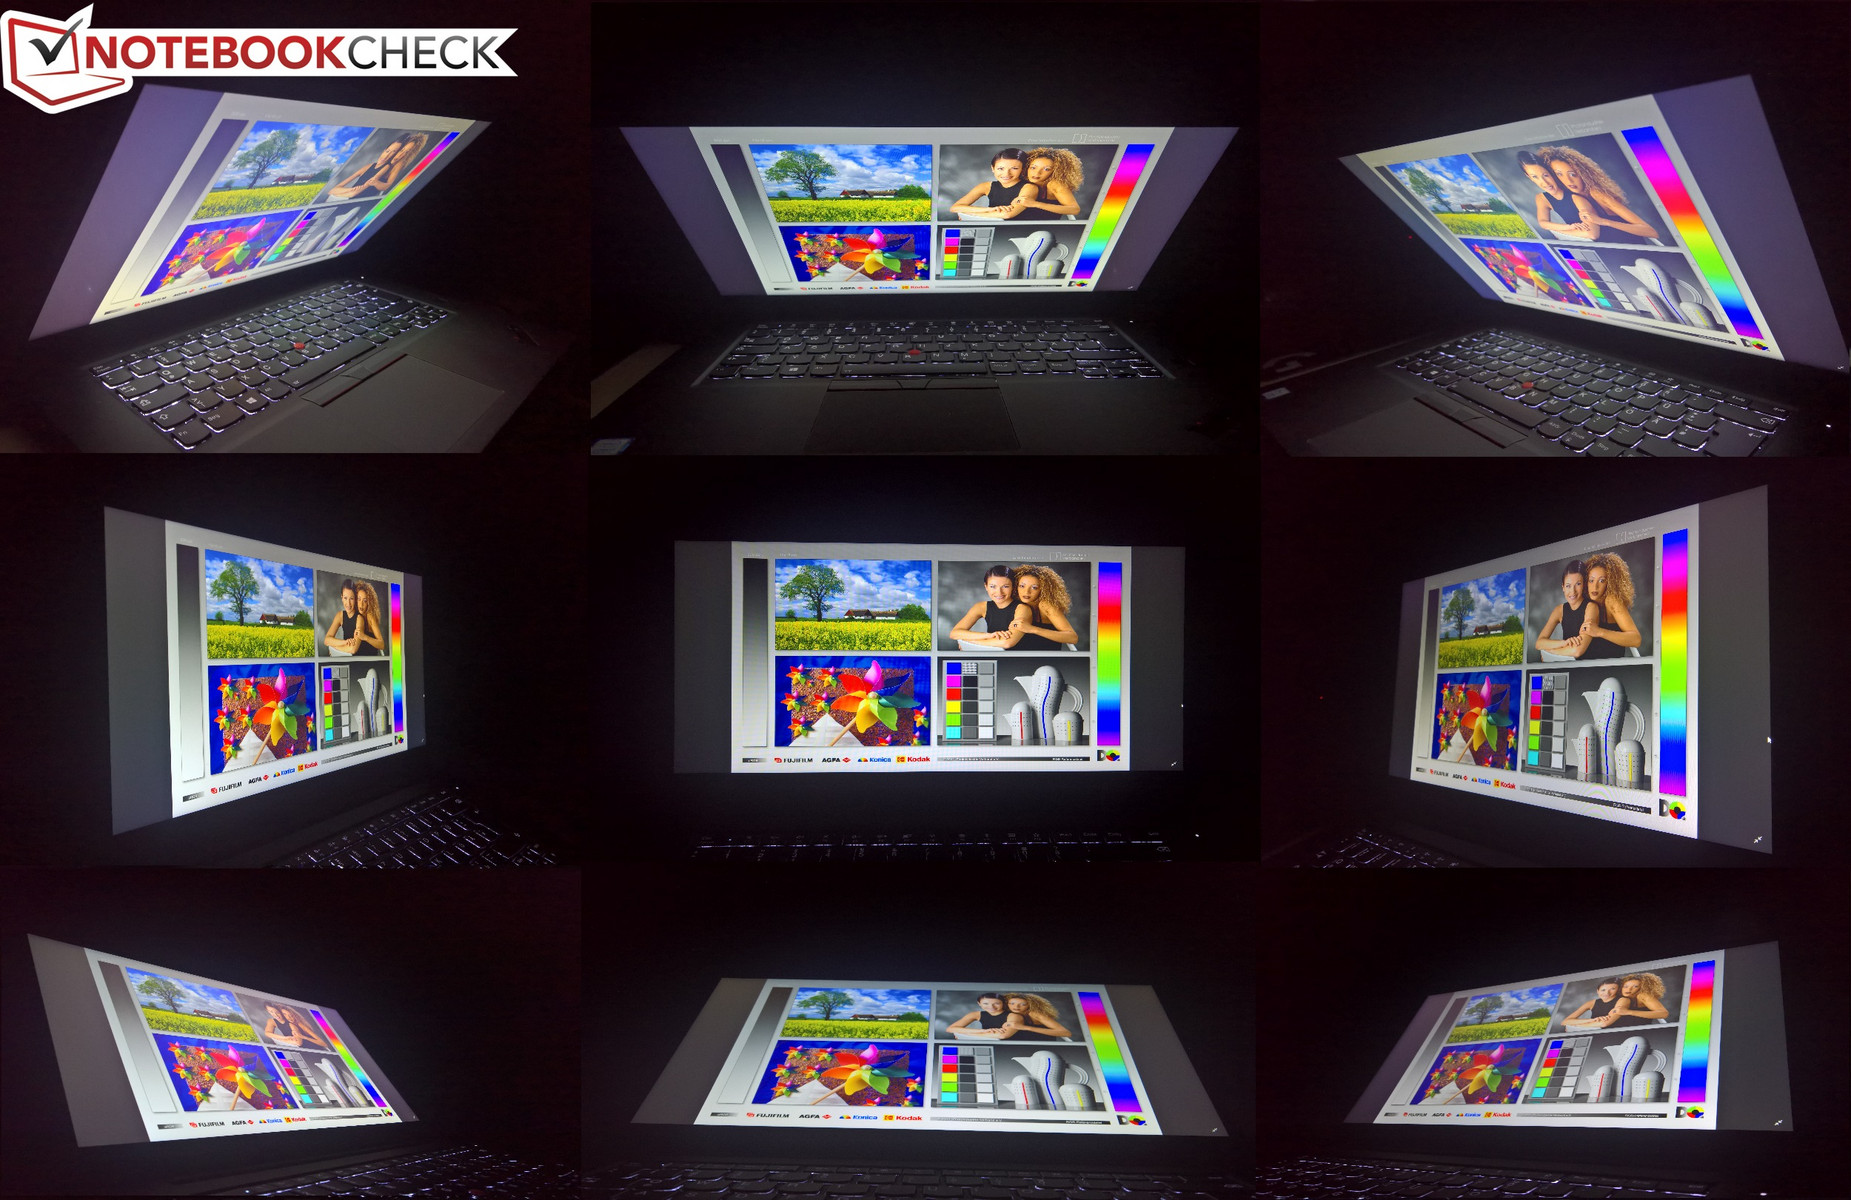
Thanks to its anti-glare surface, the FHD screen has the advantage compared with the high-res 4K-UHD screen when used outdoors. The 4k-UHD screen has a higher brightness, but the glossy surface results in annoying reflections. This problem does not exist on today's review unit and the screen brightness of roughly 300 cd/m² is sufficient for using the device comfortably outdoors – as long as direct sunlight onto the screen is avoided.
The direct picture comparison of both X1 Extreme units shows the differences between both panels. Reflections are no big problems with the matte screen, although it is not bright enough to counter direct sunlight. The 4K-UHD screens have to battle reflections, but its higher brightness does help a little bit in this respect, especially when the light does not shine directly onto the LCD.
Display Response Times
| ↔ Response Time Black to White | ||
|---|---|---|
| 36 ms ... rise ↗ and fall ↘ combined | ↗ 19.6 ms rise | 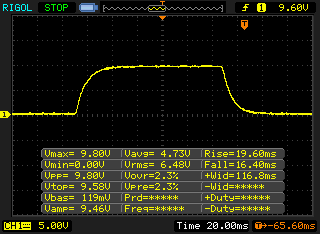 |
| ↘ 16.4 ms fall | ||
| The screen shows slow response rates in our tests and will be unsatisfactory for gamers. In comparison, all tested devices range from 0.1 (minimum) to 240 (maximum) ms. » 93 % of all devices are better. This means that the measured response time is worse than the average of all tested devices (20.2 ms). | ||
| ↔ Response Time 50% Grey to 80% Grey | ||
| 52.8 ms ... rise ↗ and fall ↘ combined | ↗ 27.6 ms rise | 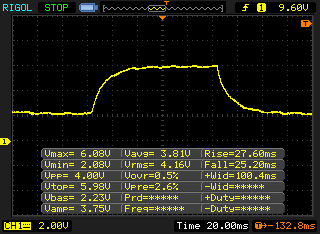 |
| ↘ 25.2 ms fall | ||
| The screen shows slow response rates in our tests and will be unsatisfactory for gamers. In comparison, all tested devices range from 0.165 (minimum) to 636 (maximum) ms. » 89 % of all devices are better. This means that the measured response time is worse than the average of all tested devices (31.6 ms). | ||
Screen Flickering / PWM (Pulse-Width Modulation)
| Screen flickering / PWM detected | 21370 Hz | ≤ 99 % brightness setting | 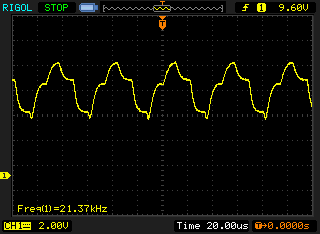 |
The display backlight flickers at 21370 Hz (worst case, e.g., utilizing PWM) Flickering detected at a brightness setting of 99 % and below. There should be no flickering or PWM above this brightness setting. The frequency of 21370 Hz is quite high, so most users sensitive to PWM should not notice any flickering. In comparison: 53 % of all tested devices do not use PWM to dim the display. If PWM was detected, an average of 8111 (minimum: 5 - maximum: 343500) Hz was measured. | |||
Typical for the IPS technology: The viewing angles are good, colors do not invert like they do on cheap TN screens – although the BOE panel used here does show the IPS glow effect, which results in a slight color taint when viewed from extreme angles.
Performance
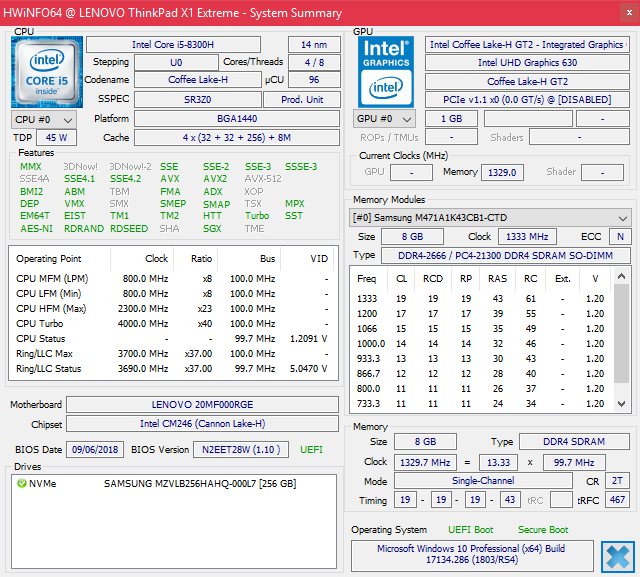
The Lenovo ThinkPad X1 Extreme is an expensive laptop. Today's review unit represents the base model of the X1 Extreme and includes the Core i5-8300H, 8 GB of DDR4-2666 RAM (one of two slots free, max. 64 GB), a 256 GB SSD, the FHD screen and the Nvidia GeForce GTX 1050 Ti Max-Q. It costs roughly 2,100 Euros (~$2,400) including VAT here in Germany. Such a model is not available in the US, since Lenovo does not offer the Core i5-8300H there at the moment, only the Core i5-8400H. The base model in the USA with the Core i5-8400H (model number 20MF000HUS) has a list price of $1,919, although a similar model might be available for less if configured on in Lenovo's webshop – prices there fluctuate a lot, so potential buyers should look out for special discounts.
Processor
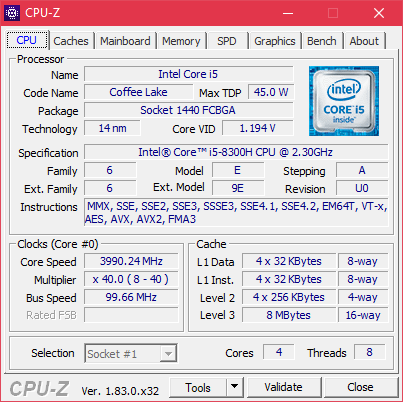
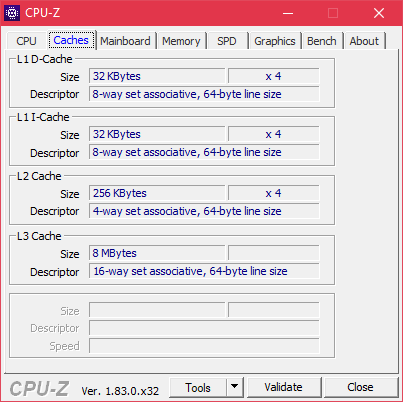
The Intel Core i5-8300H is the most affordable i5-CPU of the current Intel Core H series (TDP: 45 W). This "Coffee Lake" CPU has four CPU cores (eight threads thanks to Hyperthreading), which each have a clock-speed of 2.3 to 4 GHz. Additional information and benchmark-comparisons are available within our CPU benchmark-table.
In the ThinkPad X1 Extreme, the Core i5-8300H is the base CPU option. Lenovo allows the CPU to consume up to 60 W, although this is only possible as a short boost. Apart from this turbo-boost, the TDP is limited to the standard value of 45 W. These TDP settings explain the CPU performance in the Cinebench R15 multicore loop: In the first iteration, the CPU can work with a higher clock-speed. Afterwards, the clock-speed goes down a bit accordingly with the lower TDP. The X1 Extreme can hold this level of performance for the entire loop-test.
Overall, the performance of the i5-8300H in the X1 Extreme is excellent, although the more expensive X1 Extreme with the hexa-core processor Core i7-8750H is naturally quite a bit faster. The Dell XPS 15 with the Intel Core i5-8300H is slightly slower when it comes to the boost performance, although both perform almost identically under sustained load. Compared with the X1 Extreme with i5-8300H, the 2017 Lenovo ThinkPad T470p with the Intel Core i7-7700HQ is roughly 15% slower – not a bad progress, considering that the core-count has not changed.
Without an attached charger, the CPU performance is slightly throttled. Instead of 850 points, the X1 Extreme just scores 762 points in the Cinebench R15 multicore test.
System Performance
The Lenovo ThinkPad X1 Extreme consistently scores very well in the PCMark benchmarks. This is not a huge surprise, since the components inside the slim chassis are very powerful. In everyday use, the ThinkPad showed no weaknesses in terms of the system performance.
| PCMark 8 Home Score Accelerated v2 | 4150 points | |
| PCMark 8 Work Score Accelerated v2 | 5357 points | |
| PCMark 10 Score | 4467 points | |
Help | ||
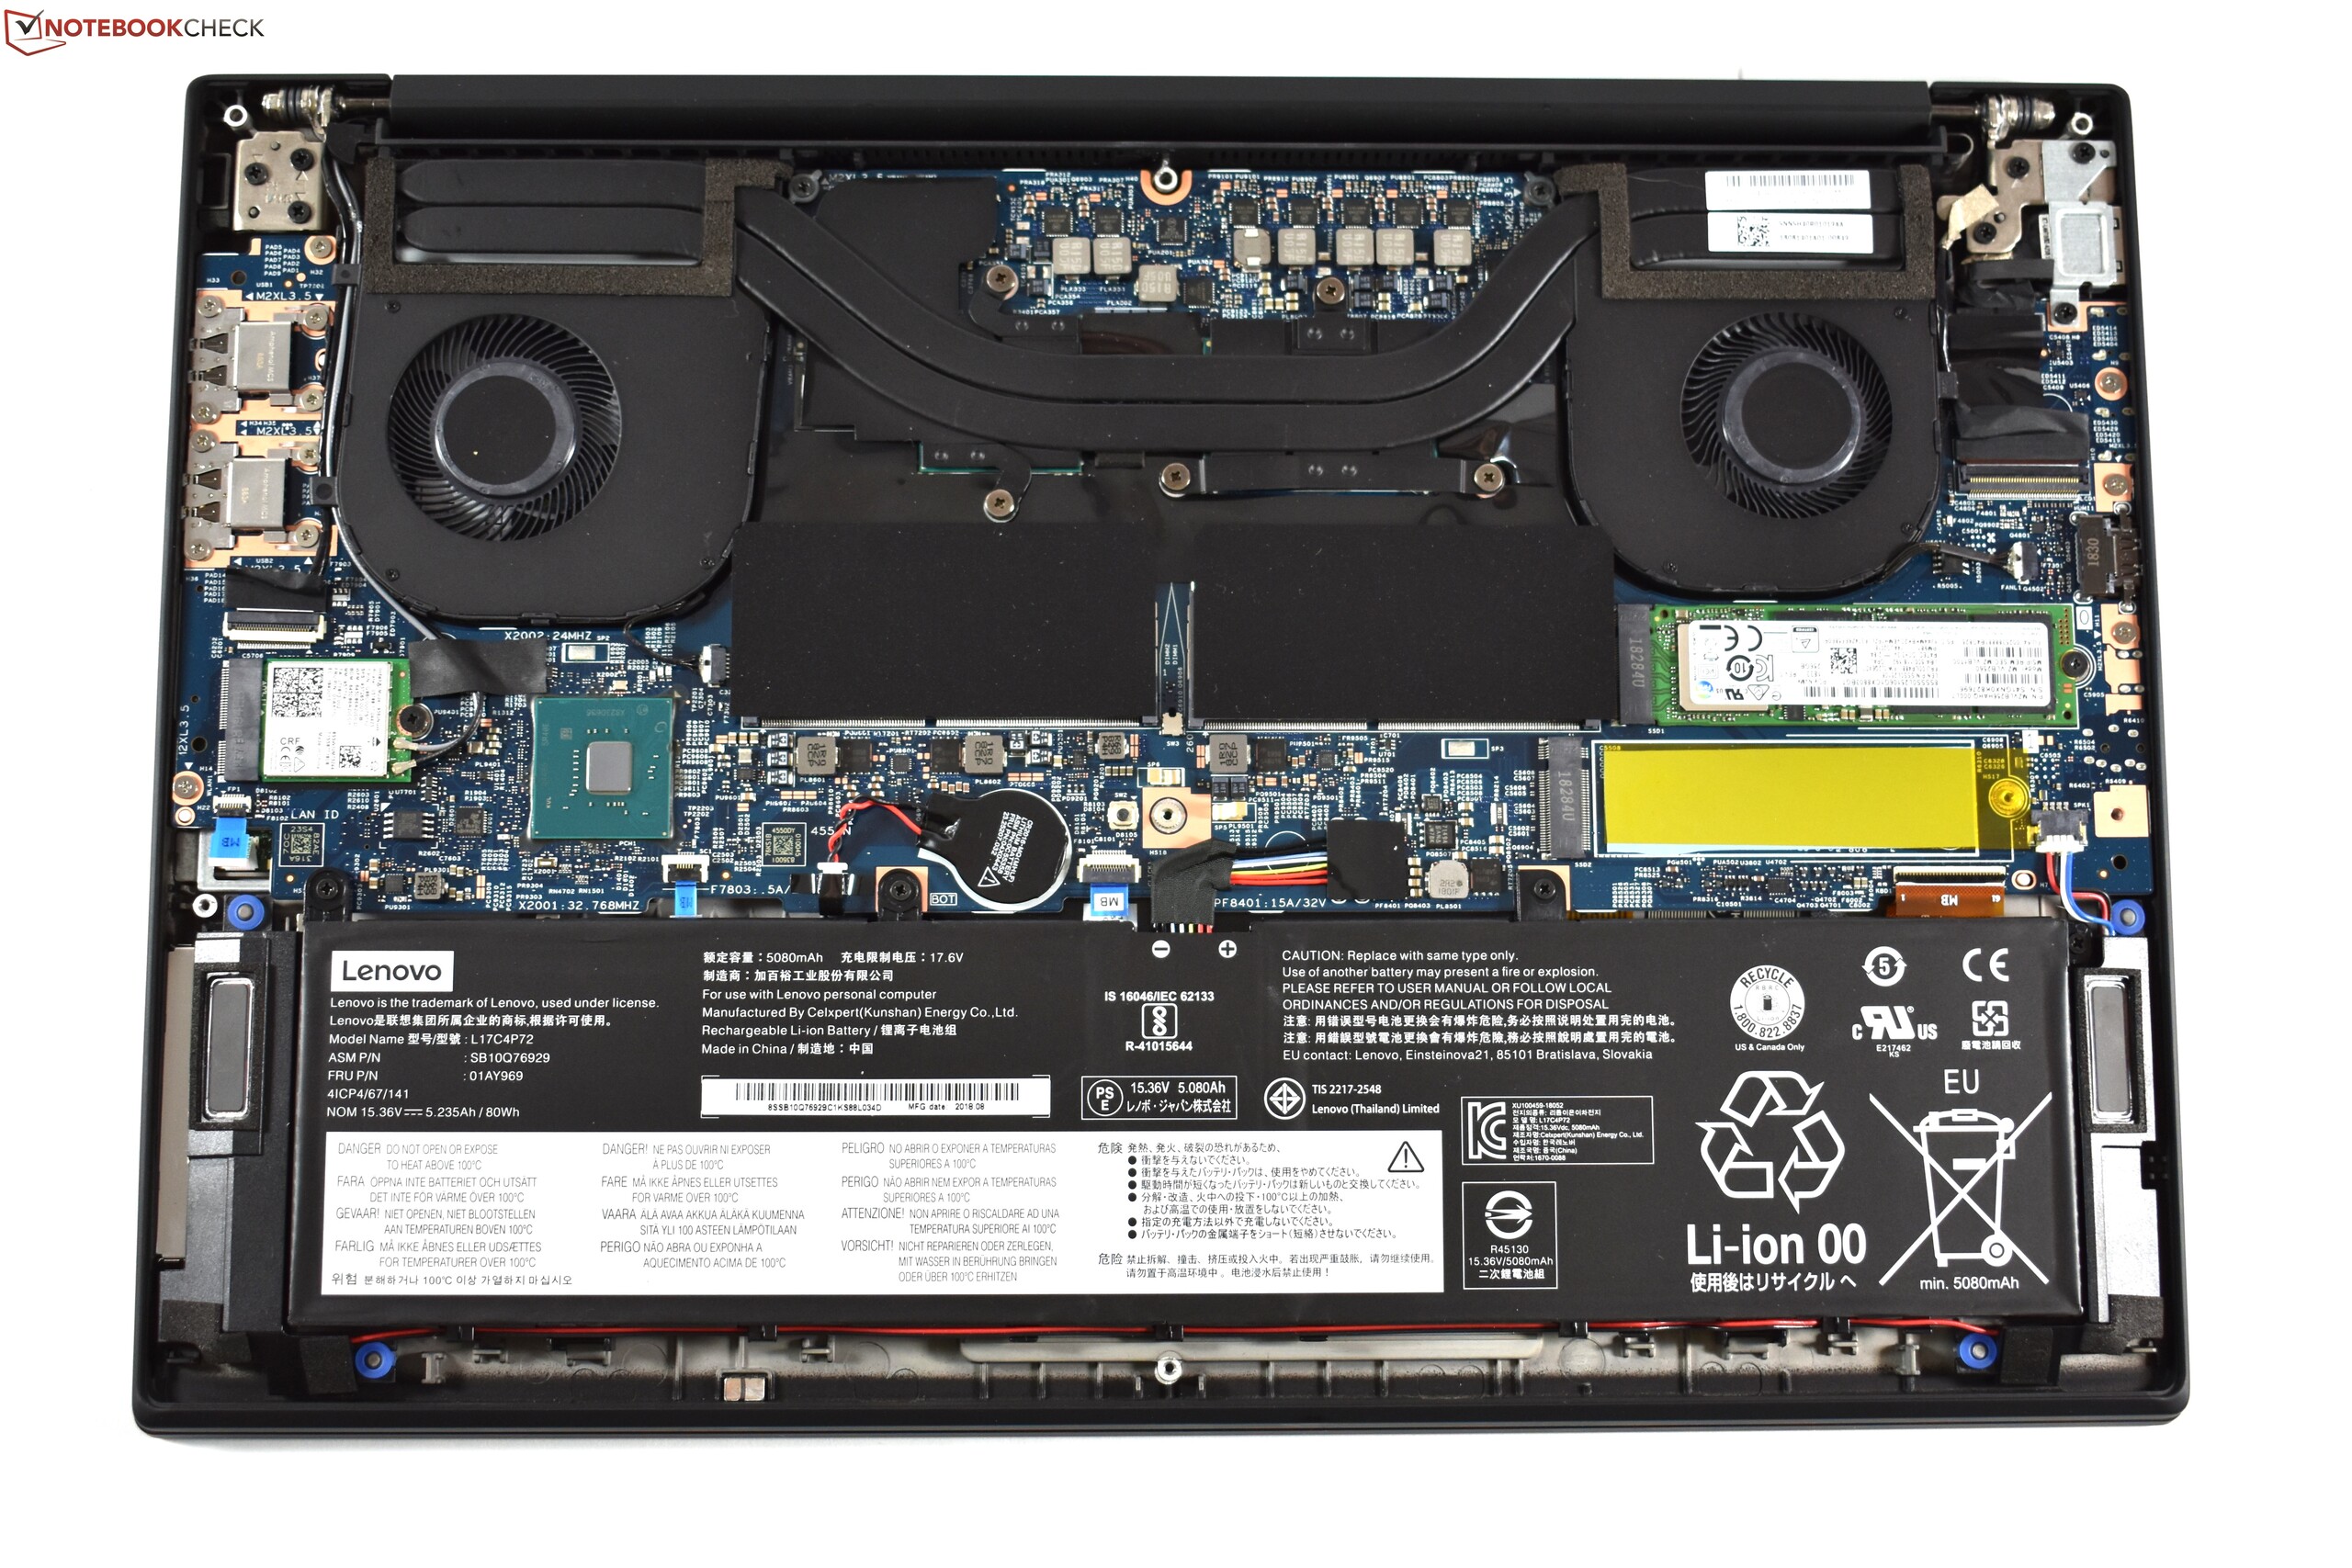
Storage
Lenovo utilizes the extremely fast Samsung PM981 with a capacity of 256 GB in the X1 Extreme. This flash-drive is a PCIe NVMe SSD in the M.2 2280 format. In the comparison, only the bigger capacity models of the same PM981 were faster, which are used in the ThinkPad P52 and the more expensive ThinkPad X1 Extreme model.
Unlike the Dell XPS 15 9570, the ThinkPad X1 Extreme lacks the option for a 2.5-inch drive. Instead, every ThinkPad X1 Extreme model has two 2280 M.2 slots, one of which was empty on our review unit. This means that users can upgrade the storage of X1 Extreme quite easily and relatively cheaply, since it is more affordable to put in another 256 GB SSD instead of a single 512 GB flash-drive.
| Lenovo ThinkPad X1 Extreme-20MF000RGE Samsung SSD PM981 MZVLB256HAHQ | Dell XPS 15 2018 i5 FHD 97Wh Lite-On CA3-8D256-Q11 | HP EliteBook 850 G5 3JX58EA Toshiba XG5 KXG50ZNV256G | HP EliteBook 1050 G1-4QY20EA Toshiba XG5-P KXG50PNV2T04 | Lenovo ThinkPad P52 20MAS03N00 Samsung SSD PM981 MZVLB512HAJQ | Lenovo ThinkPad X1 Extreme-20MF000XGE Samsung SSD PM981 MZVLB1T0HALR | Average Samsung SSD PM981 MZVLB256HAHQ | |
|---|---|---|---|---|---|---|---|
| CrystalDiskMark 5.2 / 6 | -14% | -26% | -11% | 22% | 24% | 41% | |
| Write 4K (MB/s) | 109.4 | 89.4 -18% | 95.9 -12% | 94.8 -13% | 108.5 -1% | 123.7 13% | 116.1 ? 6% |
| Read 4K (MB/s) | 41.5 | 44.64 8% | 30.91 -26% | 26.45 -36% | 42.78 3% | 44.07 6% | 189.5 ? 357% |
| Write Seq (MB/s) | 1460 | 830 -43% | 312.5 -79% | 1037 -29% | 1645 13% | 2215 52% | 1409 ? -3% |
| Read Seq (MB/s) | 1561 | 1774 14% | 1966 26% | 1280 -18% | 1485 -5% | 2242 44% | 1624 ? 4% |
| Write 4K Q32T1 (MB/s) | 278.4 | 310.6 12% | 308.8 11% | 277.6 0% | 269.2 -3% | 313.9 13% | 360 ? 29% |
| Read 4K Q32T1 (MB/s) | 354.9 | 266.4 -25% | 248.6 -30% | 333.9 -6% | 348.7 -2% | 359.8 1% | 396 ? 12% |
| Write Seq Q32T1 (MB/s) | 1461 | 831 -43% | 292.2 -80% | 1037 -29% | 1877 28% | 2404 65% | 1492 ? 2% |
| Read Seq Q32T1 (MB/s) | 3452 | 2962 -14% | 2718 -21% | 3135 -9% | 3419 -1% | 3333 -3% | 3313 ? -4% |
| Write 4K Q8T8 (MB/s) | 1415 | 1044 -26% | 1523 8% | 1152 ? -19% | |||
| Read 4K Q8T8 (MB/s) | 572 | 914 60% | 1614 182% | 736 ? 29% |

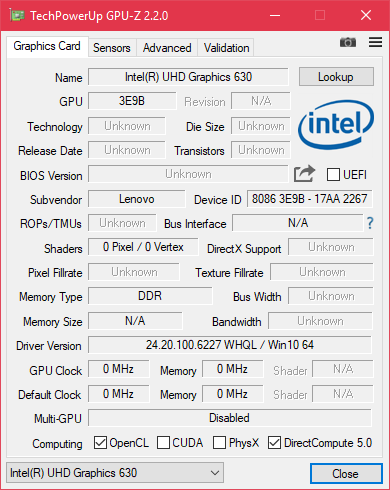
GPU Performance
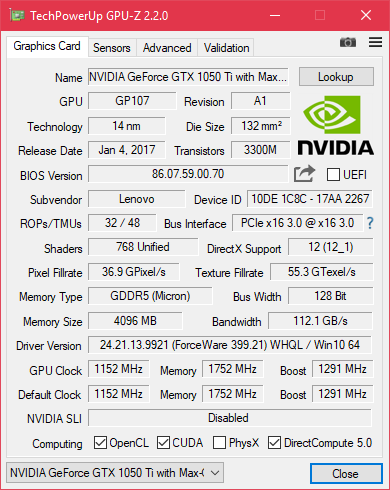
The Nvidia GeForce GTX 1050 Ti Max-Q is a GeForce chip of the upper middle class, which is based on Nvidia Pascal. The appendix "Max-Q" denotes this GPU as a lower-clocked version of the mobile Nvidia GeForce GTX 1050 Ti.
In the 3DMark-benchmarks, the performance of the chip is almost identical when compared with the Lenovo ThinkPad X1 Extreme with i7-CPU. Compared with the Dell XPS 15 2018 9570, the X1 Extreme has a clear advantage here: While Dell uses the slower Nvidia GeForce GTX 1050 on the XPS 15 base model with i5-CPU, the X1 Extreme uses the faster GeForce GTX 1050 Ti Max-Q on all models, no matter if low- or high-end. This puts the X1 Extreme roughly 15% above the equivalent Dell XPS 15 in terms of GPU performance.
As with the CPU, we could detect a loss of GPU performance when the X1 Extreme ran on battery-power. Instead of scoring 8752 points, the X1 Extreme reached just 6606 points in the 3DMark11 Performance GPU test.
| 3DMark 11 Performance | 8349 points | |
| 3DMark Cloud Gate Standard Score | 22522 points | |
| 3DMark Fire Strike Score | 6380 points | |
Help | ||
Gaming Performance
While the Lenovo laptop X1 Extreme definitely does not qualify as a "true" gaming laptop, the Nvidia GeForce GTX 1050 Ti Max-Q is still a reasonable powerful GPU. The X1 Extreme can display games in FHD resolution (1,920x1,080) in medium to high details fluently. Under load, the GPU did not show any throttling whatsoever. For additional gaming benchmarks, we refer to the first review of the ThinkPad X1 Extreme.
| low | med. | high | ultra | |
|---|---|---|---|---|
| BioShock Infinite (2013) | 244.3 | 194.6 | 175.8 | 71.3 |
| The Witcher 3 (2015) | 130.7 | 80.9 | 45.1 | 25.2 |
| Civilization 6 (2016) | 112.5 | 85.8 | 51 | 43 |
Emission
System Noise
Despite the weaker CPU, the two fans behave in exactly the same way as they do on the more expensive X1 Extreme. This means that the fans are mostly turned off when idling, but they sometimes suddenly come on. When they do, they are not too loud, but since the X1 Extreme is silent otherwise, it is noticeable. Under load, today’s unit also matches the behavior of the X1 Extreme with i7: Both fans are not too loud, but their loudness fluctuates a little bit.
There is one unfortunate difference compared with the other X1 Extreme unit: On the low-end model, we could hear an electronic noise. This was only noticeable when an ear was held near the keyboard, but still, even such comparably quiet hissing sounds are worth mentioning.
Noise level
| Idle |
| 28.9 / 28.9 / 30.7 dB(A) |
| Load |
| 36.7 / 39.5 dB(A) |
 | ||
30 dB silent 40 dB(A) audible 50 dB(A) loud |
||
min: | ||
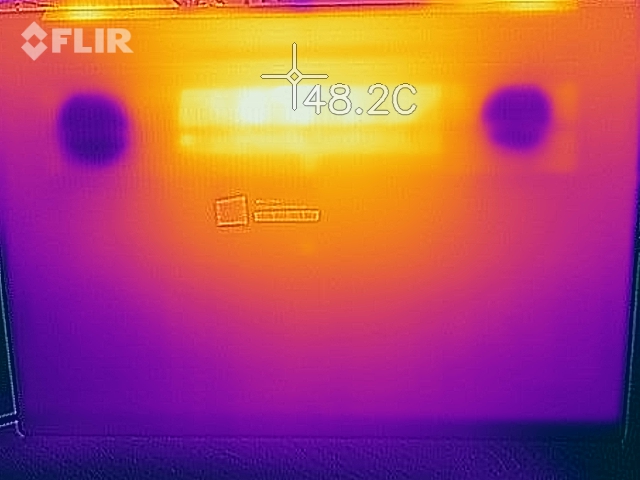
Temperatures
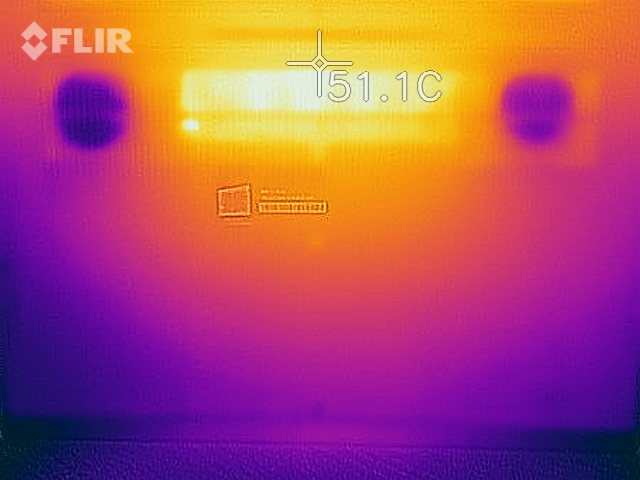
The cooling system of the Lenovo laptop ThinkPad X1 Extreme always consists of two connected heat-pipes and two fans, no difference there between the i5-model and the unit with the hexa-core i7-processor. Today’s unit does stay slightly cooler on the outside: Instead of 53.4 °C (~128 °F), we measured 50.9 °C (~124 °F).
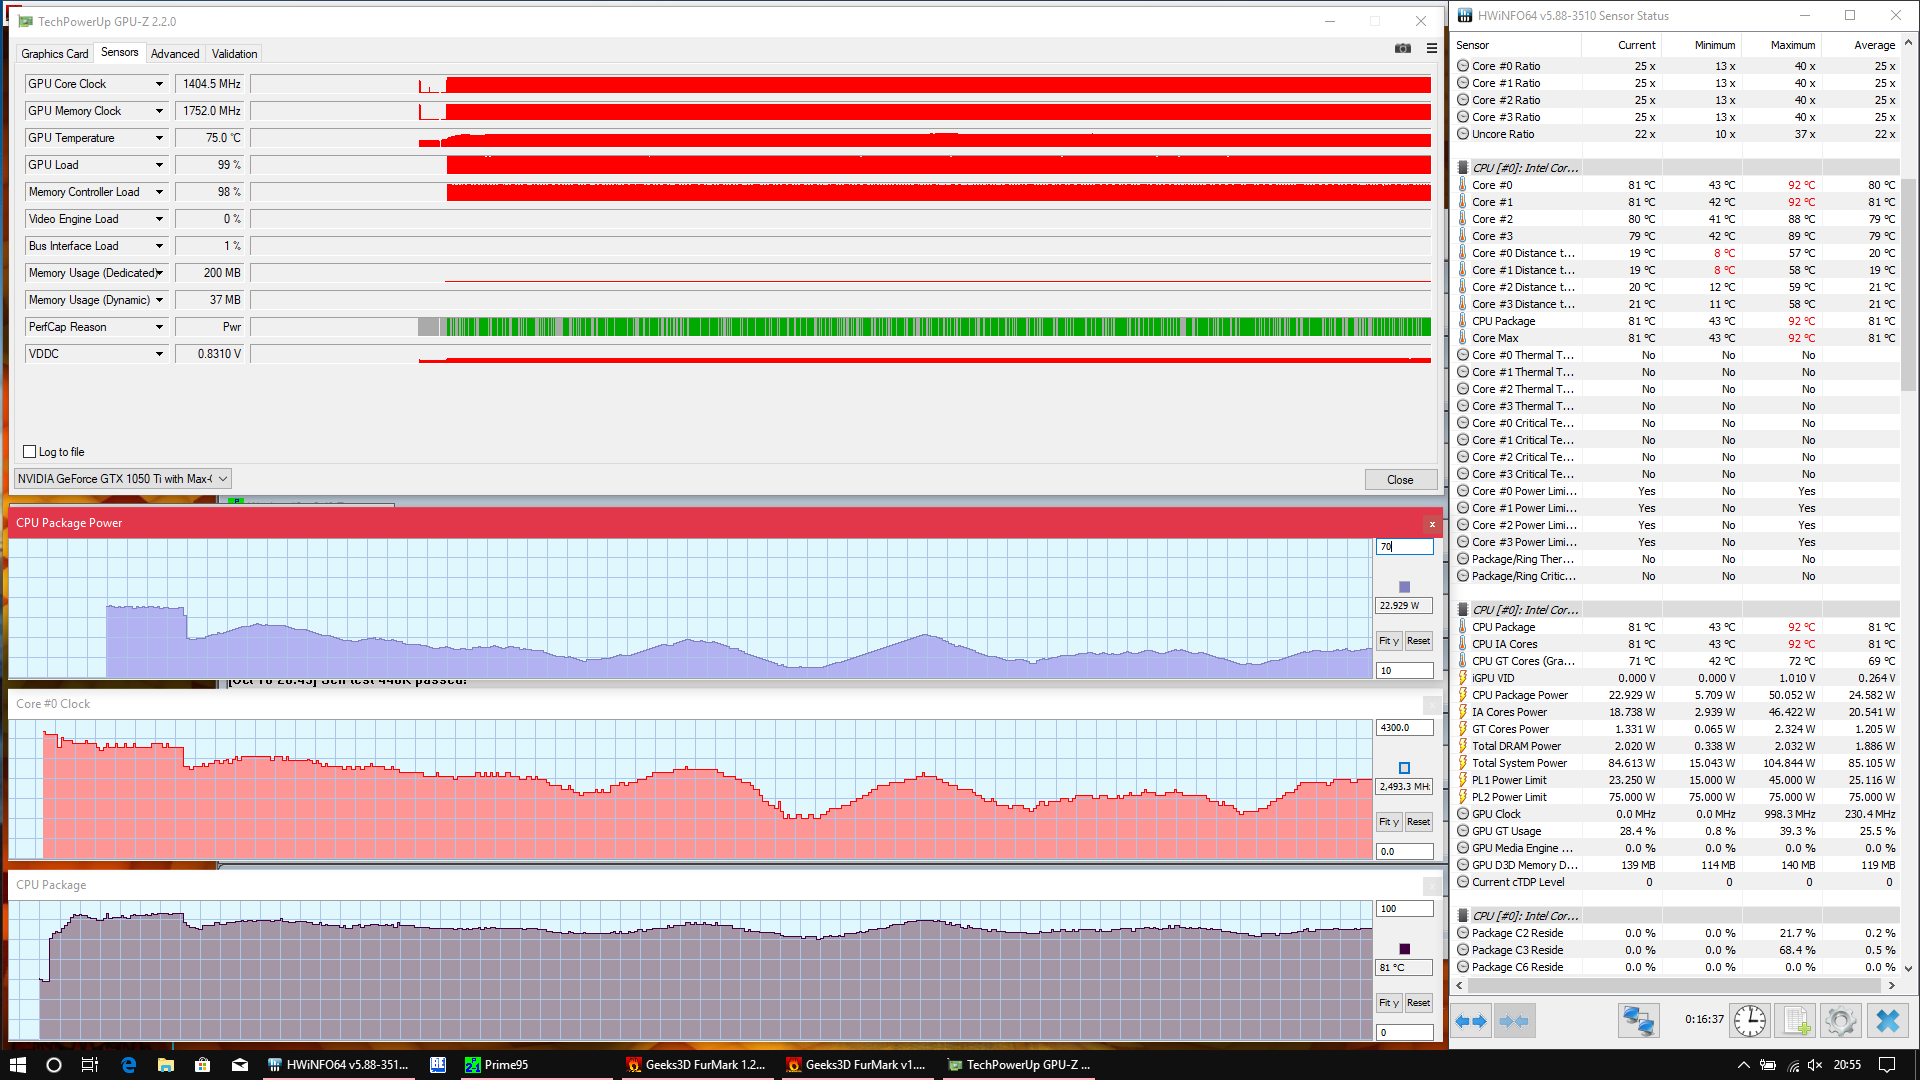
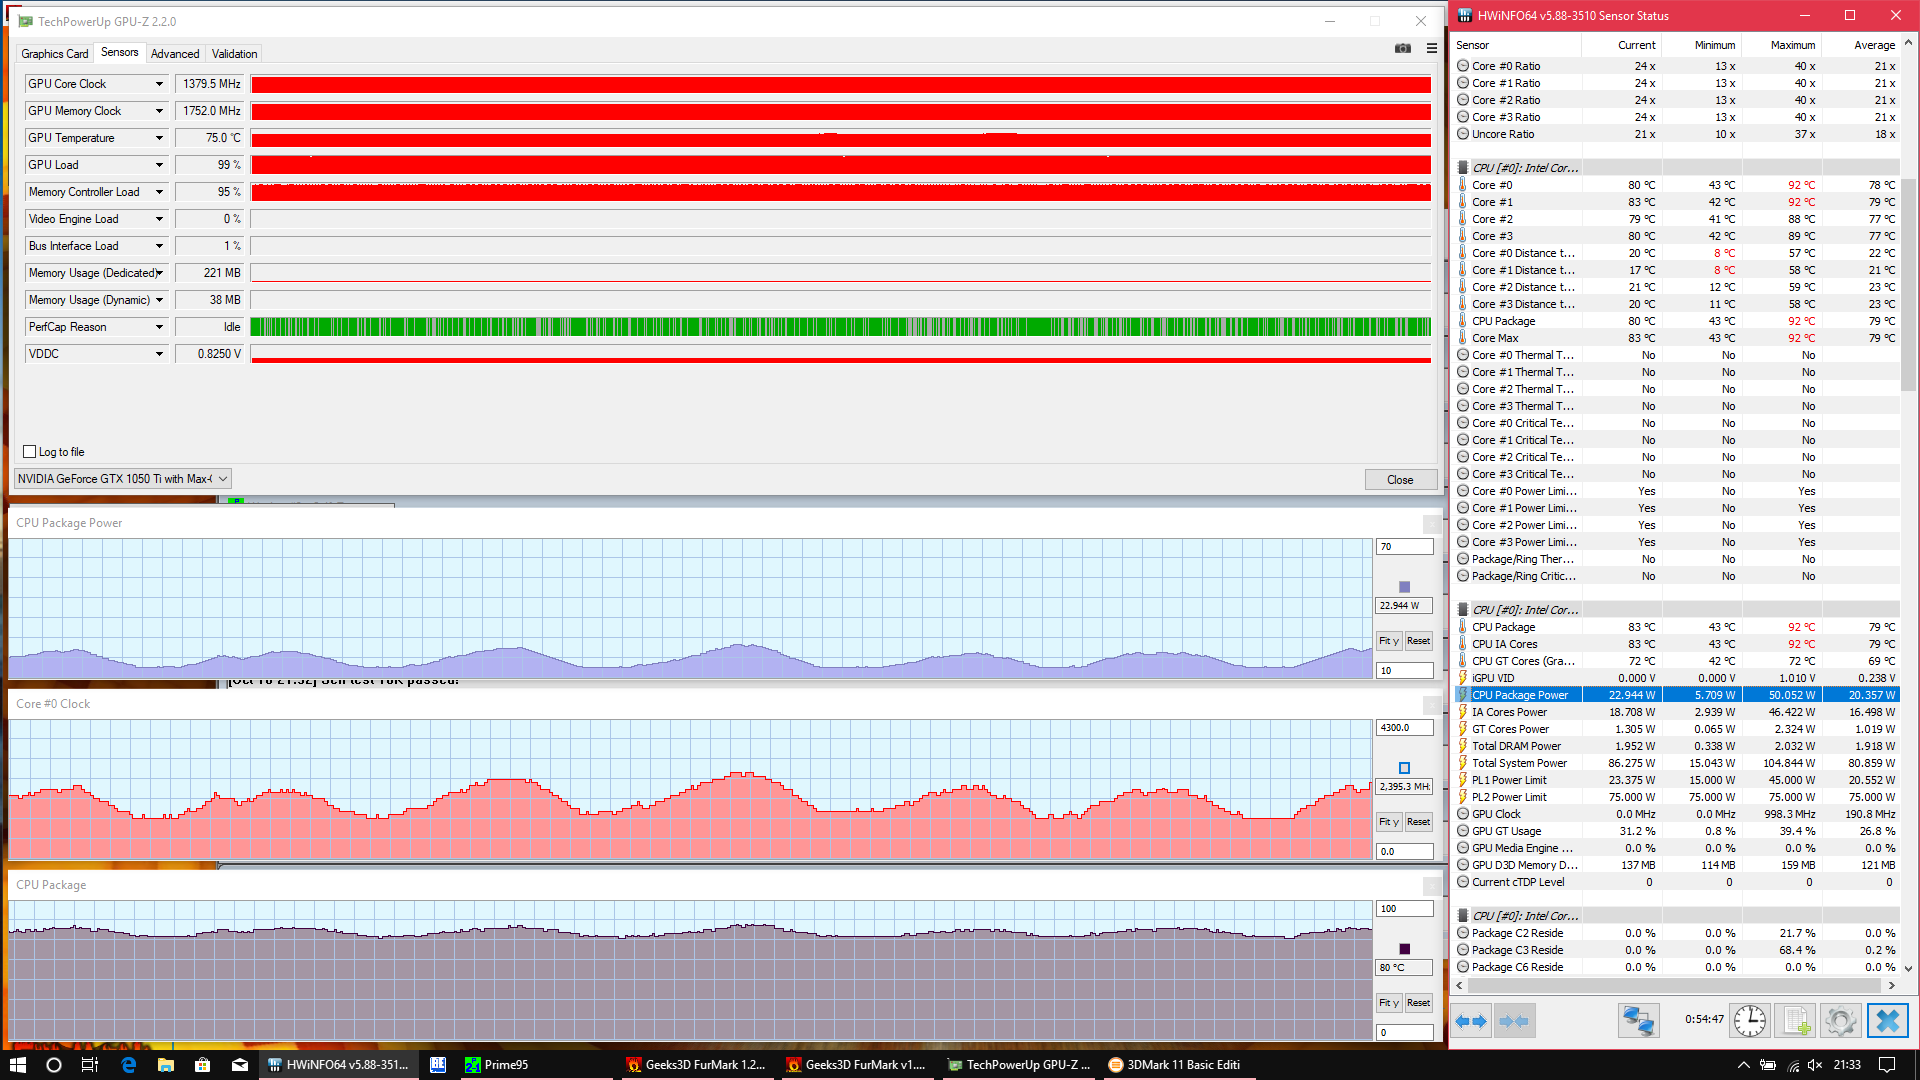
In the stress test with Prime95 and FurMark, the CPU of the X1 Extreme can consume more than 40 W in the beginning, which results in CPU temperatures that reach 92 °C (~198 °). After a short span of time, the consumption drops significantly to about 20 W, though it then starts to fluctuate between 25 and 15 W. At the same time, the CPU clock goes down from 3.5 GHz to 2.3 GHz and then fluctuating to 1.5 to 2.5 GHz. While the CPU often has to lower its clock-rate beneath base-clock (throttling), the GPU has a larger latitude – Lenovo apparently prioritizes the GPU, which is why its clock-rate stays stable at 1400 MHz until the stress test is over. At the same time, the GPU temperatures stabilize around 75 °C (~167 °F), while the processor reaches 83 °C (~181 °F) after one hour. Apparently the X1 Extreme still has some thermal potential, which Lenovo has opted to not use. Instead, lower temperatures on the outside and lower fan-noise seem to have been the primary goals.
The throttling in the stress test should not affect everyday use, as the 3DMark11 that we started right after the stress test resulted in a score on the normal level.
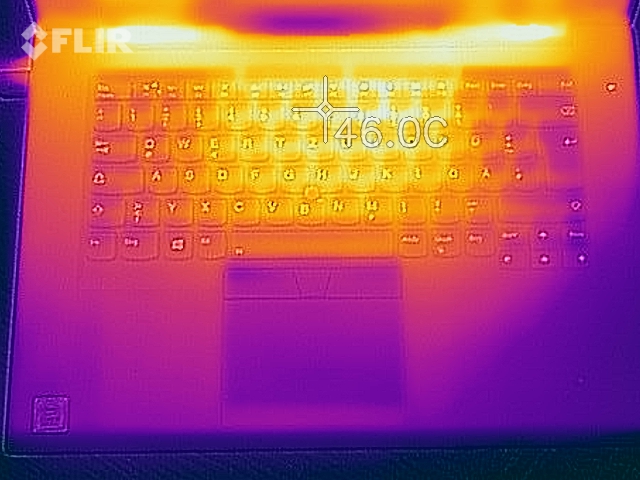
(±) The maximum temperature on the upper side is 43.4 °C / 110 F, compared to the average of 36.9 °C / 98 F, ranging from 21.1 to 71 °C for the class Multimedia.
(-) The bottom heats up to a maximum of 50.9 °C / 124 F, compared to the average of 39.2 °C / 103 F
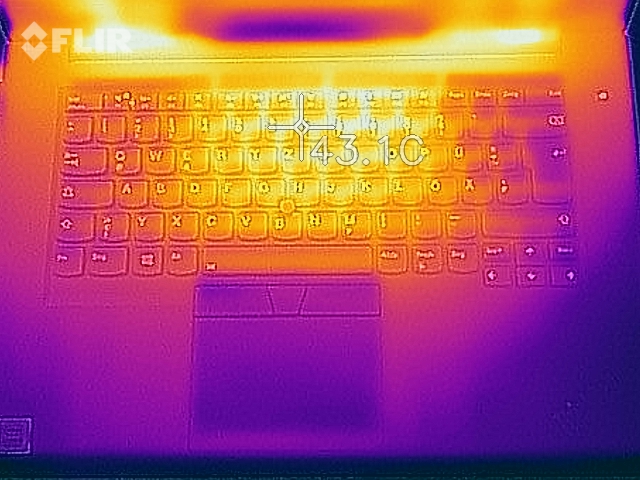
(+) In idle usage, the average temperature for the upper side is 24.5 °C / 76 F, compared to the device average of 31.3 °C / 88 F.
(±) Playing The Witcher 3, the average temperature for the upper side is 35.6 °C / 96 F, compared to the device average of 31.3 °C / 88 F.
(+) The palmrests and touchpad are cooler than skin temperature with a maximum of 29.5 °C / 85.1 F and are therefore cool to the touch.
(±) The average temperature of the palmrest area of similar devices was 28.7 °C / 83.7 F (-0.8 °C / -1.4 F).
Energy management
Power consumption
For the everyday usage, the display is, apart from the processor, the main consumer of energy. This is another area where the lower resolution FHD display has an advantage, because its power consumption compared with the X1 Extreme with 4K-UHD screen is significantly lower. Instead of an average Idle consumption of 14.8 W, the average Idle consumption sits at 7.3 W – roughly 50% less. The X1 Extreme with the FHD screen roughly matches the power consumption of the ThinkPad P52. The comparison with Dell's XPS 15 2018 9570 is not very favorable for the X1 Extreme however, since the XPS consumes even less. Apparently, Dell has optimized the XPS very well.
The max power consumption of 118 W only marks the highest peak. During the stress test, it fluctuates between 80 and 97 W. This is not a problem for the compact 135-W charger, though it would be problematic for most USB C chargers. While the X1 Extreme can be charged via USB C, doing so can result in a lower performance under load.
Apart from the screen and CPU, another power-consuming element is the keyboard backlight. On the X1 Extreme, it raises the Idle consumption from 8.7 W to 9 W (lower brightness) or 11.52 W when the backlight is used on the highest brightness.
| Off / Standby | |
| Idle | |
| Load |
|
Key:
min: | |
| Lenovo ThinkPad X1 Extreme-20MF000RGE i5-8300H, GeForce GTX 1050 Ti Max-Q, Samsung SSD PM981 MZVLB256HAHQ, IPS LED, 1920x1080, 15.6" | Dell XPS 15 2018 i5 FHD 97Wh i5-8300H, GeForce GTX 1050 Mobile, Lite-On CA3-8D256-Q11, LED IGZO IPS InfinityEdge, 1920x1080, 15.6" | Lenovo ThinkPad X1 Extreme-20MF000XGE i7-8750H, GeForce GTX 1050 Ti Max-Q, Samsung SSD PM981 MZVLB1T0HALR, IPS, 3840x2160, 15.6" | Lenovo ThinkPad P52 20MAS03N00 i7-8750H, Quadro P1000, Samsung SSD PM981 MZVLB512HAJQ, IPS LED, 1920x1080, 15.6" | Lenovo ThinkPad T580-20L9001AUS i7-8650U, UHD Graphics 620, Samsung SSD PM981 MZVLB512HAJQ, IPS, 1920x1080, 15.6" | HP EliteBook 850 G5 3JX58EA i5-8250U, UHD Graphics 620, Toshiba XG5 KXG50ZNV256G, IPS LED, 1920x1080, 15.6" | HP EliteBook 1050 G1-4QY20EA i7-8750H, GeForce GTX 1050 Max-Q, Toshiba XG5-P KXG50PNV2T04, IPS LED, 3840x2160, 15.6" | Average NVIDIA GeForce GTX 1050 Ti Max-Q | Average of class Multimedia | |
|---|---|---|---|---|---|---|---|---|---|
| Power Consumption | 16% | -42% | -2% | 16% | 31% | -22% | -25% | -15% | |
| Idle Minimum * (Watt) | 4.14 | 2.9 30% | 7.6 -84% | 4.02 3% | 4.7 -14% | 2.7 35% | 6.1 -47% | 5.8 ? -40% | 5.91 ? -43% |
| Idle Average * (Watt) | 7.3 | 5.8 21% | 14.8 -103% | 7.2 1% | 7.9 -8% | 8.1 -11% | 10.2 -40% | 11.2 ? -53% | 10.3 ? -41% |
| Idle Maximum * (Watt) | 11.5 | 7.5 35% | 17.6 -53% | 11.46 -0% | 11.4 1% | 10.1 12% | 13.4 -17% | 13.5 ? -17% | 12.4 ? -8% |
| Load Average * (Watt) | 78.8 | 77.5 2% | 86 -9% | 76.3 3% | 47.2 40% | 39 51% | 82 -4% | 86.9 ? -10% | 69 ? 12% |
| Witcher 3 ultra * (Watt) | 82 | 84 -2% | 85 -4% | 74 10% | |||||
| Load Maximum * (Watt) | 118 | 107 9% | 118.9 -1% | 154 -31% | 48.1 59% | 37.2 68% | 122 -3% | 122.4 ? -4% | 112.2 ? 5% |
* ... smaller is better
Battery runtime
The size of the battery is consistent among all models of the Lenovo ThinkPad X1 Extreme. Its internal battery always has a capacity of 80 Wh.
The first X1 Extreme review-unit with the 4K screen reached a meager 6.5 hours in the Wi-Fi test with this battery. Today's unit performs much better in this test, which is no doubt due to the much lower power consumption of the FHD screen. The low-end X1 Extreme lasted 9.5 hours in the Wi-Fi test. Even still better in this respect is the Dell XPS 15, which managed a whopping 15 hours of runtime – thanks to its larger battery and lower power consumption.
| Lenovo ThinkPad X1 Extreme-20MF000RGE i5-8300H, GeForce GTX 1050 Ti Max-Q, 80 Wh | Dell XPS 15 2018 i5 FHD 97Wh i5-8300H, GeForce GTX 1050 Mobile, 97 Wh | Lenovo ThinkPad X1 Extreme-20MF000XGE i7-8750H, GeForce GTX 1050 Ti Max-Q, 80 Wh | Lenovo ThinkPad P52 20MAS03N00 i7-8750H, Quadro P1000, 96 Wh | HP EliteBook 1050 G1-4QY20EA i7-8750H, GeForce GTX 1050 Max-Q, 96 Wh | HP EliteBook 850 G5 3JX58EA i5-8250U, UHD Graphics 620, 56 Wh | Average of class Multimedia | |
|---|---|---|---|---|---|---|---|
| Battery runtime | 37% | -25% | 8% | -2% | 22% | 24% | |
| Reader / Idle (h) | 21 | 11.5 -45% | 25.3 20% | 17.1 -19% | 17.8 -15% | 23.7 ? 13% | |
| H.264 (h) | 9.6 | 6.2 -35% | 12.2 27% | 9.7 1% | 10.5 9% | 15.8 ? 65% | |
| WiFi v1.3 (h) | 9.4 | 15.7 67% | 6.4 -32% | 10.6 13% | 8.7 -7% | 9.3 -1% | 11.5 ? 22% |
| Load (h) | 1.8 | 1.9 6% | 2 11% | 1.3 -28% | 2.1 17% | 3.5 94% | 1.688 ? -6% |
| Witcher 3 ultra (h) | 1 | 1.1 |
Verdict
Pros
Cons
The first review-unit of the Lenovo ThinkPad X1 Extreme managed to win us over in many ways, thus achieving a score of 91%. The cheaper model with FHD screen and i5 CPU, which we reviewed today, performed even better, scoring a rare 92% rating.
The main reason for this slightly surprising result is the FHD screen, which is both a curse and a blessing. Its quality is good, though maybe not good enough for a machine in the premium-section of the market. The brightness-value does not reach the values of the Dell XPS 15 FHD screen and the color-gamut is a far cry from the excellent 4K-UHD screen in the more expensive X1 Extreme. This might be seen as a first-world-problem by some, though we would have liked to see a sRGB coverage of 100% or close to 100% – 88% is unfortunately a little too far away. But the screen is not all bad: For example, it offers a matte display surface that minimizes annoying reflections, which makes working in bright environments easier. The most important advantage of this screen though is its lower power consumption, which results in three hours of additional battery life in the Wi-Fi test. Additionally, the creaking sound that annoyed us on the touchscreen model is nowhere to be found on the non-touch FHD model.
These points were the major factors in the slightly better score. Overall, we prefer the less expensive model of the Lenovo ThinkPad X1 Extreme – RAM and SSD can be easily upgraded and the choice of the less powerful i5 processor also drives down the already high price of the X1 Extreme. The FHD screen should satisfy most users in everyday use, which is more hassle-free thanks to the matte screen surface and the improved battery life. Although it should be mentioned of course that for people who work with colors, the 4K-UHD screen still is the much better choice. The high-end screen also offers touch and HDR, features that will probably sway some users over to prefer it over the FHD option.
Cheaper is better: The base version of the Lenovo ThinkPad X1 Extreme convinced us a little bit more than its more expensive counterpart.
Of course, it is annoying that one has to choose between display quality, the matte screen surface and better battery life when buying the X1 Extreme. These are areas that Lenovo should work on with a potential future update of the ThinkPad X1 Extreme. The manufacturer should take a look at Dell and HP here: The Dell XPS 15 9570 includes a much bigger battery and HP offers its EliteBook 1050 G1 with a matte non-touch 4K-UHD display.
As far as the direct comparison with the Dell XPS 15 goes: Dell certainly has some strong arguments for its device, which has the brighter screen, the bigger battery as well as the lower price. There are some arguments for the ThinkPad X1 Extreme as well, such as its stronger GPU on the base model, the second SSD slot as well as the lower weight and some extra business features for big corporations (Smartcard, mini-Ethernet). It also has the ThinkPad keyboard and the TrackPoint, though preferences in this respect are of course subjective. Which model is preferred is mostly a matter of taste, the needed features and the budget. In any case, the ThinkPad X1 Extreme is a worthy opponent to the Dell XPS 15, albeit an expensive one at that.
Lenovo ThinkPad X1 Extreme-20MF000RGE
- 10/17/2018 v6 (old)
Benjamin Herzig
Price comparison