

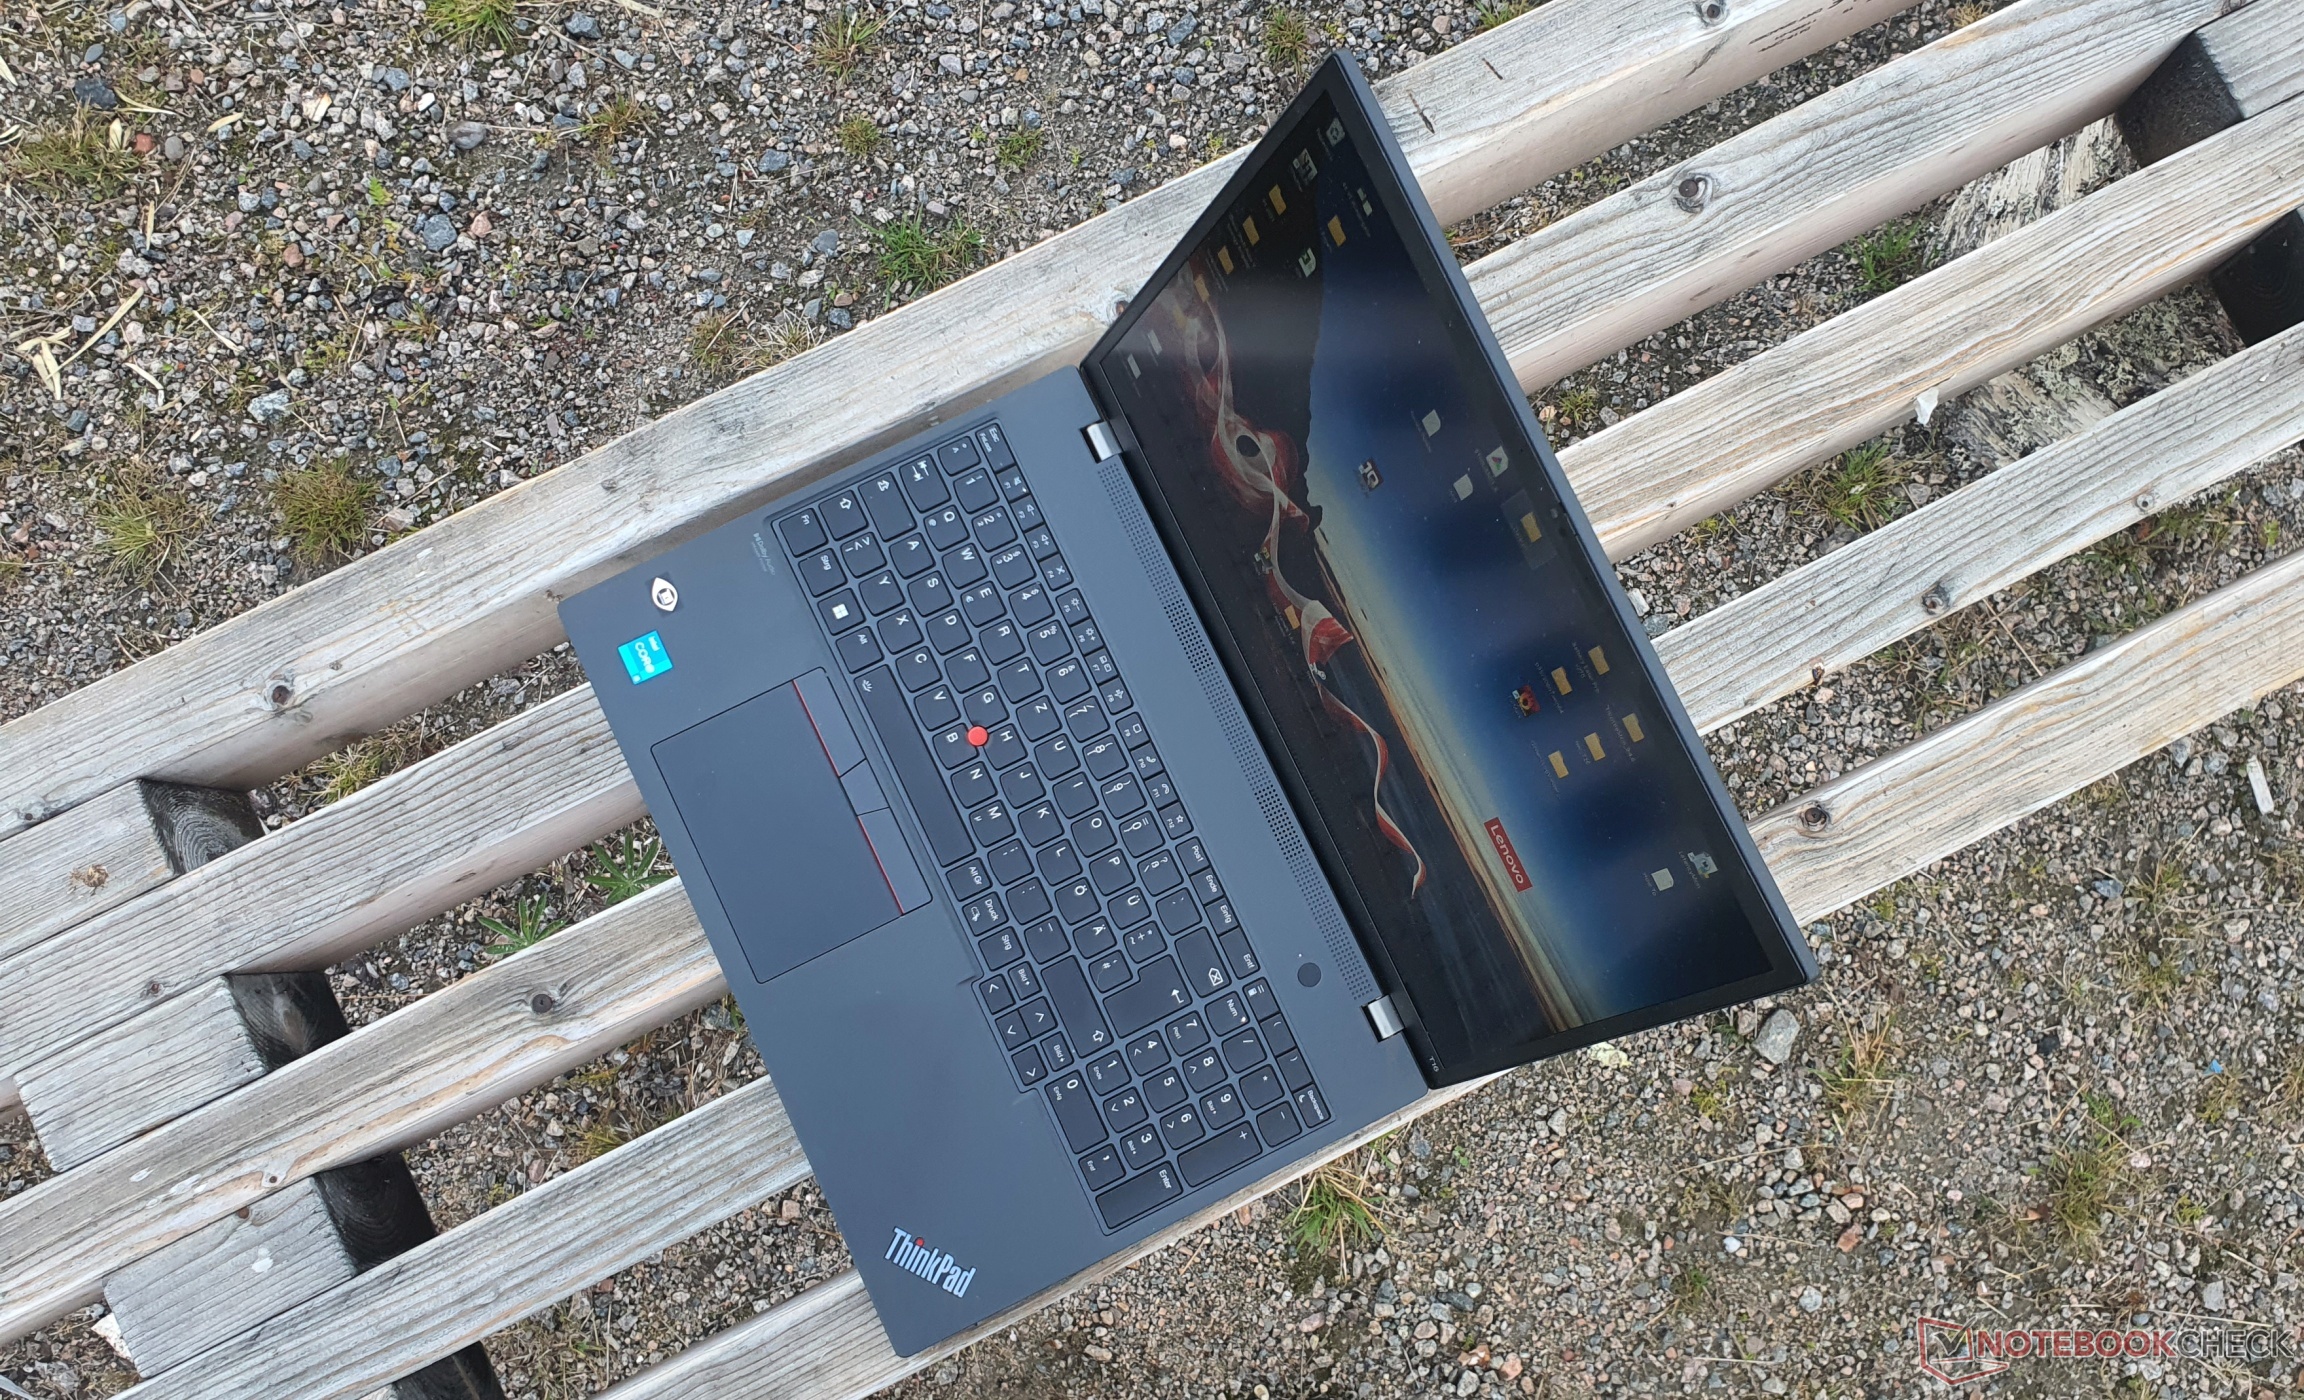
Lenovo ThinkPad T16 G1 Intel laptop review: 16-inch marathon runner
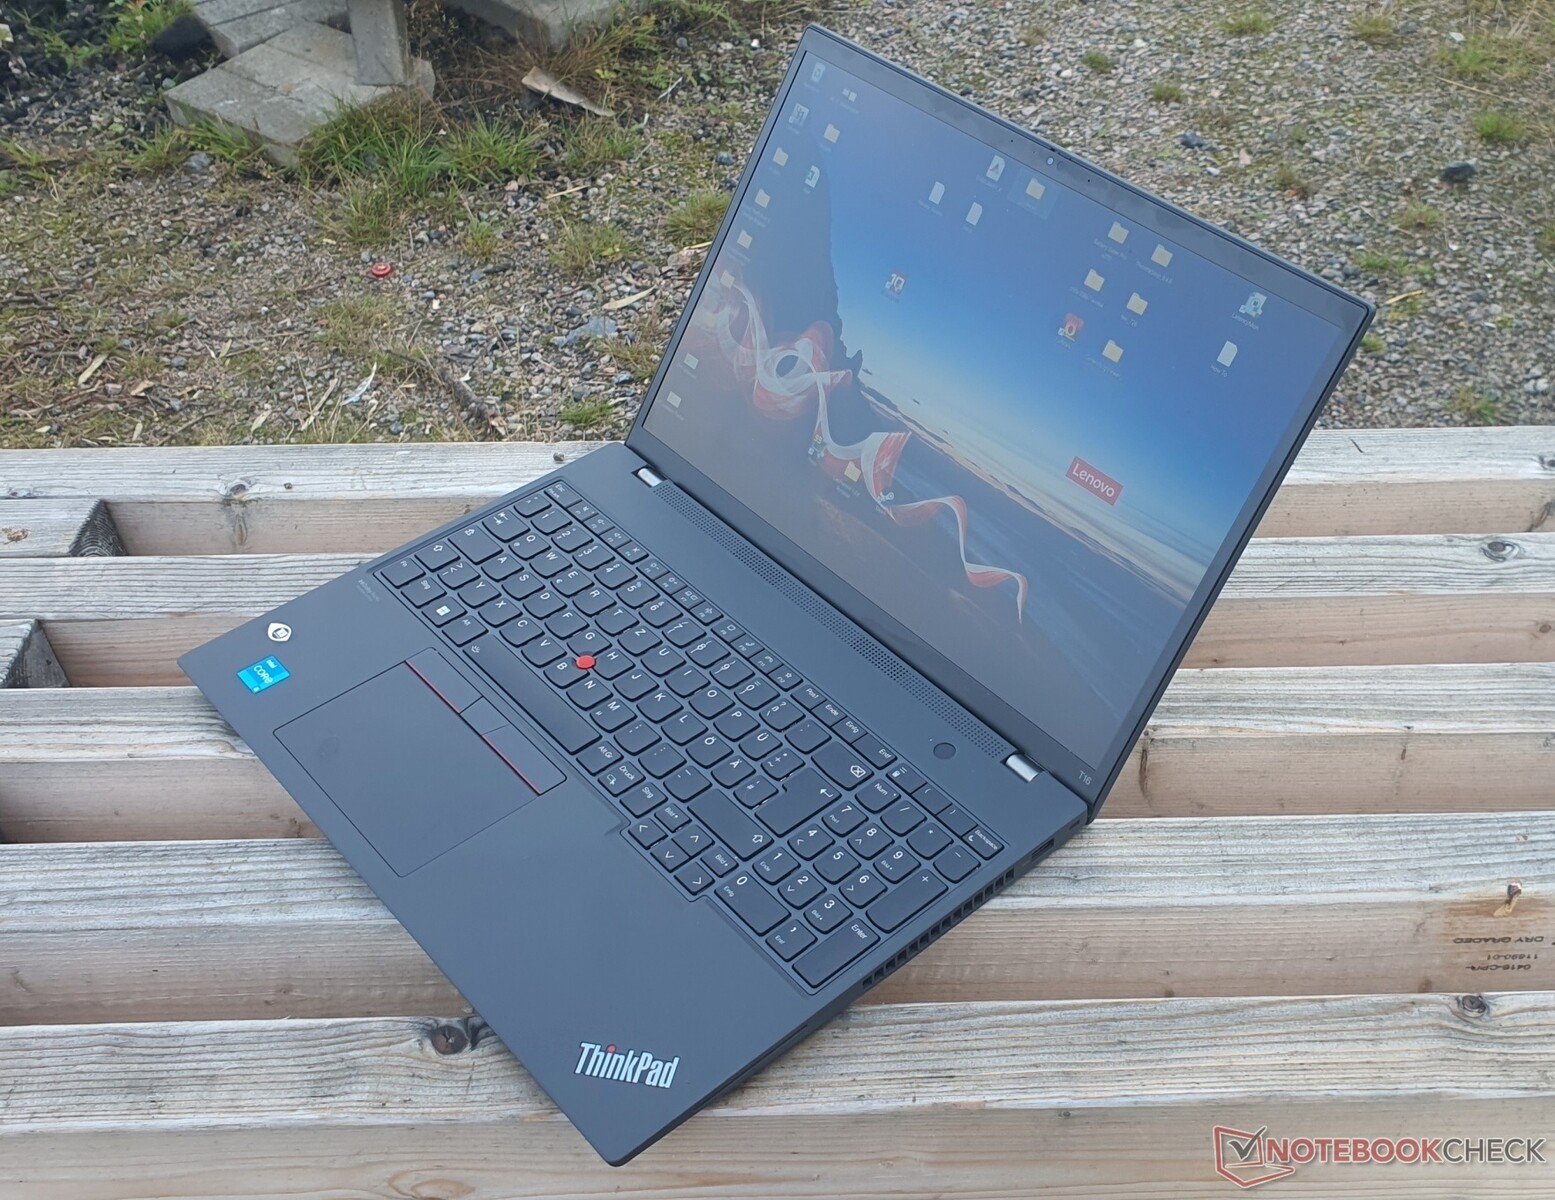
Finally, Lenovo's ThinkPads from the classic T-series are also getting a redesign. The 16:10 display of the ThinkPad T16 G1, which has been enlarged to 16 inches, is likely to be the first thing that catches your eye. The option of a significantly larger battery raises the hope of long battery runtimes, as does the optional low-power display. Other changes will be explained throughout this review, as well as possible drawbacks compared to the predecessor.
Our model comes with an Intel Core i5-1240P, 16 GB of DDR4-3200 RAM, a 512 GB PCIe 4.0 SSD, a FHD+ low-power display and a large 86 Wh battery. The optional Intel U CPUs seem to be a little more economical according to our reviews thus far. A 2.5K panel is also available, but the 4K UHD option of the predecessor with 100% DCI-P3 is no longer available. Nvidia's GeForce MX550 is also optional.
The competition of the ThinkPad T16 as a high-end business device among the 15/16-inch laptops primarily includes Dell's Latitude 15 5531 and HP's EliteBook 865 G9. But the comparison with mid-range laptops is certainly interesting, including multimedia office hybrids such as Huawei's MateBook D 16 and Asus' Vivobook Pro 16X.
Possible Competitors in Comparison
Rating | Date | Model | Weight | Height | Size | Resolution | Price |
|---|---|---|---|---|---|---|---|
| 89.3 % v7 (old) | 09 / 2022 | Lenovo ThinkPad T16 G1 21BWS00200 i5-1240P, Iris Xe G7 80EUs | 1.9 kg | 20.5 mm | 16.00" | 1920x1200 | |
| 87.1 % v7 (old) | 05 / 2021 | Lenovo ThinkPad T15 Gen2-20W5S00100 i7-1165G7, GeForce MX450 | 1.9 kg | 19.1 mm | 15.60" | 1920x1080 | |
| 85.5 % v7 (old) | 08 / 2021 | Lenovo ThinkPad E15 G3-20YG003UGE R7 5700U, Vega 8 | 1.8 kg | 18.9 mm | 15.60" | 1920x1080 | |
| 85.1 % v7 (old) | 07 / 2021 | Lenovo ThinkPad L15 G2 AMD R5 5600U, Vega 7 | 1.9 kg | 21 mm | 15.60" | 1920x1080 | |
| 85 % v7 (old) | 08 / 2022 | HP ProBook 450 G9 6A180EA i7-1255U, Iris Xe G7 96EUs | 1.7 kg | 19.9 mm | 15.60" | 1920x1080 | |
| 87.7 % v7 (old) | 07 / 2022 | HP ZBook Power 15 G8 313S5EA i7-11800H, T600 Laptop GPU | 2 kg | 22.8 mm | 15.60" | 1920x1080 | |
v (old) | 09 / 2022 | Dell Latitude 15 5531, i5-12600H MX550 i5-12600H, GeForce MX550 | 1.8 kg | 24.05 mm | 15.60" | 1920x1080 | |
| 87.4 % v7 (old) | 08 / 2022 | Dell Inspiron 16 Plus 7620 i7-12700H, GeForce RTX 3050 Ti Laptop GPU | 2.1 kg | 18.99 mm | 16.00" | 3072x1920 | |
| 83.6 % v7 (old) | 07 / 2022 | Huawei MateBook D 16 2022 i7-12700H, Iris Xe G7 96EUs | 1.7 kg | 18.4 mm | 16.00" | 1920x1200 | |
v (old) | 12 / 2021 | Asus Vivobook Pro 16X-M7600QE R9 5900HX, GeForce RTX 3050 Ti Laptop GPU | 1.9 kg | 19 mm | 16.10" | 3840x2400 |
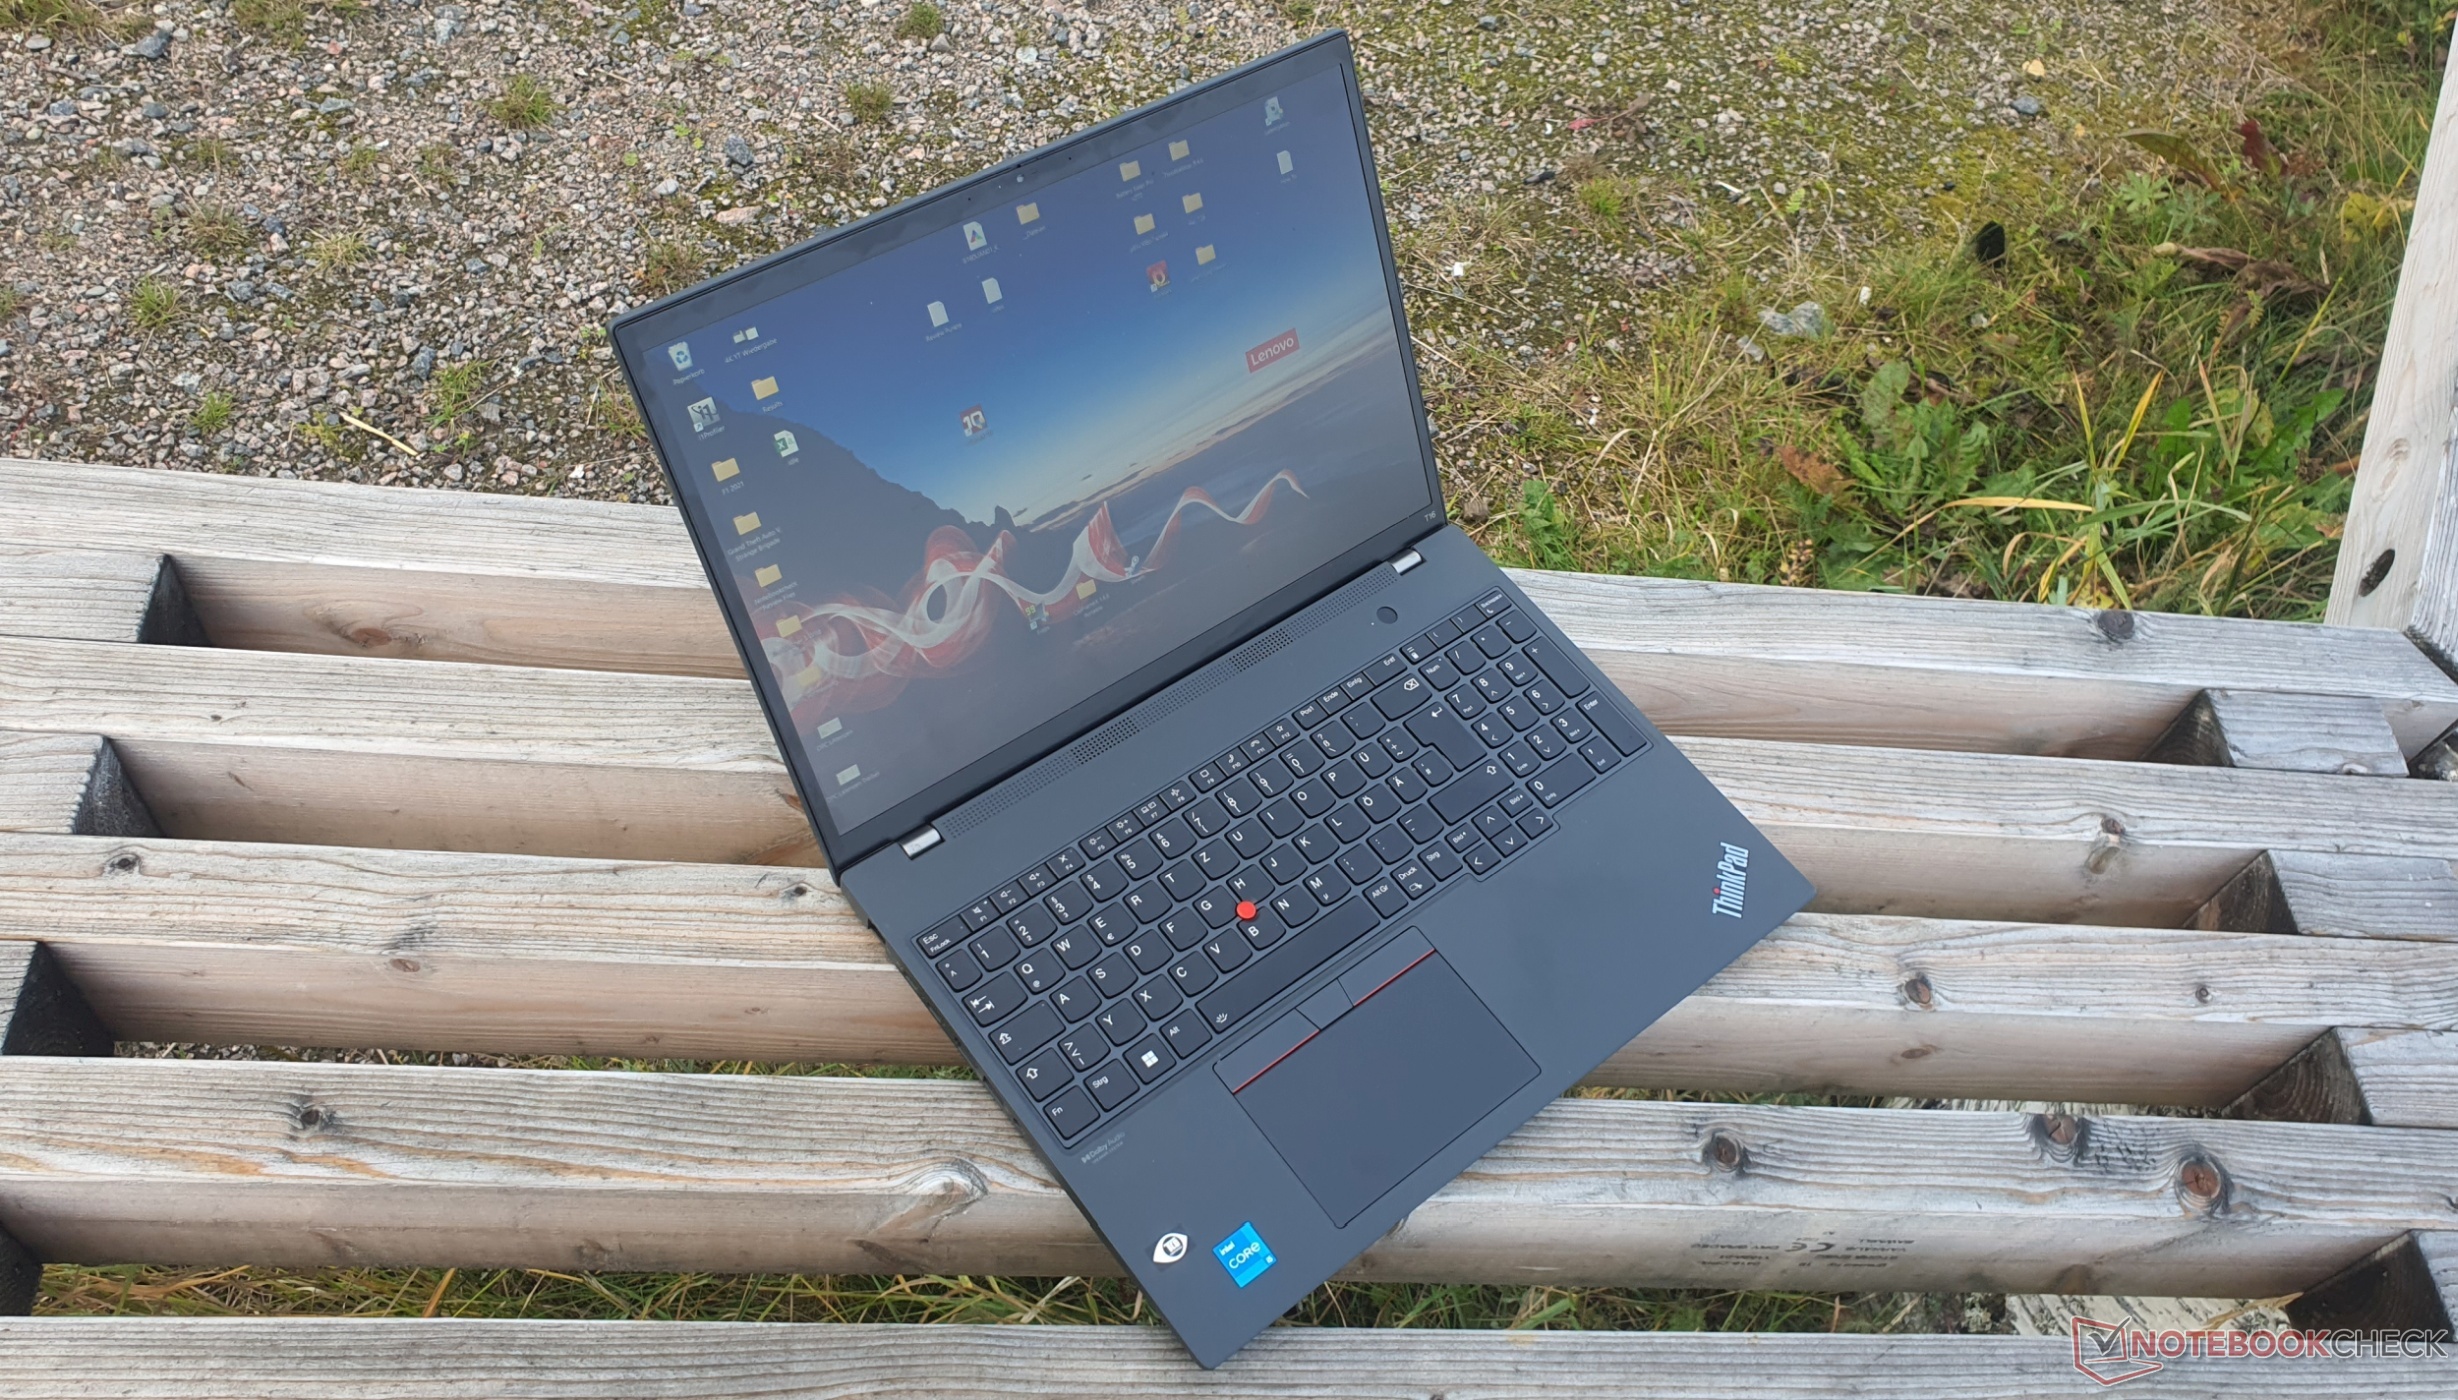
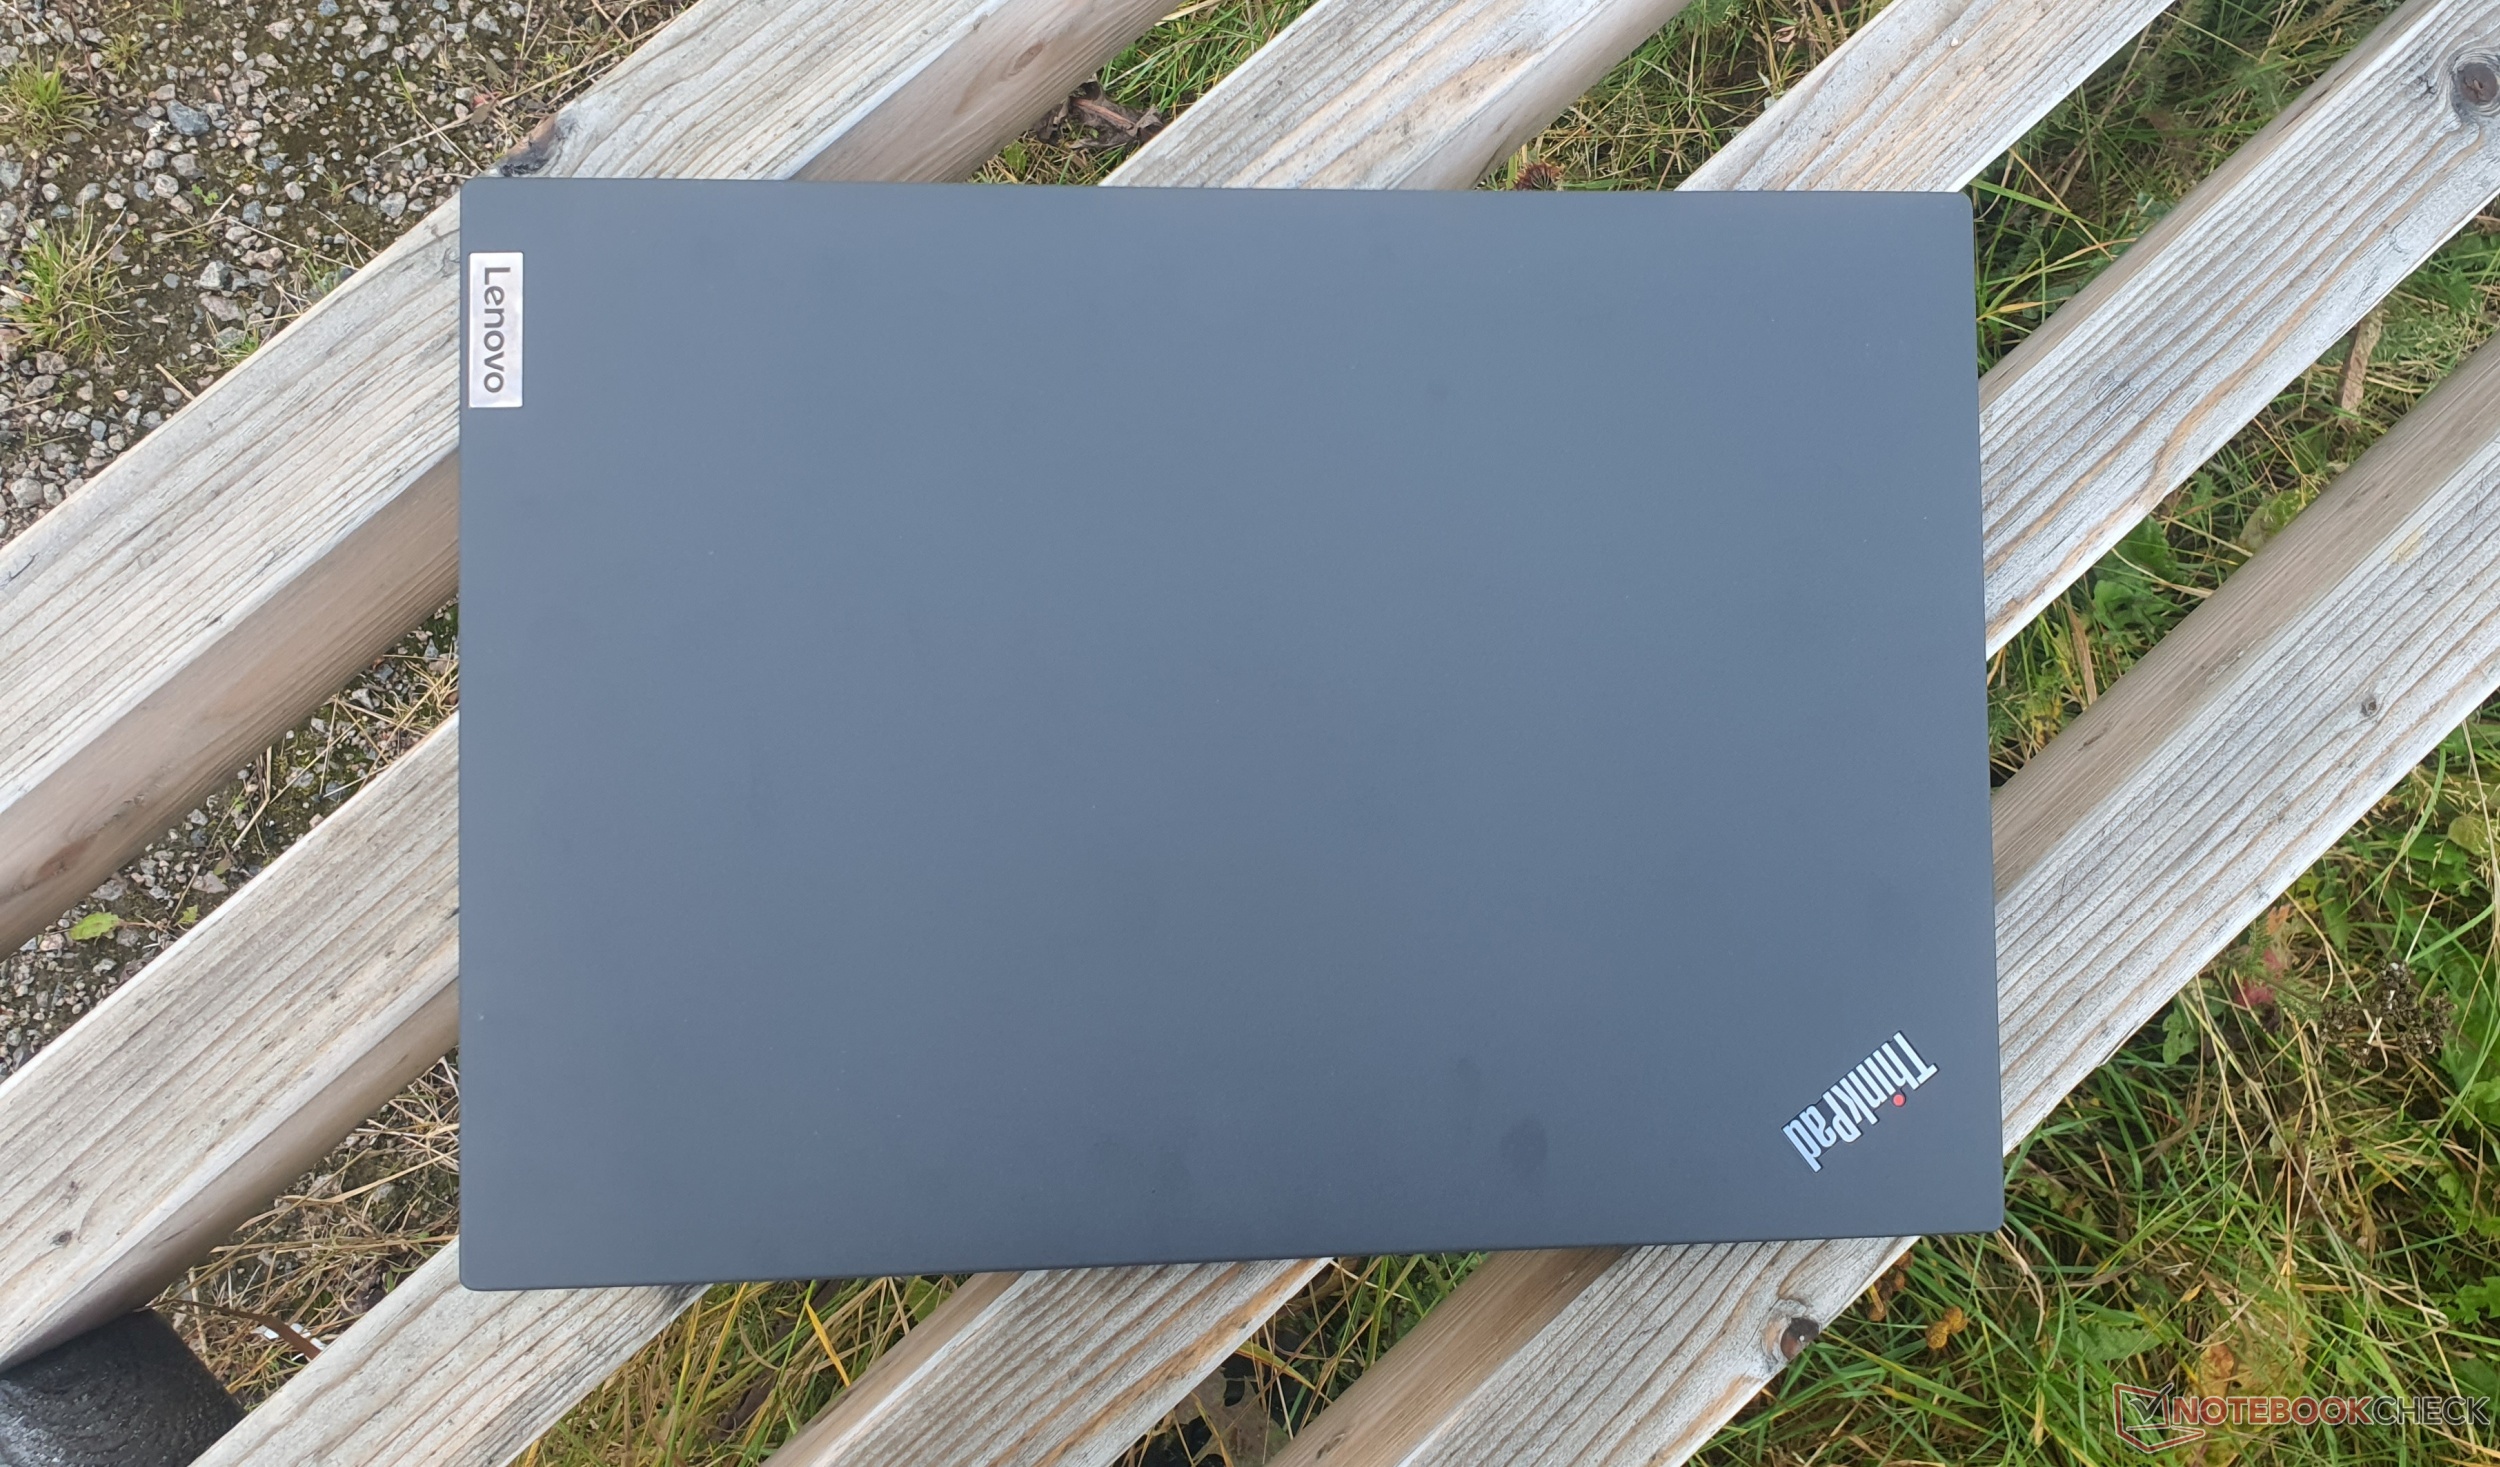
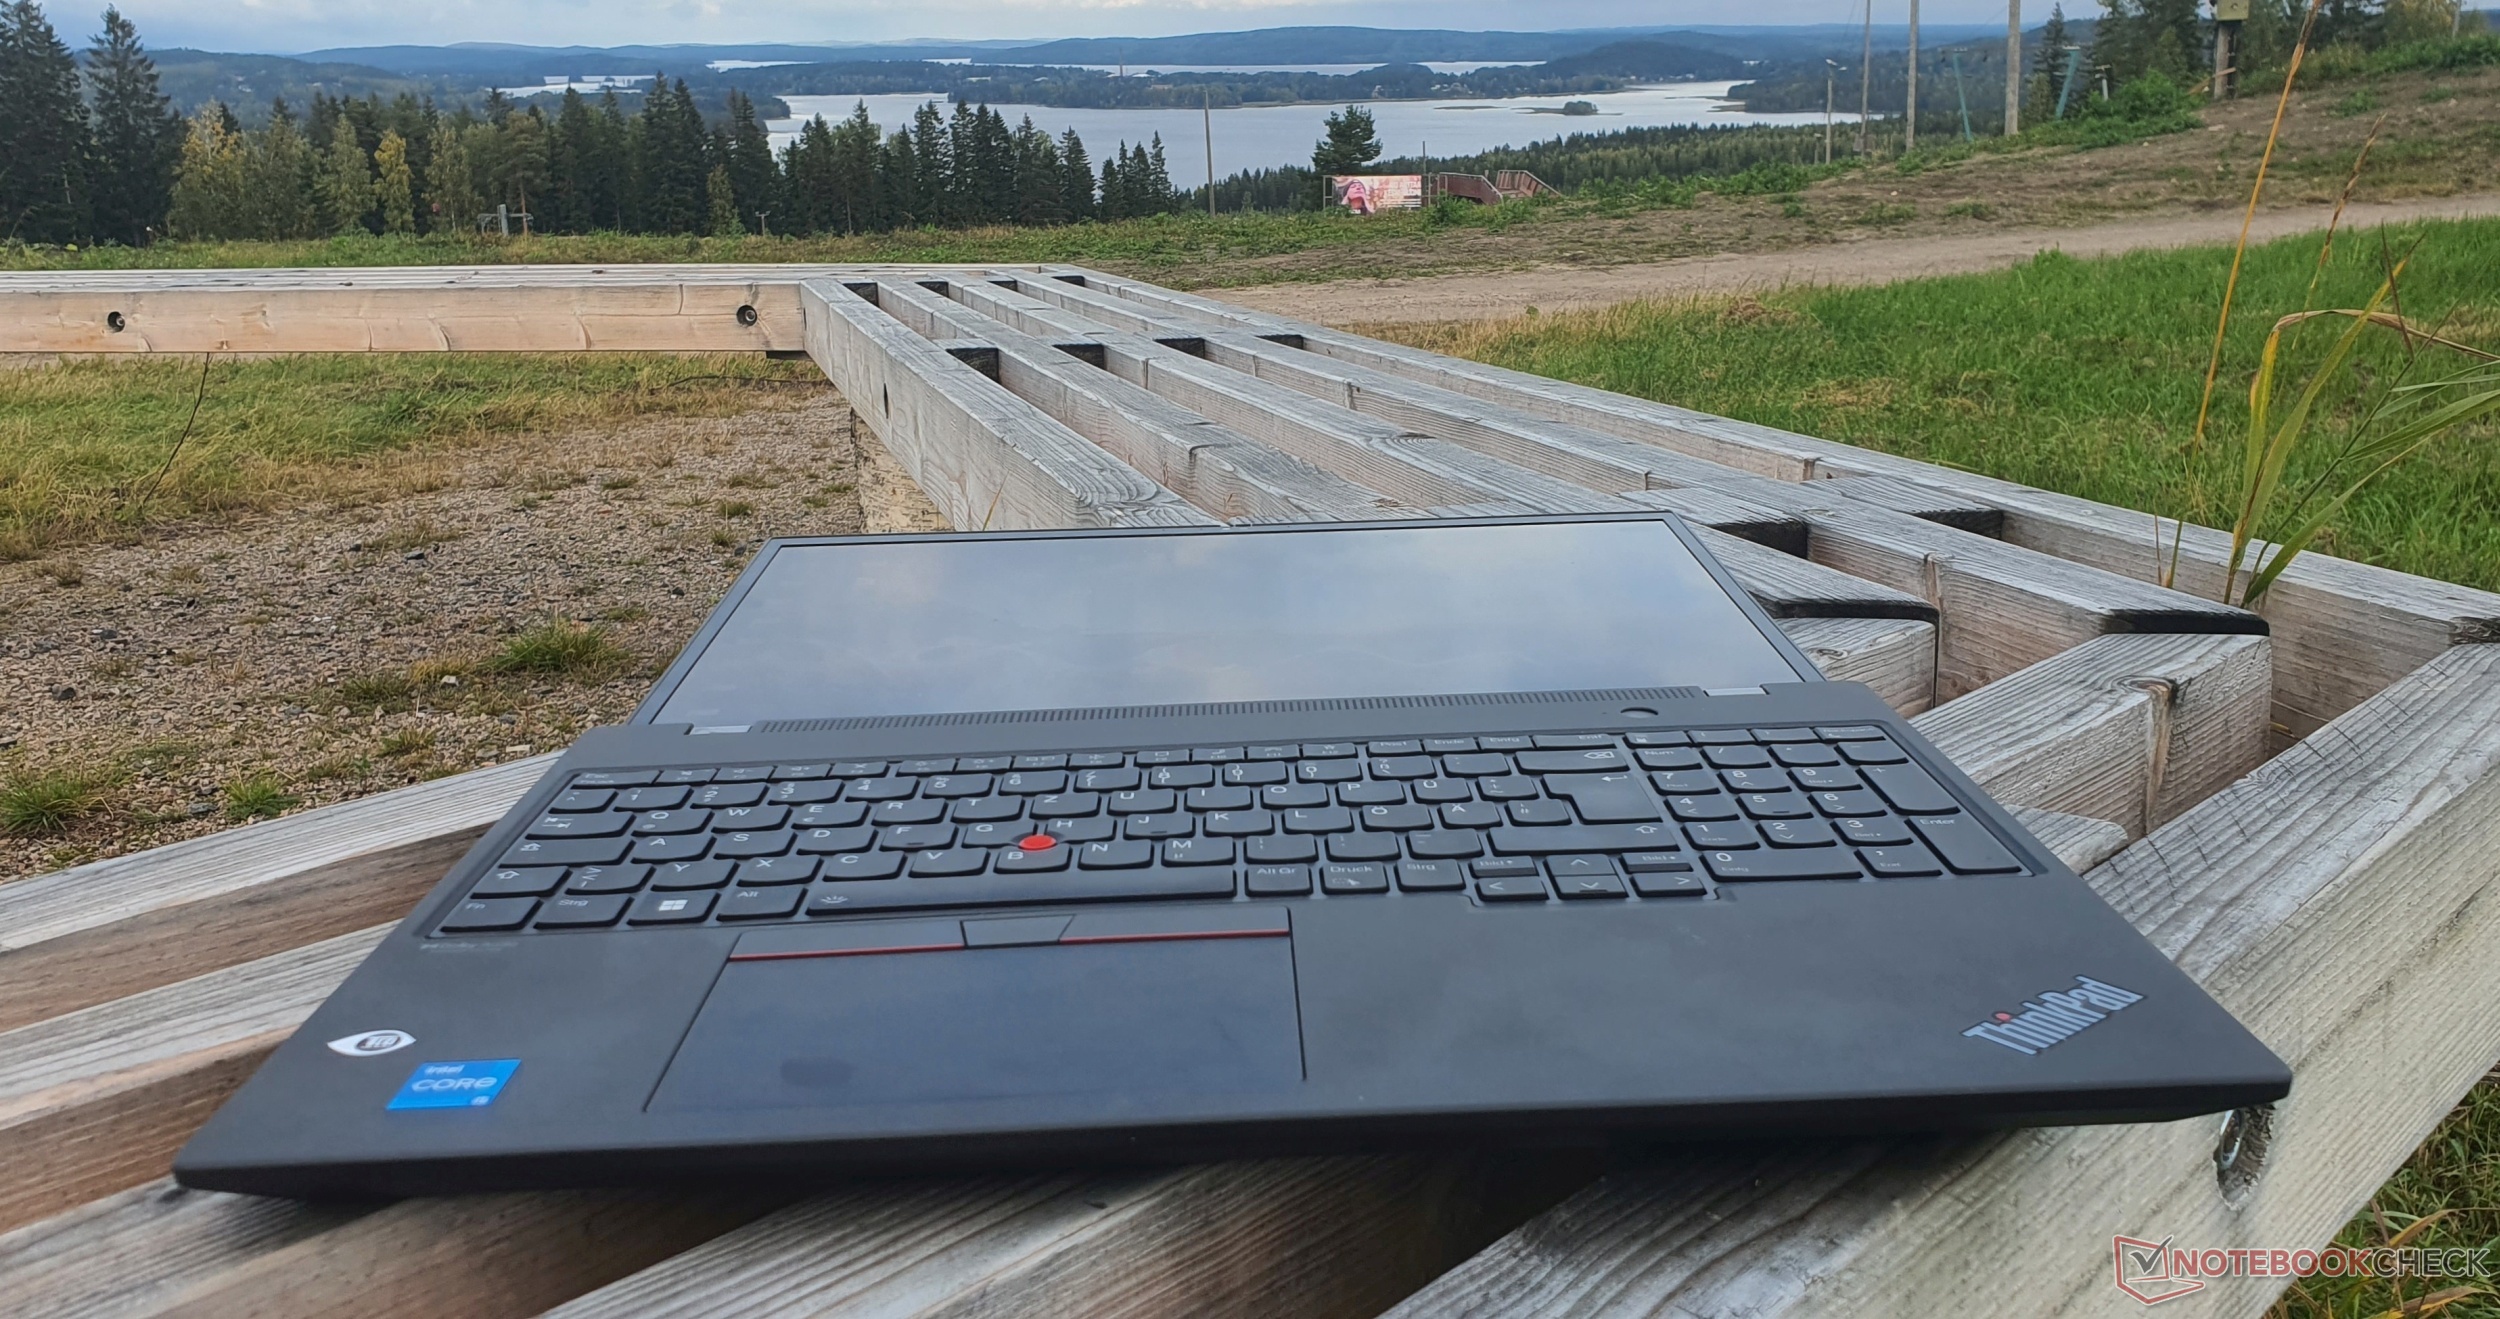
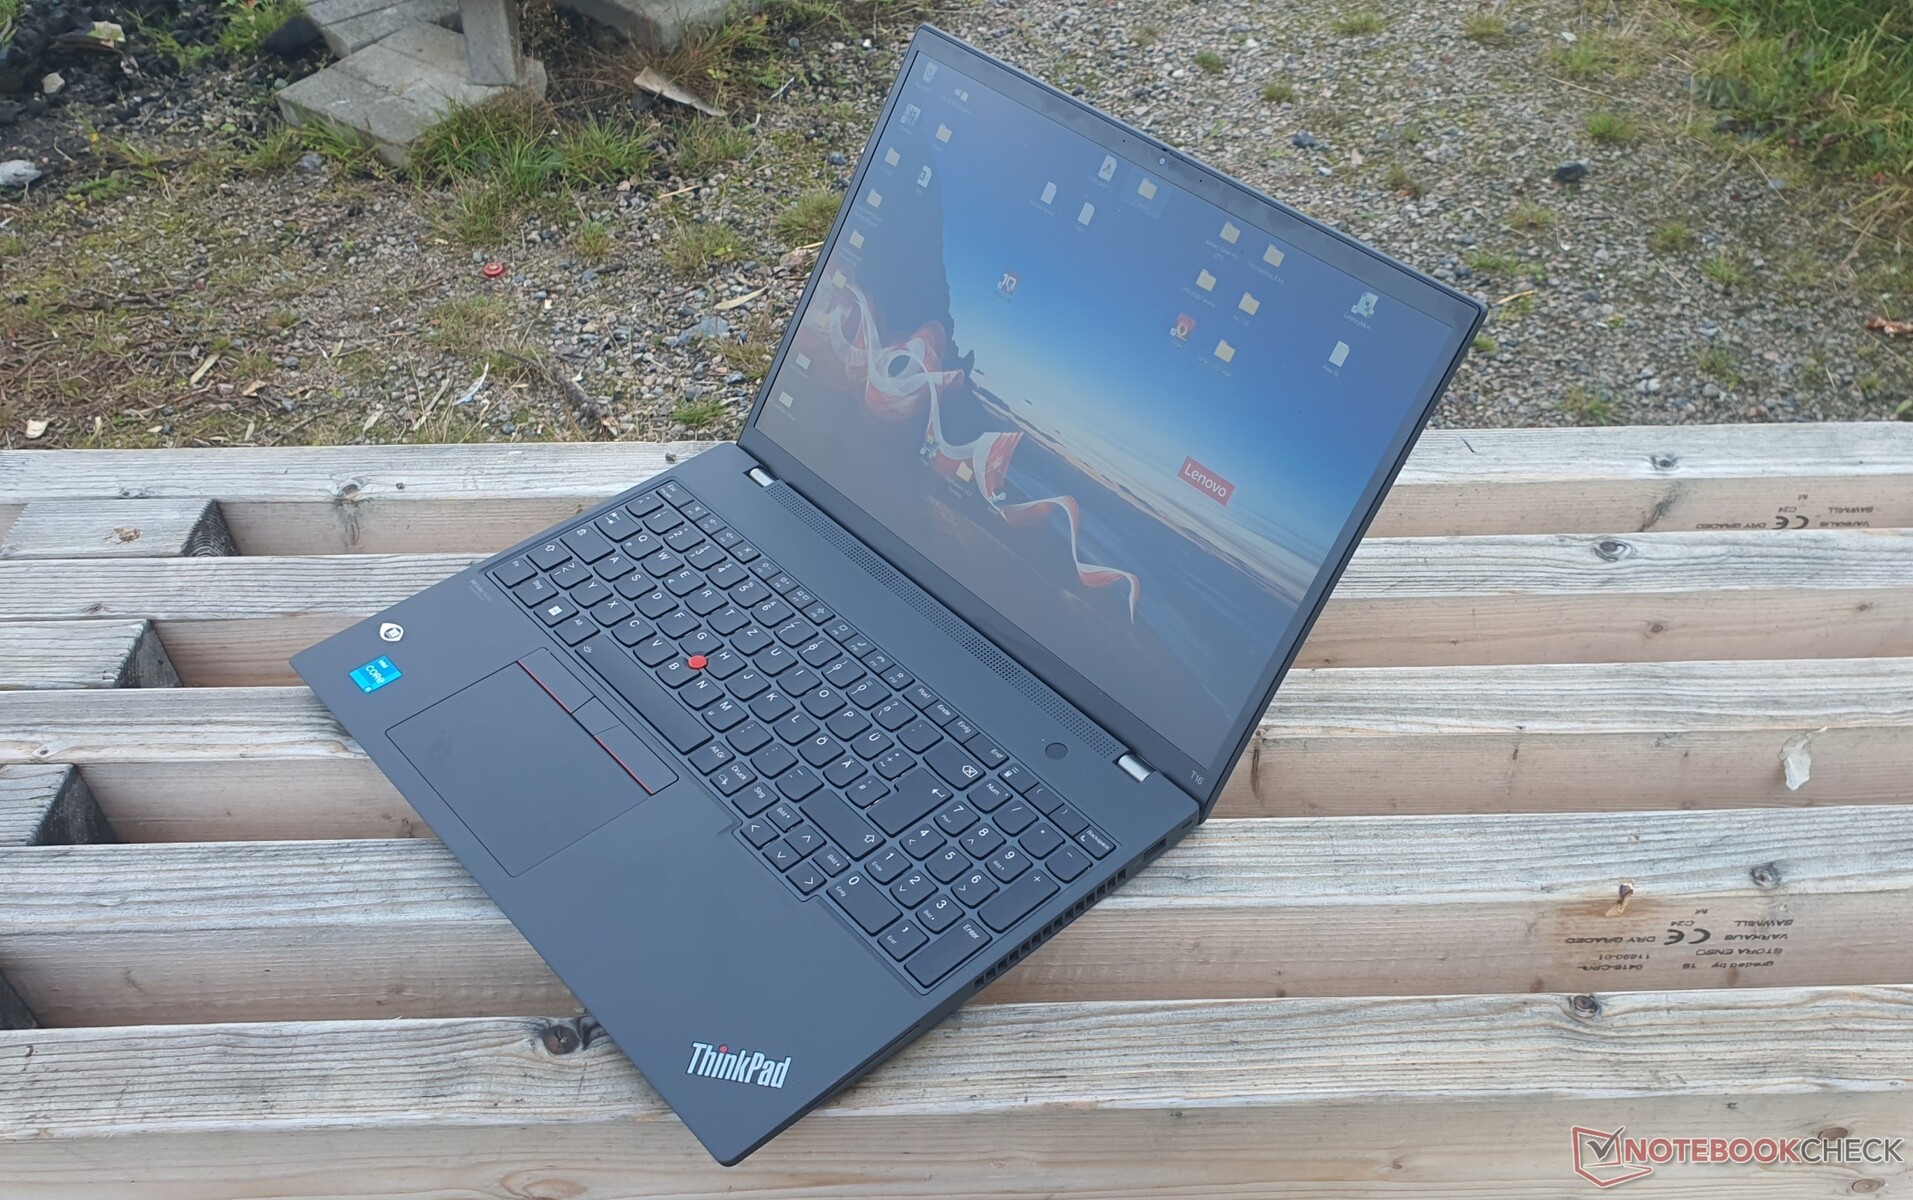
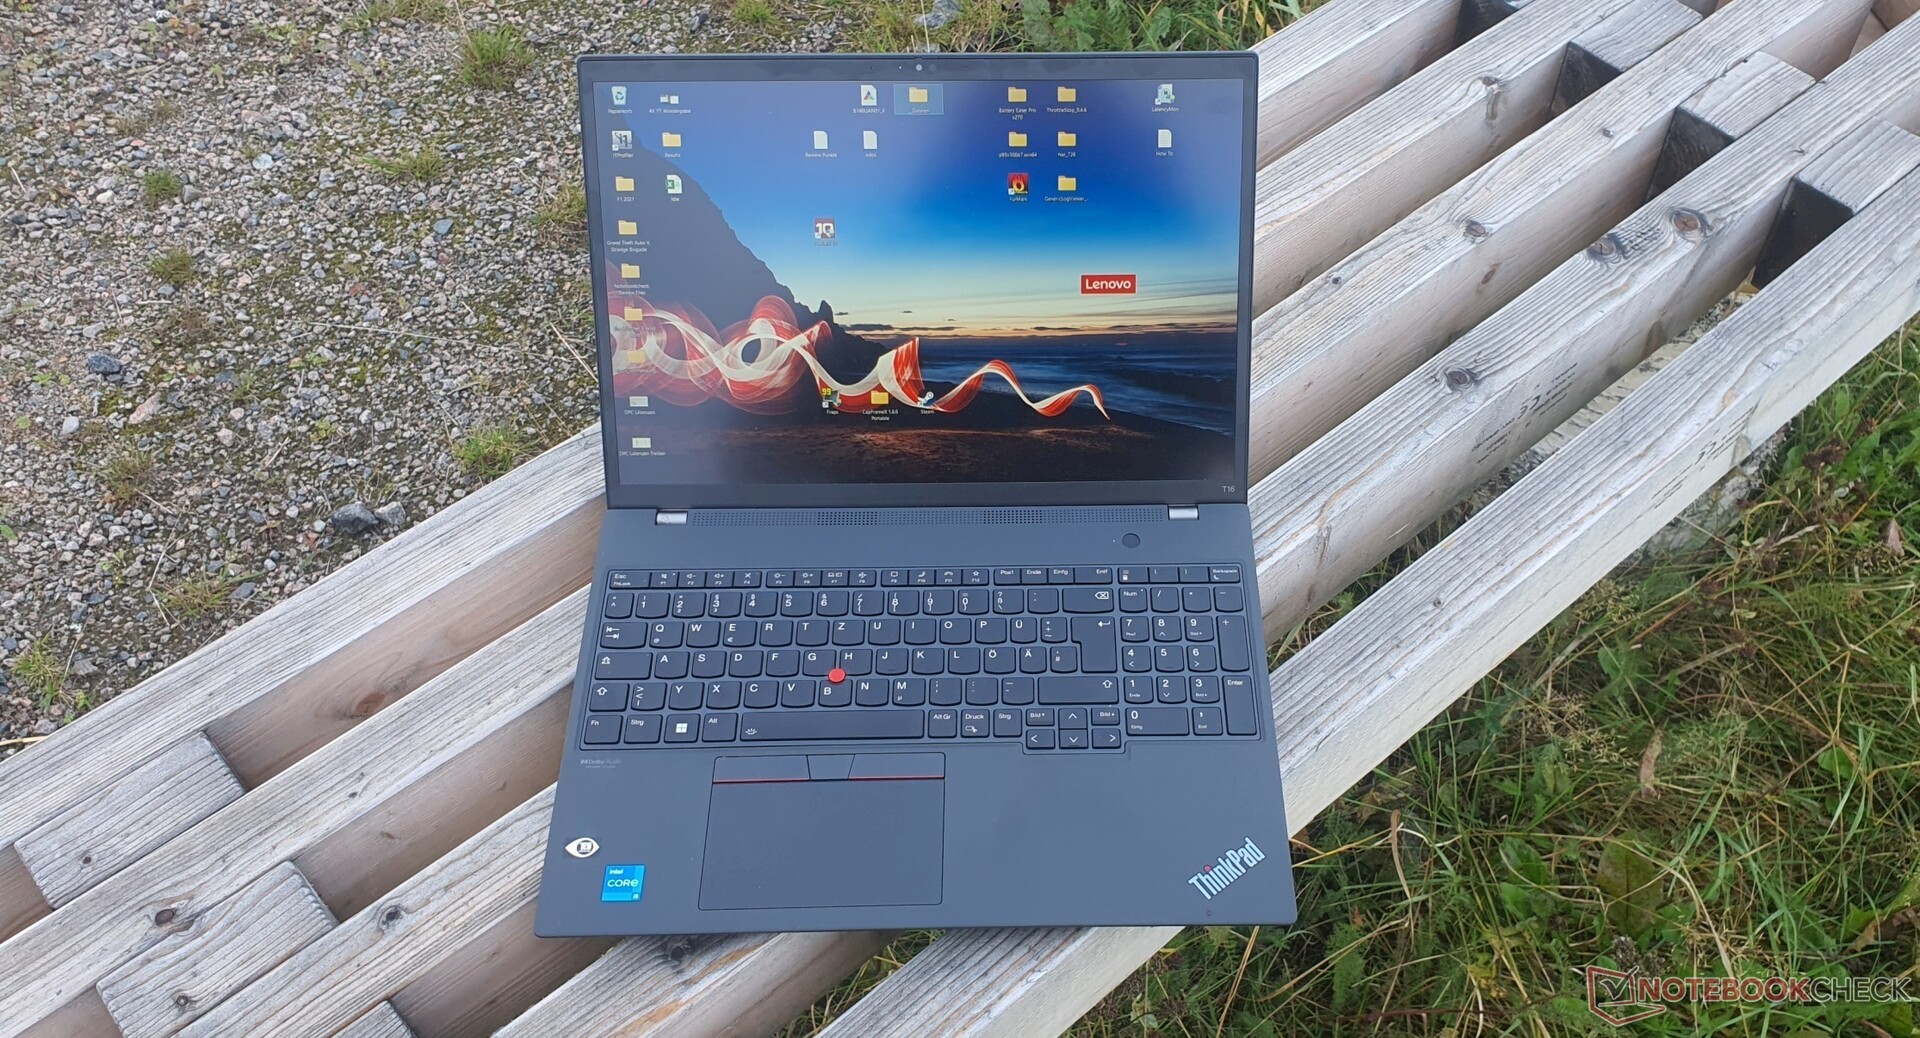
Case - Carbon fiber used in the robust ThinkPad T16 for the first time
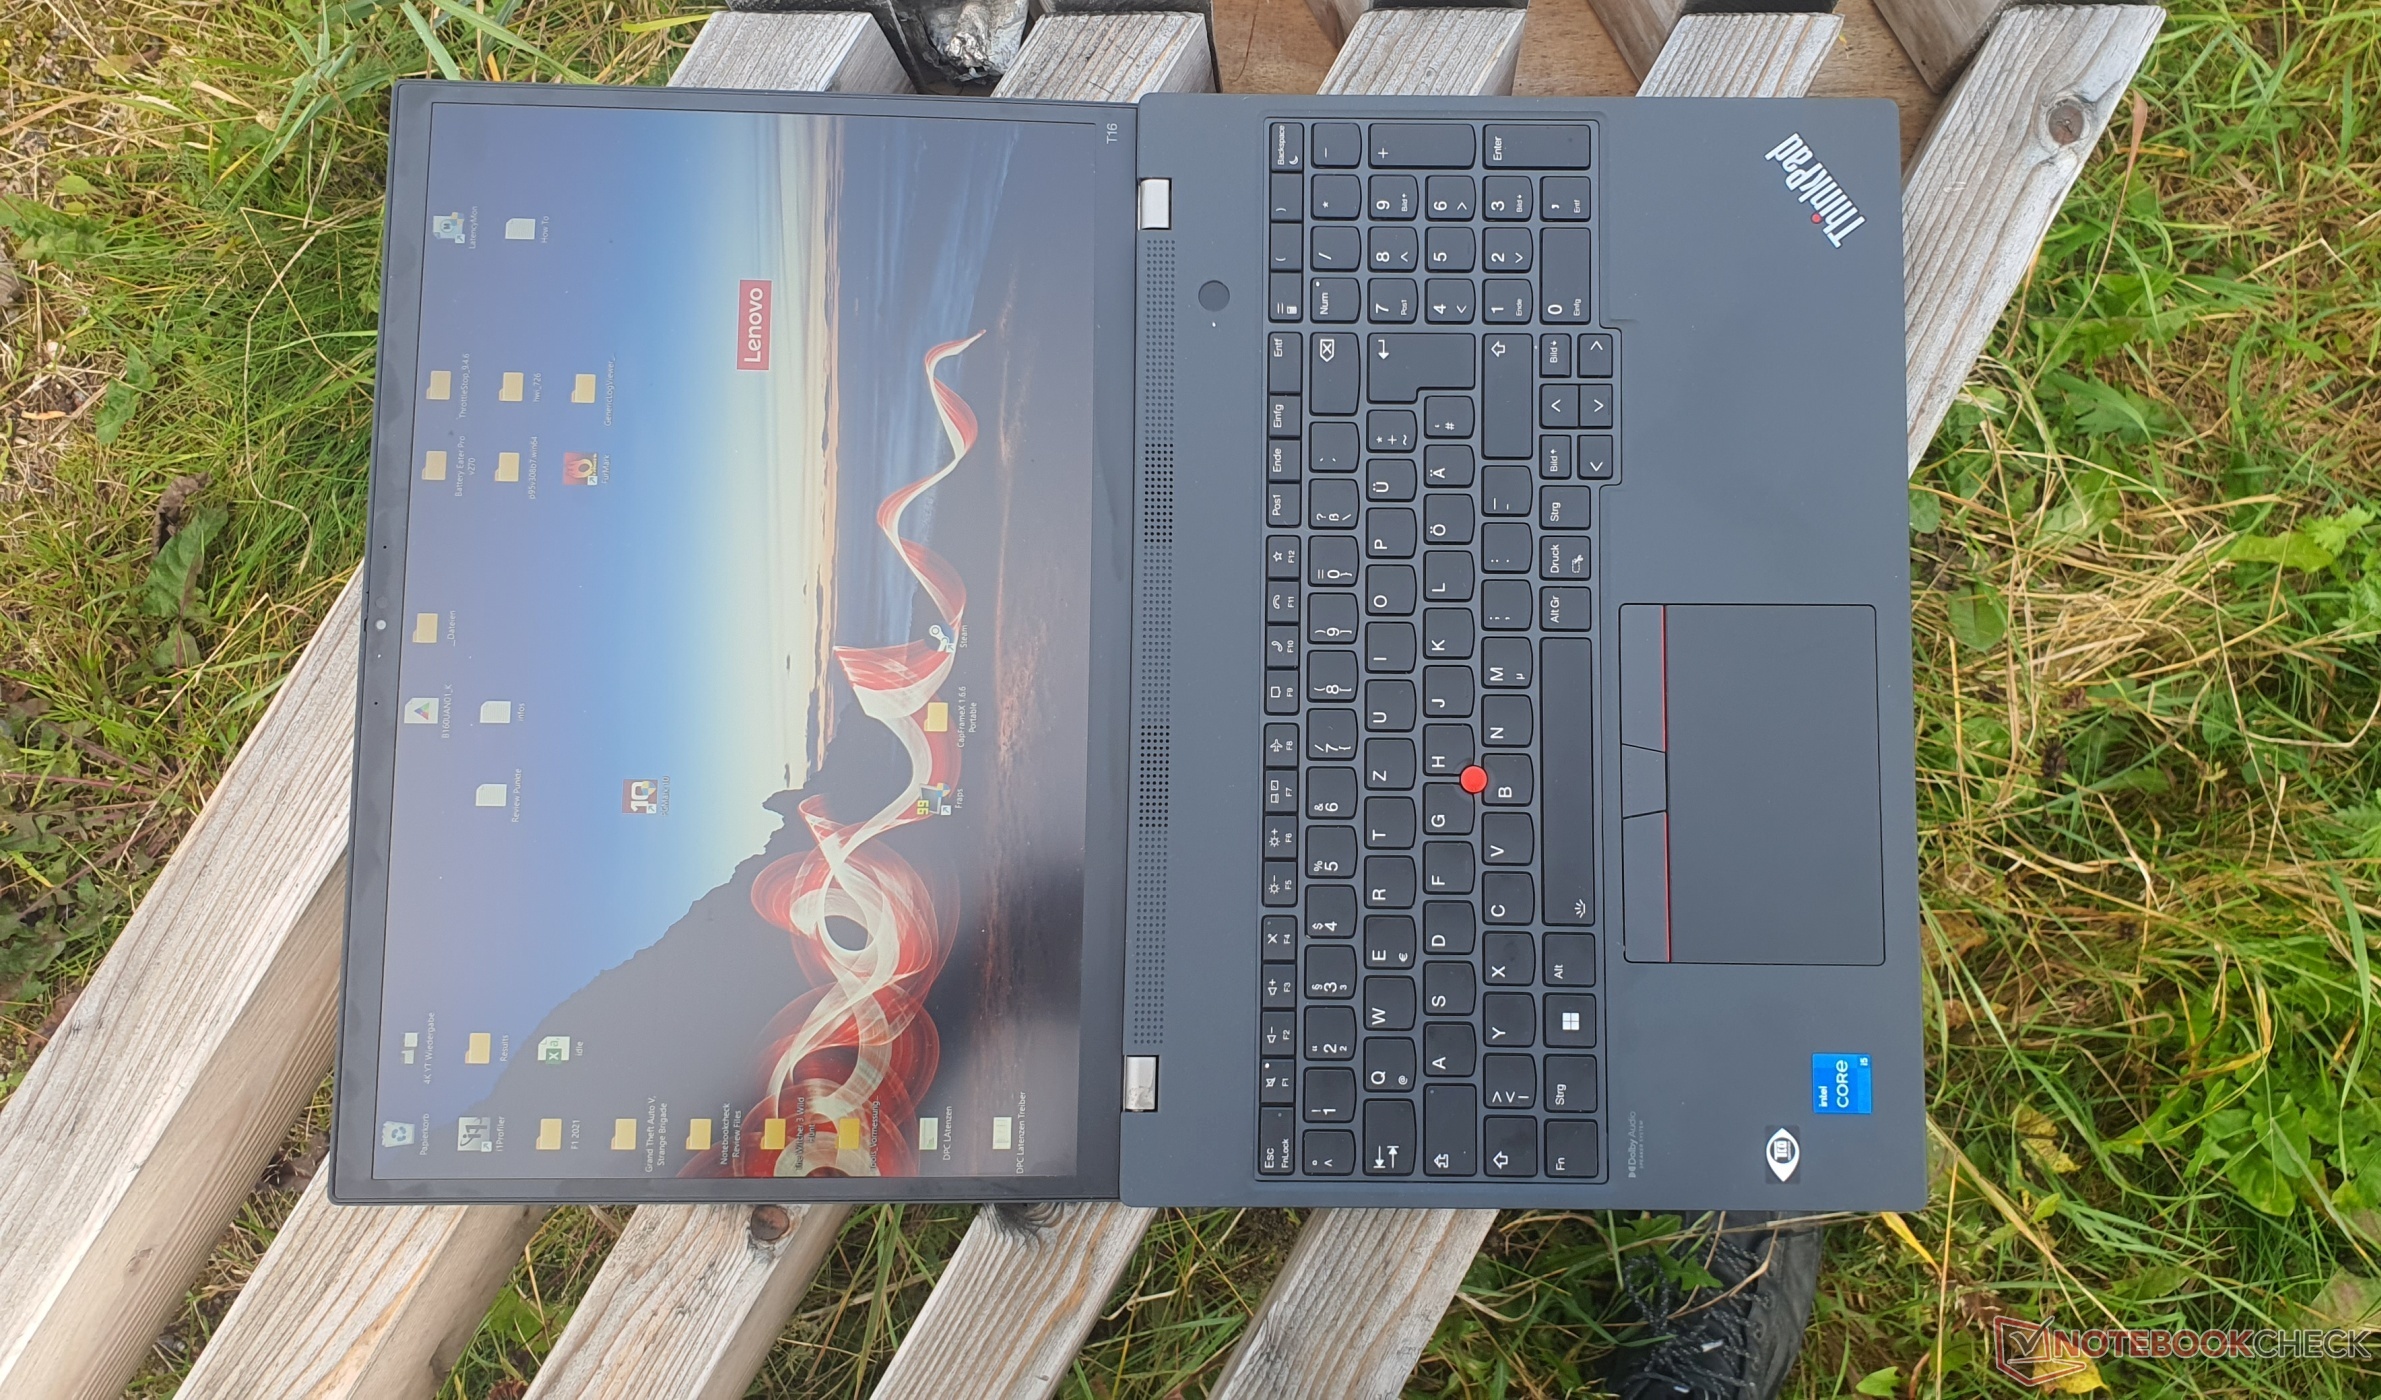
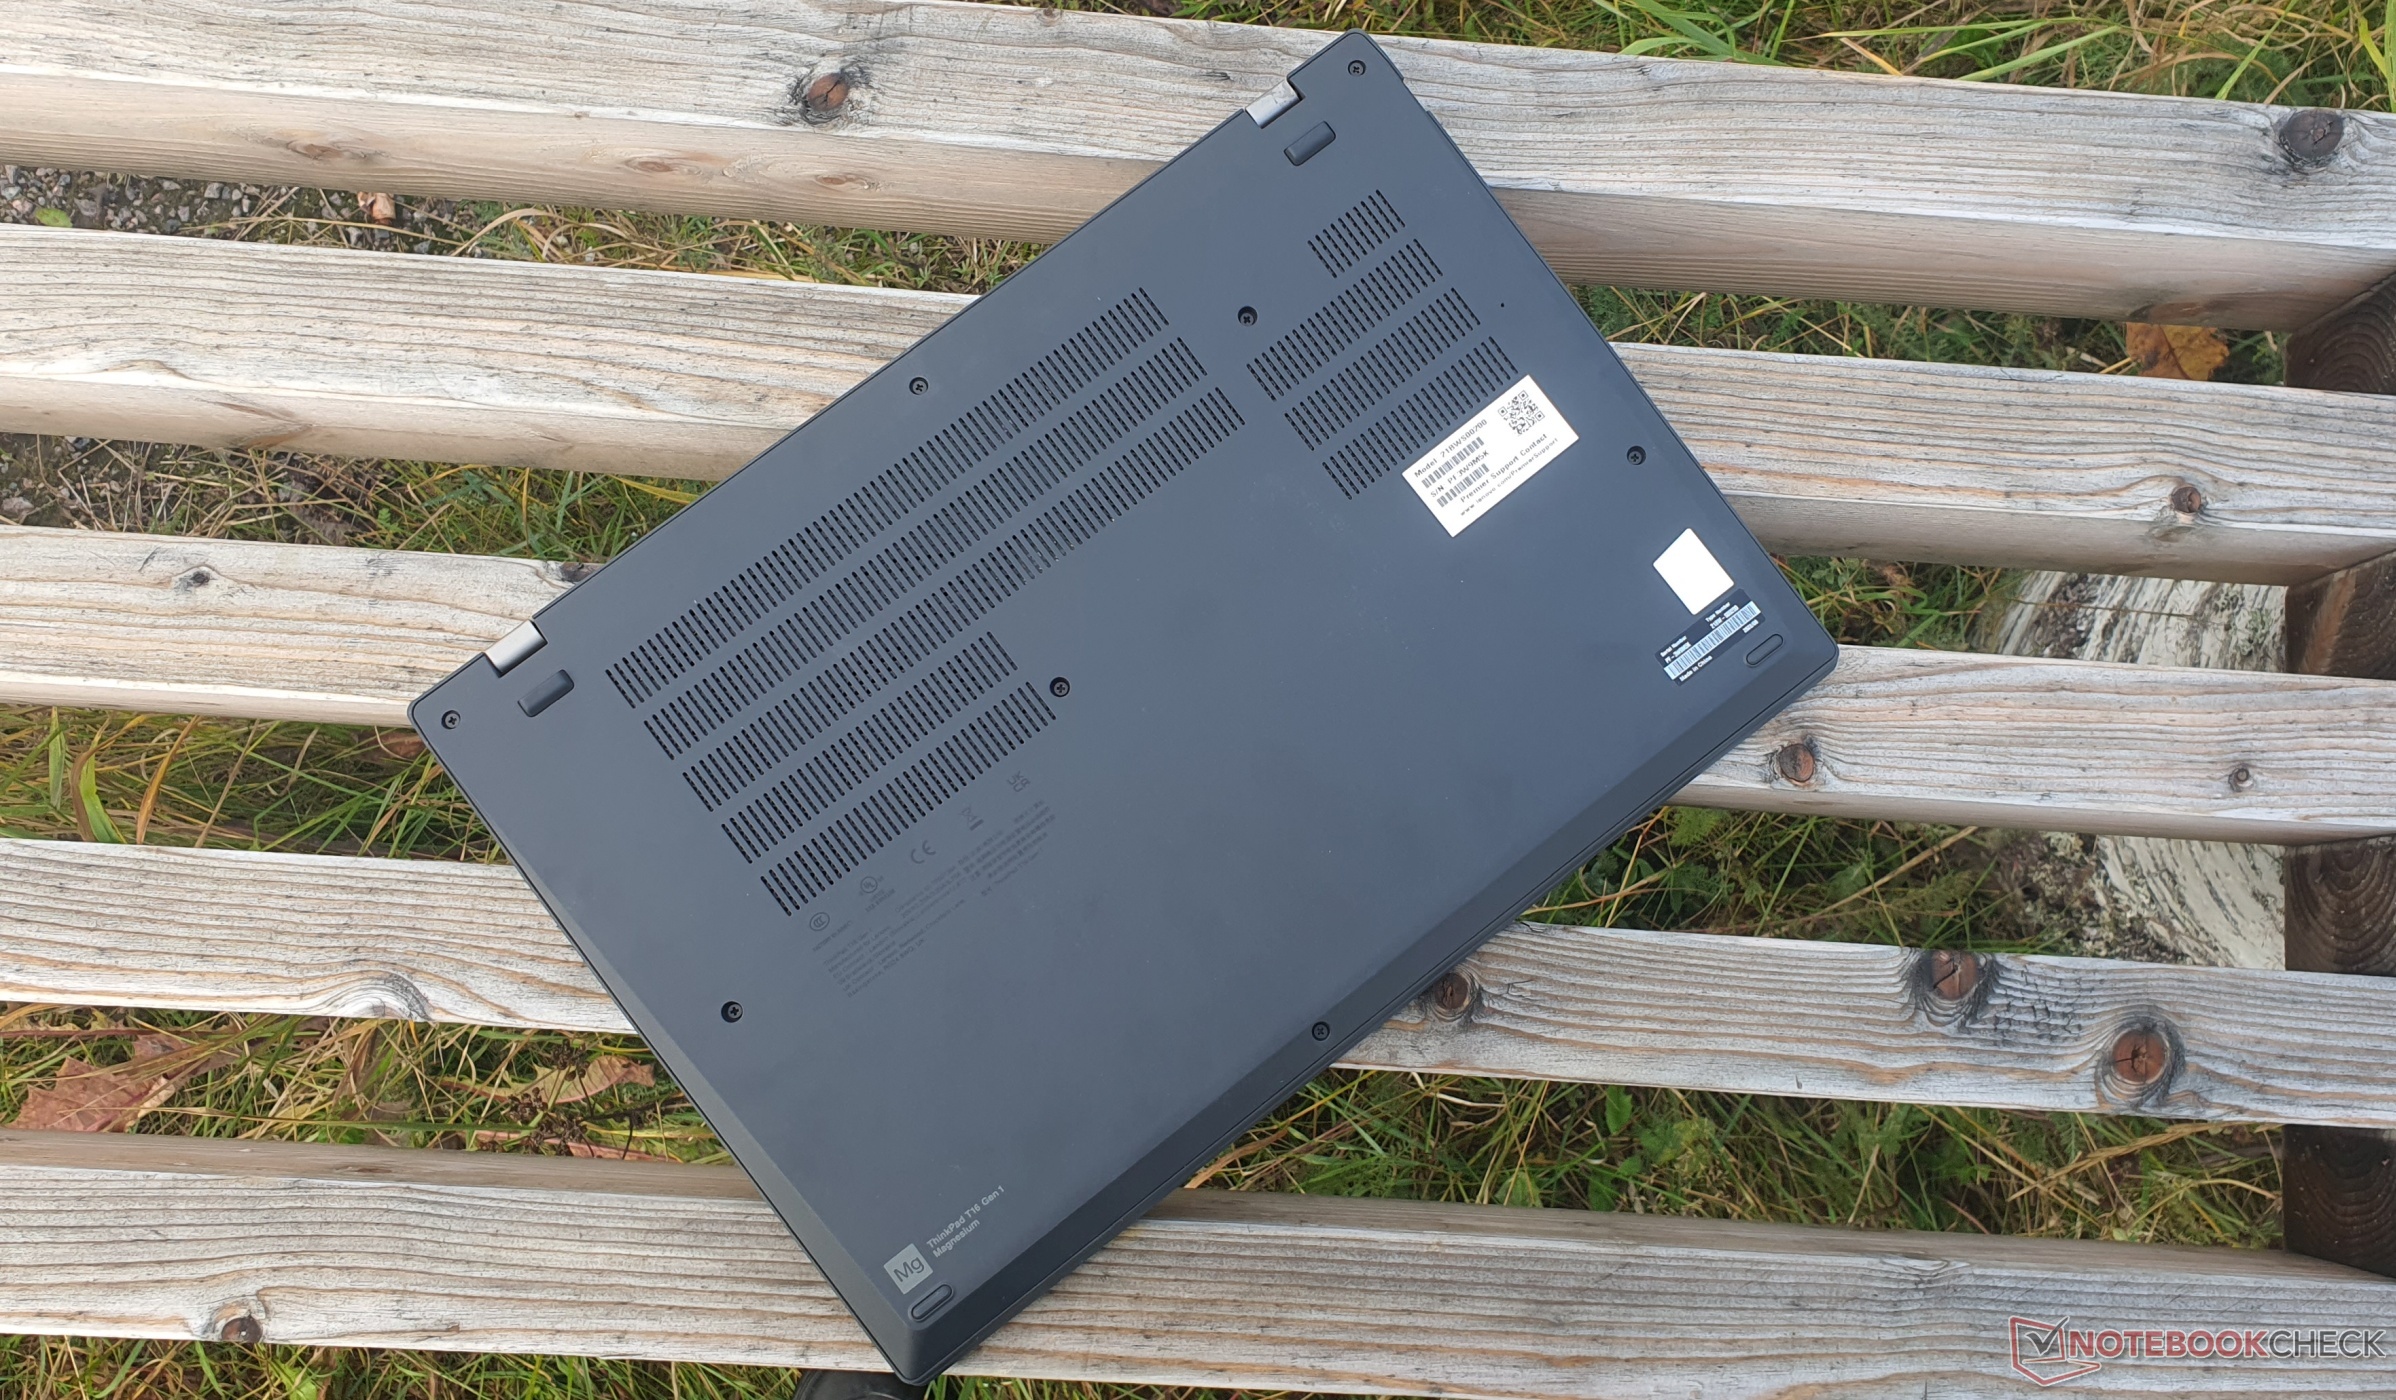
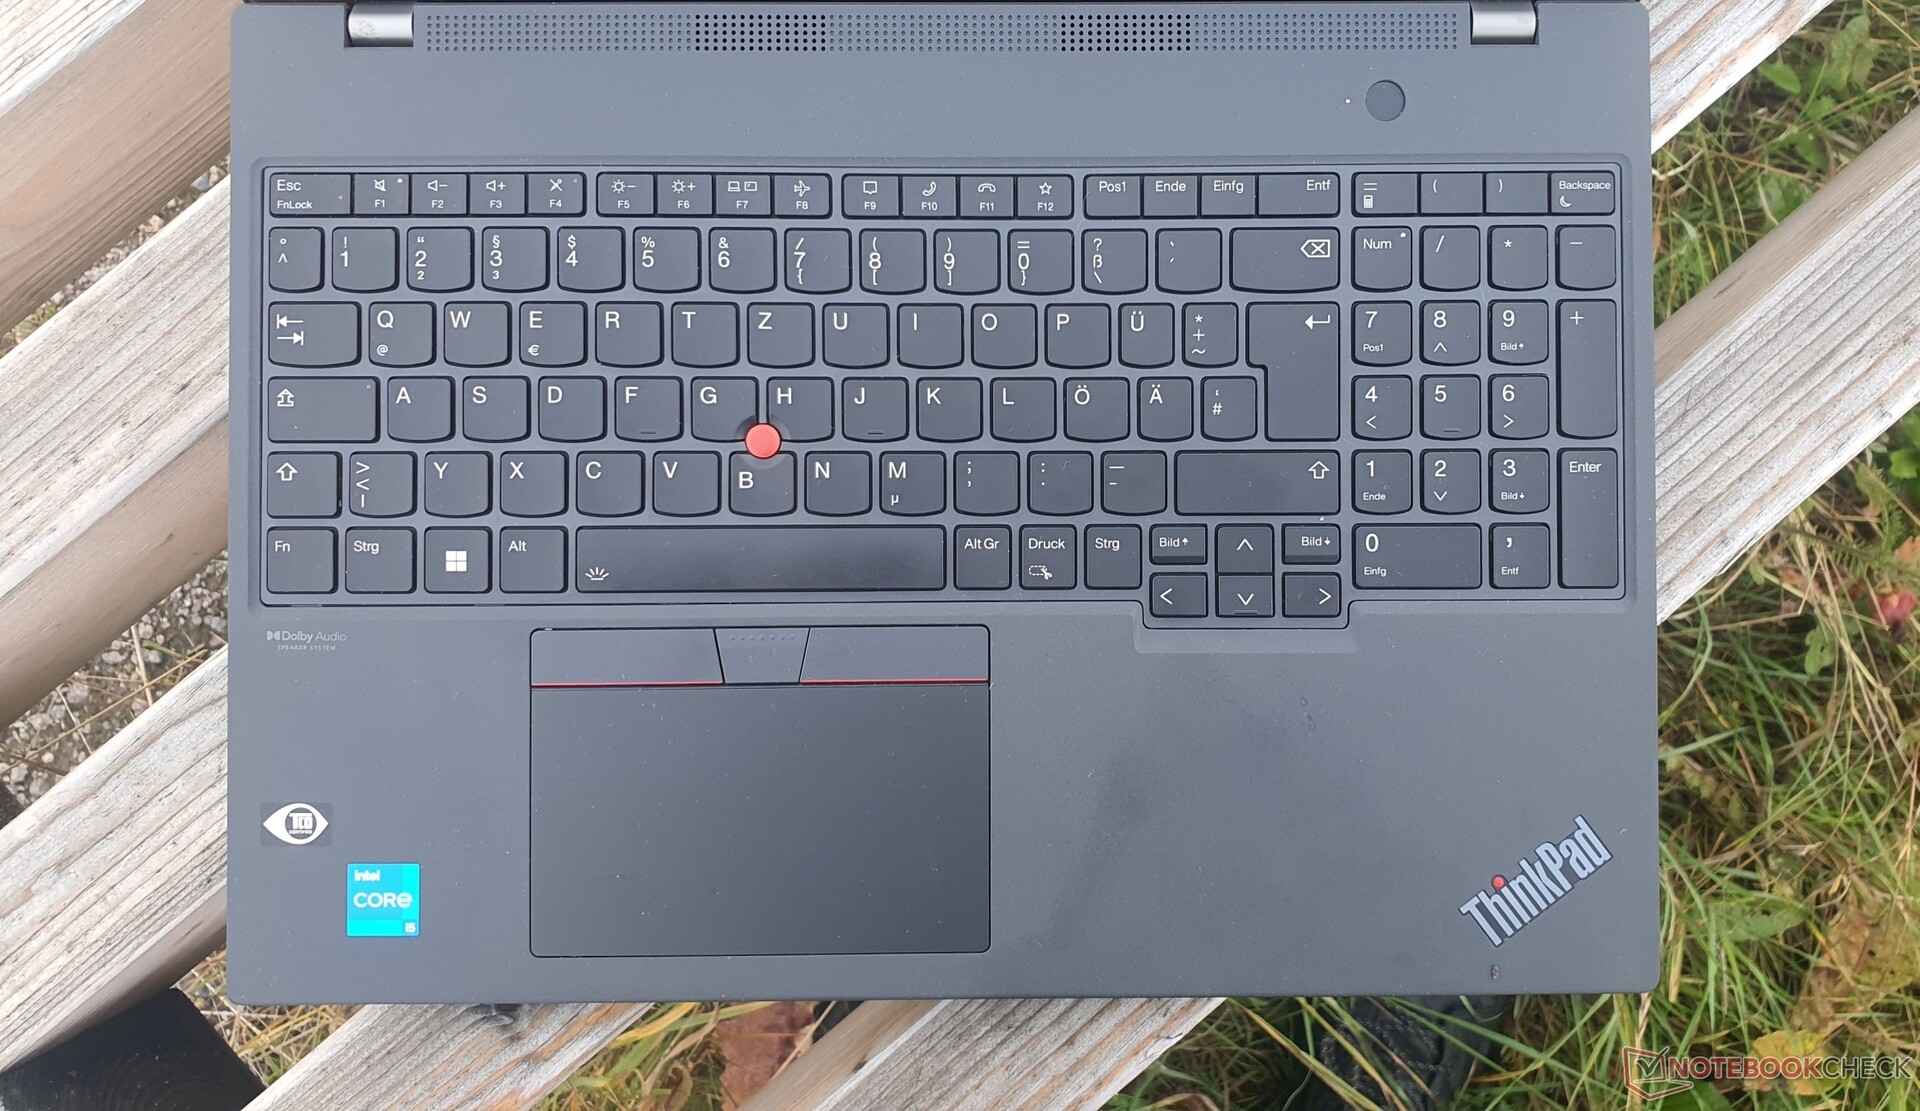
The ThinkPad T16 is anthracite in color, similar to the T14s G2. The slightly roughened, rubberized surfaces are also the same and have a very high quality feel.
Fingerprints are visible, but much less so than before. The screen's edges are narrower due to the 16:10 format, while the rest of the design remains more or less the same. Yet the device is 1.4 mm thicker, a little shorter, but also a little deeper. Our model weighs 1.95 kg, which is mostly due to the selected battery capacity.
The workmanship, free from gaps, is outstanding, as is the stability. The lid can hardly be twisted, and targeted pressure on the back lid does not result in any image distortions. No wonder, since the lid is made out of a mix of carbon fiber, fiberglass and plastic. Carbon fiber was previously and exclusively reserved for the more expensive models with the s-suffix.
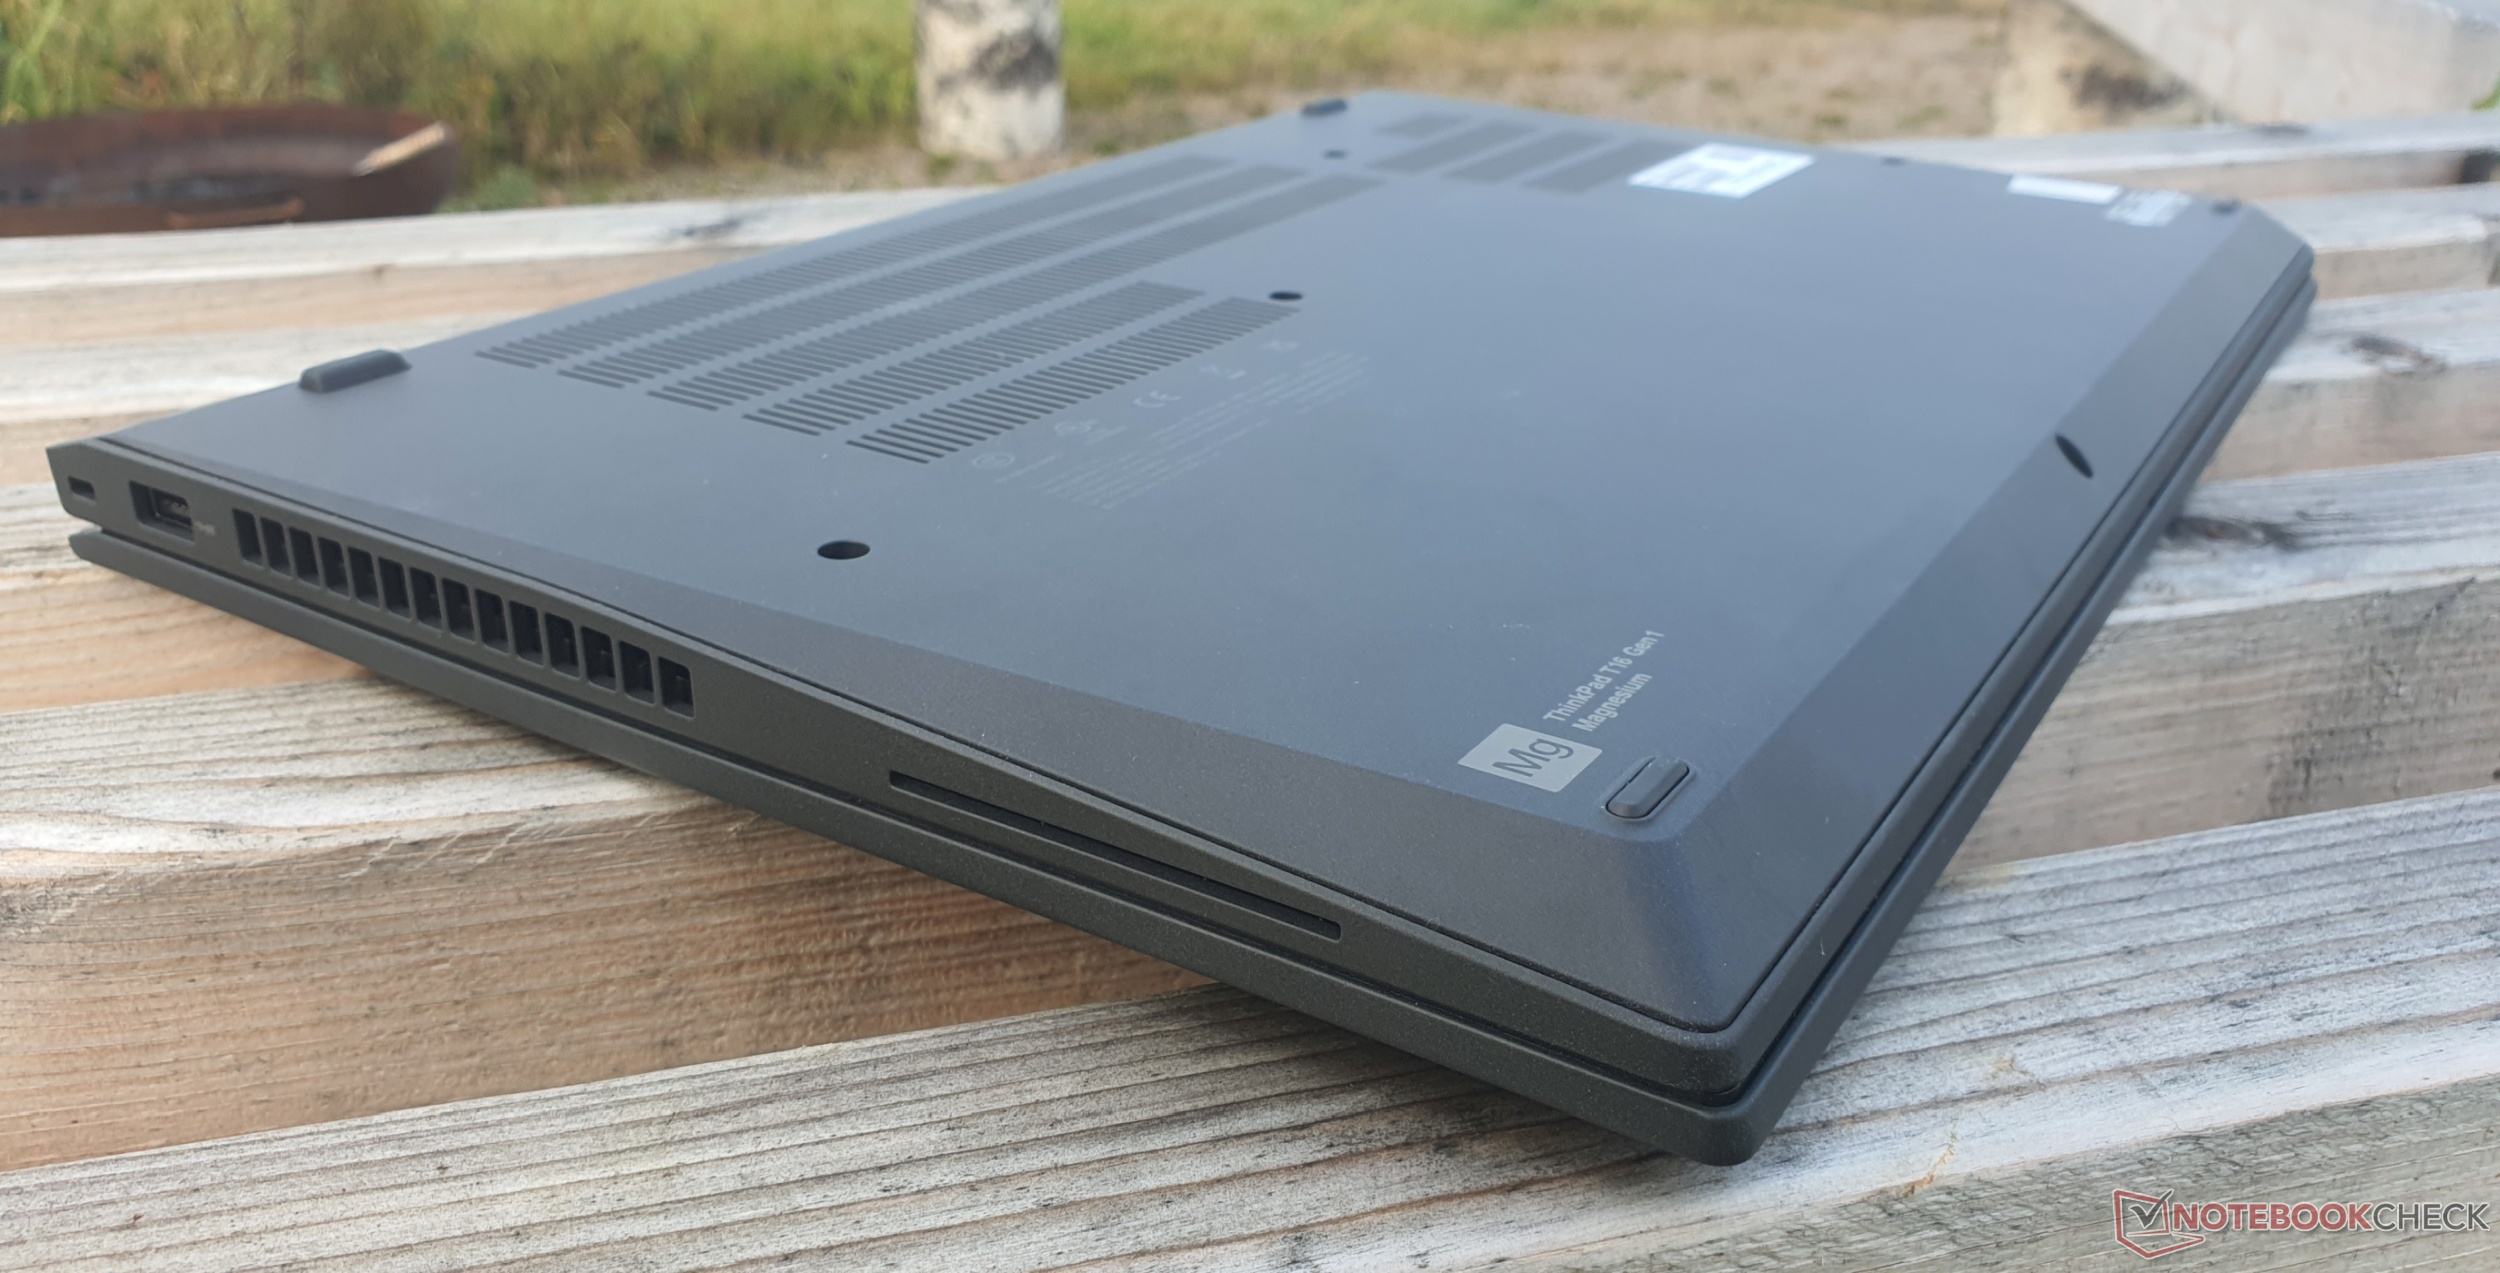
The palm rest is made out of a combination of plastic, fiberglass, magnesium and aluminum. The base thus proves to be very stubborn against torsional stress. The underside is made entirely out of thermoplastic. The robust hinges are tight, but one-handed opening up to 180° is still possible.

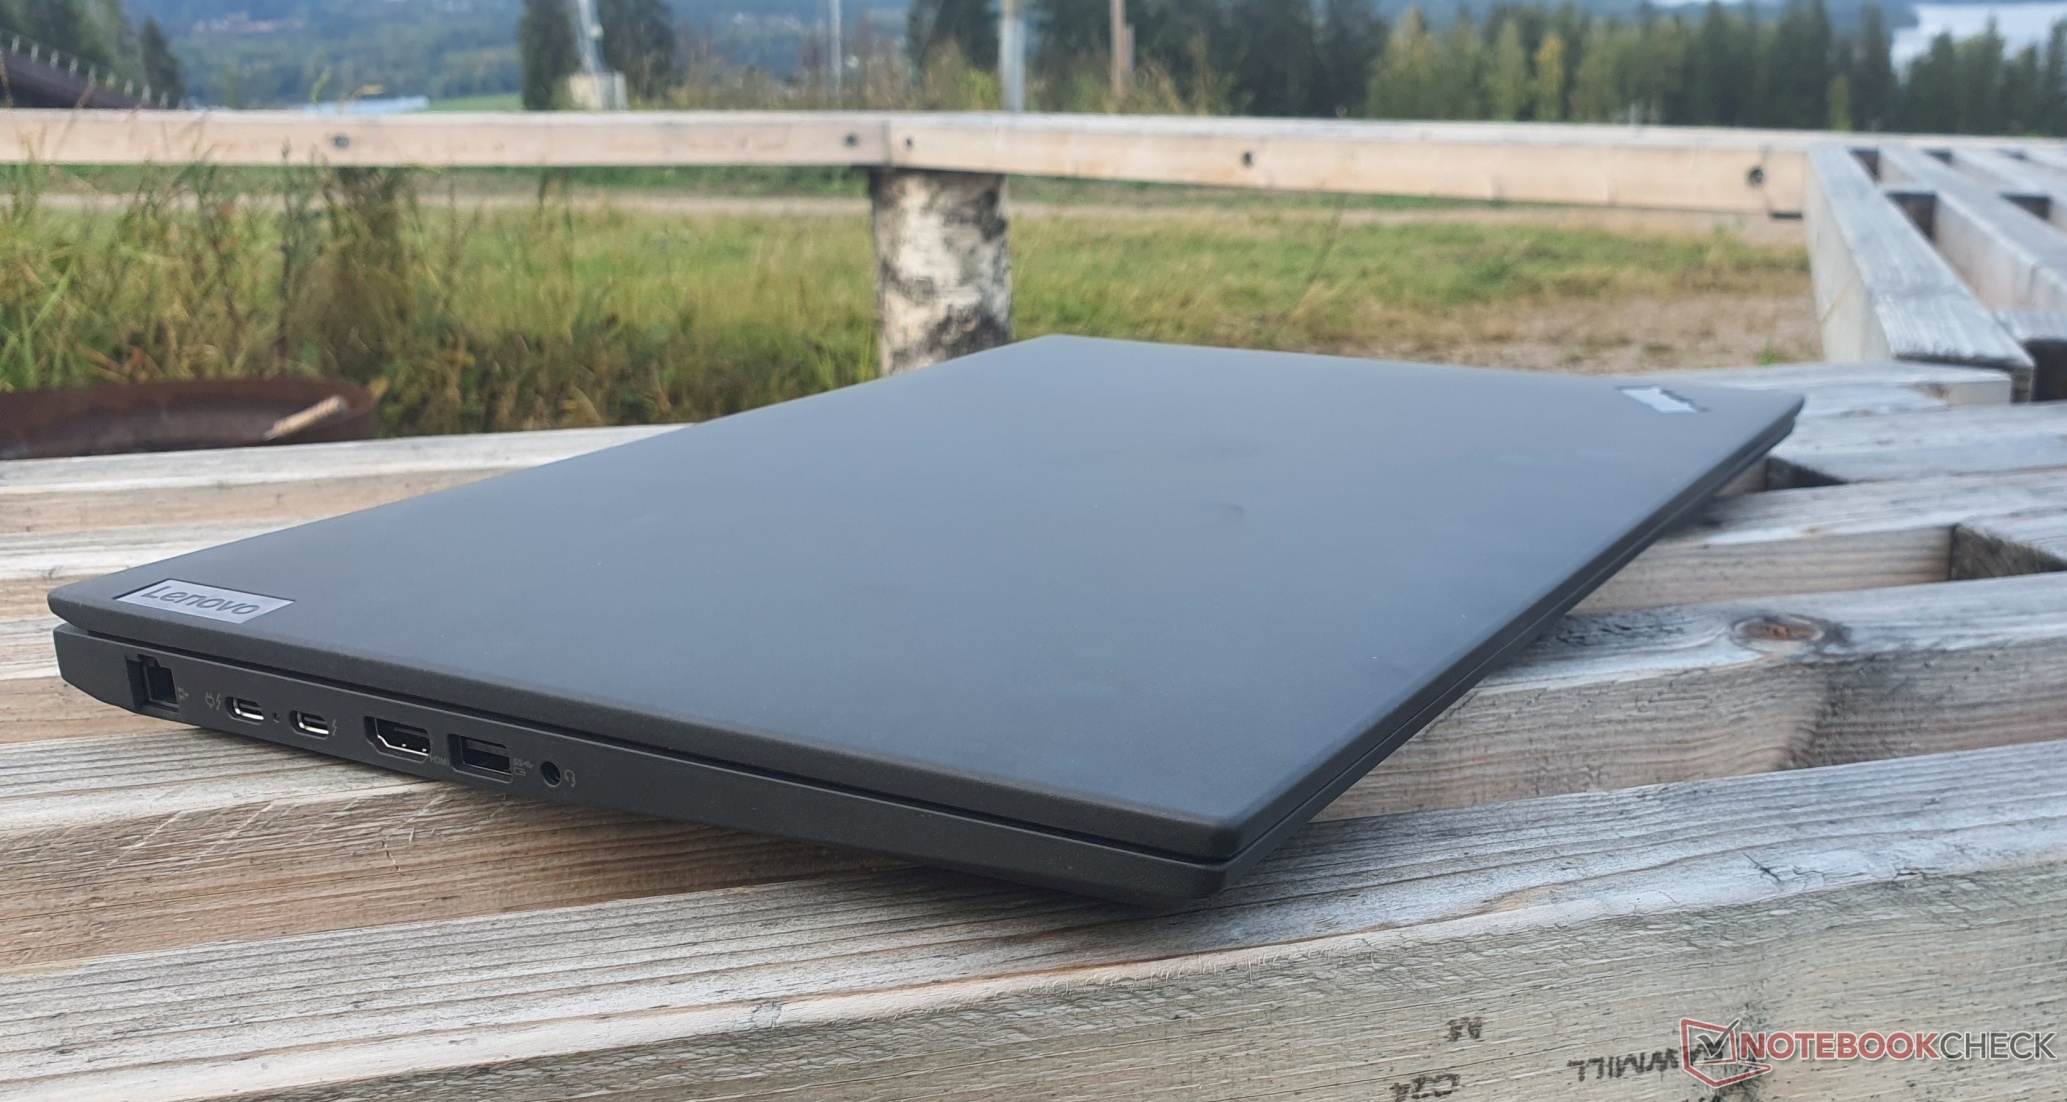

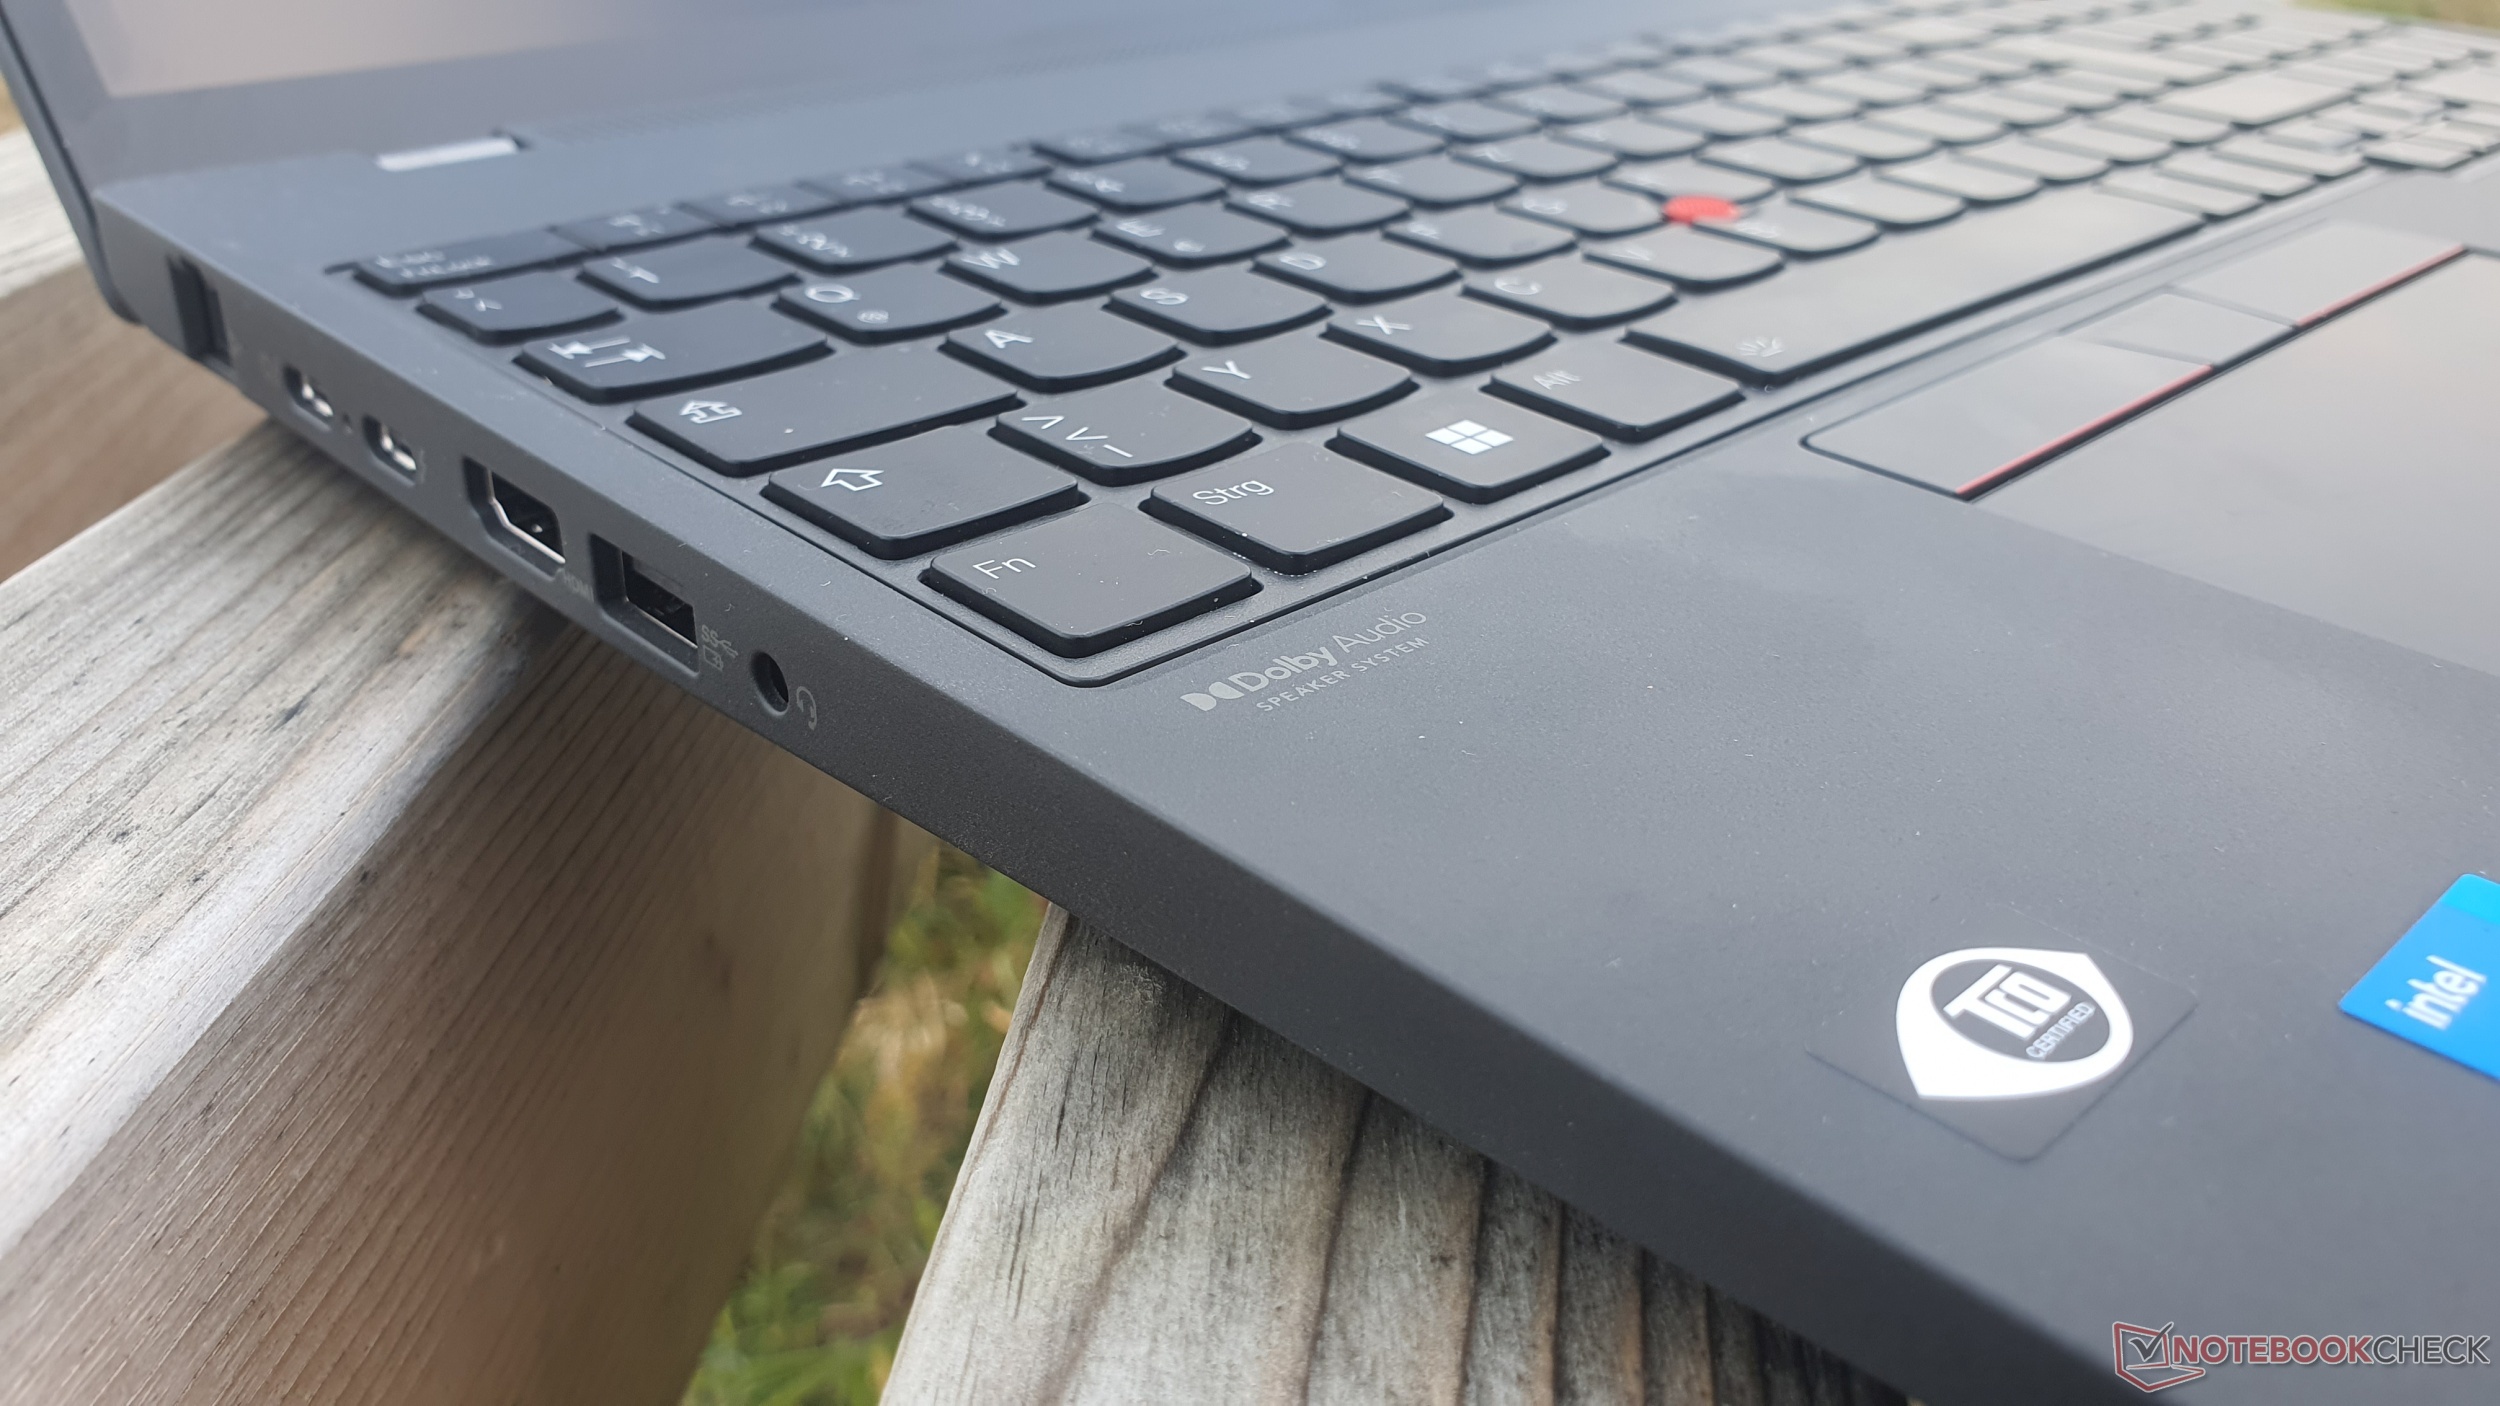
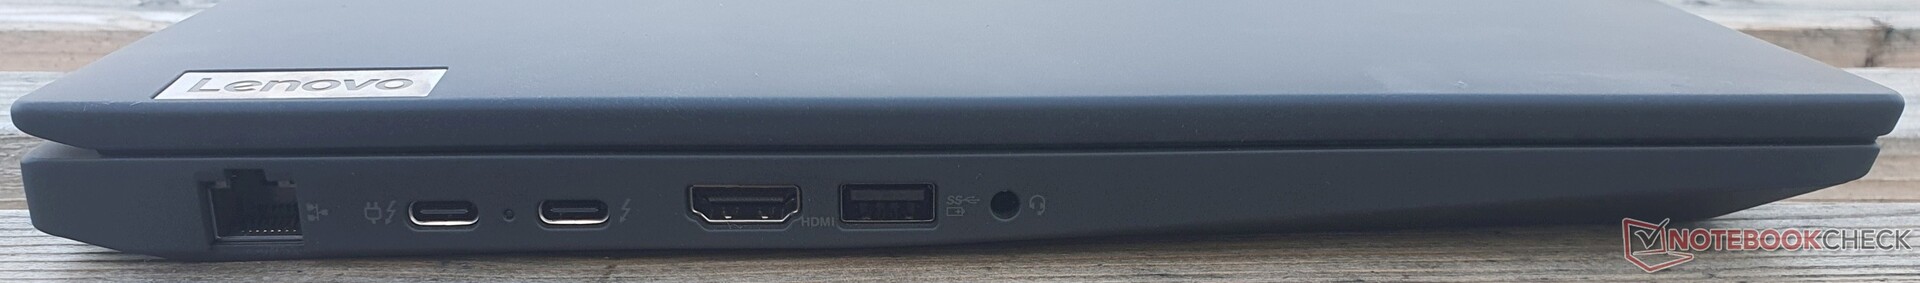
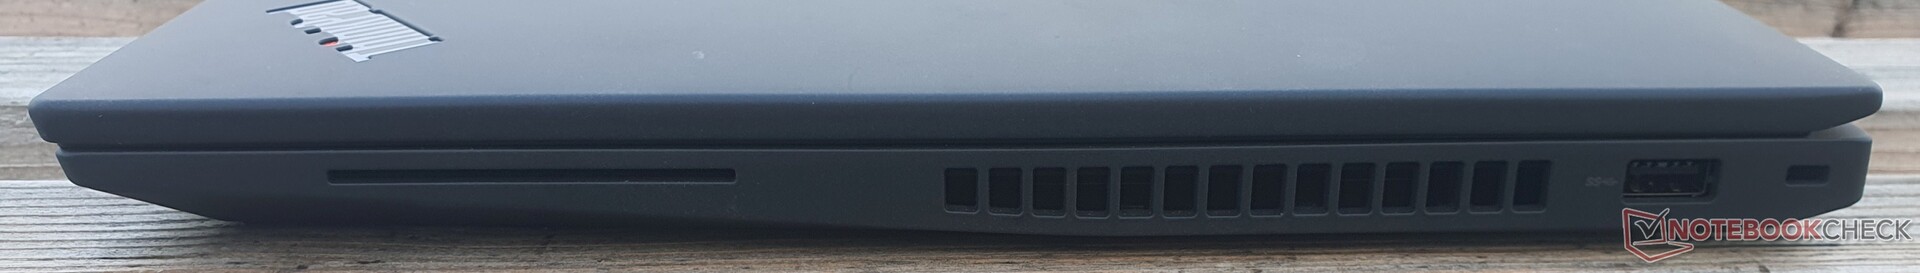
Equipment - RJ45, TB4, soldered Wi-Fi 6E and 1080p cam
The continued use of a GBit LAN port is pleasing, but the omission of the microSD card reader in the T-series is less so. Otherwise, the ThinkPad offers everything you need with 2x USB-A 3.2 Gen 1, HDMI 2.0b and 2x Thunderbolt 4, including 100 watt charging and DisplayPort 1.4. This means that up to three additional monitors can be connected: 2x 5K60 @TB4 + 1x 4K60 @HDMI.
Communication
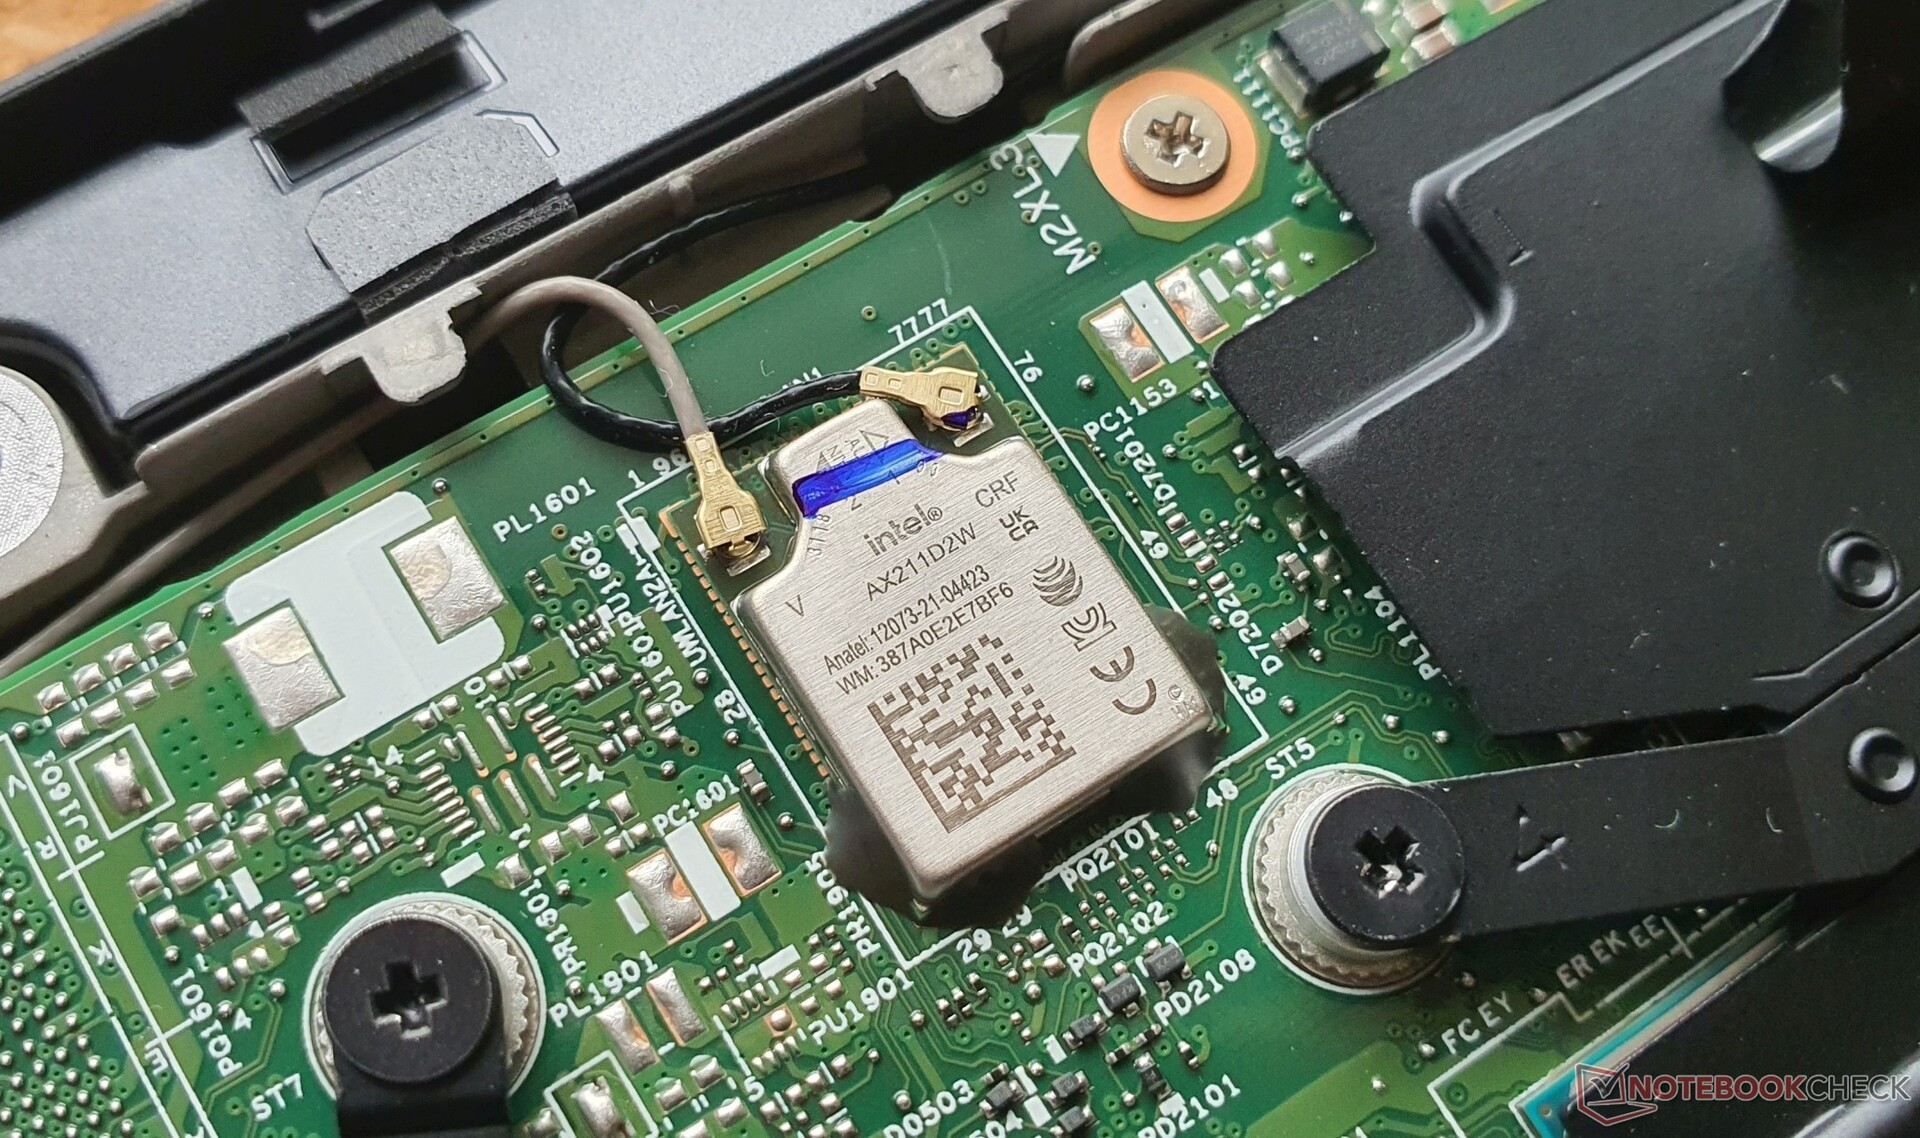
Intel's soldered AX211 is responsible for Wi-Fi 6E. We registered exemplary speeds of over 1.6 GBit/s in both directions, so that our comparison field is easily led by the Lenovo ThinkPad T16 G1.
Bluetooth 5.2 and optional WWAN with 4G are also available. In our review sample, there is a free M.2 2242 slot, and the antennas can be upgraded. NFC is optional.
| Networking | |
| Lenovo ThinkPad T16 G1 21BWS00200 | |
| iperf3 transmit AXE11000 6GHz | |
| iperf3 receive AXE11000 6GHz | |
| Huawei MateBook D 16 2022 | |
| iperf3 receive AXE11000 | |
| iperf3 transmit AXE11000 | |
| Lenovo ThinkPad T15 Gen2-20W5S00100 | |
| iperf3 transmit AX12 | |
| iperf3 receive AX12 | |
| HP ZBook Power 15 G8 313S5EA | |
| iperf3 transmit AX12 | |
| iperf3 receive AX12 | |
| HP ProBook 450 G9 6A180EA | |
| iperf3 transmit AXE11000 6GHz | |
| iperf3 receive AXE11000 6GHz | |
| Lenovo ThinkPad X1 Extreme G4-20Y5CTO1WW (3050 Ti) | |
| iperf3 transmit AX12 | |
| iperf3 receive AX12 | |
| Dell Inspiron 16 Plus 7620 | |
| iperf3 transmit AXE11000 6GHz | |
| iperf3 receive AXE11000 6GHz | |
| Lenovo ThinkPad E15 G3-20YG003UGE | |
| iperf3 transmit AX12 | |
| iperf3 receive AX12 | |
| Lenovo ThinkPad L15 G2 AMD | |
| iperf3 transmit AX12 | |
| iperf3 receive AX12 | |
Webcam
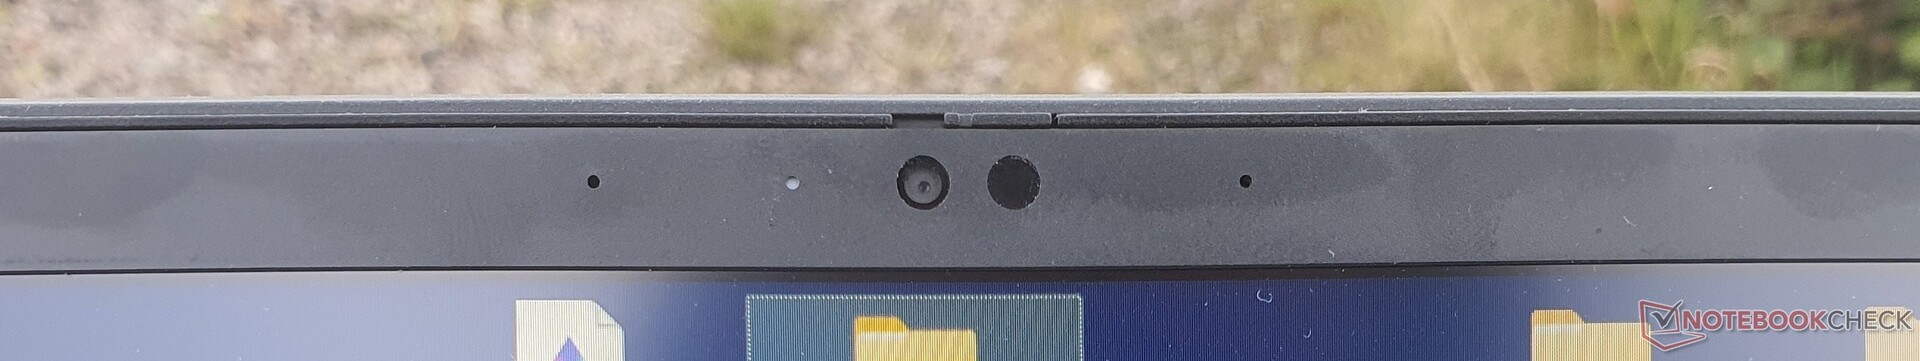
The 1080p webcam remains unimpressive, but is much less noisy and washed out. In addition, there are two dual-array microphones with good recording quality as well as IR for Windows Hello.


Security
For security, Lenovo offers an optional smart card reader, IR for Windows Hello, and a physical camera aperture in the ThinkPad T16 Gen. 1. Further security features include TPM 2.0, a Kensington lock and the optional fingerprint scanner. Human Presence Detection and Mirametrix Glance are used for the software.
Accessories
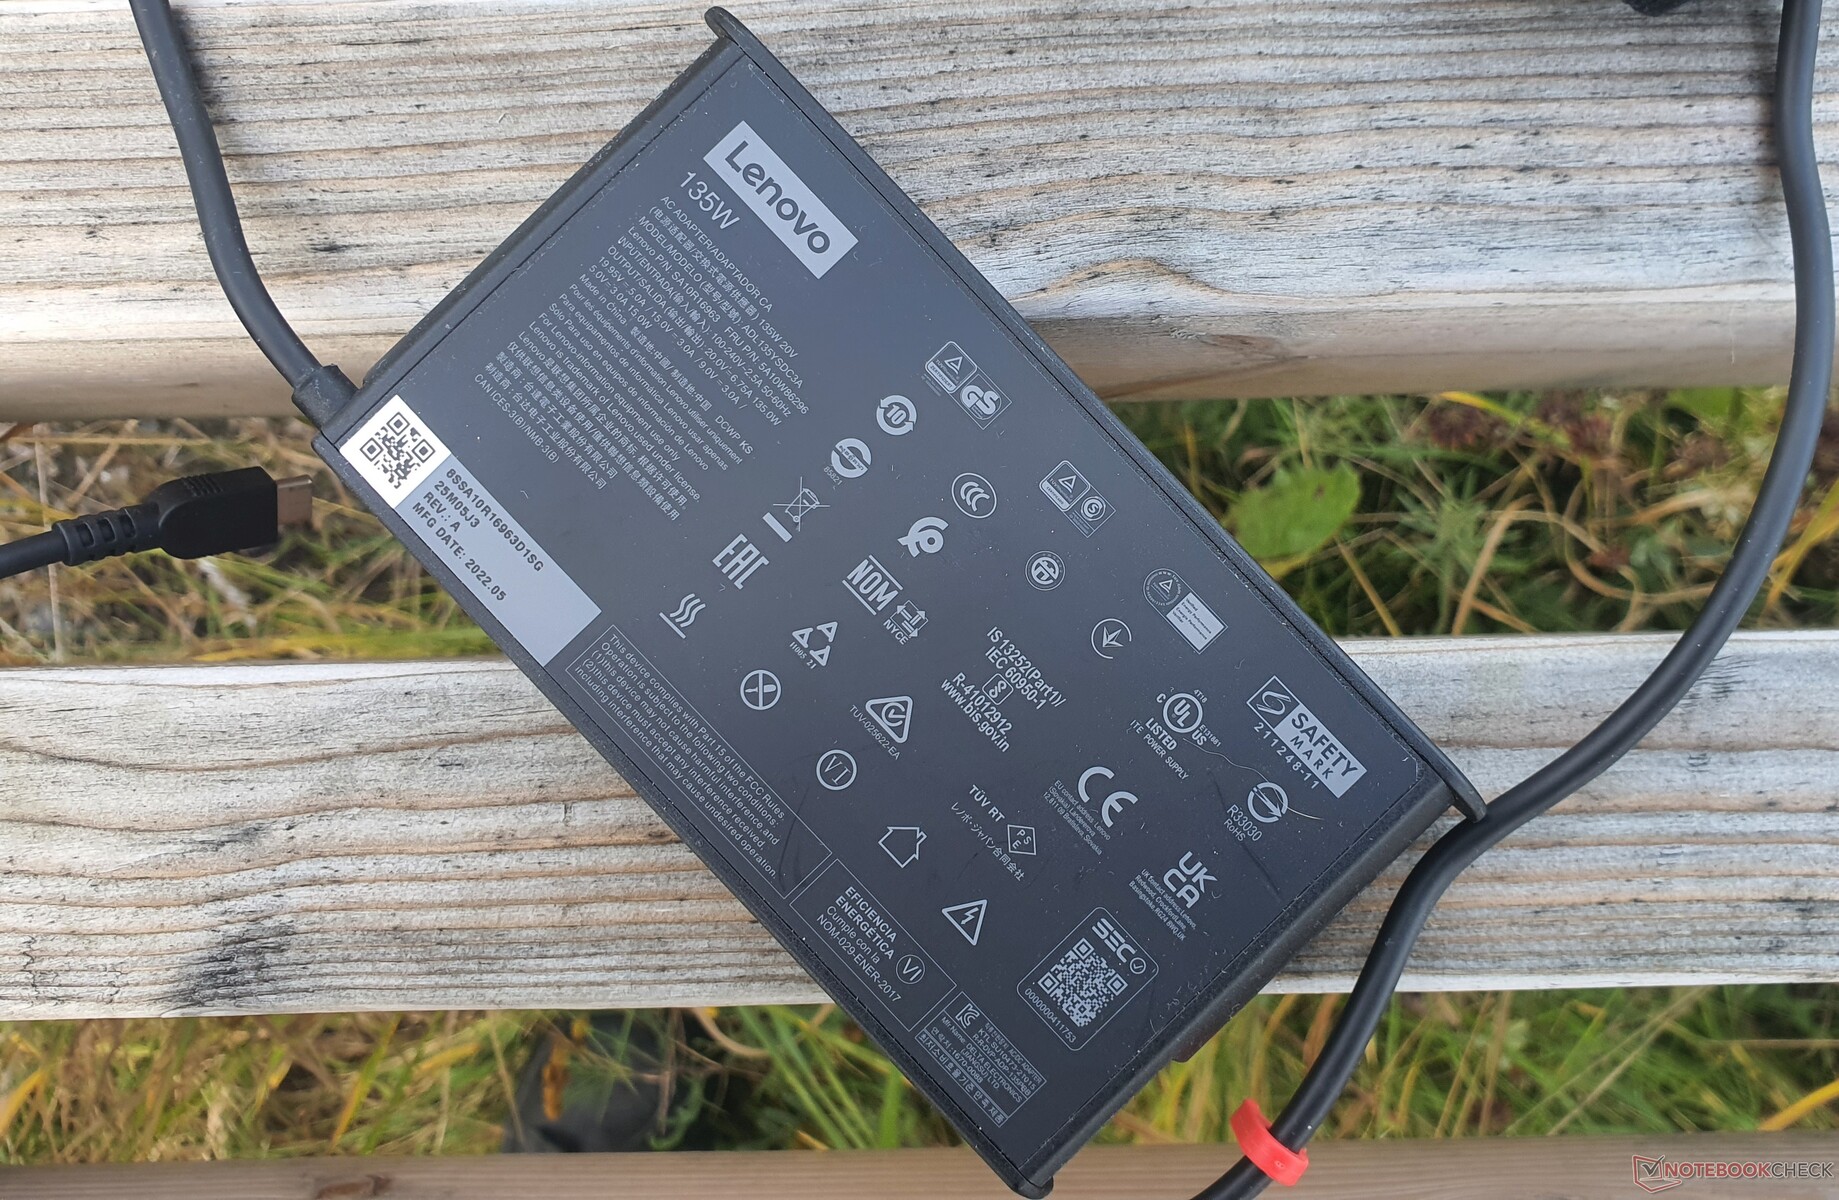
There is no docking port, but USB-C docks can be used. The scope of delivery includes only a 135-watt USB-C Slim charger. Models with U-series CPUs have to make do with 65 watts. On the other hand, using your own charger with 45 watts is also possible. The packaging is 90% recycled or made from sustainable wood.
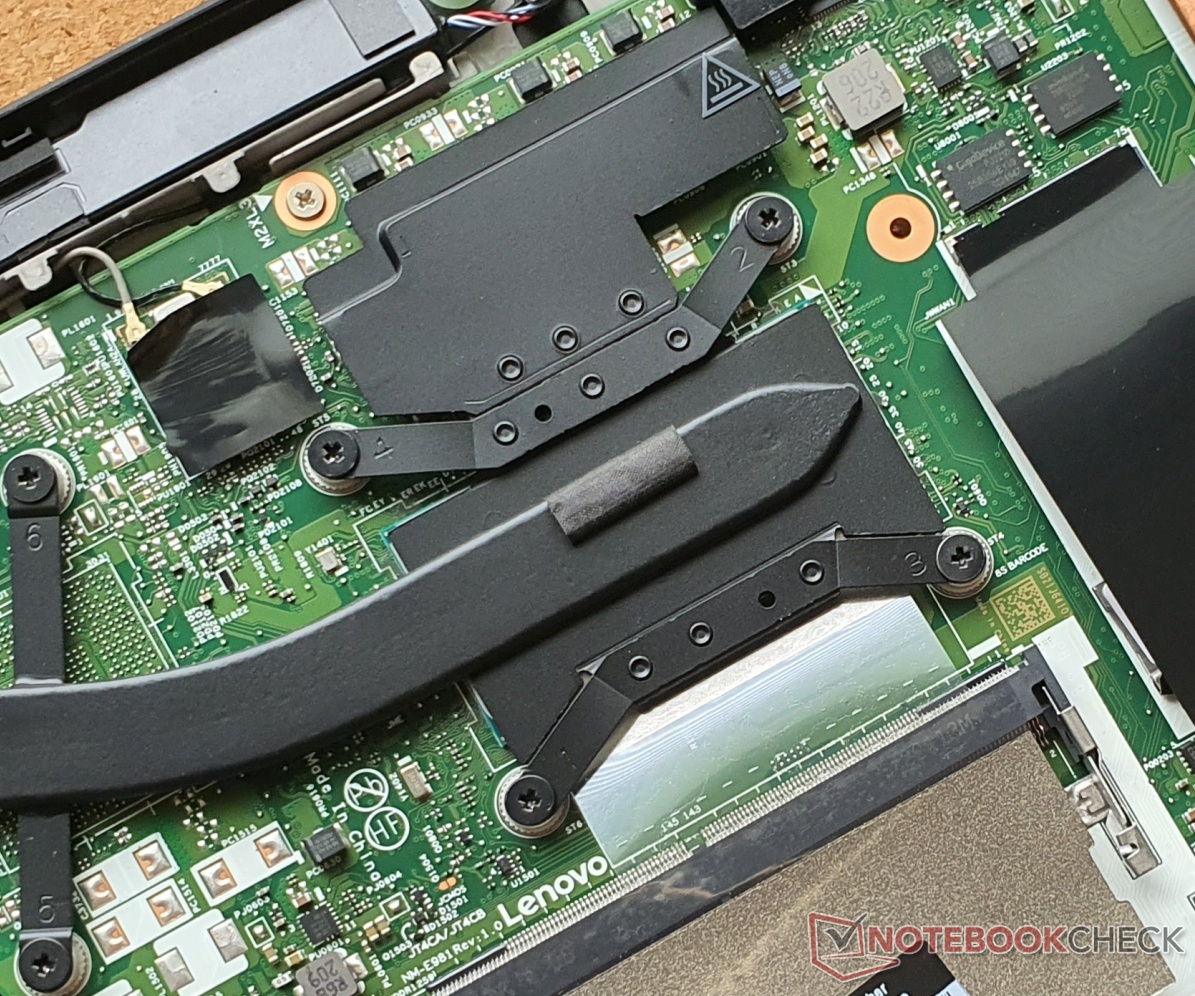
Maintenance
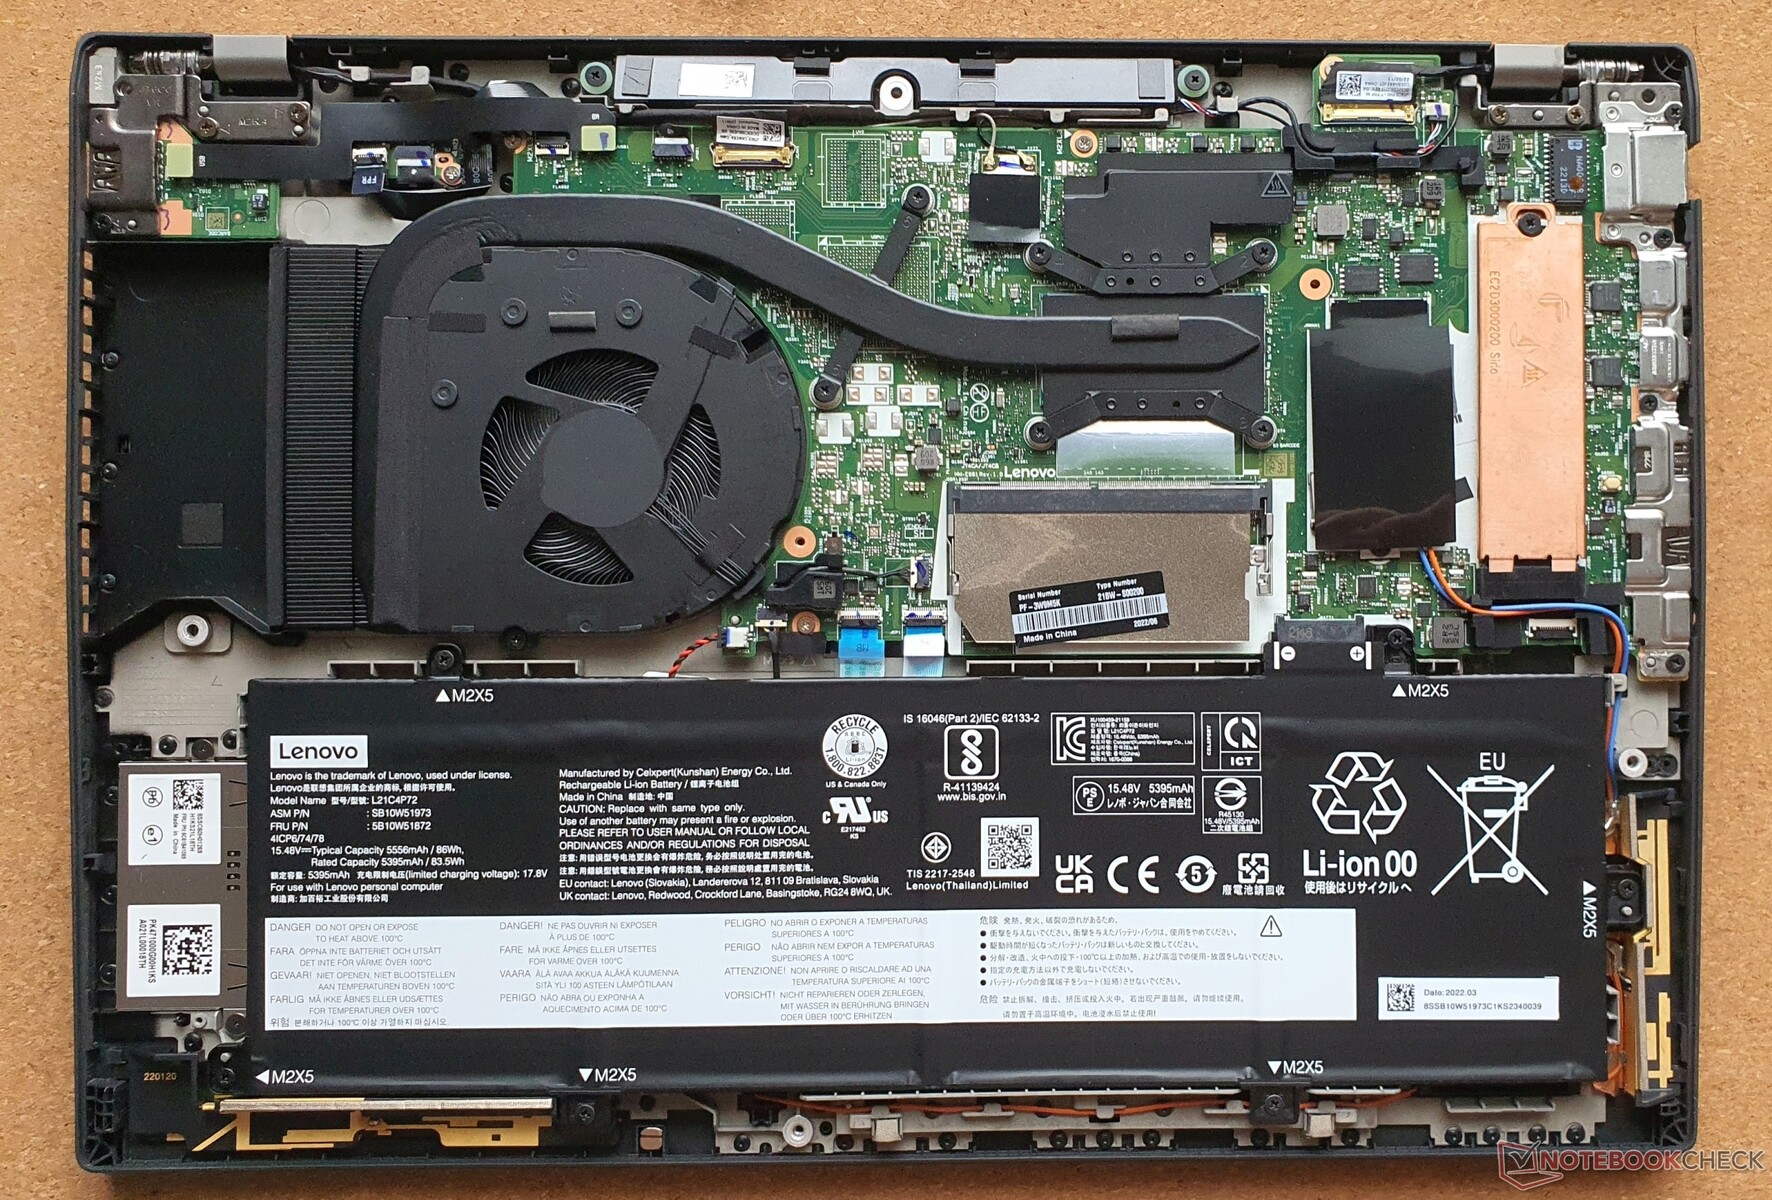
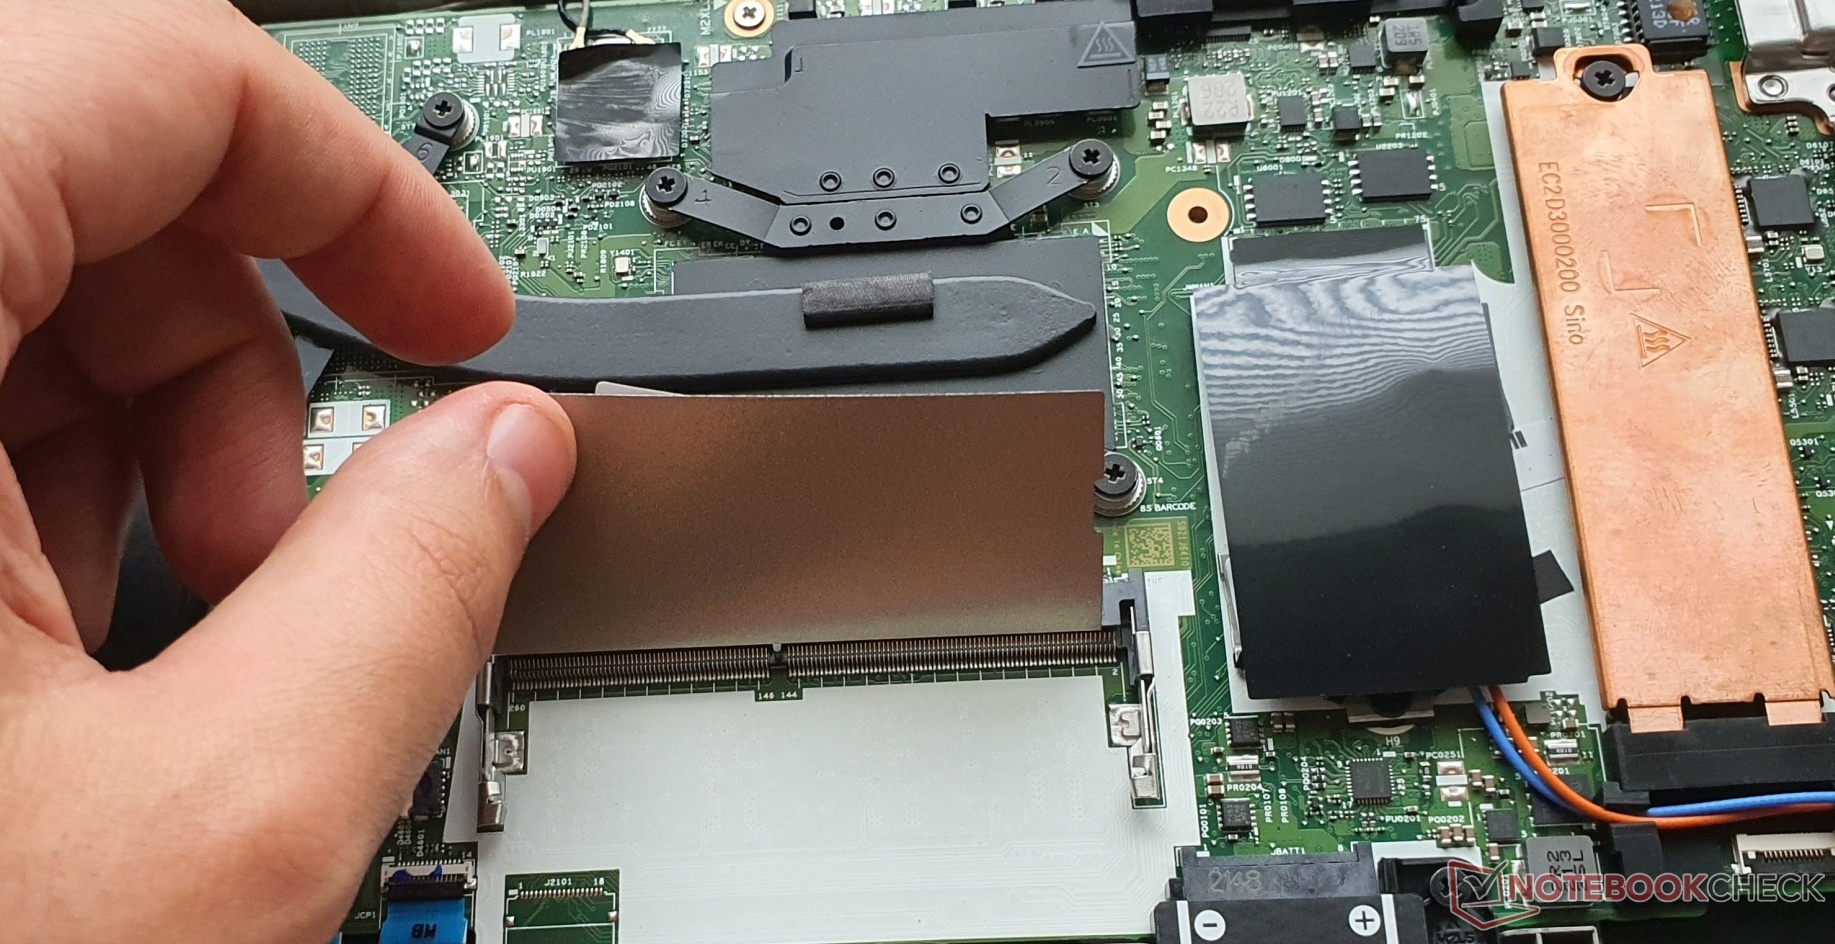
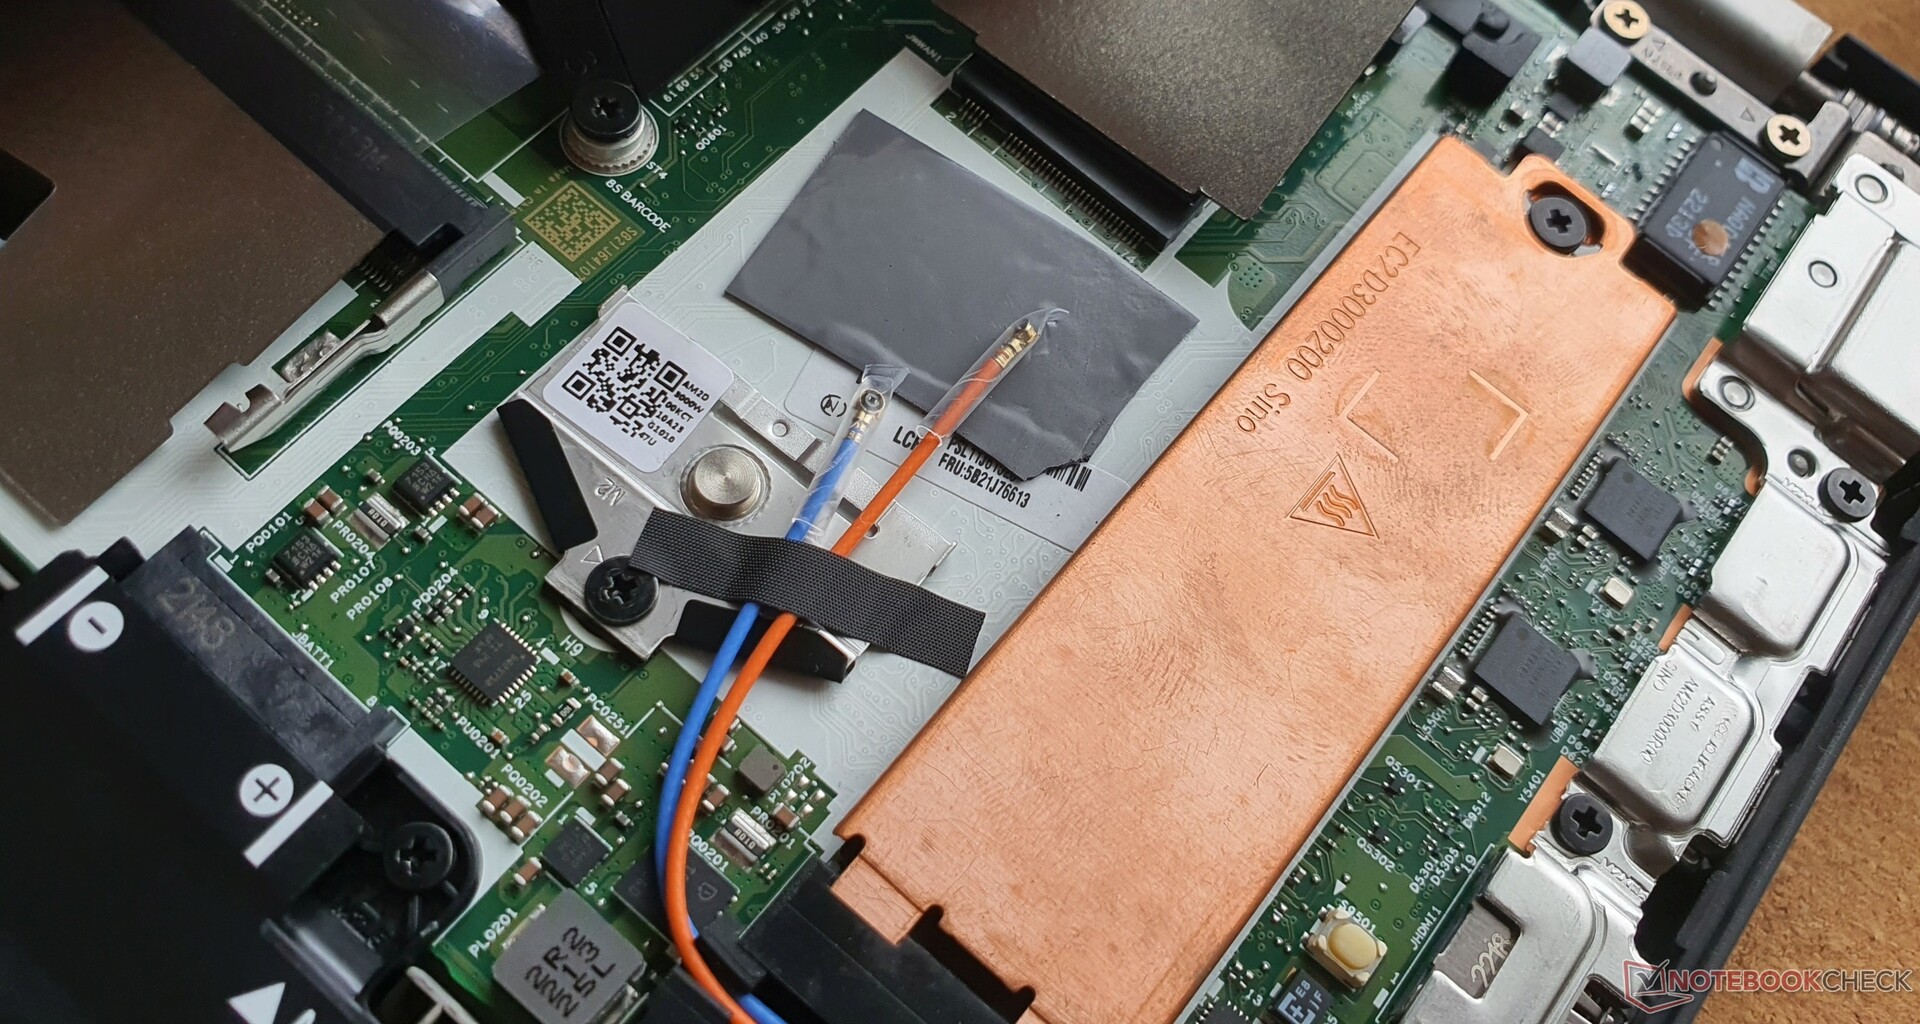
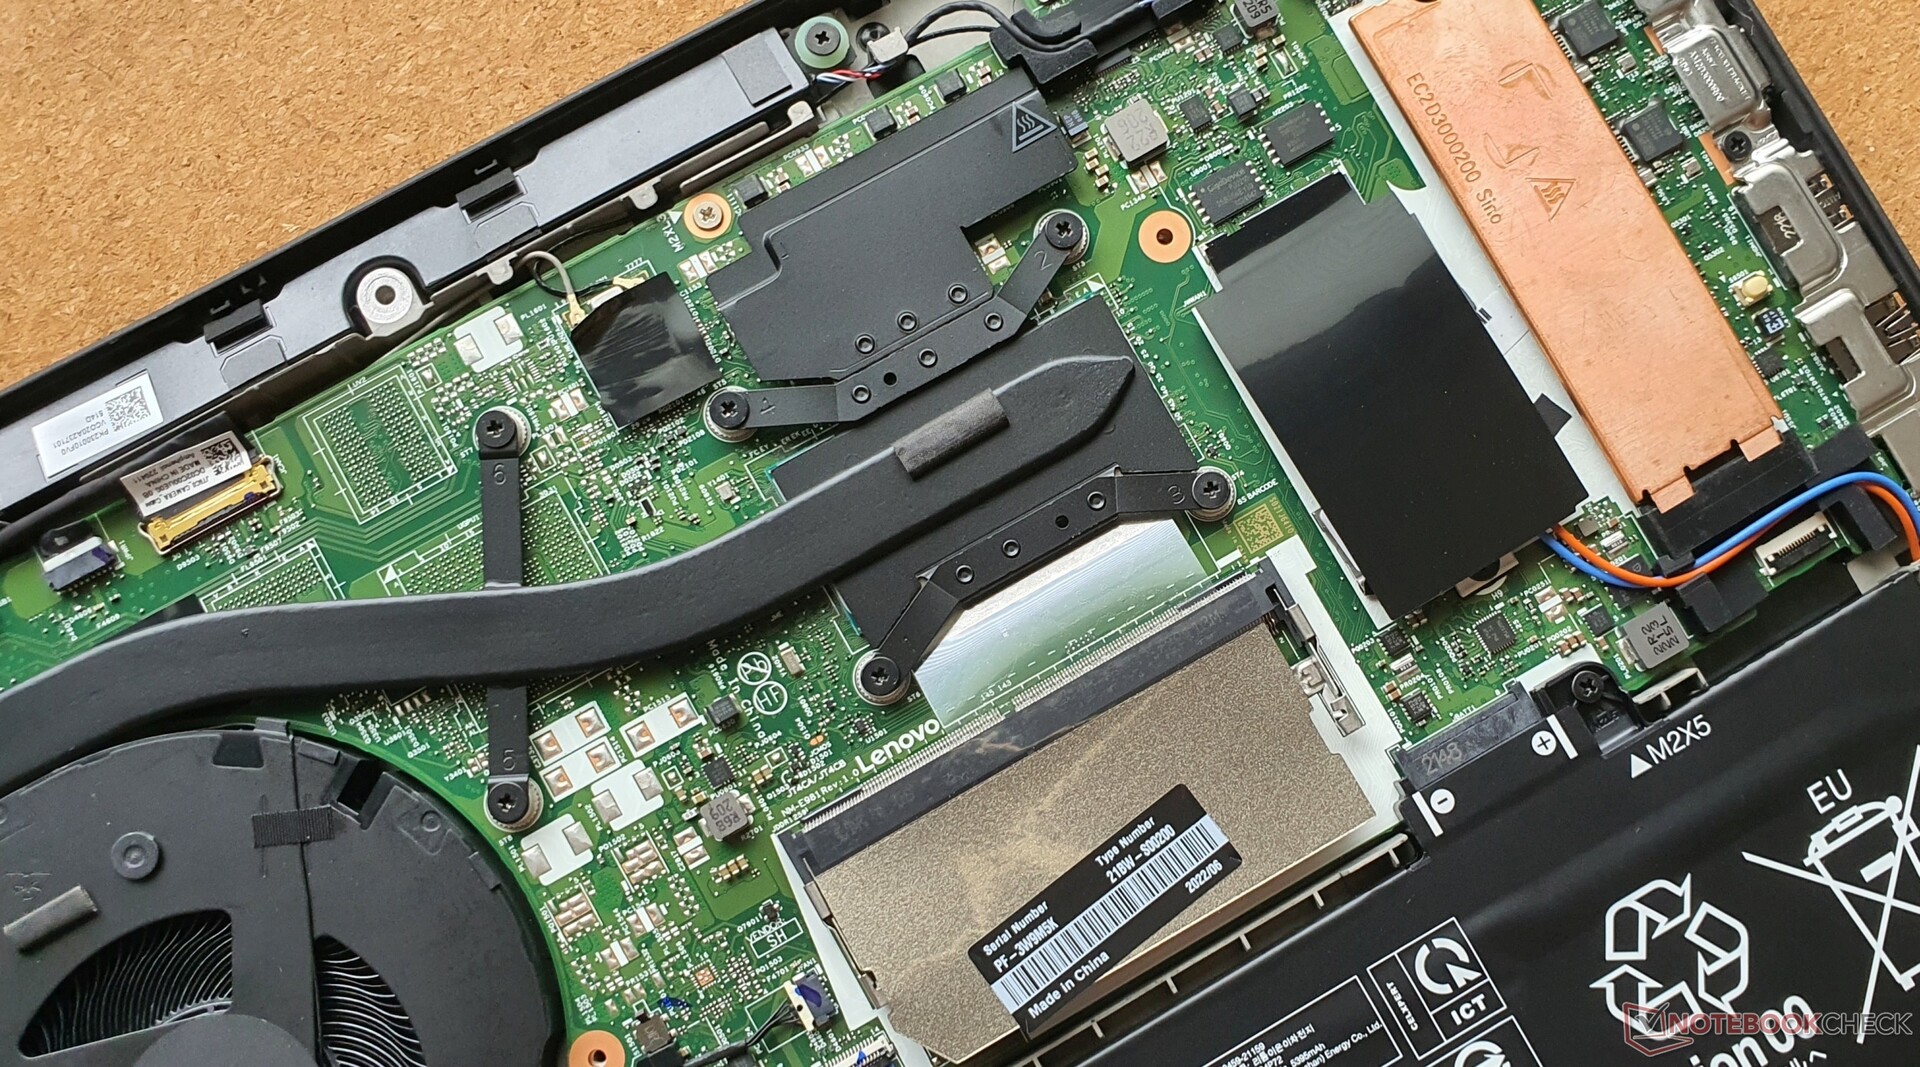
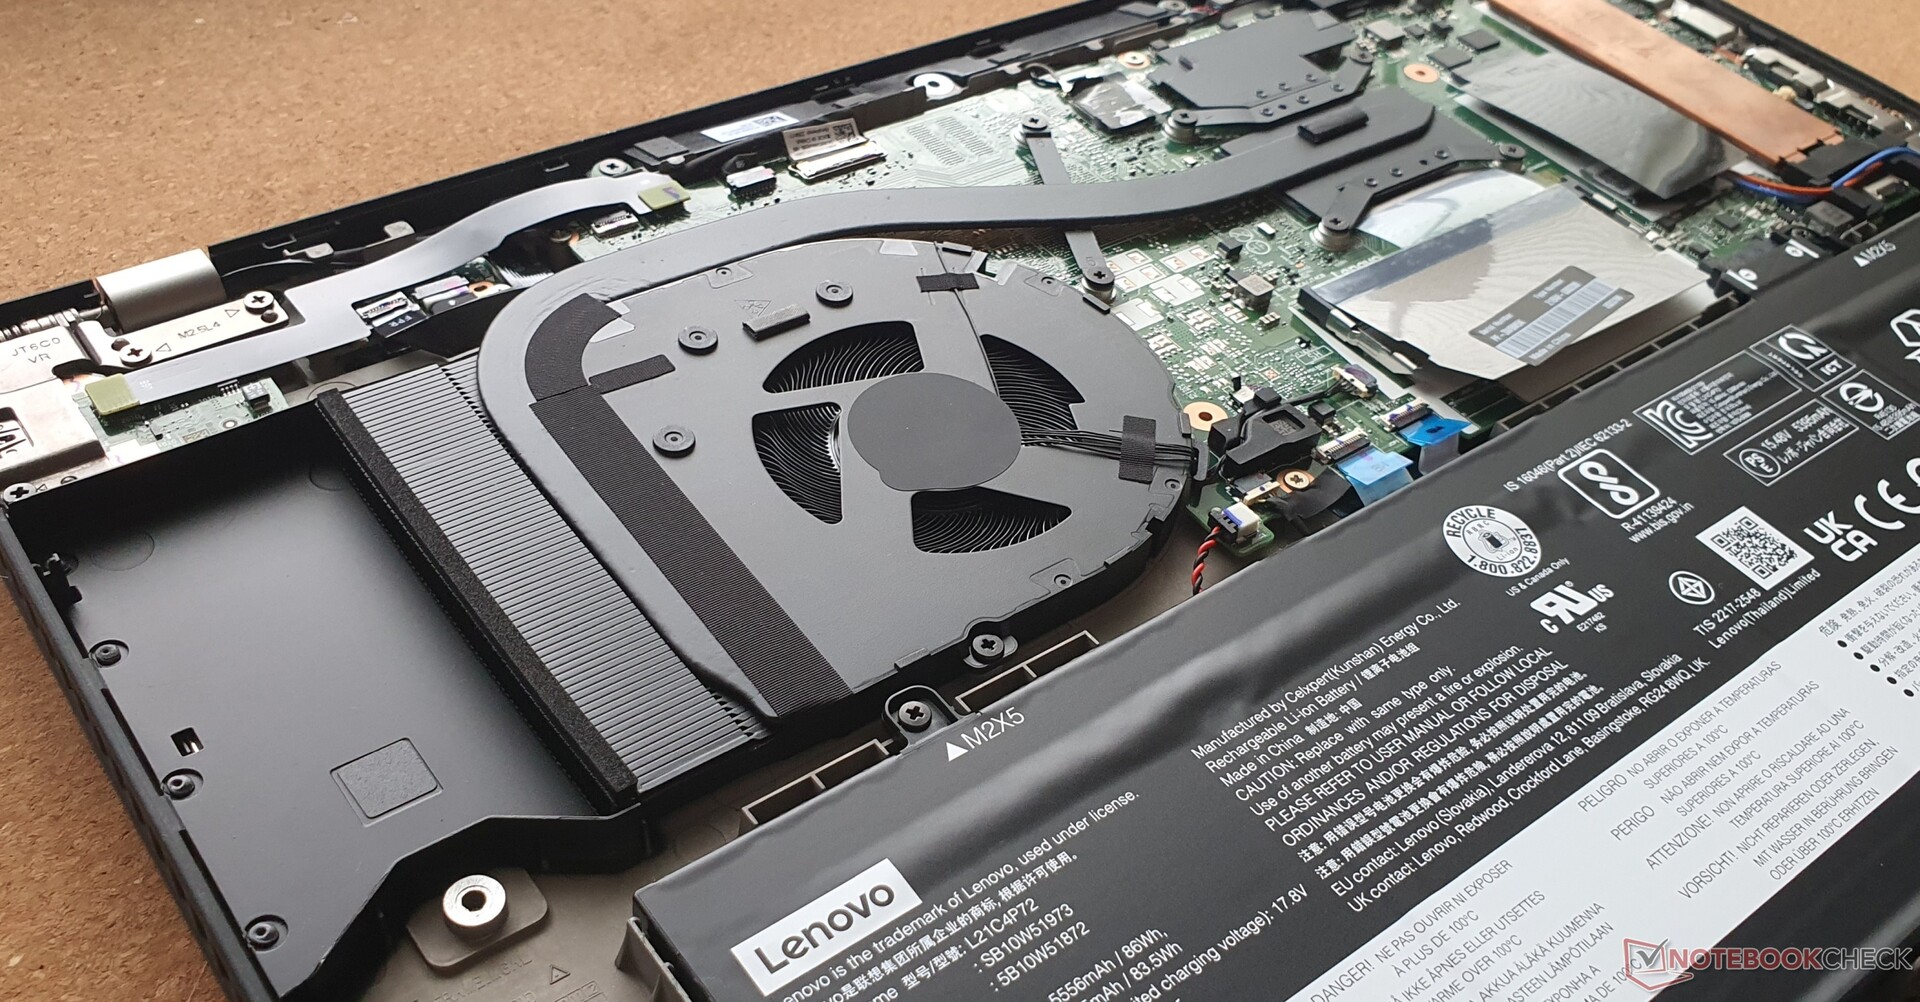
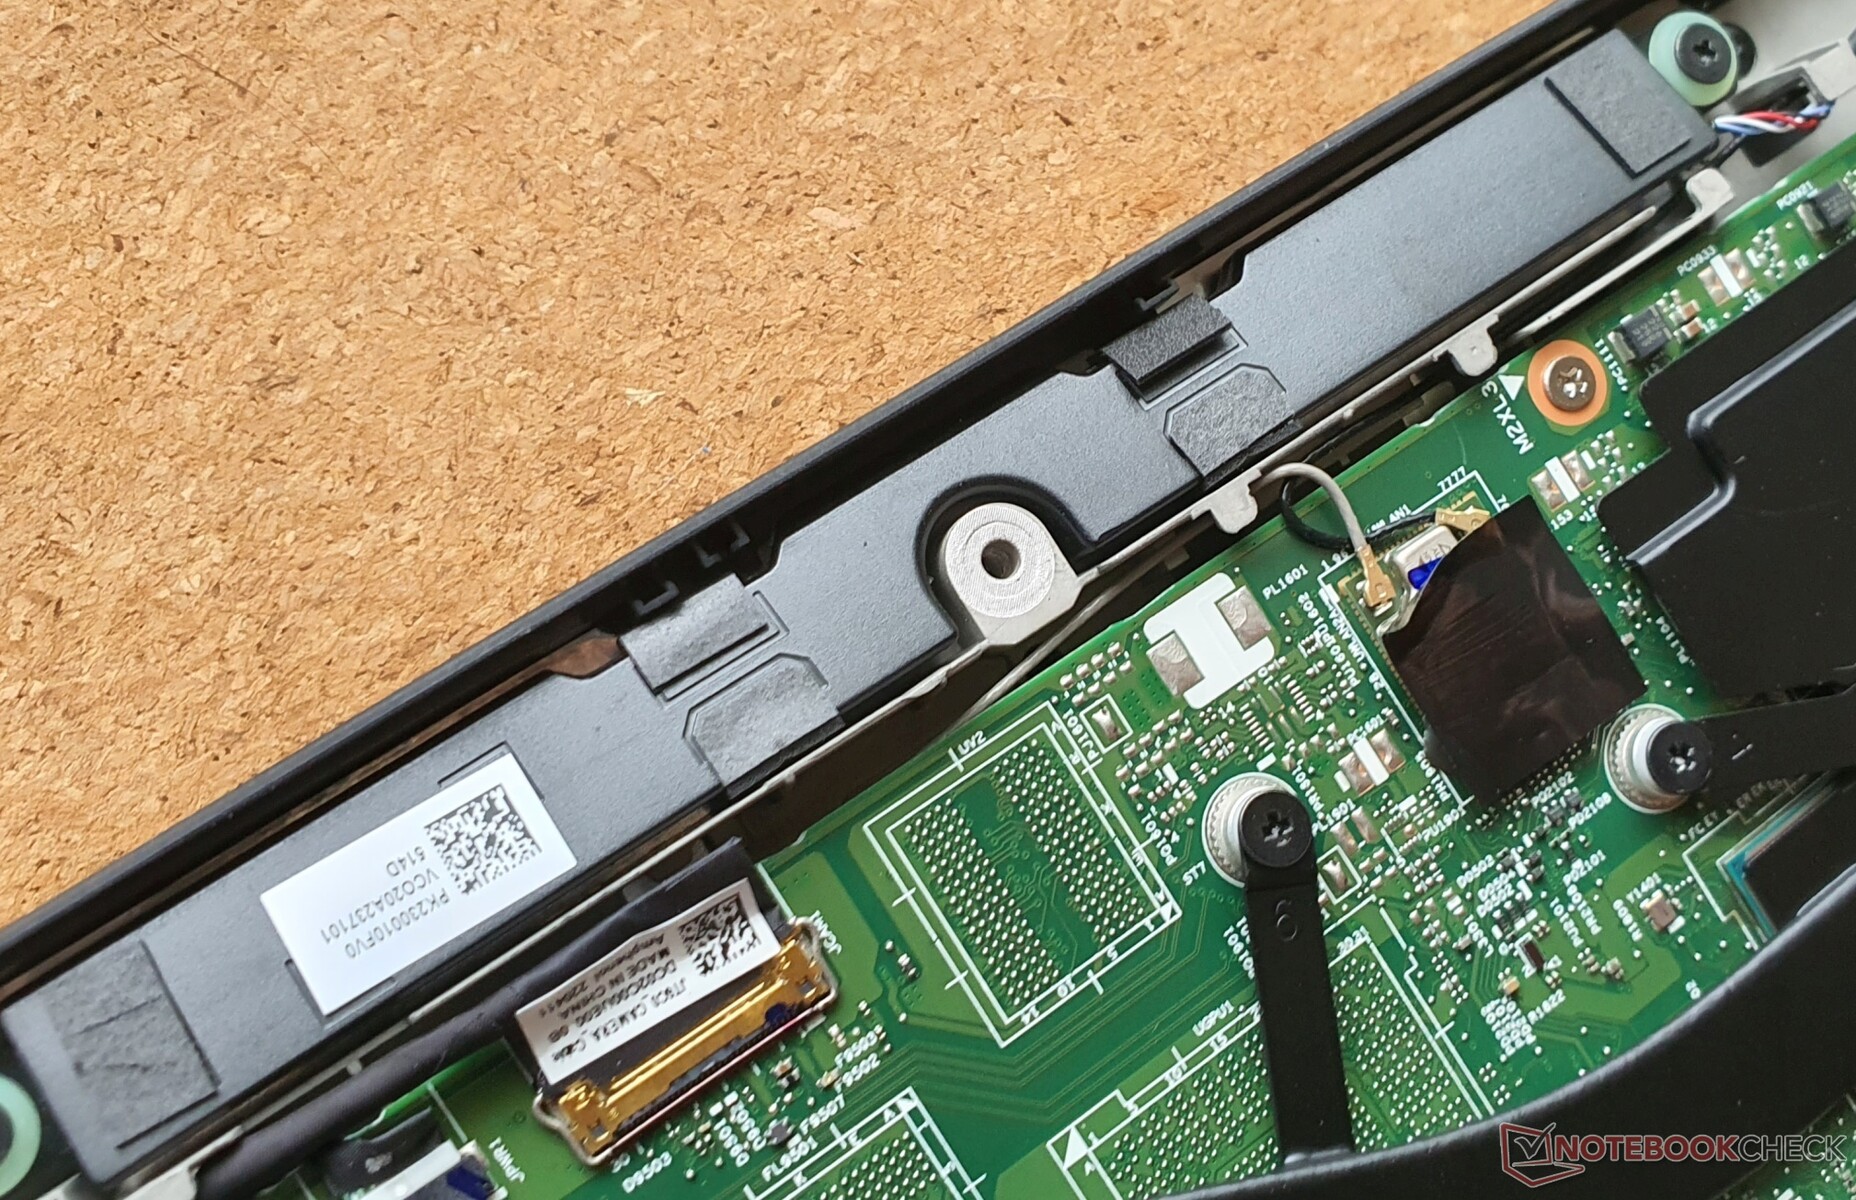
Before opening the device, you should deactivate the internal battery in the BIOS. After loosening 8 Phillips screws, you still need to loosen a few latches with a spudger. Afterwards, you have access to the inserted M.2-2280-SSD (PCIe 4.0), a RAM slot (free), a WWAN slot, the screwed 86 Wh battery and the cooling system, which can be cleaned.
Inserting an SSD into the WWAN slot is not possible.
Warranty
In Germany, Lenovo provides a warranty of 3 years (1 year for the battery). Our model comes with Premier Support, which includes on-site service. However, the standard is courier or carry-in service. An extension up to 5 years is possible: 223 Euros (~US$ 223) for the first and 521 Euros (~US$ 521) for two extra years.
These terms of warranty may differ in other countries, so be sure to check with your supplier before buying.
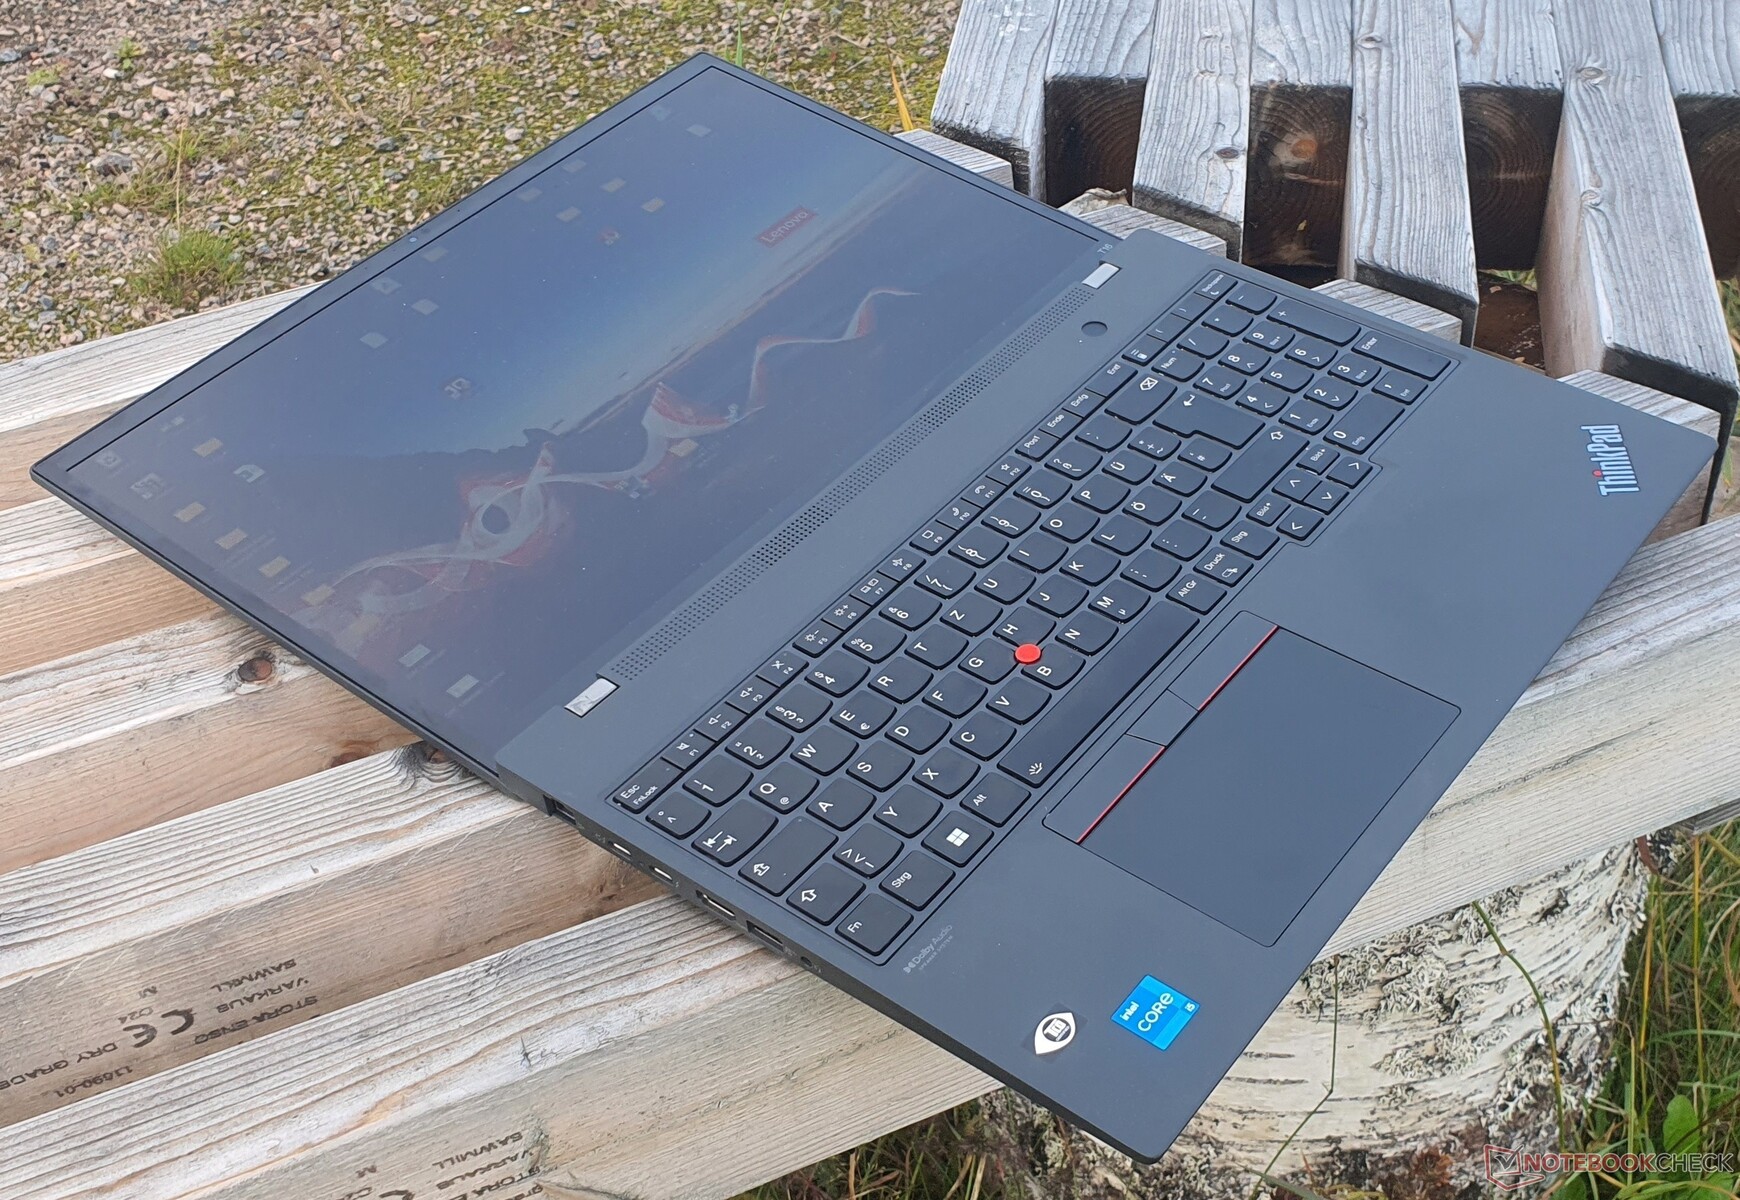
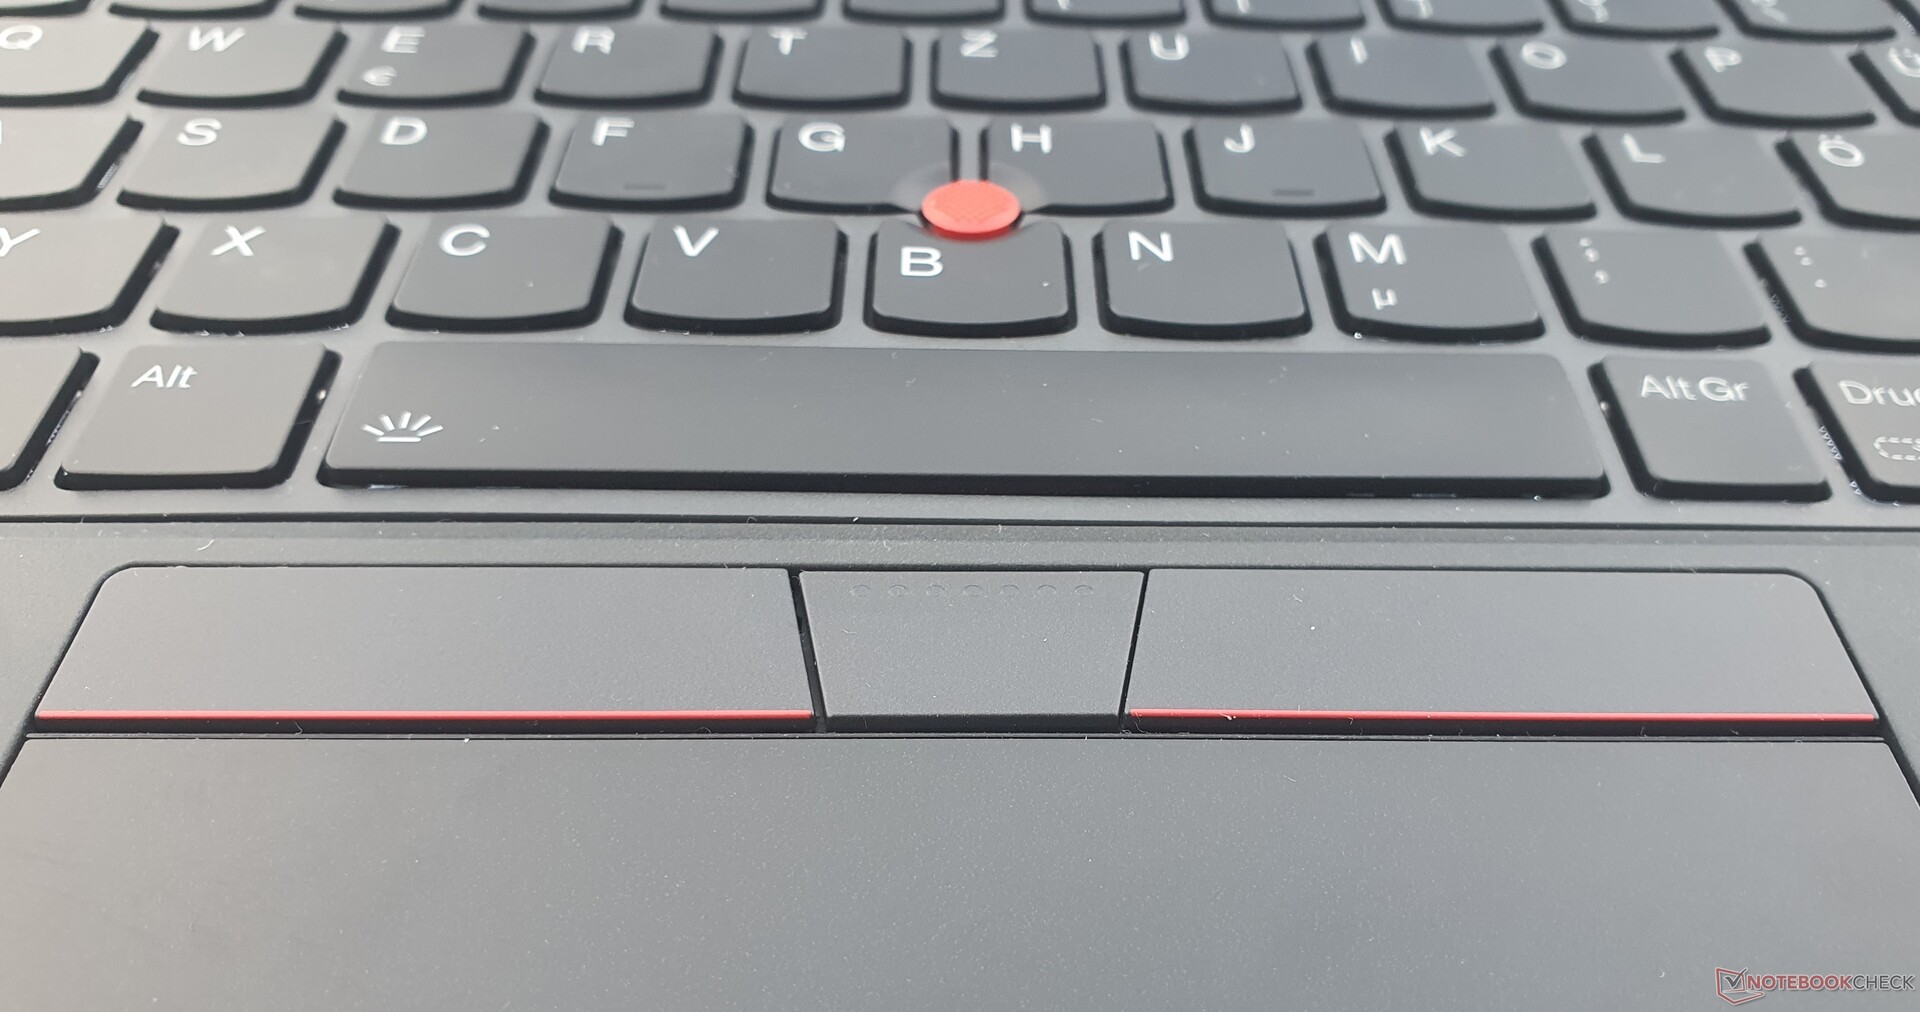
Input Devices - 1.5 mm travel with replaceable ThinkPad keyboard
Keyboard
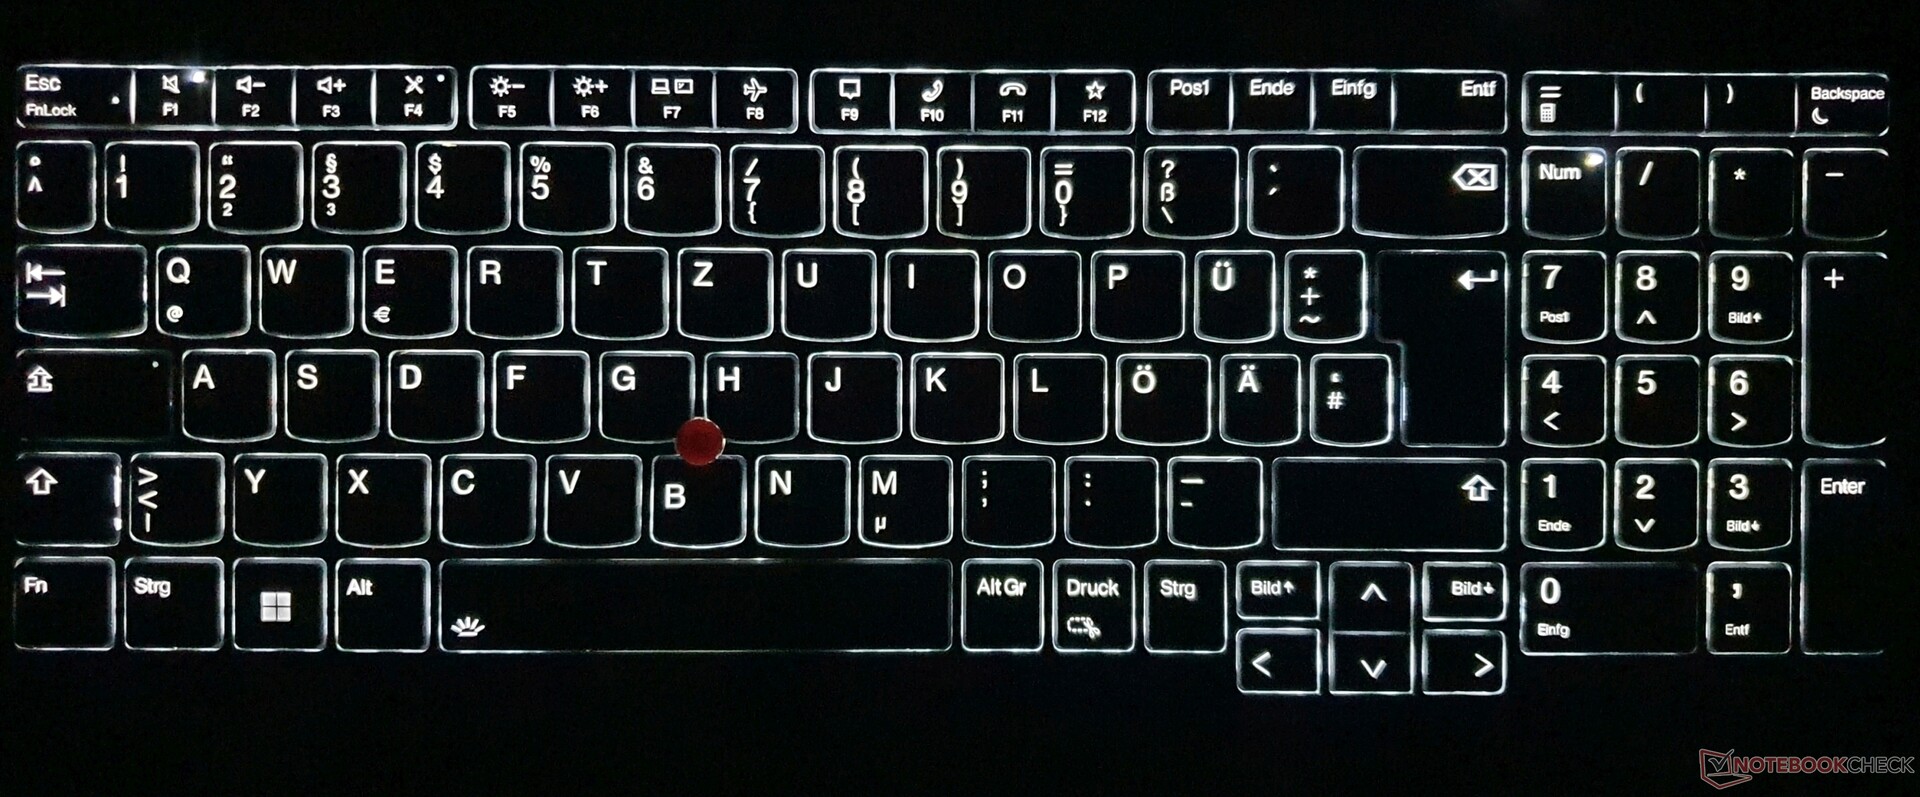
The 6-row, splash-proof chiclet keyboard comes with 16x16 mm keys. The bottom row and the shift keys are now square. Some keys have been reduced in size, such as the NumPad and the arrow keys, but not halved (like in some other models). All important keys are also dedicated.
The key travel, which has been shortened to 1.5 mm, has found its way into the T-series without the s-suffix this year. Since the pressure point is very concise and the key resistance well implemented, this ensures faster, more accurate and also quieter typing than nearly every other keyboard. Furthermore, the keyboard can be replaced in the case of wear or damage. The keyboard base yields only a little under targeted pressure, which is not the case when typing.
Touchpad & TrackPoint
The touchpad, which has been enlarged to 11.5x6.7 cm with an improved Mylar surface, is a step higher in terms of responsiveness, glides more smoothly and feels more like smooth glass. Pinch-to-zoom and drag & drop work wonderfully. Inputs are implemented precisely. The integrated click keys offer short travel, but rich and clear feedback.
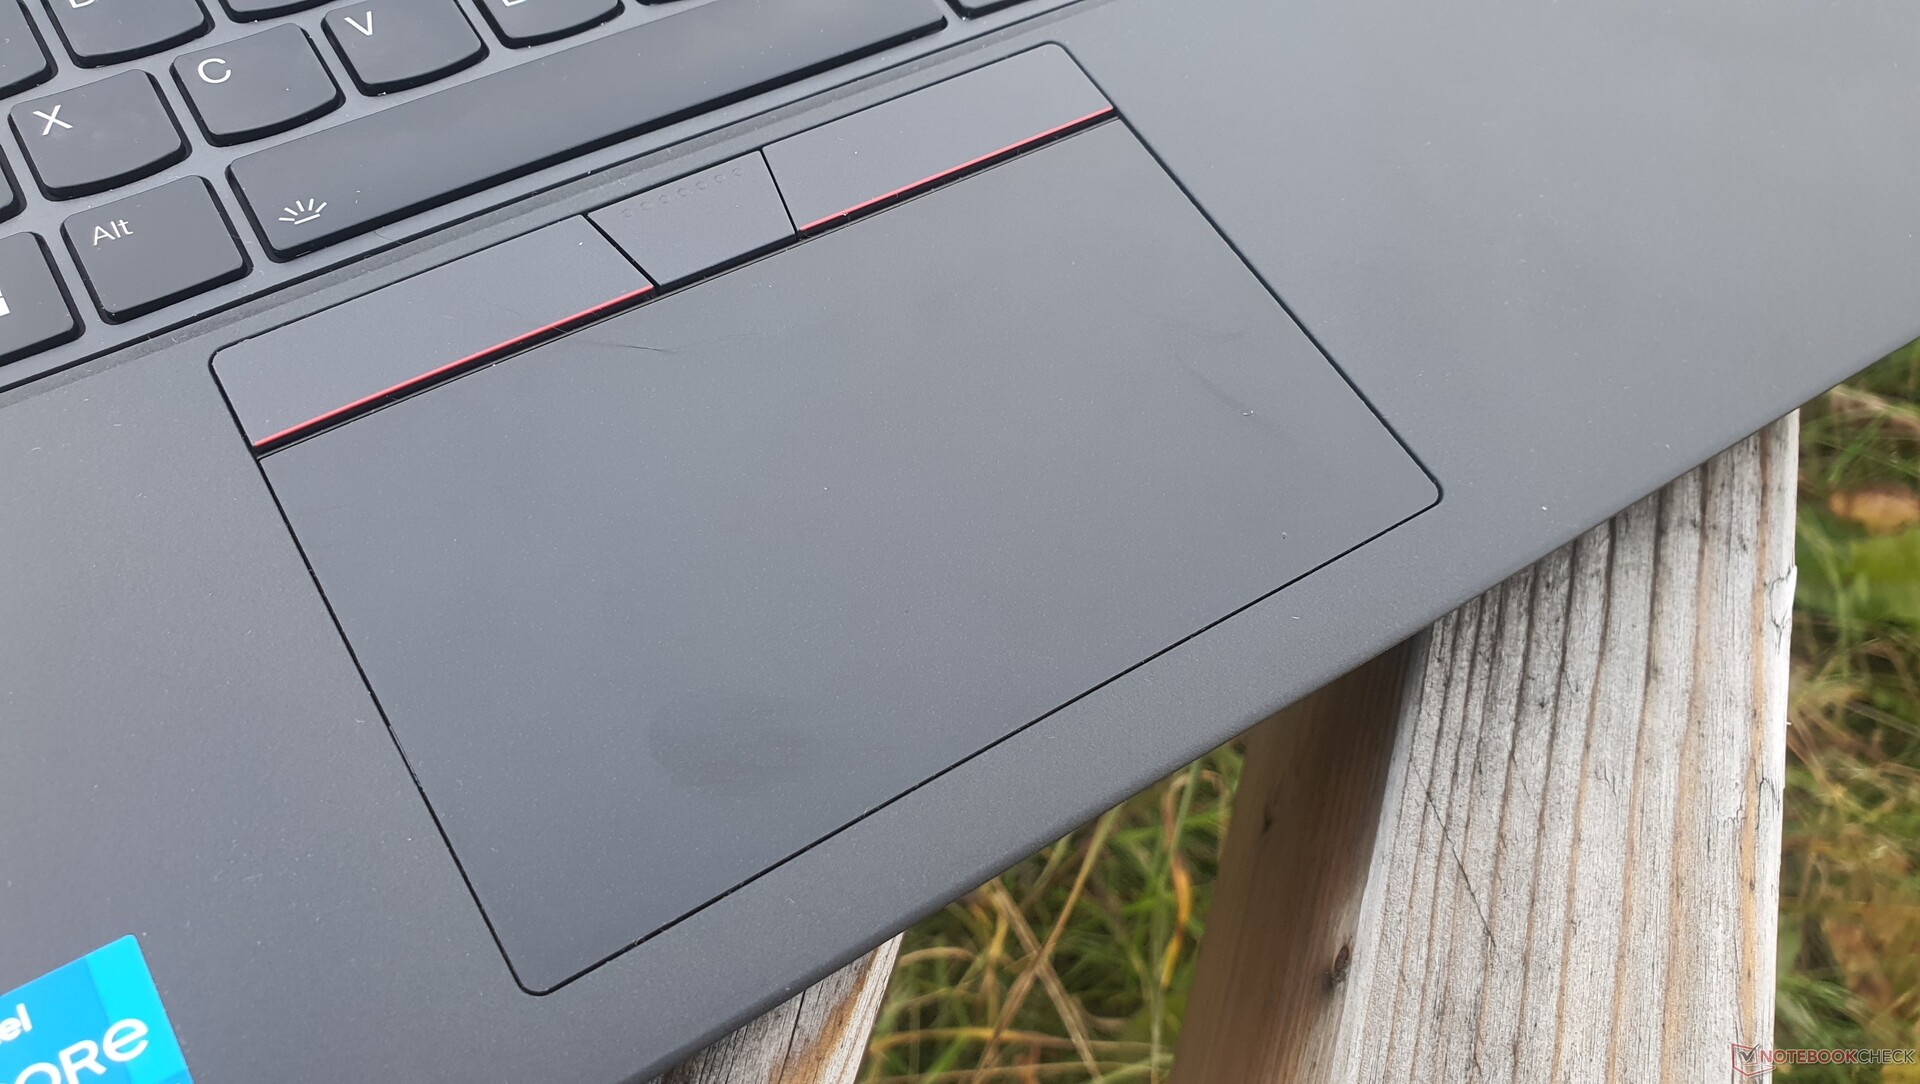
TrackPoint fans can still make use of the advantageous method for mouse control, which makes removing the hand from the keyboard unnecessary. However, the three associated keys above the touchpad are now completely flat, with less feedback and travel. This may take a little getting used to. Nevertheless, they still function precisely and reliably.
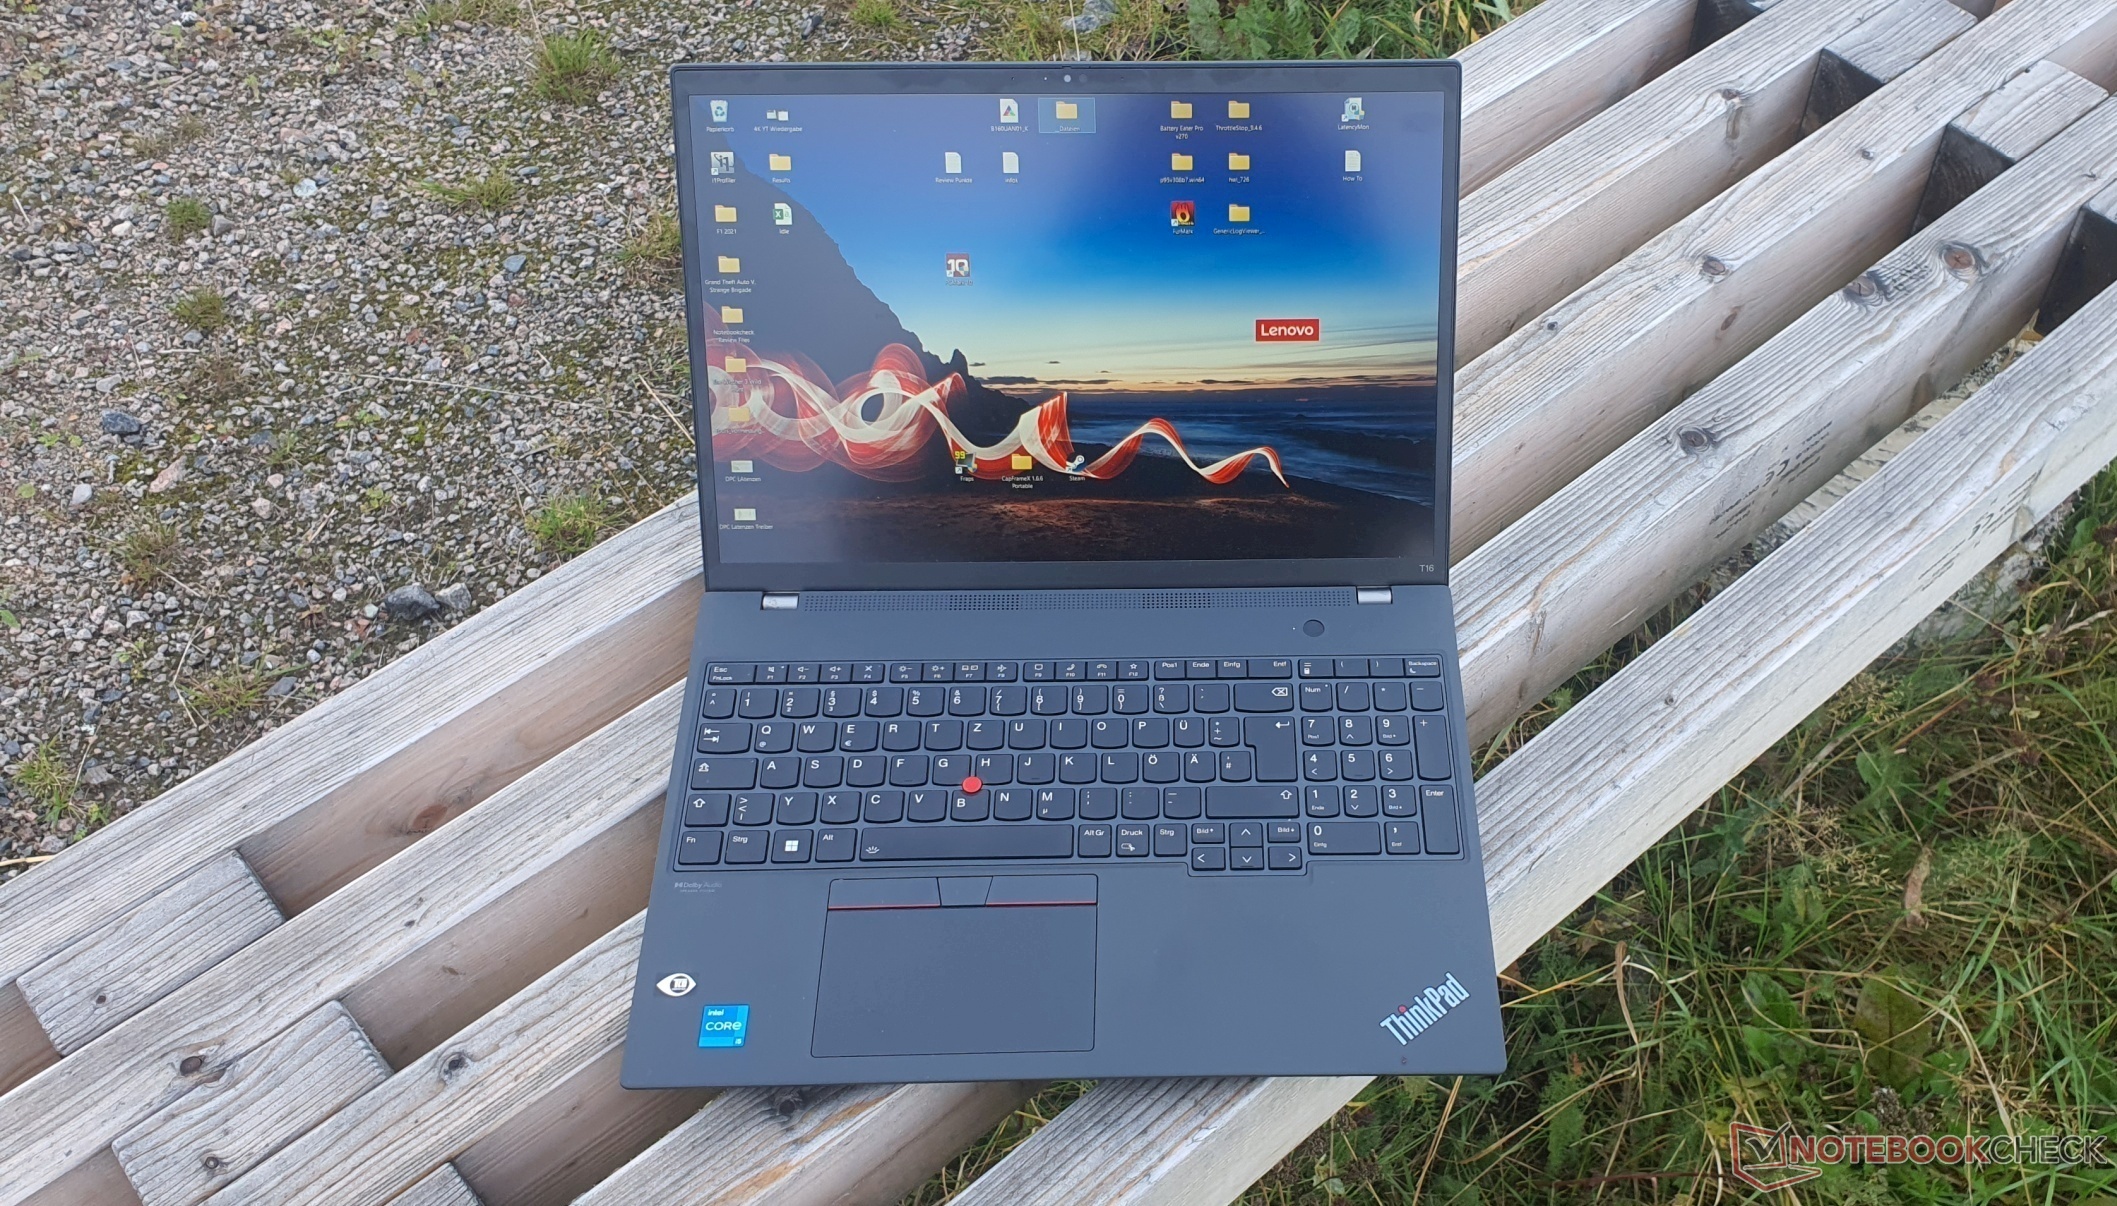
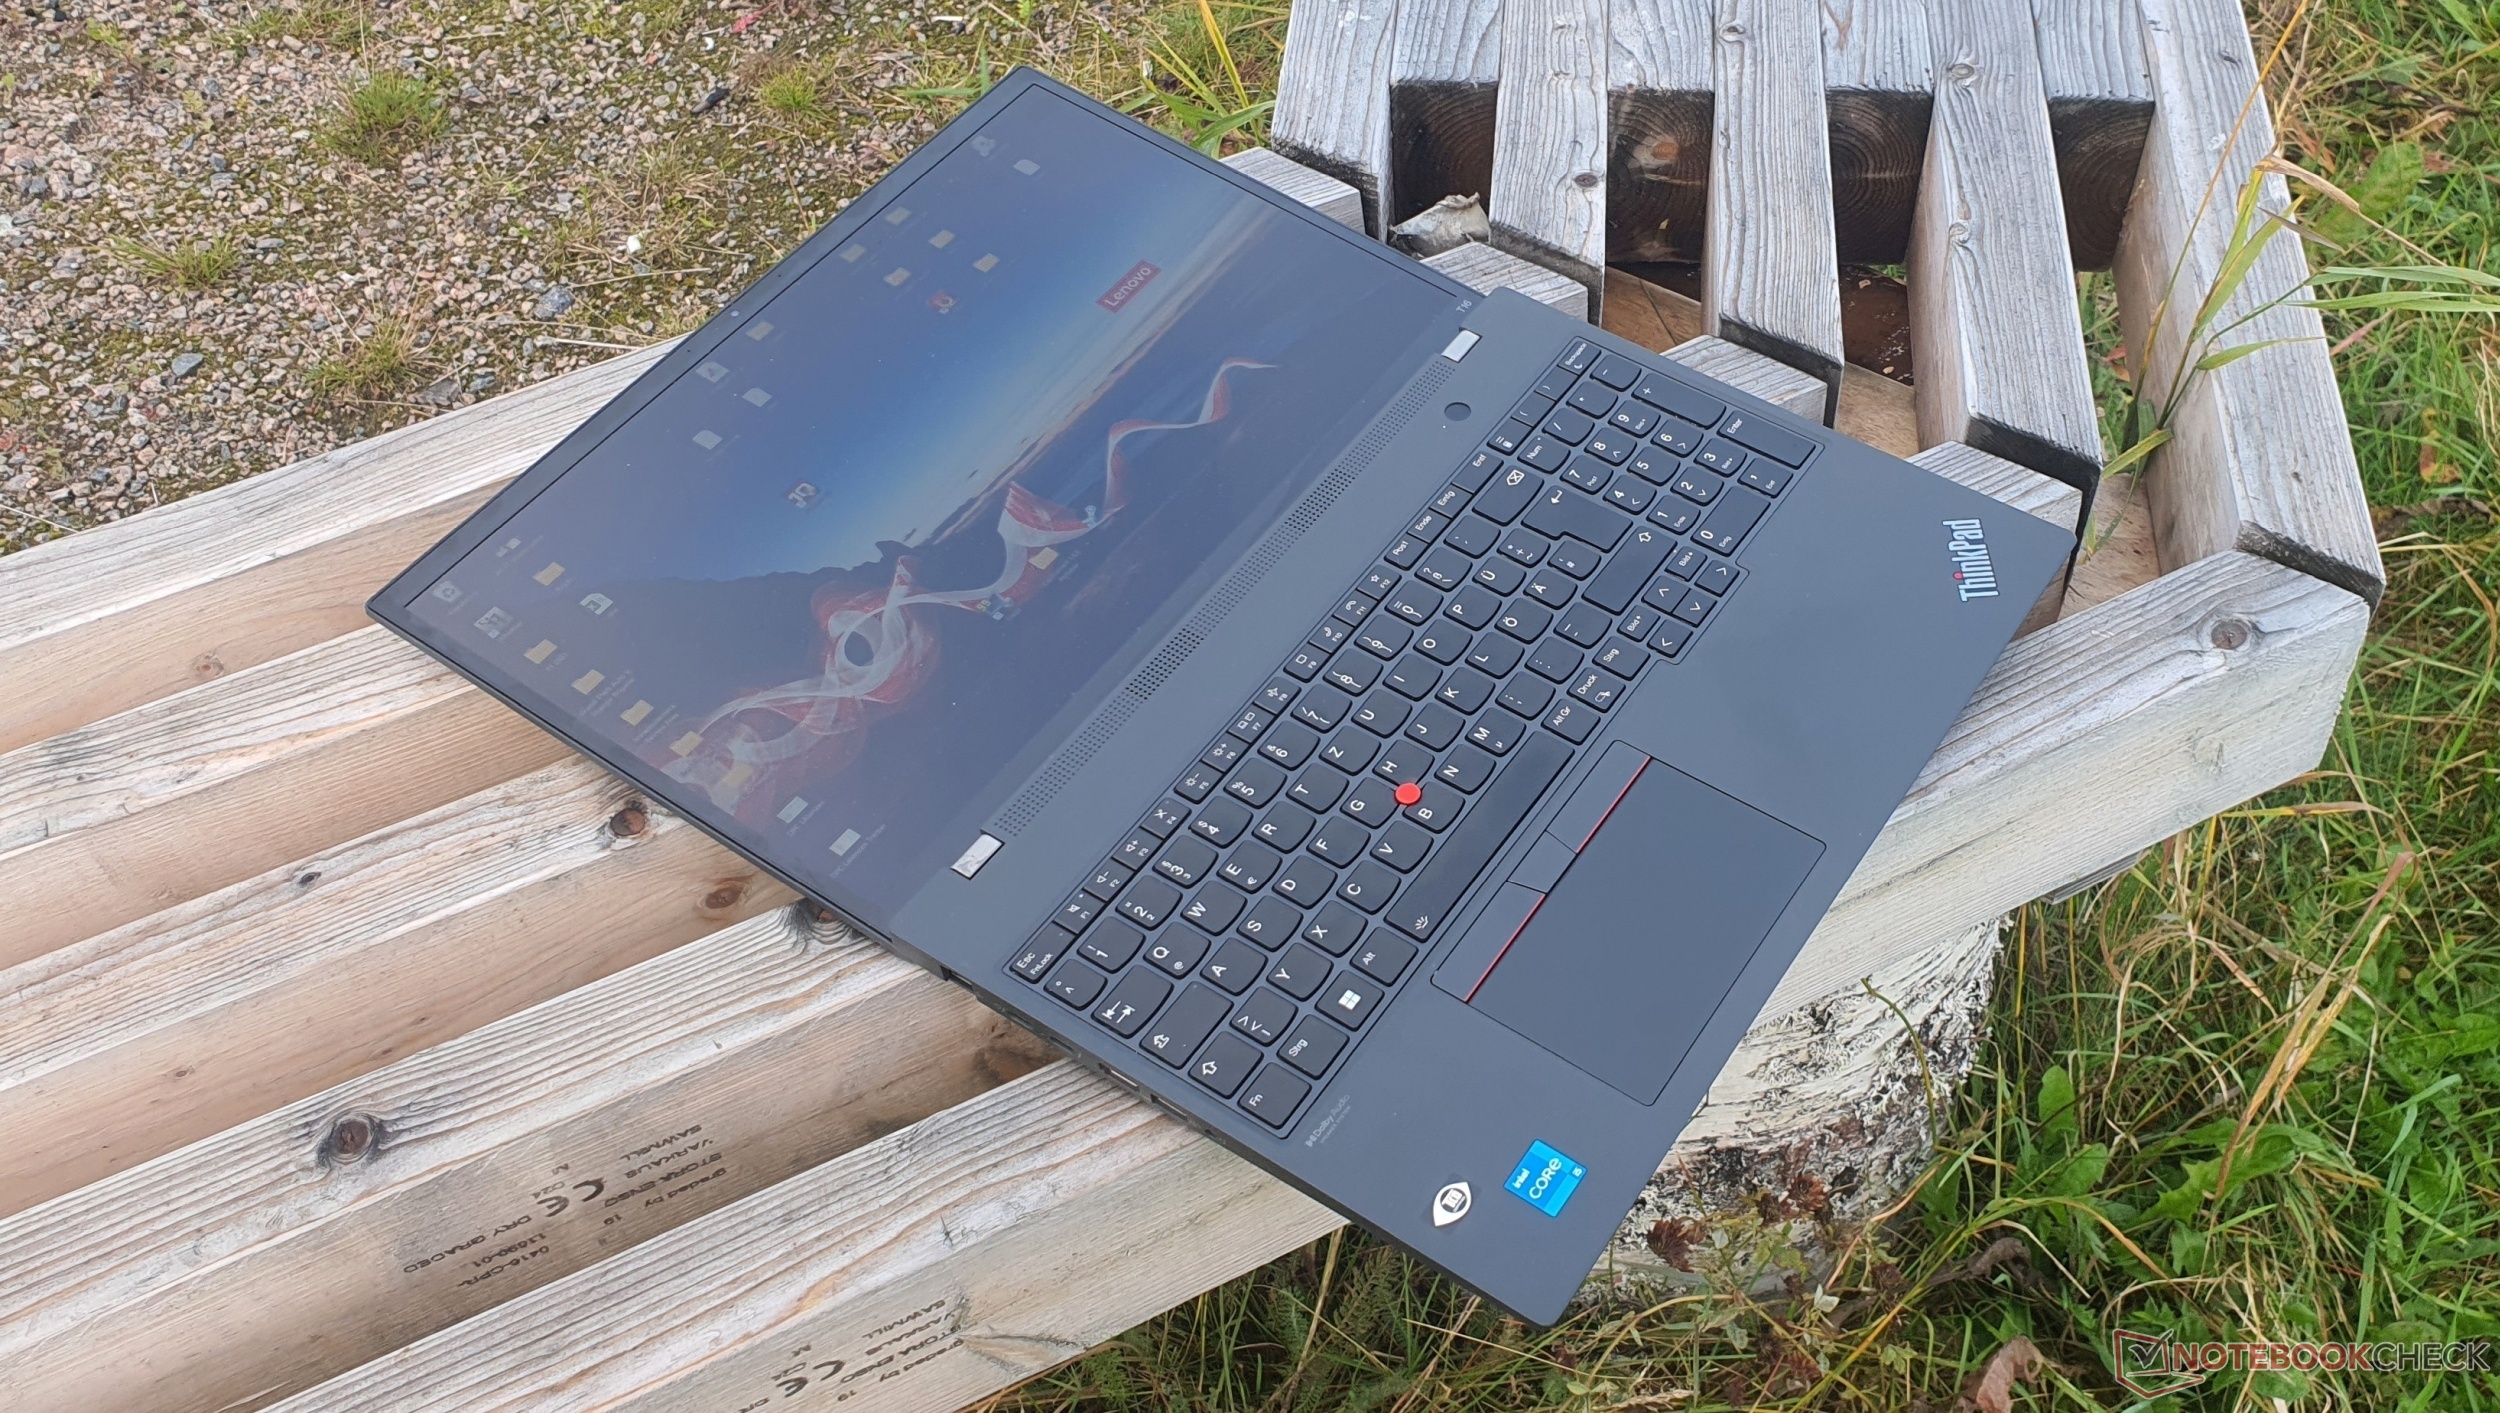
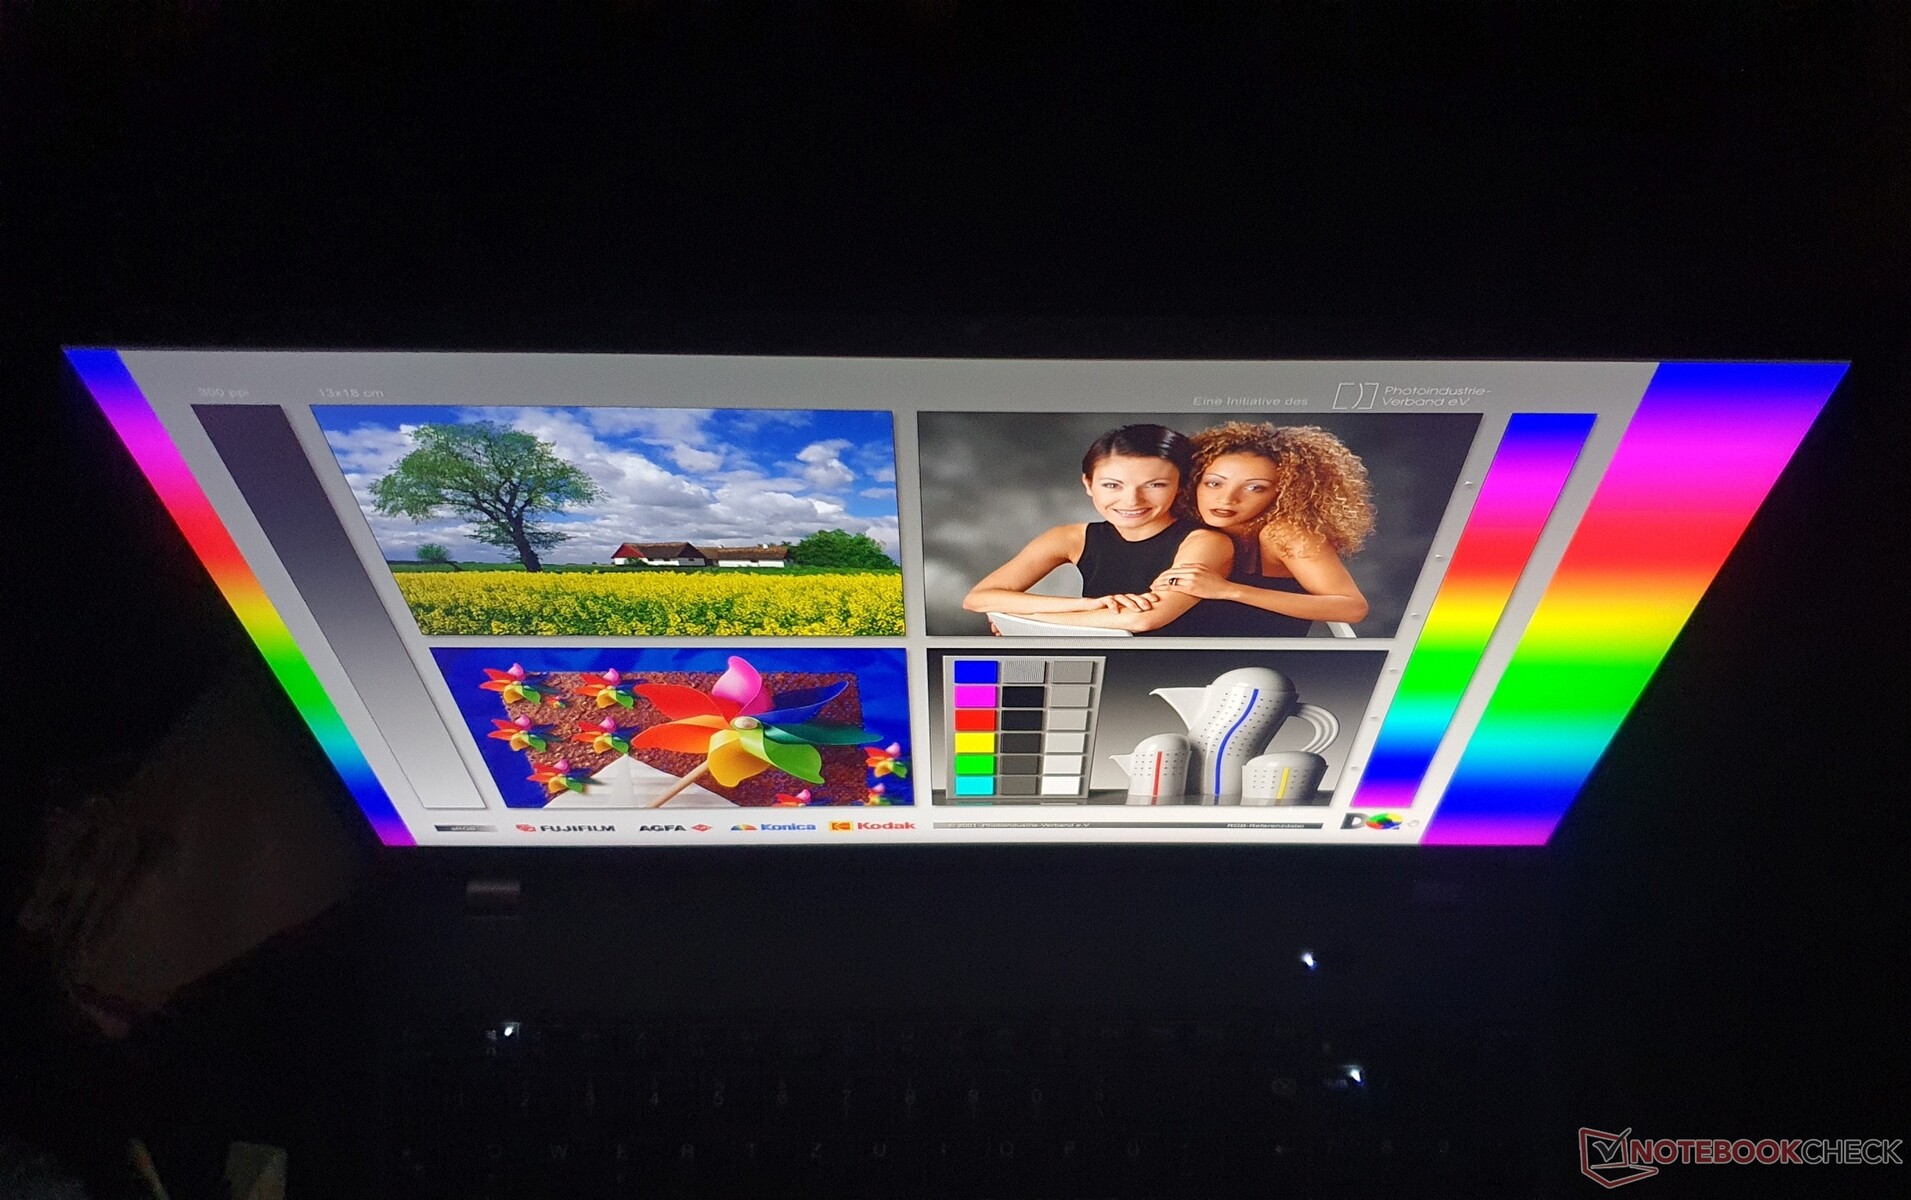
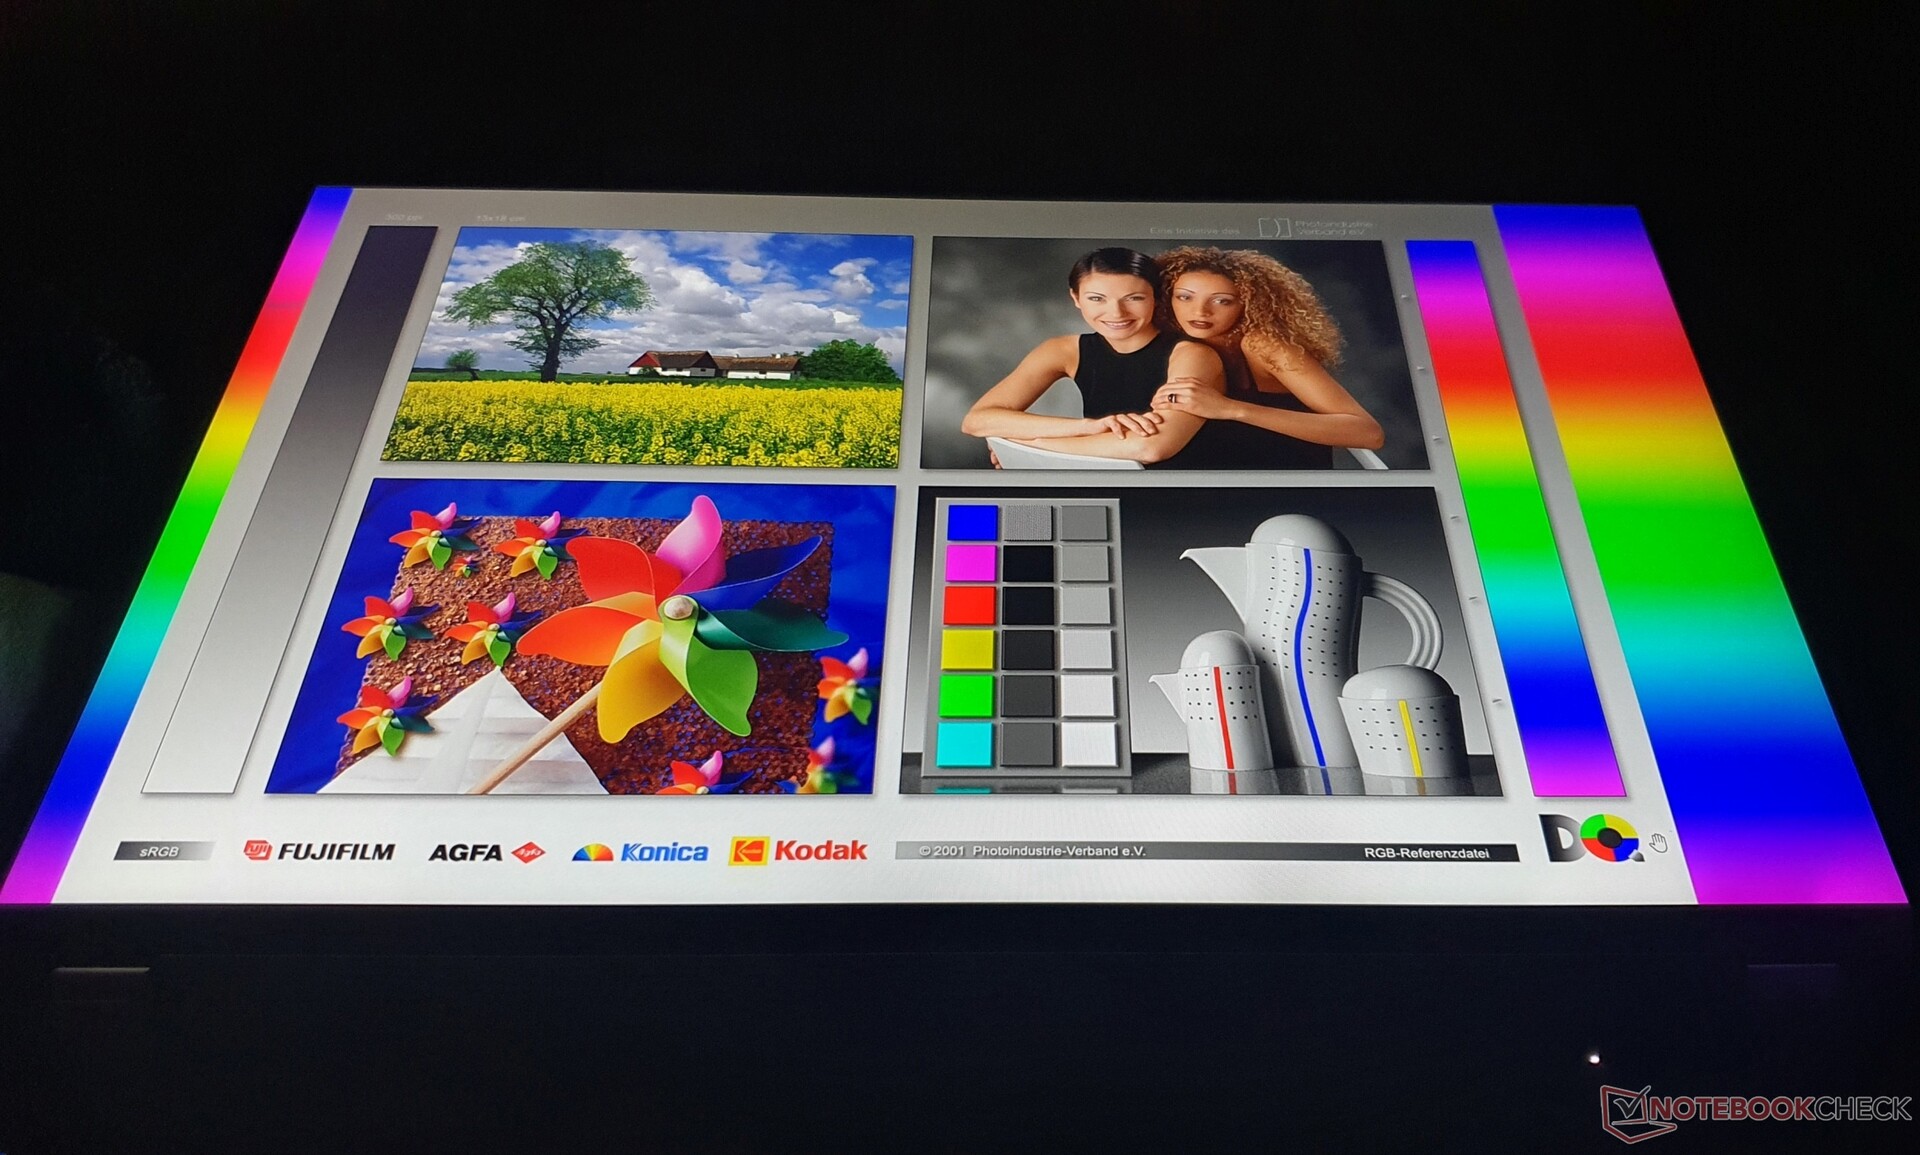
Display - Sharp FHD+ low-power display in the ThinkPad T16
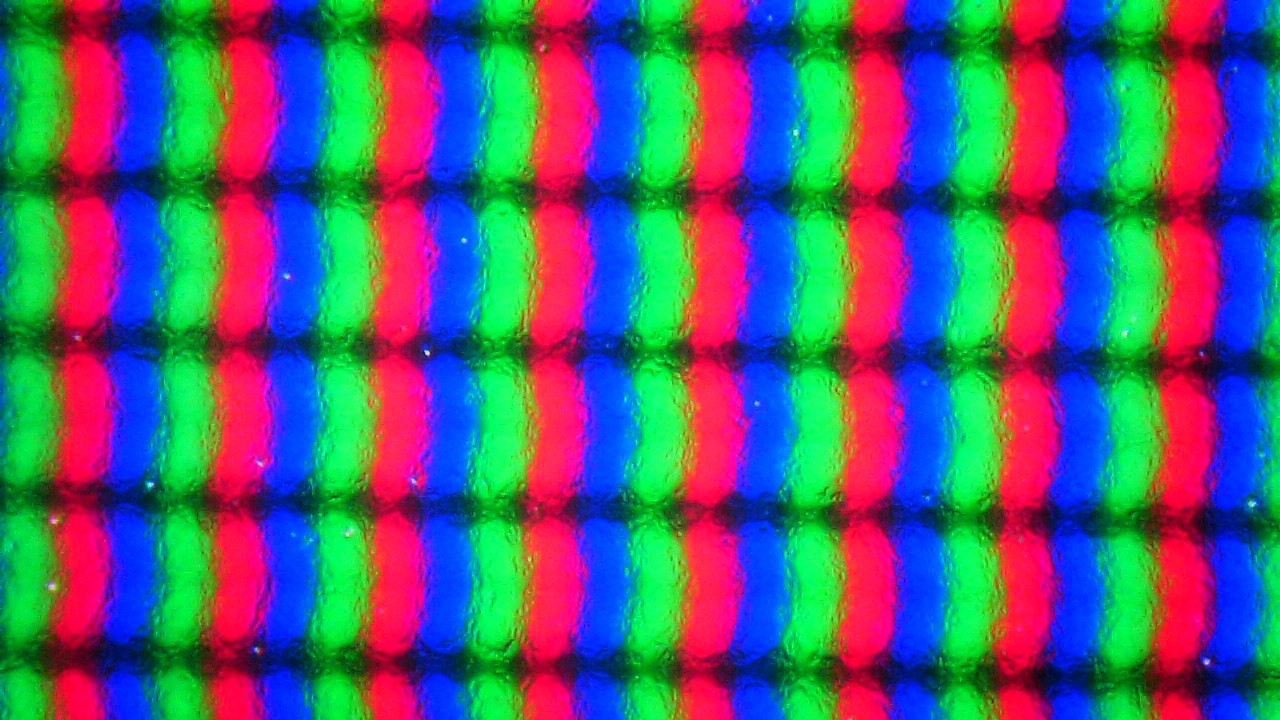

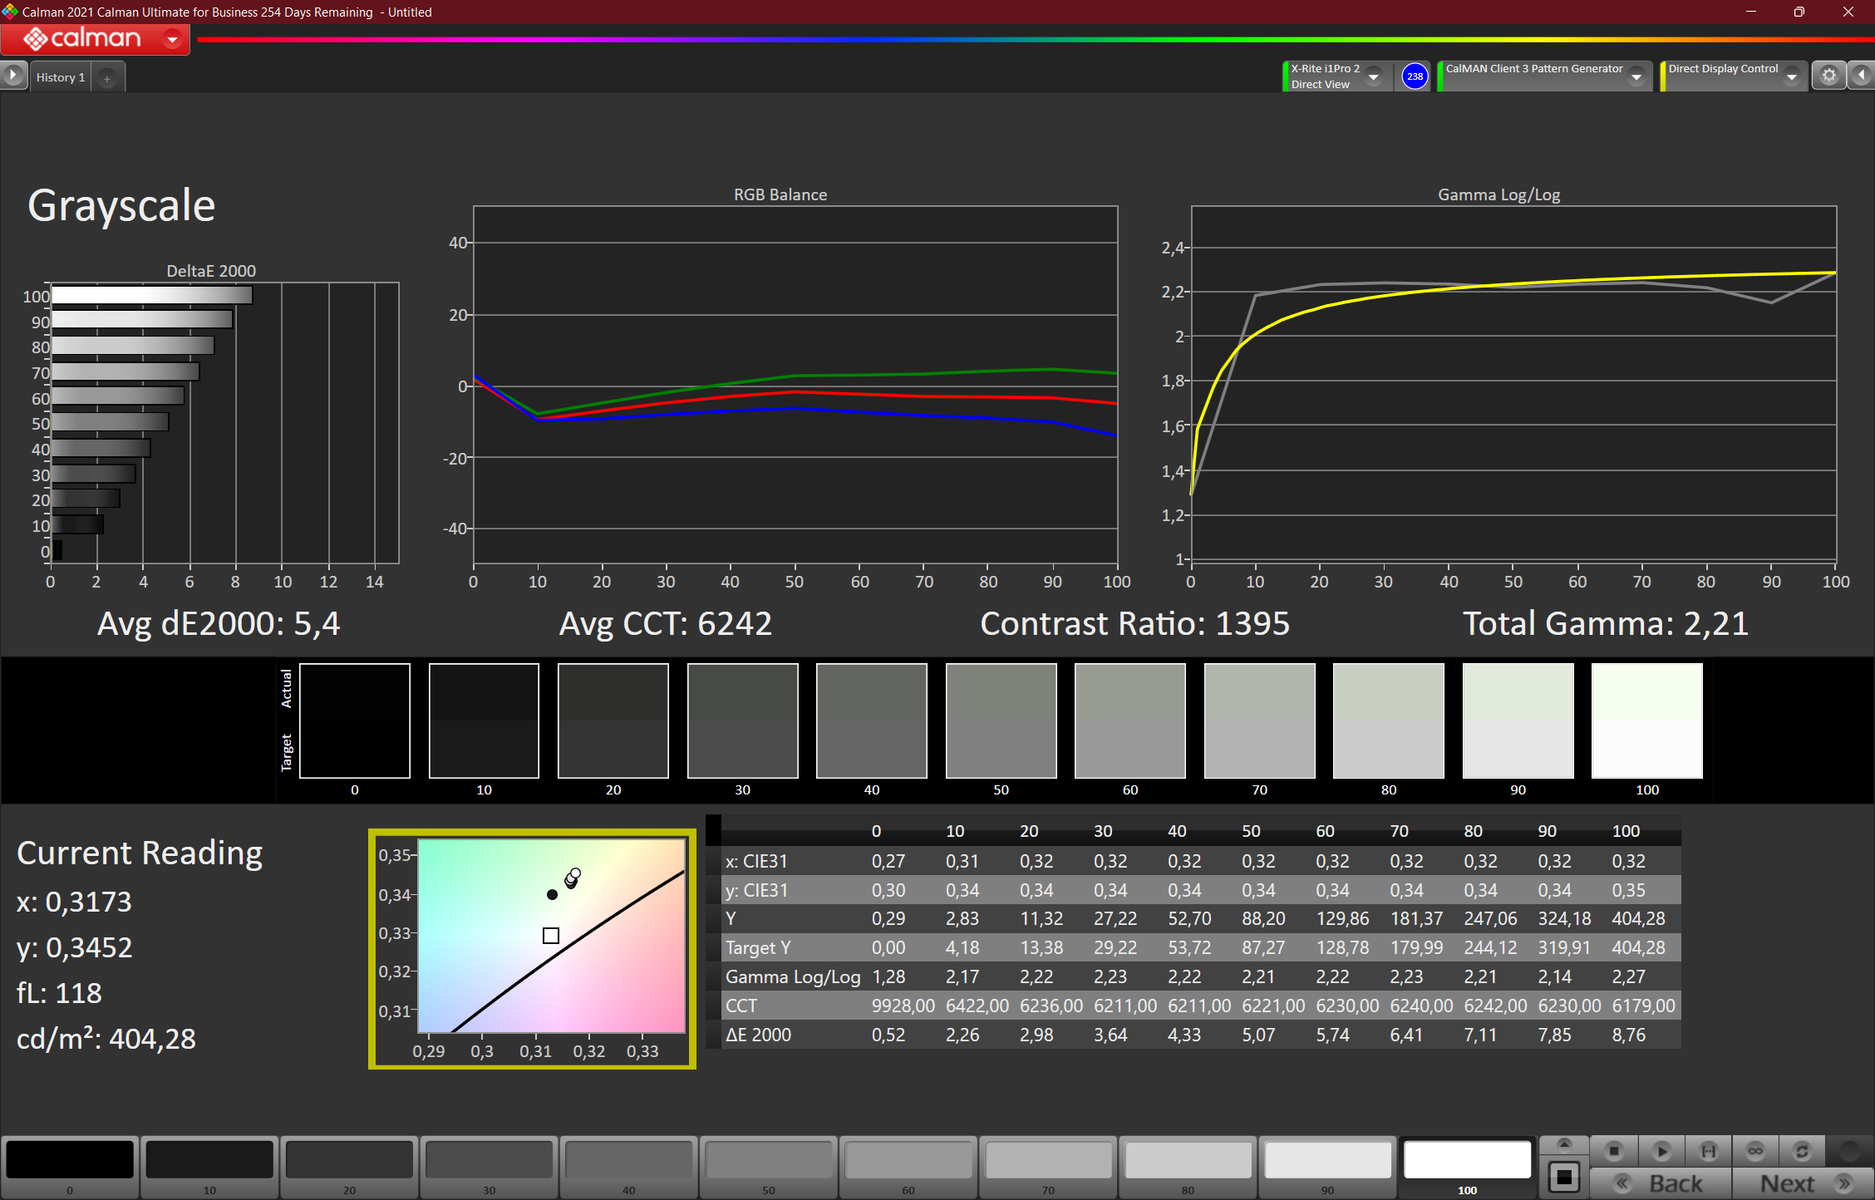
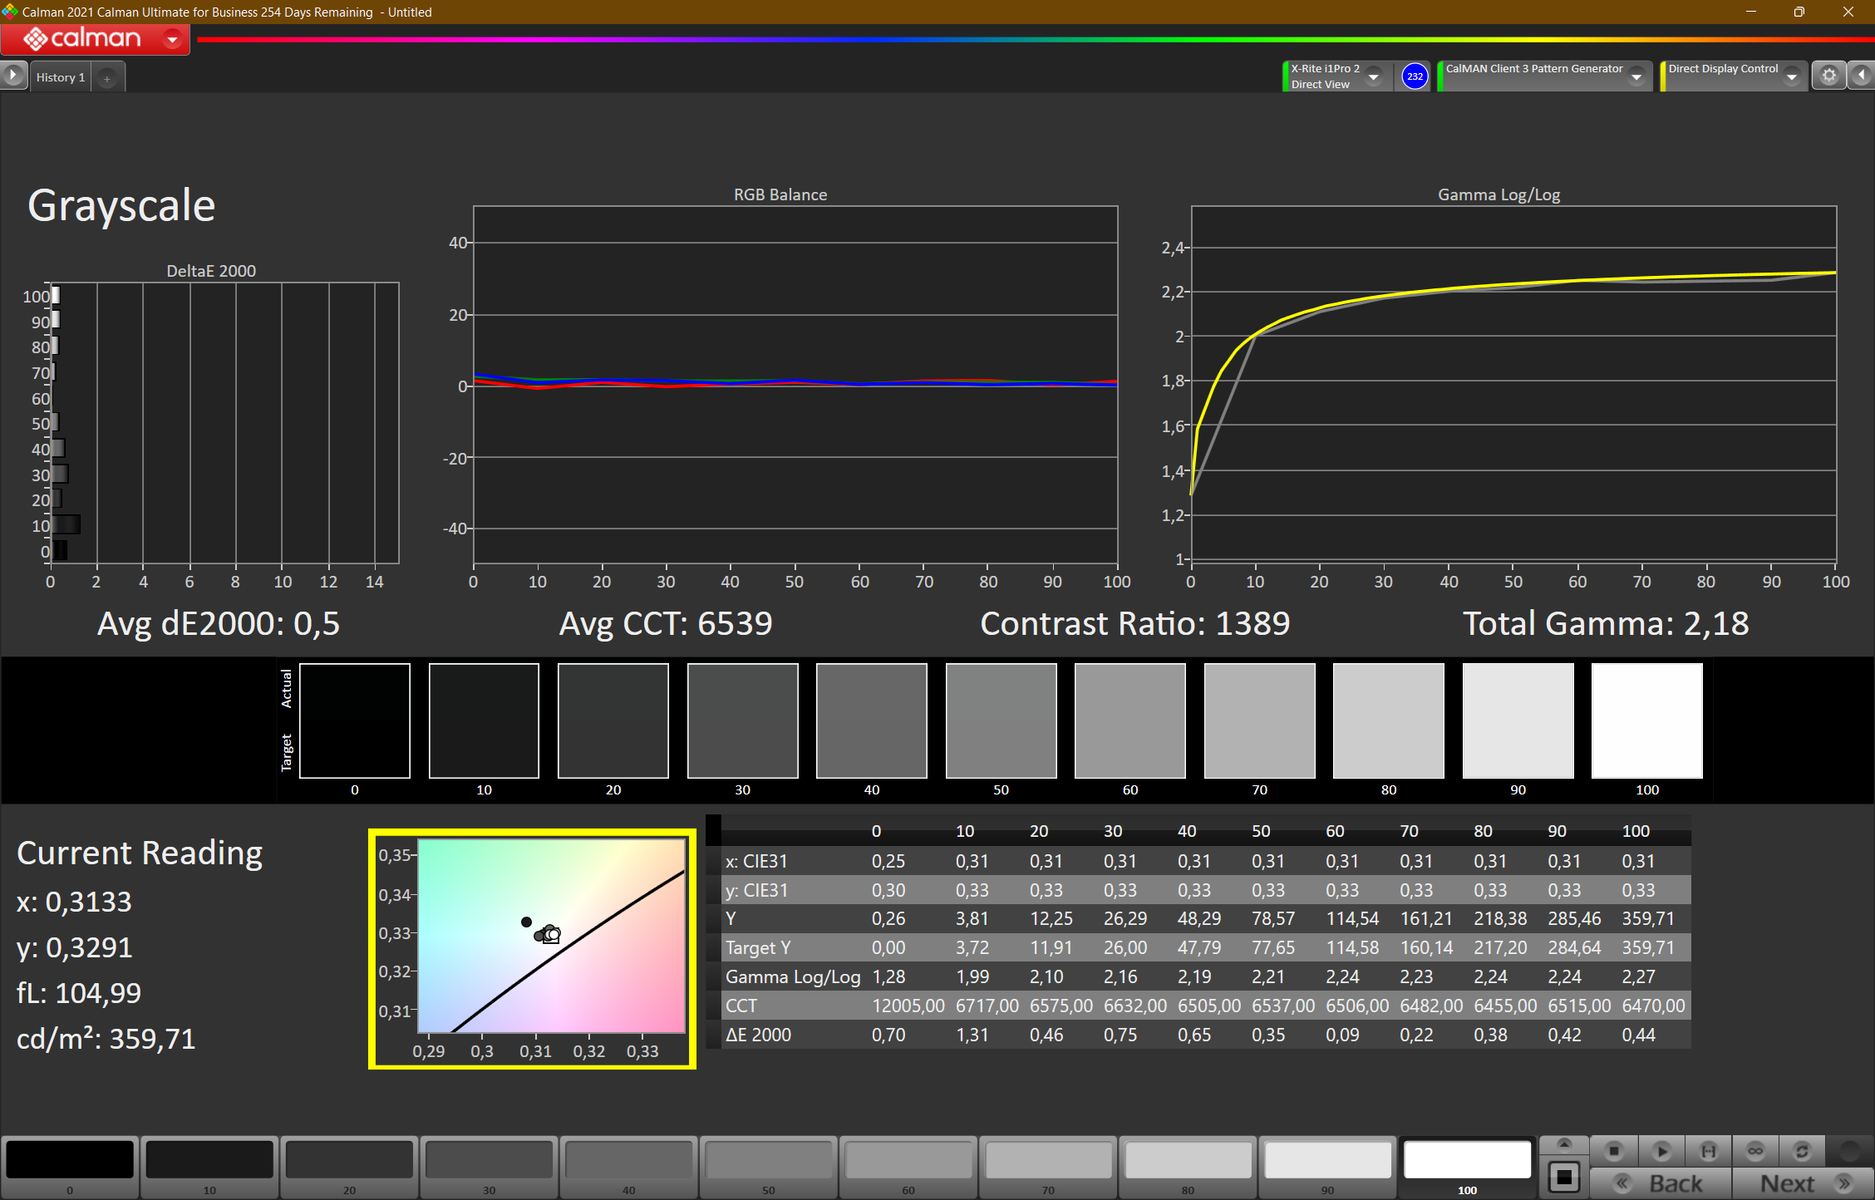
The matte low-power display in 16:10 format installed in our review sample has a resolution of 1920x1200 (WUXGA/FHD+) and offers good sharpness on 16 inches. The brightness of a good 390 nits is almost as specified (400 nits). The contrast ratio (1393:1) and black value (0.29 nits) are also at a high level. Black image content appears rich and deep as a result.
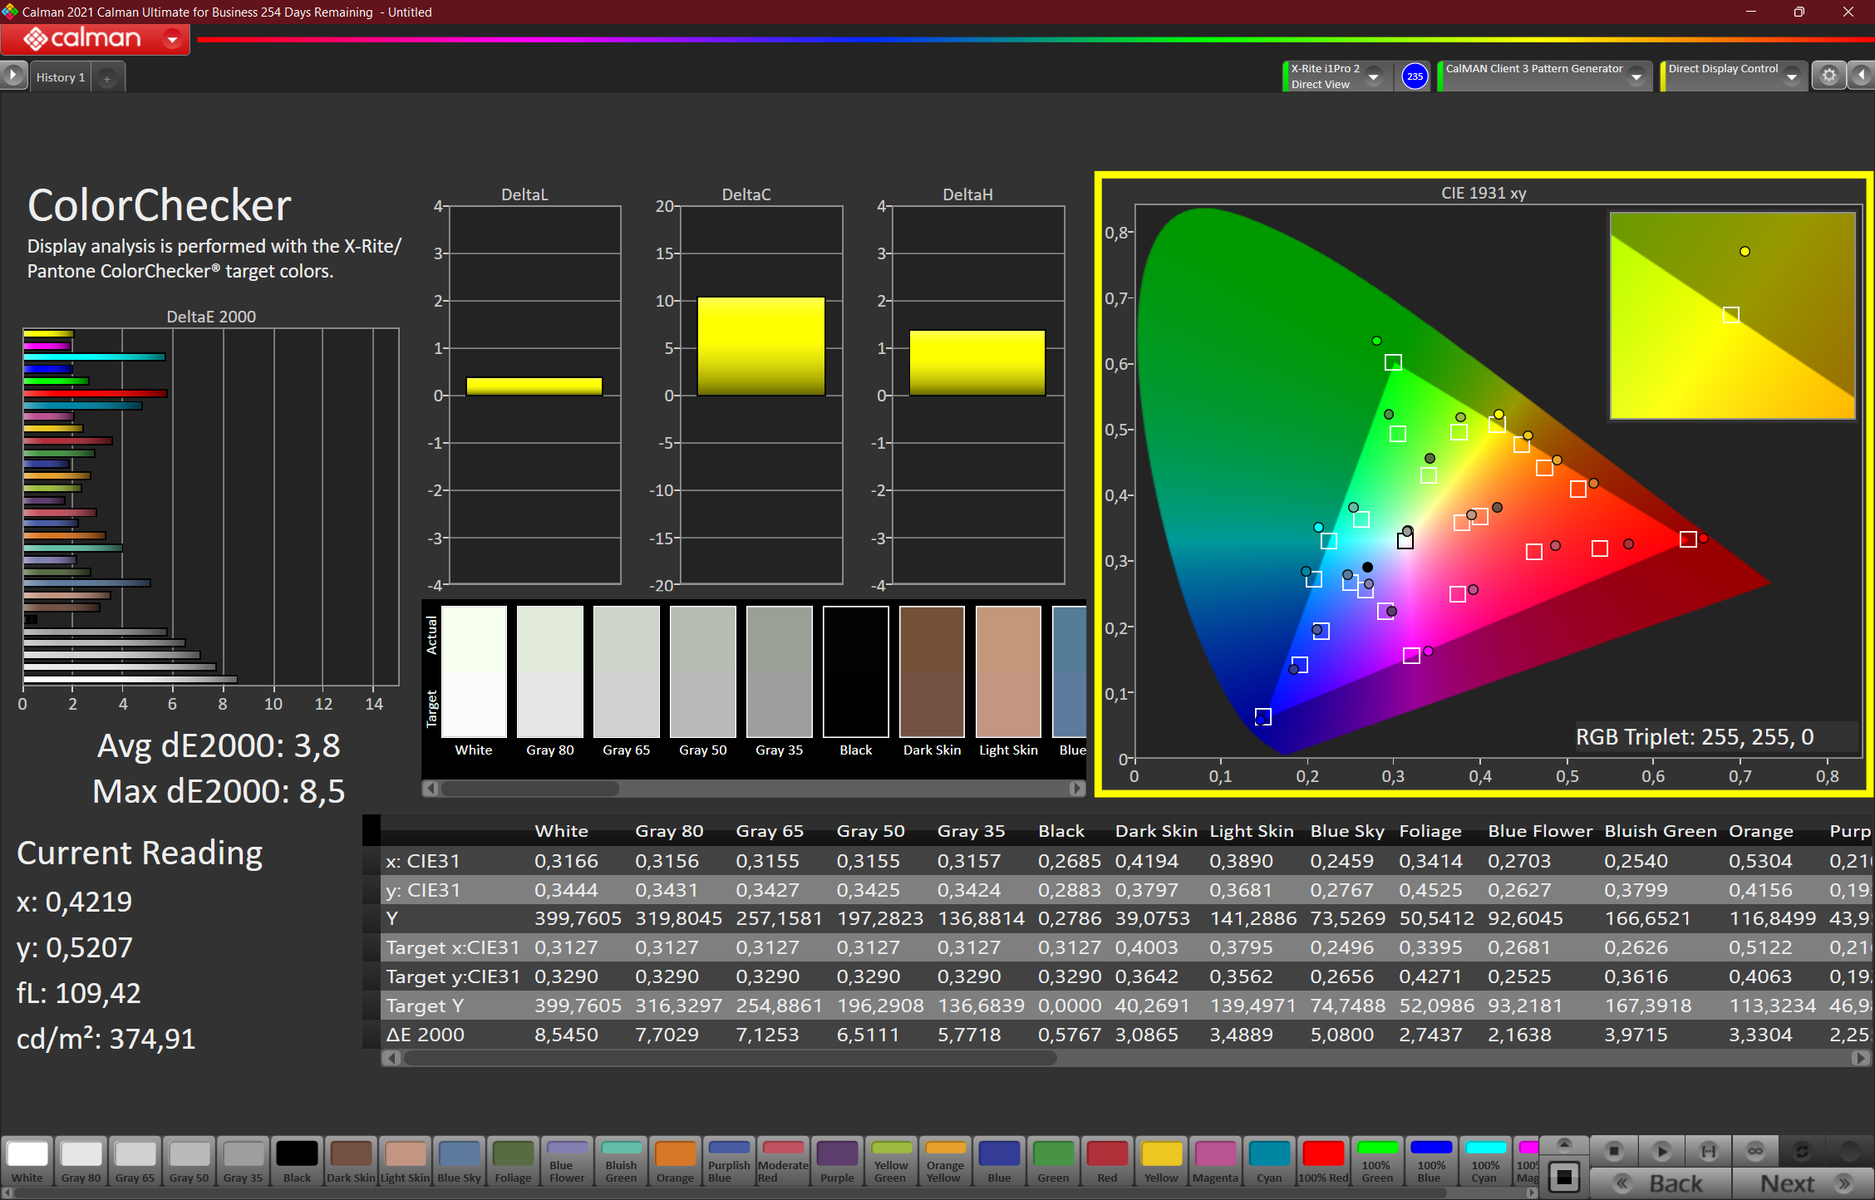
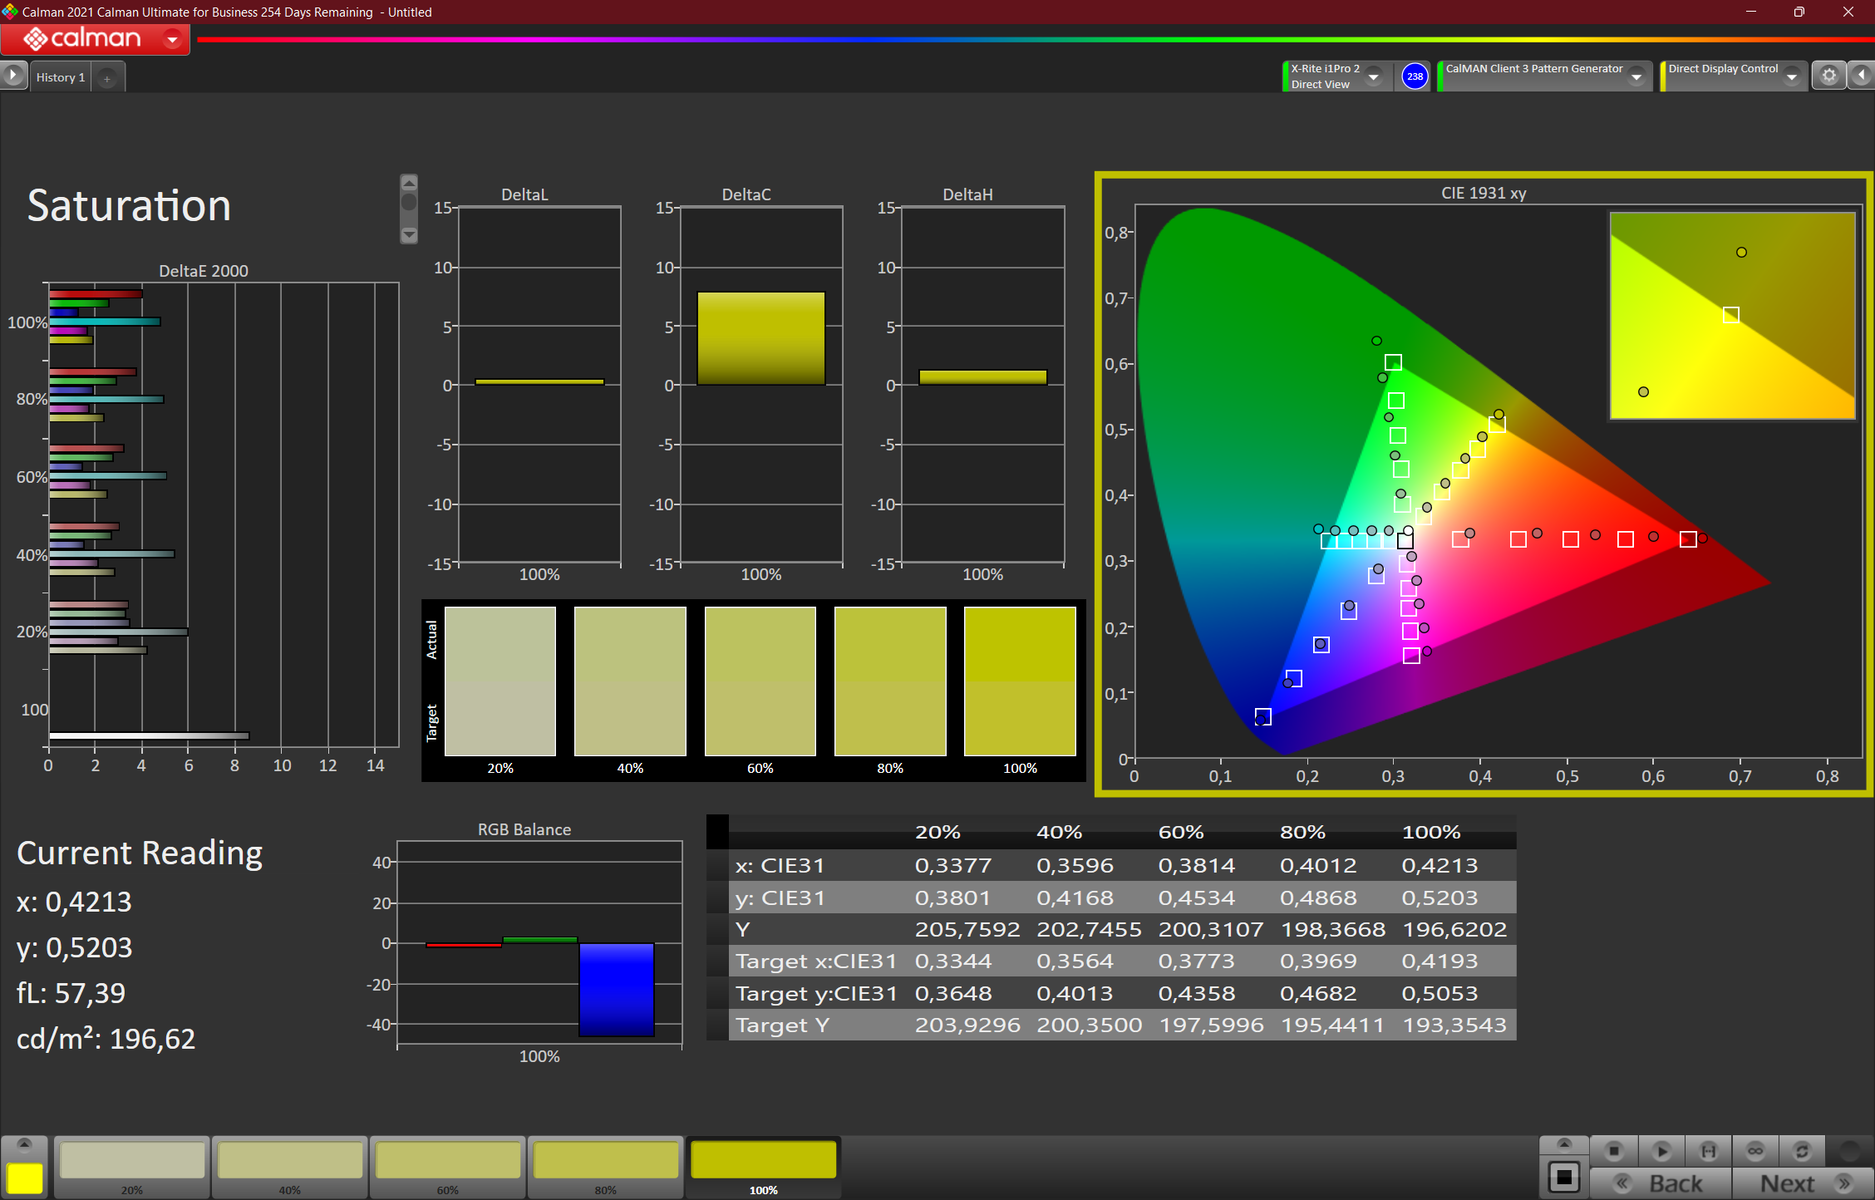
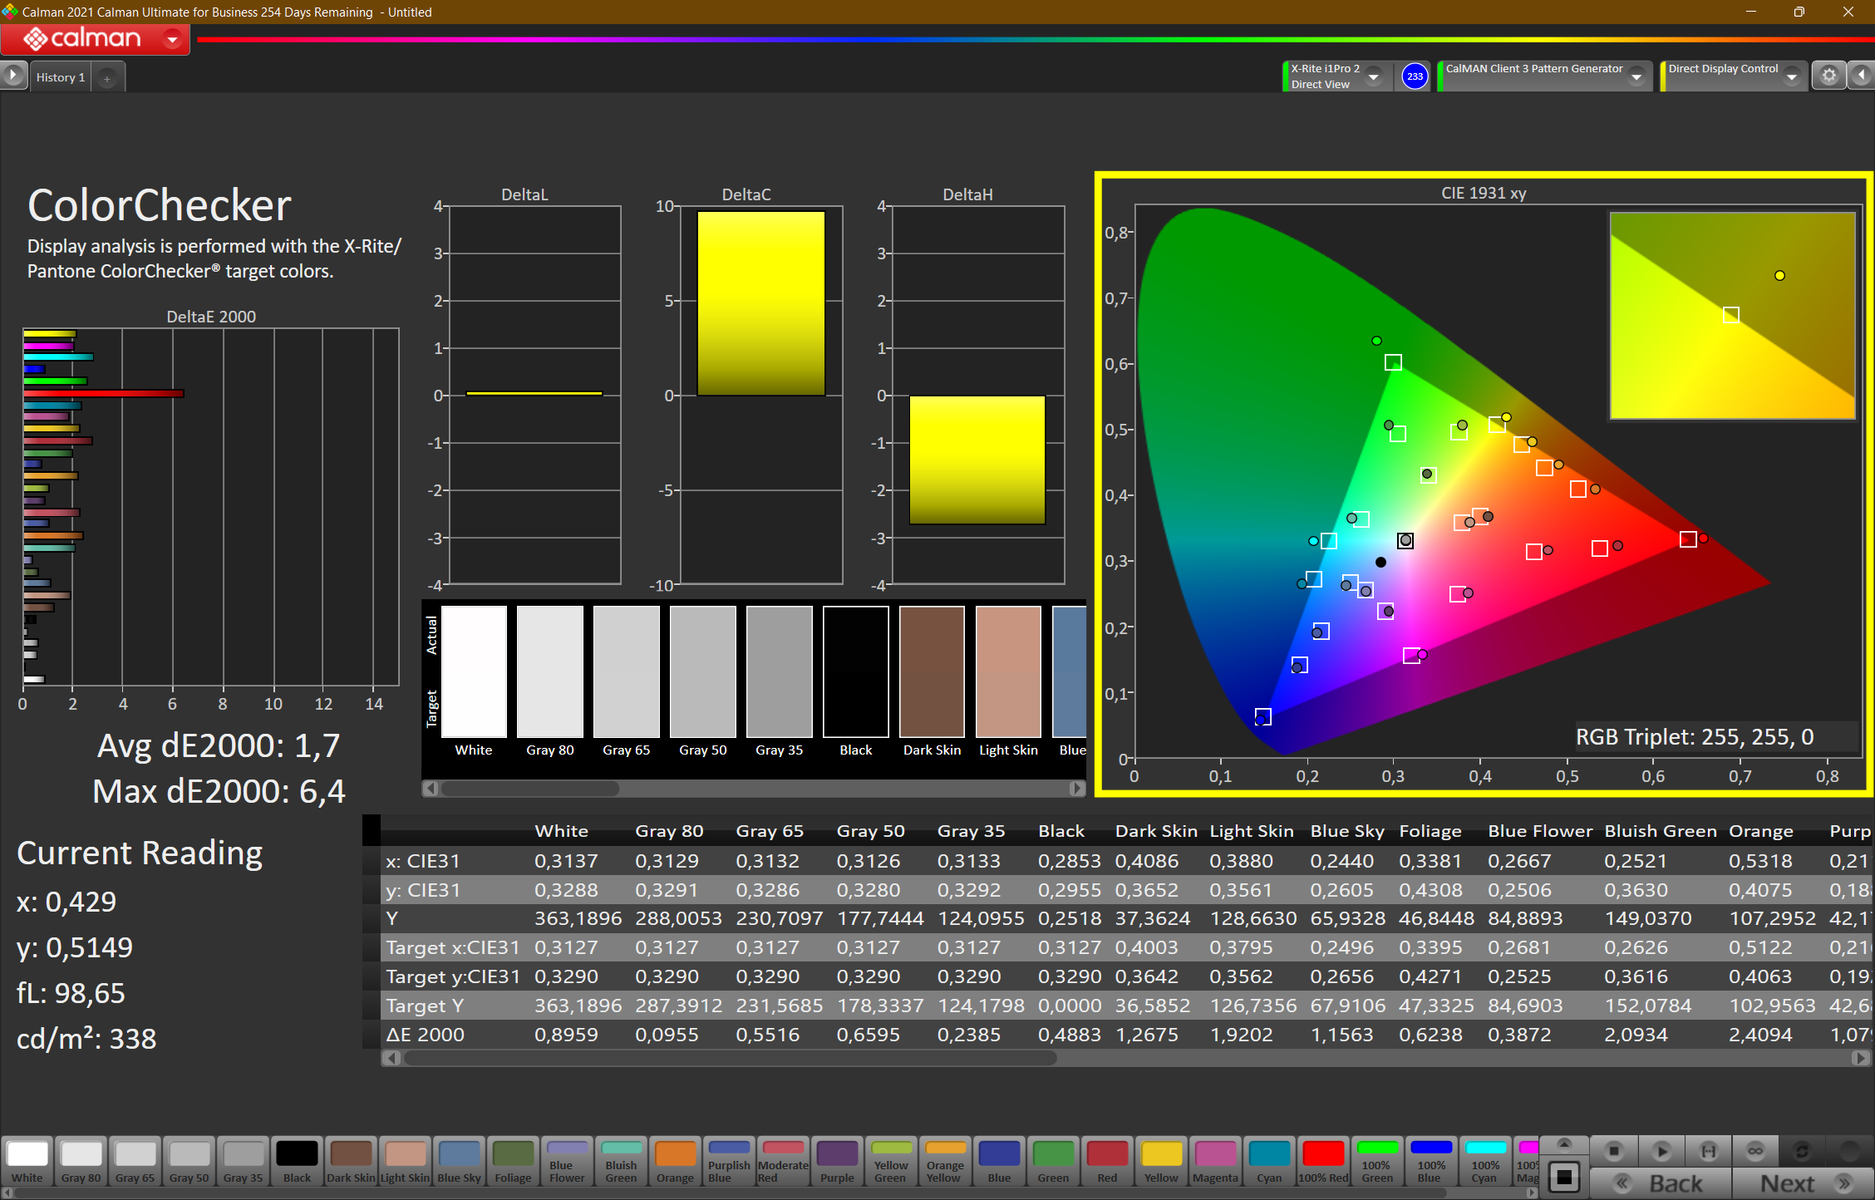
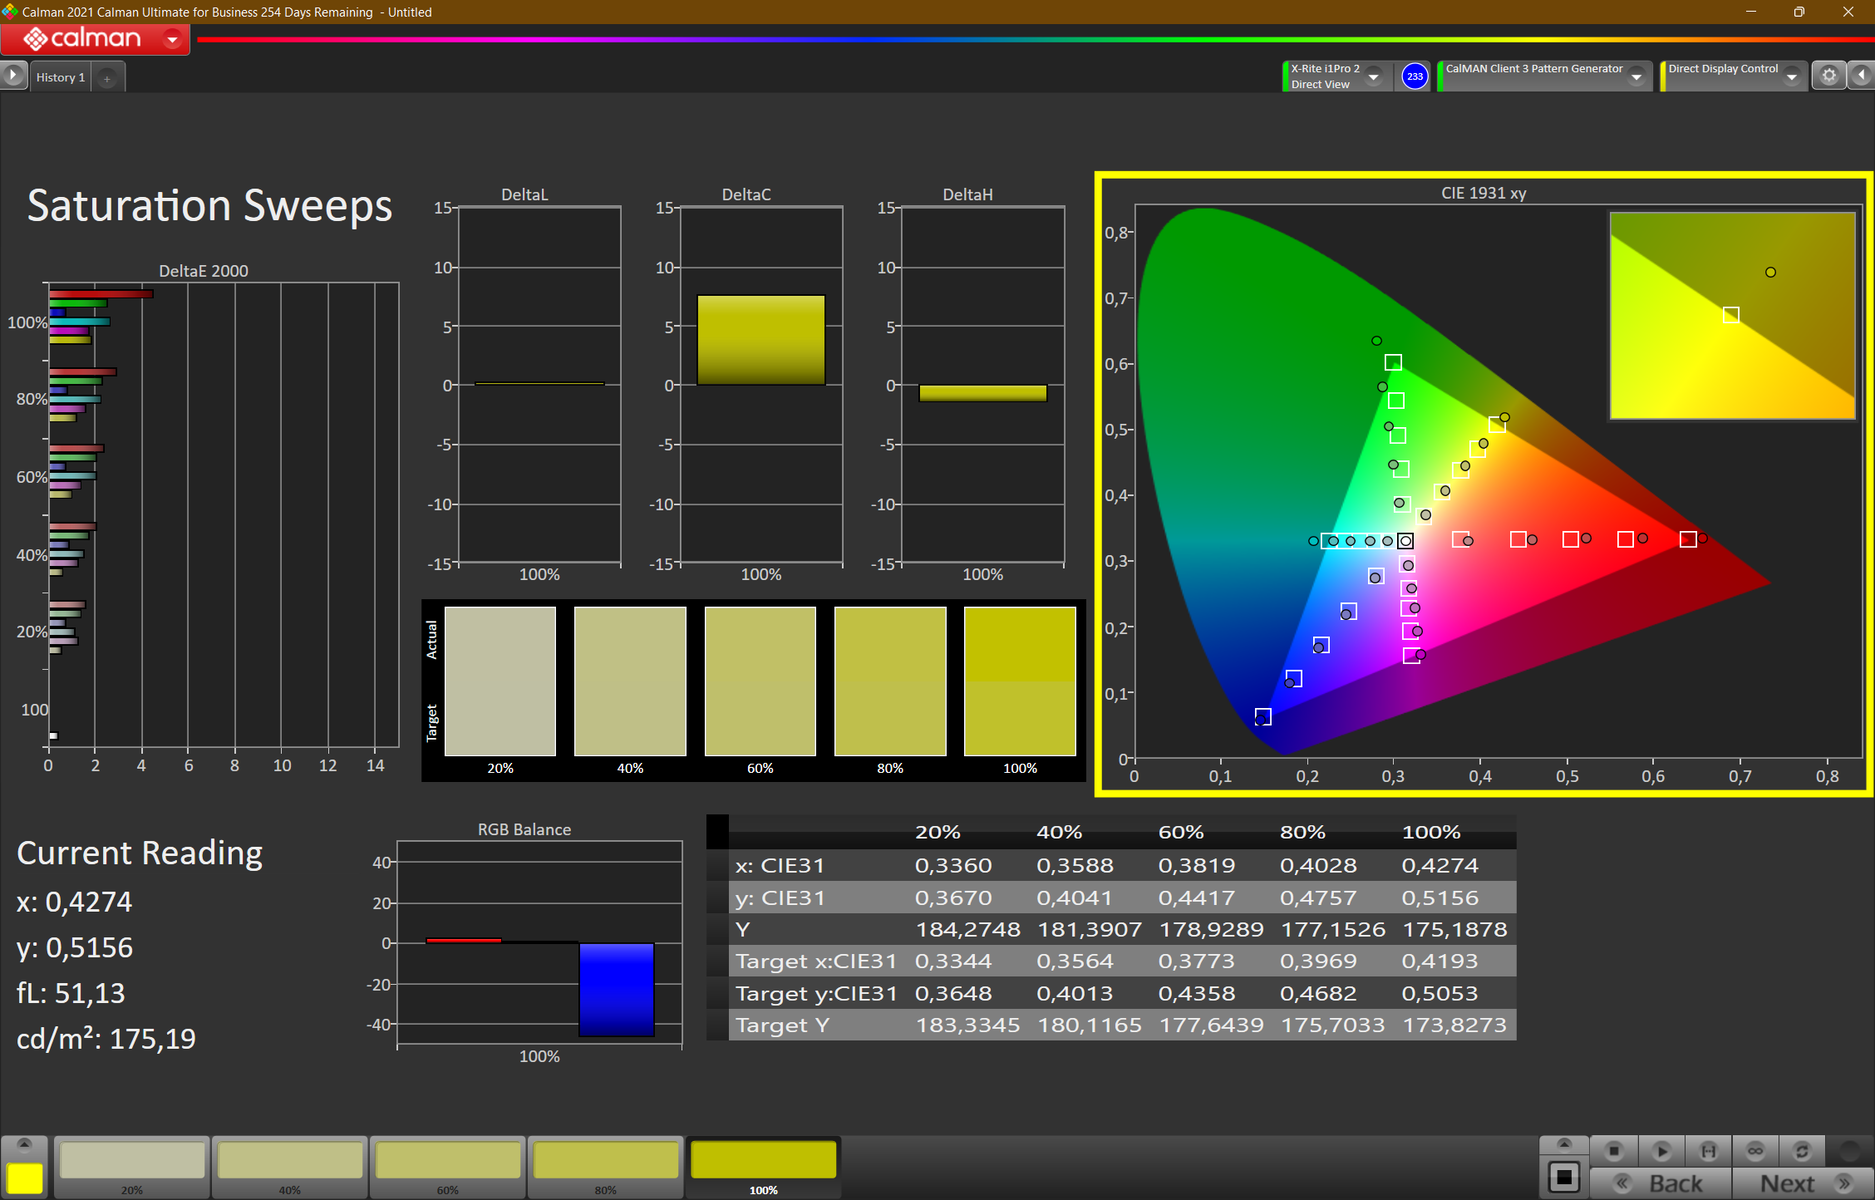
At 6,300K, the white point is close to the optimum of 6,500K. Colors are also relatively vivid and, according to our calibration, quite balanced. The DeltaE-2000 decreases from 3.9 to a very good 1.7 as a result, although red still deviates strongly.
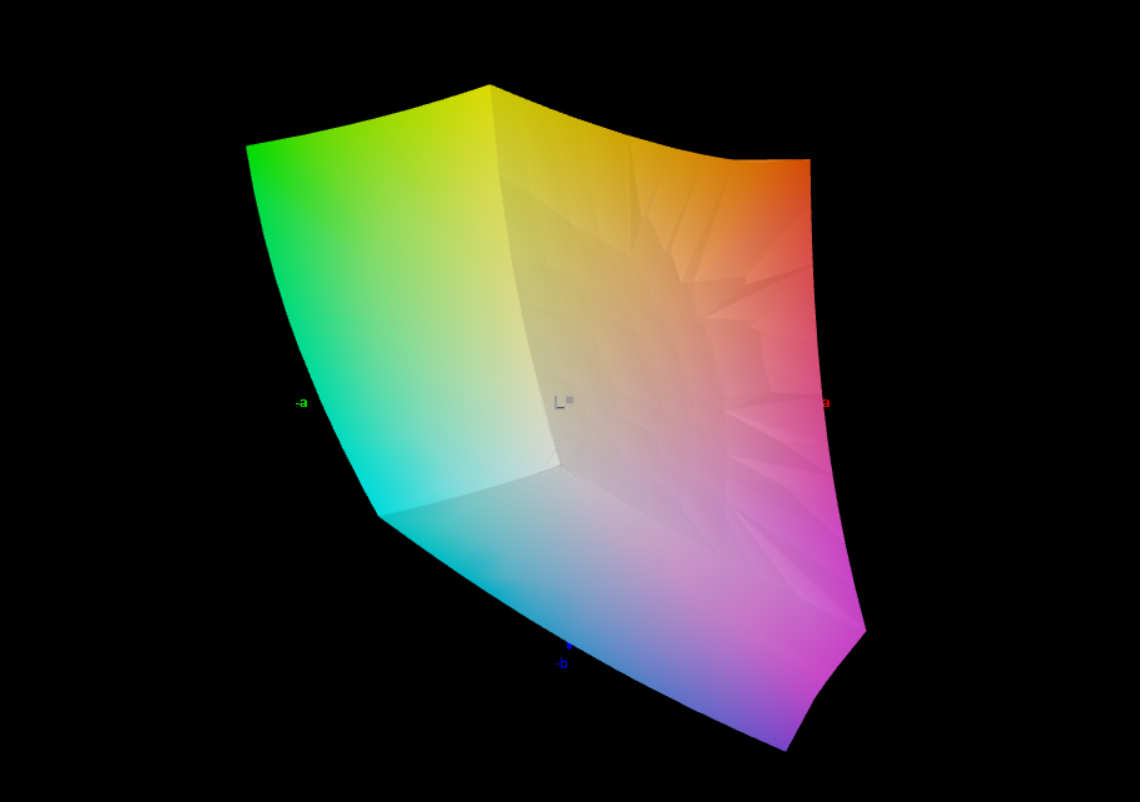
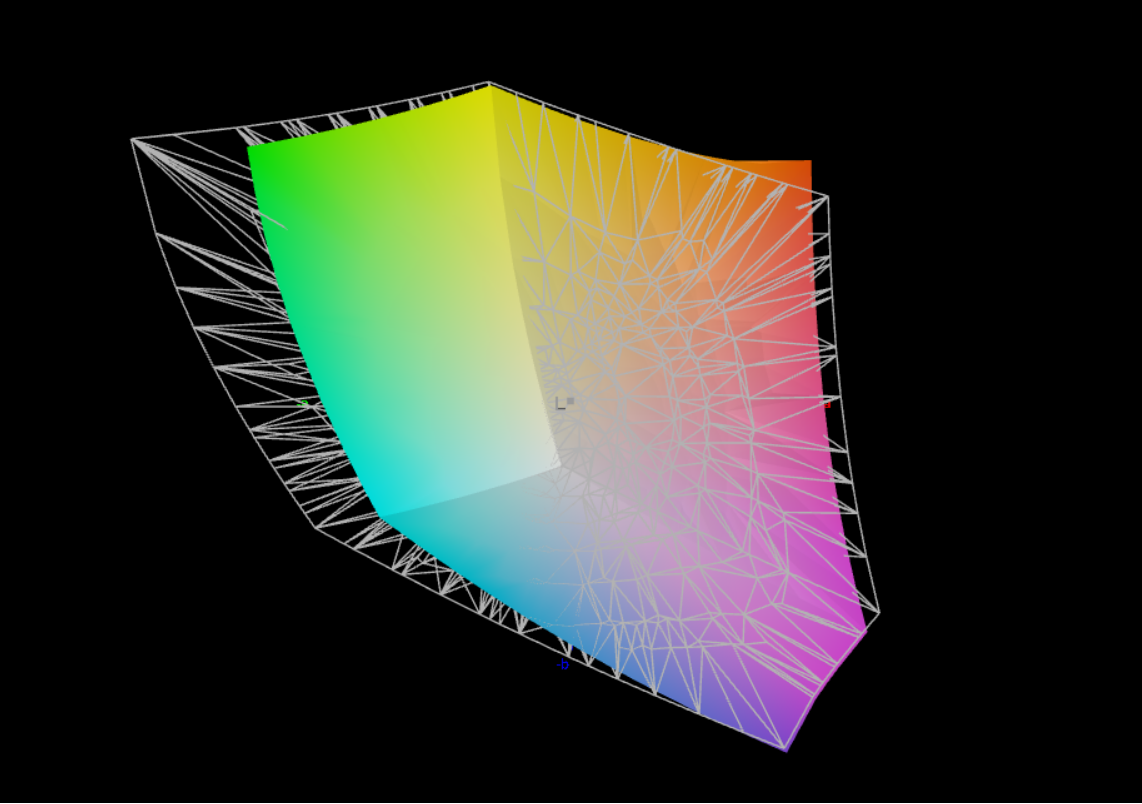
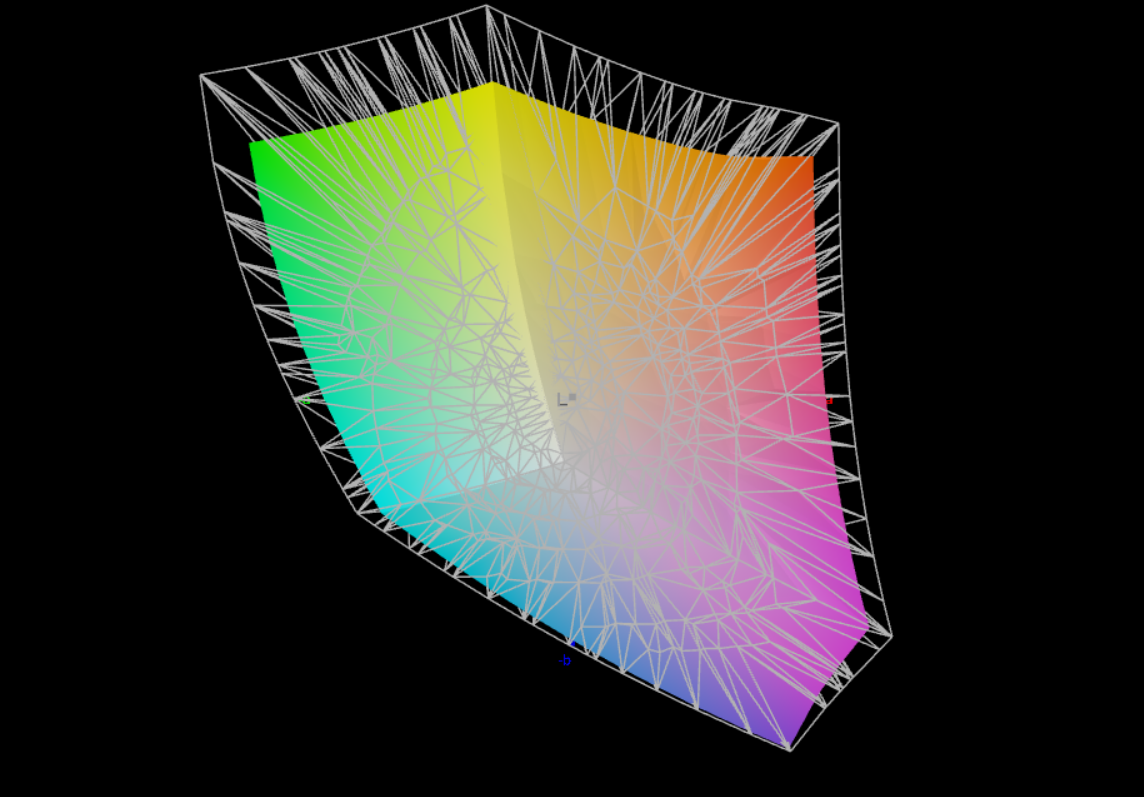
The sRGB color space is covered at 100%, which is sufficient for less demanding image editing. No PWM flickering was detected. As always, our color profile can be downloaded to the right of the illumination graphic. Three alternative displays are offered, with the 2.5K panel being new. Unfortunately, a 4K UHD option with 100% DCI-P3 is no longer available. In our comparison field, the FHD+ LP panel performs best.
- WUXGA (1920x1200) IPS, Touch, Matte, 300 cd/m², 45% NTSC
- WUXGA (1920x1200) IPS, low power, matt, 400 cd/m², 100% sRGB, low blue light
- WUXGA (1920x1200) IPS, matte, touch, PrivacyGuard, 500 cd/m², 100% sRGB
- WQXGA (2,560x1,600) IPS, matt, low power, 400 cd/m², 100% sRGB, low blue light
| |||||||||||||||||||||||||
Brightness Distribution: 80 %
Center on Battery: 404 cd/m²
Contrast: 1393:1 (Black: 0.29 cd/m²)
ΔE ColorChecker Calman: 3.9 | ∀{0.5-29.43 Ø4.81}
calibrated: 1.7
ΔE Greyscale Calman: 5.4 | ∀{0.09-98 Ø5.1}
80.5% AdobeRGB 1998 (Argyll 3D)
100% sRGB (Argyll 3D)
80.1% Display P3 (Argyll 3D)
Gamma: 2.21
CCT: 6242 K
| Lenovo ThinkPad T16 G1 21BWS00200 B160UAN01.K, IPS, 1920x1200, 16" | Lenovo ThinkPad T15 Gen2-20W5S00100 B156HAN02.1, IPS, 1920x1080, 15.6" | Huawei MateBook D 16 2022 BOE NV160WUM-NH0, IPS, 1920x1200, 16" | Dell Inspiron 16 Plus 7620 BOE NE16N41, IPS, 3072x1920, 16" | HP ZBook Power 15 G8 313S5EA AUOA08B, IPS LED, 1920x1080, 15.6" | HP ProBook 450 G9 6A180EA Chi Mei CMN1512, , 1920x1080, 15.6" | Lenovo ThinkPad E15 G3-20YG003UGE B156HAN02.1, IPS, 1920x1080, 15.6" | Lenovo ThinkPad L15 G2 AMD N156HCA-EAB, IPS LED, 1920x1080, 15.6" | |
|---|---|---|---|---|---|---|---|---|
| Display | -46% | -12% | -7% | -8% | -43% | -46% | -41% | |
| Display P3 Coverage (%) | 80.1 | 40.18 -50% | 66.2 -17% | 70.8 -12% | 70.5 -12% | 42.76 -47% | 40.3 -50% | 43.8 -45% |
| sRGB Coverage (%) | 100 | 60.2 -40% | 96.4 -4% | 99.5 0% | 99 -1% | 63.9 -36% | 60.2 -40% | 65.7 -34% |
| AdobeRGB 1998 Coverage (%) | 80.5 | 41.55 -48% | 68.3 -15% | 73.2 -9% | 71.3 -11% | 44.2 -45% | 41.6 -48% | 45.3 -44% |
| Response Times | -85% | -12% | -53% | -125% | -11% | -71% | -62% | |
| Response Time Grey 50% / Grey 80% * (ms) | 27 ? | 48.8 ? -81% | 30.5 ? -13% | 38 ? -41% | 61 -126% | 28 ? -4% | 44 ? -63% | 40 -48% |
| Response Time Black / White * (ms) | 17 ? | 32 ? -88% | 18.7 ? -10% | 28 ? -65% | 38 ? -124% | 20 ? -18% | 30.4 ? -79% | 30 -76% |
| PWM Frequency (Hz) | ||||||||
| Screen | -39% | 7% | 22% | 25% | -34% | -27% | -18% | |
| Brightness middle (cd/m²) | 404 | 353 -13% | 319 -21% | 288.9 -28% | 393 -3% | 234 -42% | 347 -14% | 298 -26% |
| Brightness (cd/m²) | 391 | 348 -11% | 317 -19% | 276 -29% | 385 -2% | 218 -44% | 329 -16% | 276 -29% |
| Brightness Distribution (%) | 80 | 95 19% | 90 13% | 92 15% | 78 -2% | 85 6% | 93 16% | 86 8% |
| Black Level * (cd/m²) | 0.29 | 0.2 31% | 0.23 21% | 0.26 10% | 0.25 14% | 0.17 41% | 0.25 14% | 0.26 10% |
| Contrast (:1) | 1393 | 1765 27% | 1387 0% | 1111 -20% | 1572 13% | 1376 -1% | 1388 0% | 1146 -18% |
| Colorchecker dE 2000 * | 3.9 | 6.1 -56% | 3.4 13% | 1.88 52% | 1.5 62% | 5.04 -29% | 4.7 -21% | 3.7 5% |
| Colorchecker dE 2000 max. * | 8.5 | 23.5 -176% | 8.1 5% | 4.37 49% | 4.3 49% | 18.04 -112% | 19.4 -128% | 15 -76% |
| Colorchecker dE 2000 calibrated * | 1.7 | 4.9 -188% | 0.8 53% | 0.42 75% | 1.4 18% | 4.13 -143% | 4.4 -159% | 3.5 -106% |
| Greyscale dE 2000 * | 5.4 | 4.6 15% | 5.7 -6% | 1.4 74% | 1.3 76% | 4.43 18% | 1.7 69% | 1.7 69% |
| Gamma | 2.21 100% | 2.26 97% | 2.1 105% | 2.3 96% | 2.26 97% | 2.41 91% | 2.2 100% | 2.21 100% |
| CCT | 6242 104% | 6732 97% | 7433 87% | 6634 98% | 6435 101% | 6350 102% | 6475 100% | 6588 99% |
| Color Space (Percent of AdobeRGB 1998) (%) | 38.2 | |||||||
| Color Space (Percent of sRGB) (%) | 59.8 | |||||||
| Total Average (Program / Settings) | -57% /
-47% | -6% /
0% | -13% /
5% | -36% /
-4% | -29% /
-33% | -48% /
-37% | -40% /
-29% |
* ... smaller is better
Display Response Times
| ↔ Response Time Black to White | ||
|---|---|---|
| 17 ms ... rise ↗ and fall ↘ combined | ↗ 8 ms rise | 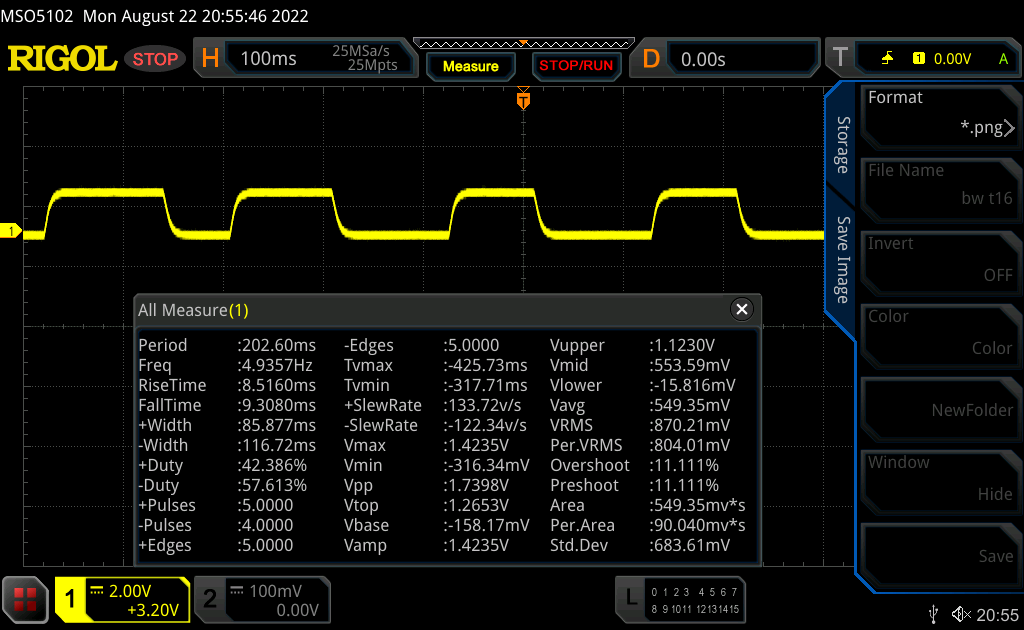 |
| ↘ 9 ms fall | ||
| The screen shows good response rates in our tests, but may be too slow for competitive gamers. In comparison, all tested devices range from 0.1 (minimum) to 240 (maximum) ms. » 37 % of all devices are better. This means that the measured response time is better than the average of all tested devices (20.4 ms). | ||
| ↔ Response Time 50% Grey to 80% Grey | ||
| 27 ms ... rise ↗ and fall ↘ combined | ↗ 12 ms rise | 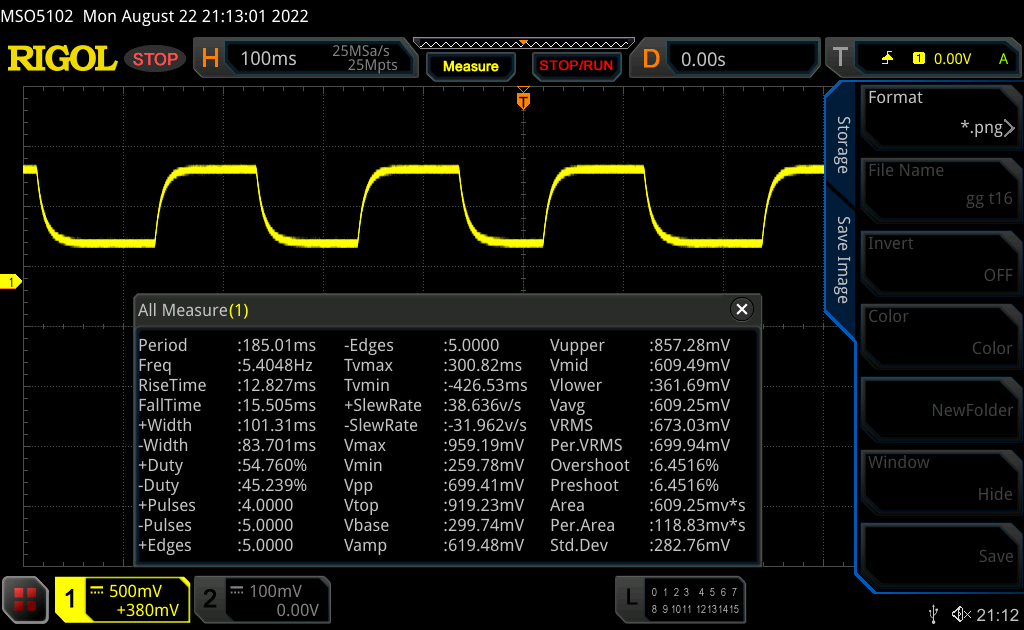 |
| ↘ 15 ms fall | ||
| The screen shows relatively slow response rates in our tests and may be too slow for gamers. In comparison, all tested devices range from 0.165 (minimum) to 636 (maximum) ms. » 35 % of all devices are better. This means that the measured response time is better than the average of all tested devices (31.9 ms). | ||
Screen Flickering / PWM (Pulse-Width Modulation)
| Screen flickering / PWM not detected | 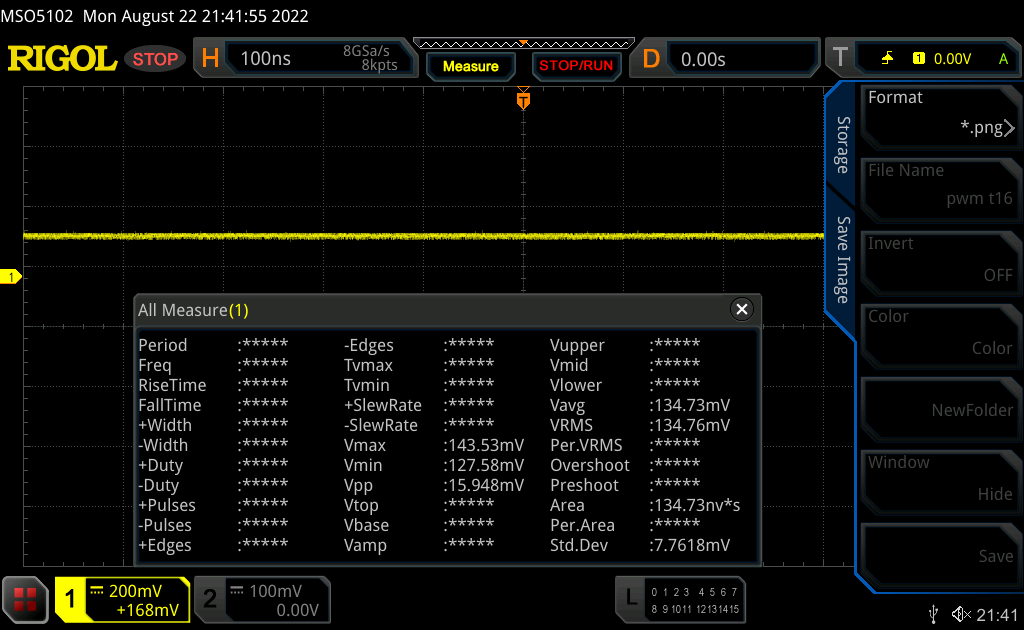 | ||
In comparison: 53 % of all tested devices do not use PWM to dim the display. If PWM was detected, an average of 8256 (minimum: 5 - maximum: 343500) Hz was measured. | |||
Outdoors, the matte display is easy to read at an average of 390 nits. However, you should avoid direct sunlight.


Performance - Lenovo limits with artificial throttling
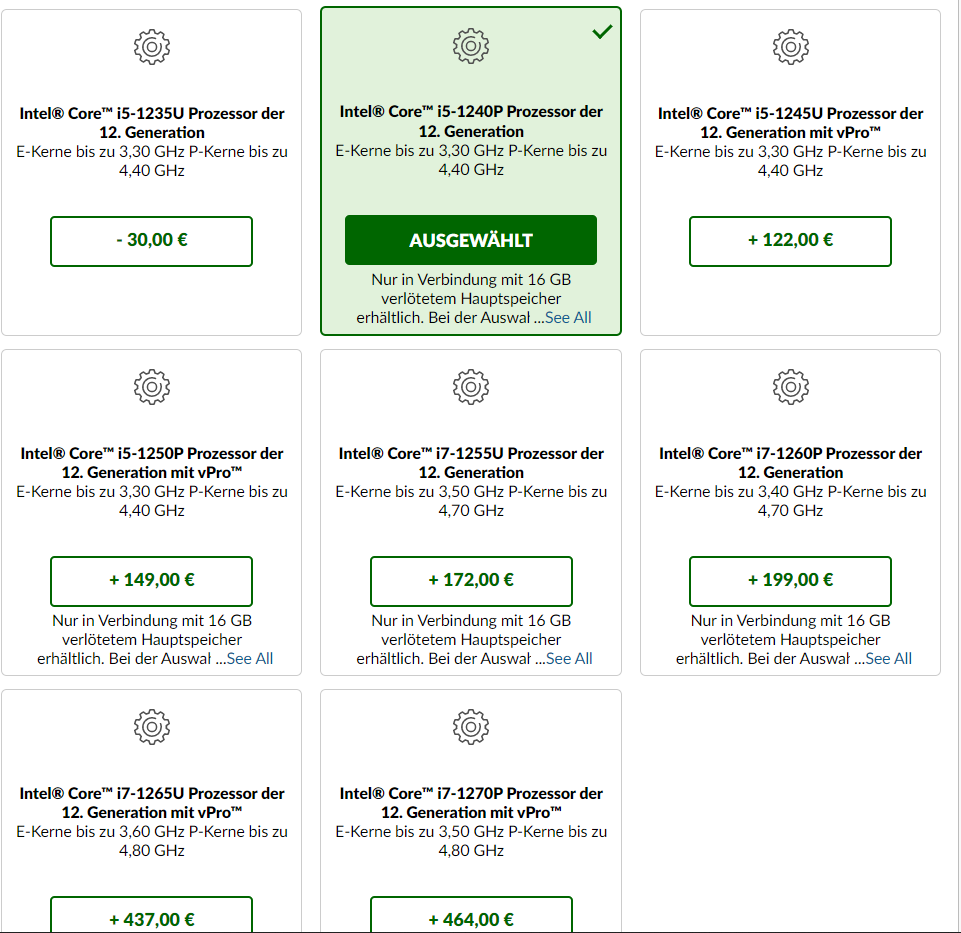
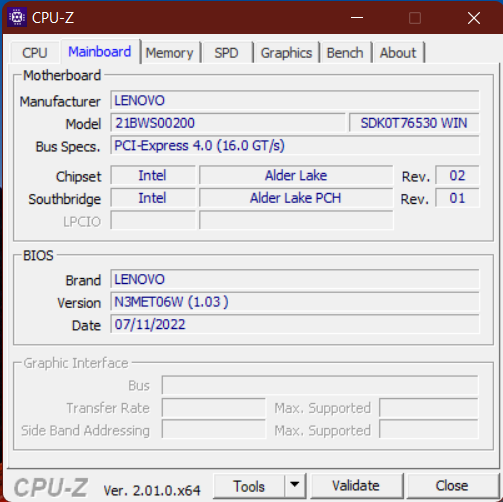
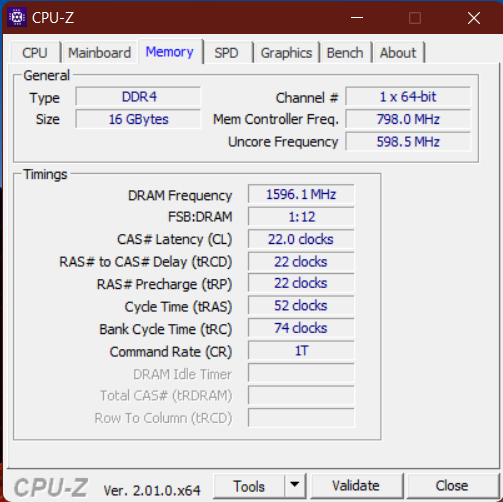
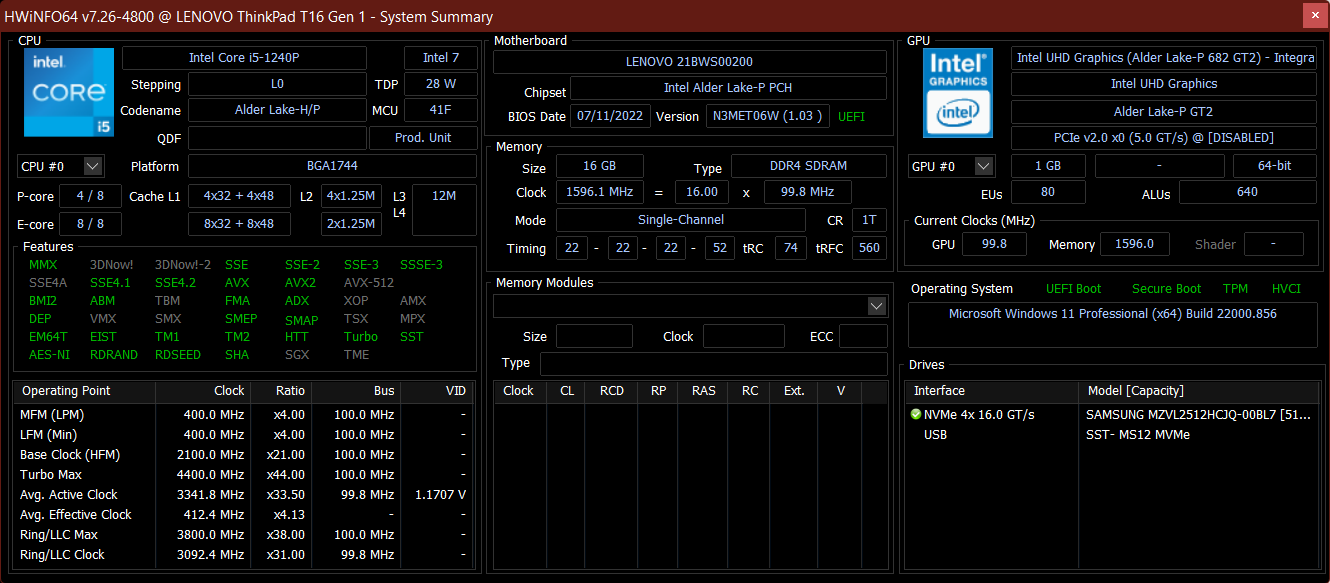
Our model is equipped with 16 GB of soldered DDR4-3200 RAM (single channel) and is powered by Intel's Core i5-1240P with an integrated graphics unit. In addition, there is a 512 GB SSD in the PCIe 4.0 standard. The system is intended for office tasks and other typical business tasks.
It is not intended for video editing and gaming and is only available in alternative configurations with the GeForce MX550, more RAM (in free SODIMM) and possibly a stronger CPU (i7-1280P). Since there are also models with AMD this year, this option is worth considering. We will endeavour to review such a model as well.
Testing Conditions
Lenovo does not offer its own power profiles for its ThinkPads, but integrates them into the Windows energy settings. The auto mode of "intelligent cooling" can be disabled with "Fn+T". Performance-related benchmarks were carried out under the maximum performance profile with Auto mode disabled.
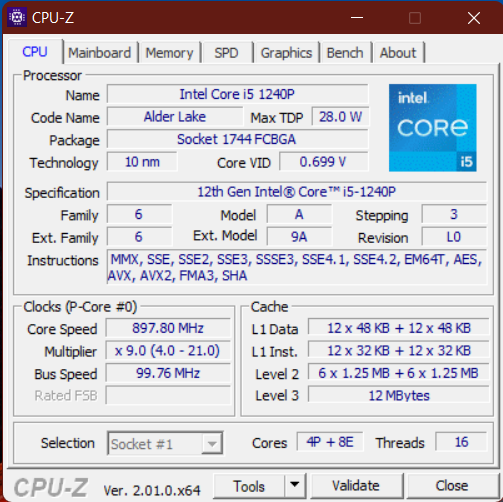
Processor
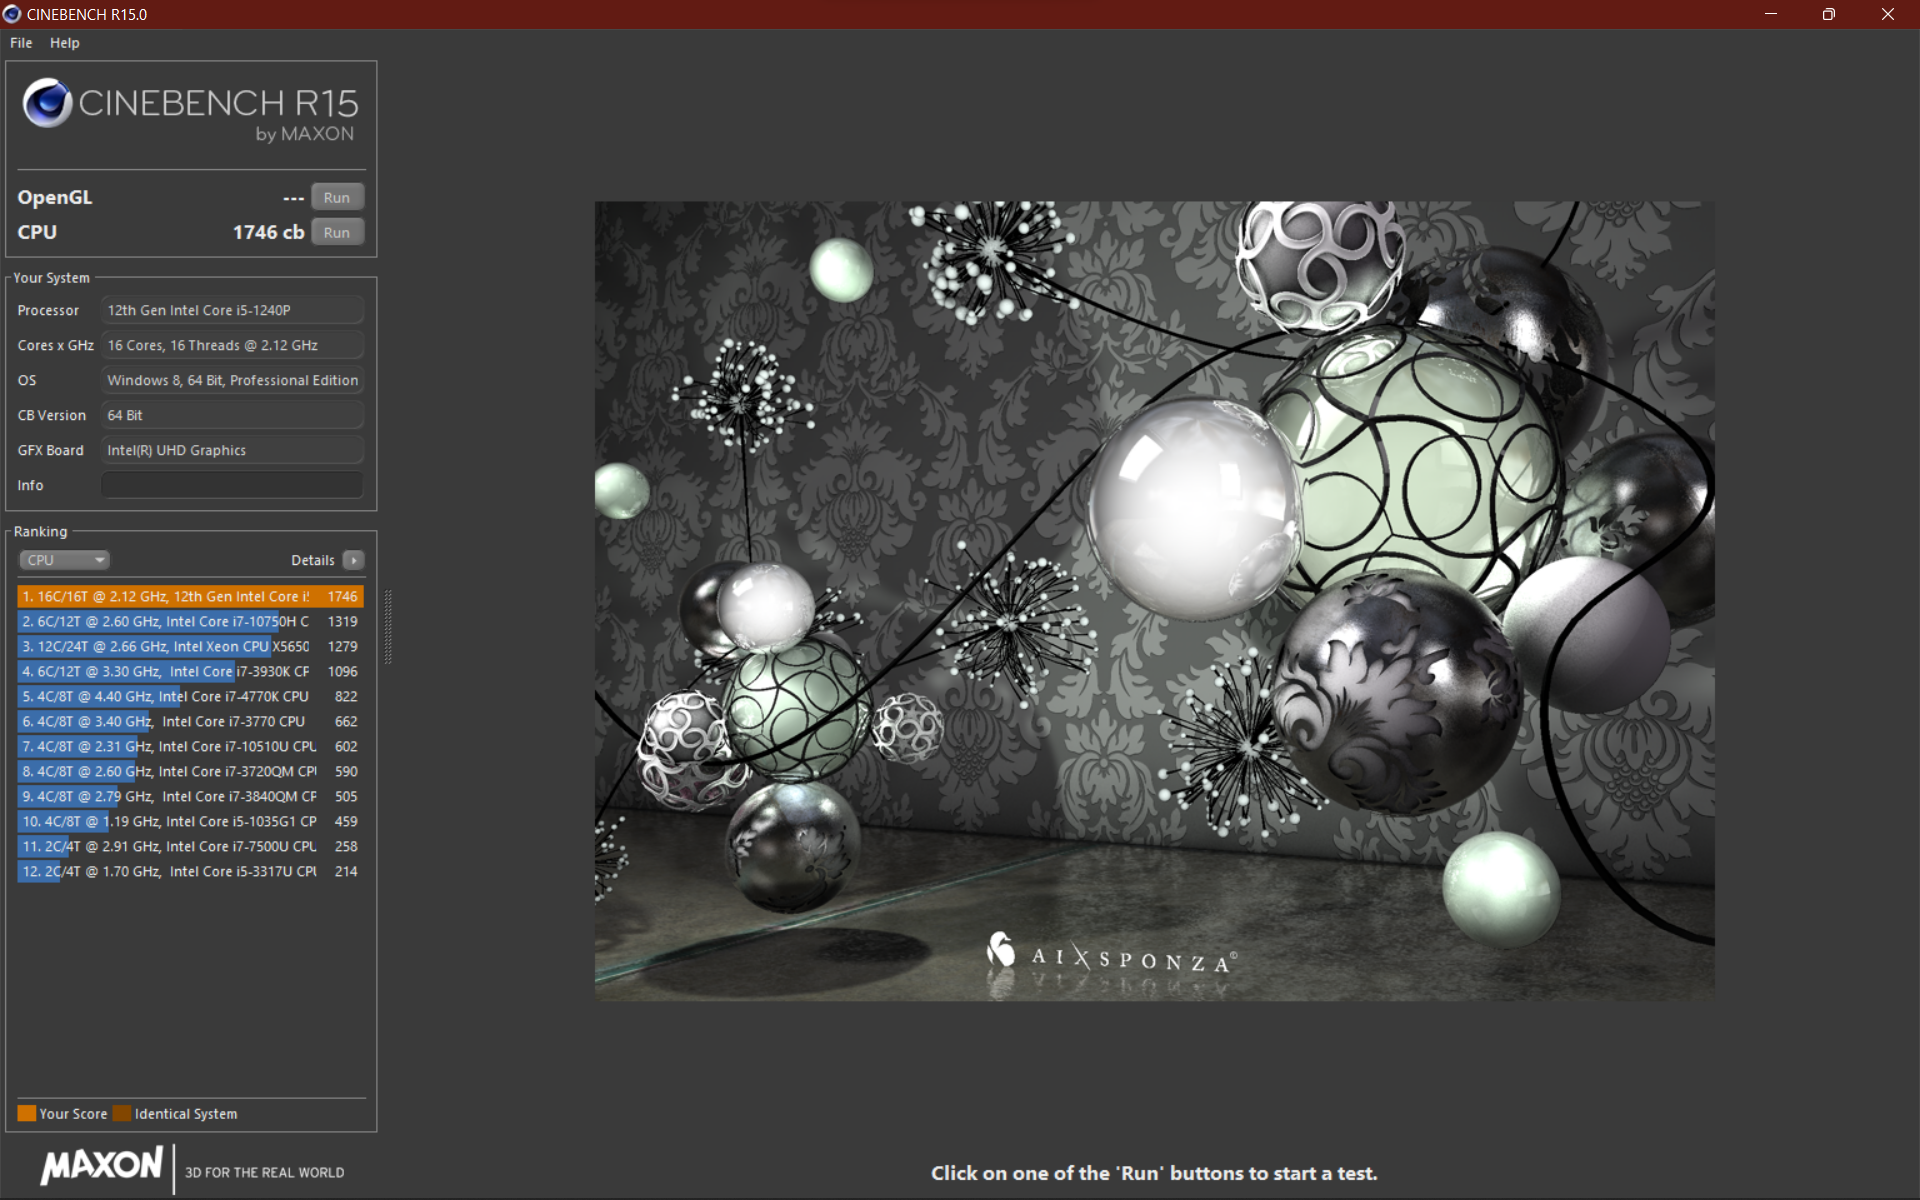
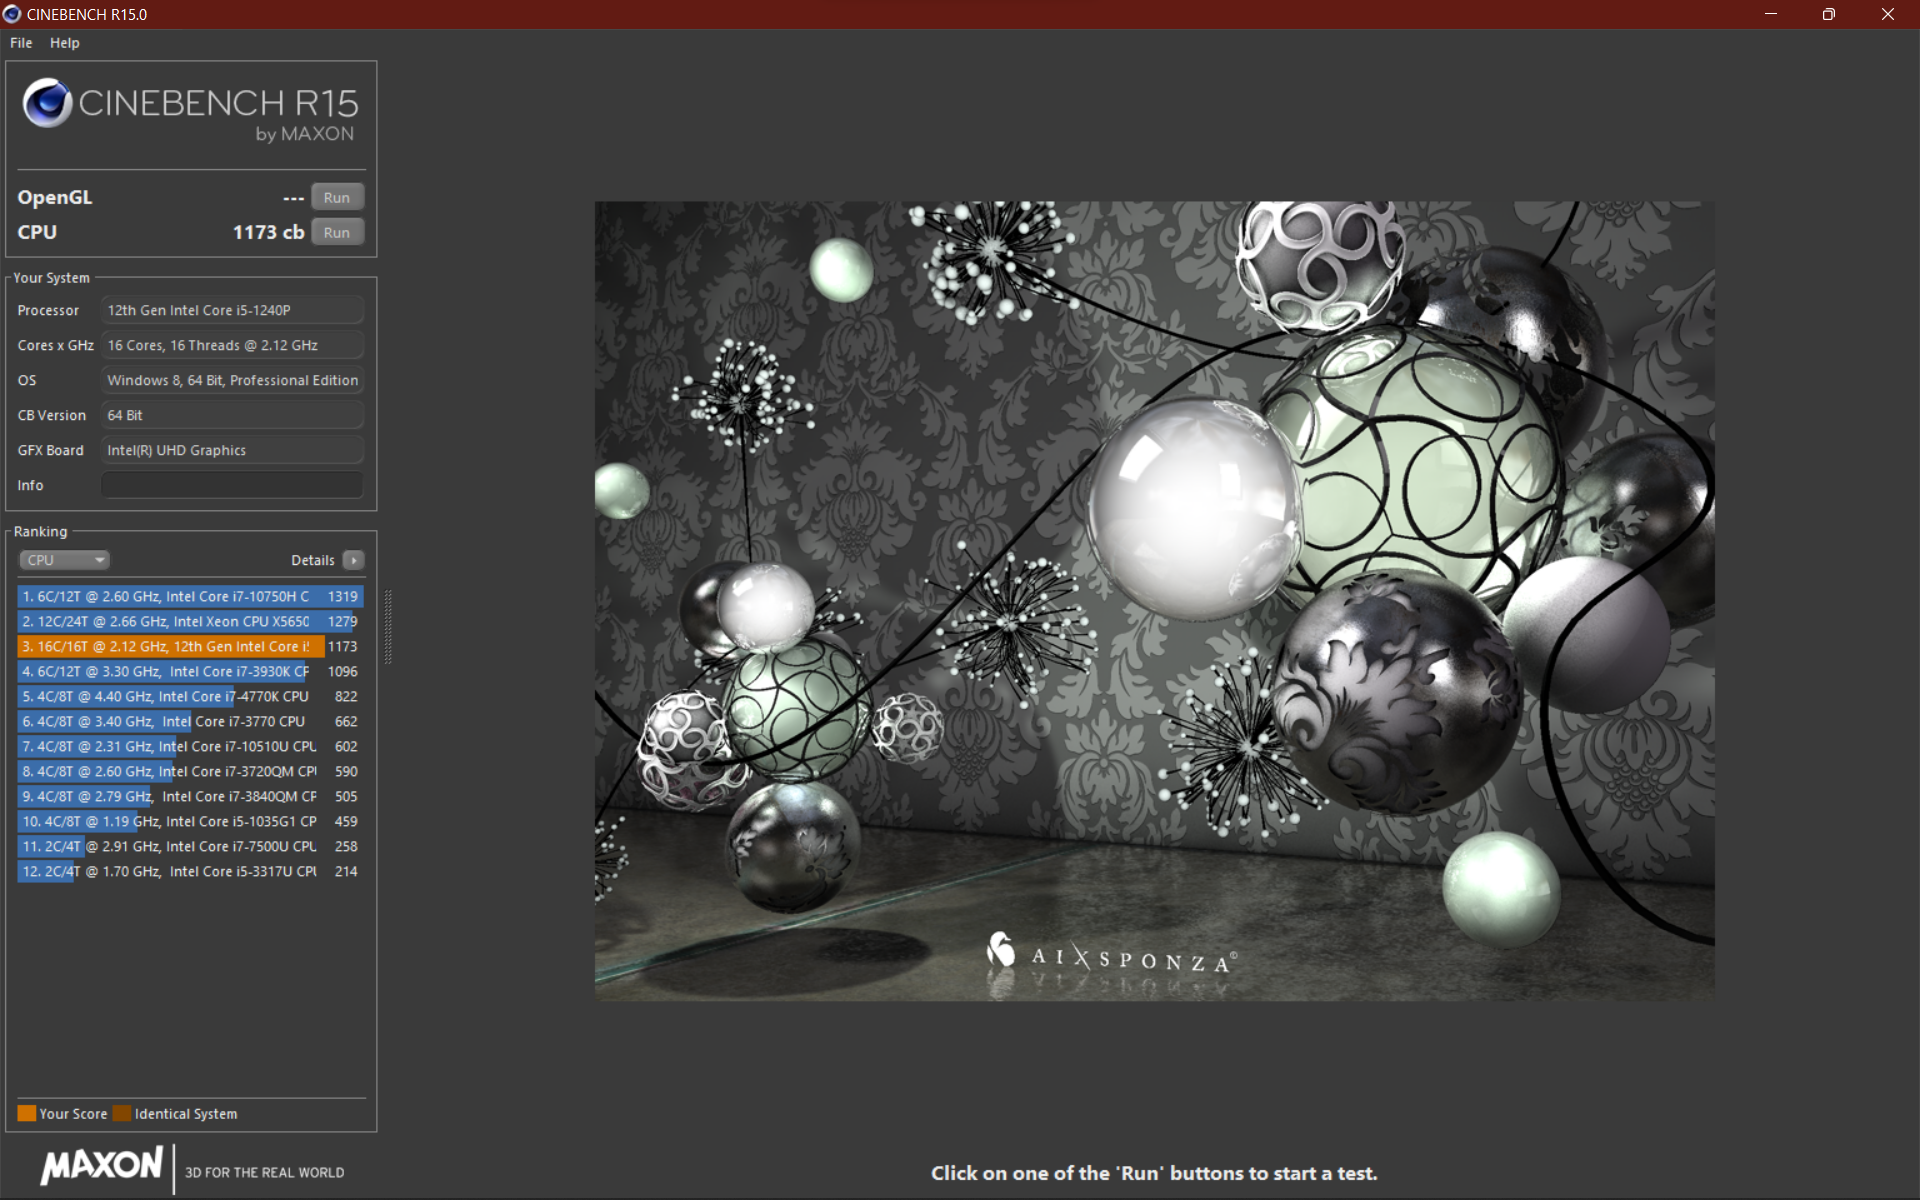
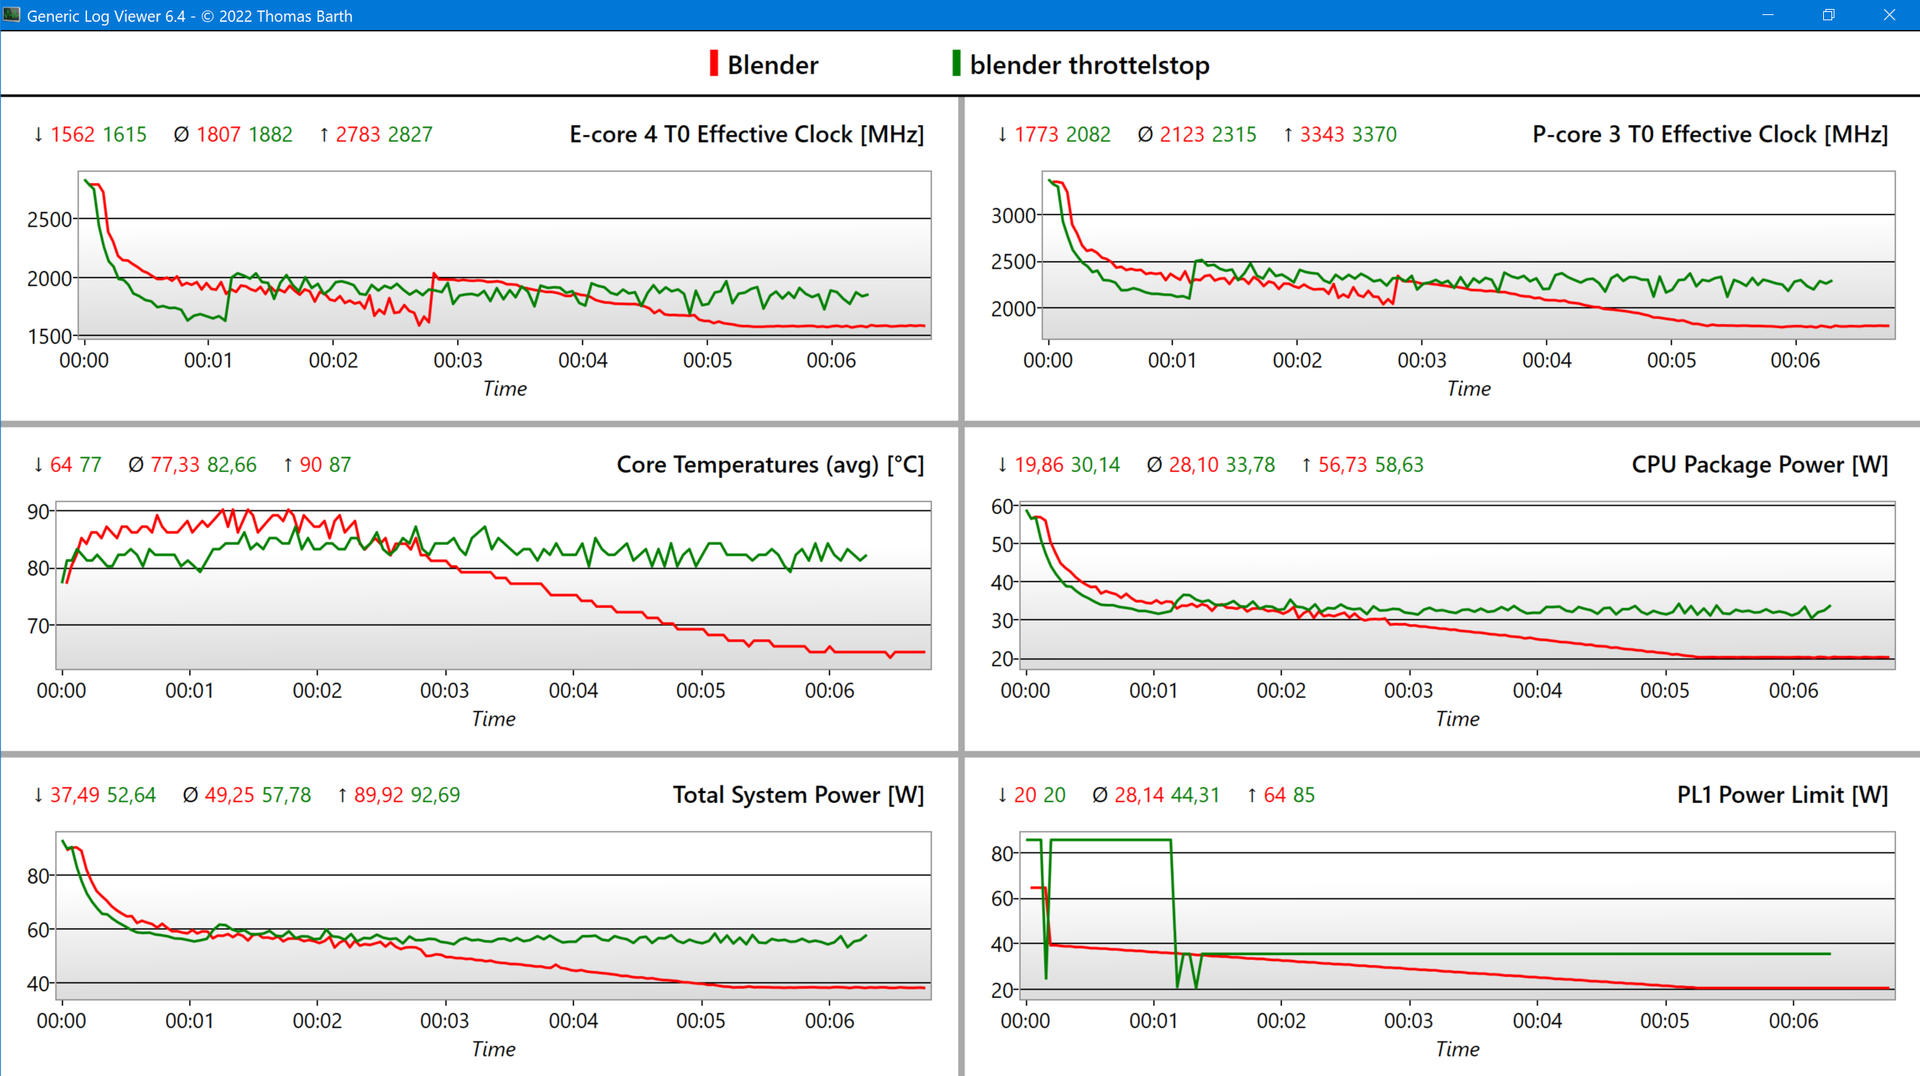
The Intel Core i5-1240P is a 12-core CPU with 4 performance and 8 efficiency cores. The TDP of 28 W is being used for the first time in Lenovo's T-series. However, our tests reveal that Lenovo limits PL1 to 20 watts, while the 12-second short turbo (PL2) is 59 watts.
The very low temperatures of 63 °C prove that this approach unnecessarily restricts performance and is just enough to reach the base clock of 1.7 GHz. This is incomprehensible, since the predecessor constantly runs at 35 watts. Consequently, this results in a sustained performance of only 15% above the predecessor, while the ThinkPad E15 with last year's Ryzen computes about 50% faster. On the other hand, the T16 is very fast in tasks that require short boosts.
If the throttling, which has been confirmed by many sources as also occurring in the T14 G3 (same motherboard), is not fixed via BIOS update in the future, AMD would probably be the better choice here, since the Ryzens can deliver far better results with little power.
In battery mode, the power is further limited to 10 watts, but "Max Performance on Battery" can be set in the BIOS, so that the result is more or less the same again. A total of 30 watts can be maintained using the "ThrottleStop" tool, but overriding the settings chosen by the manufacturer is not recommended.
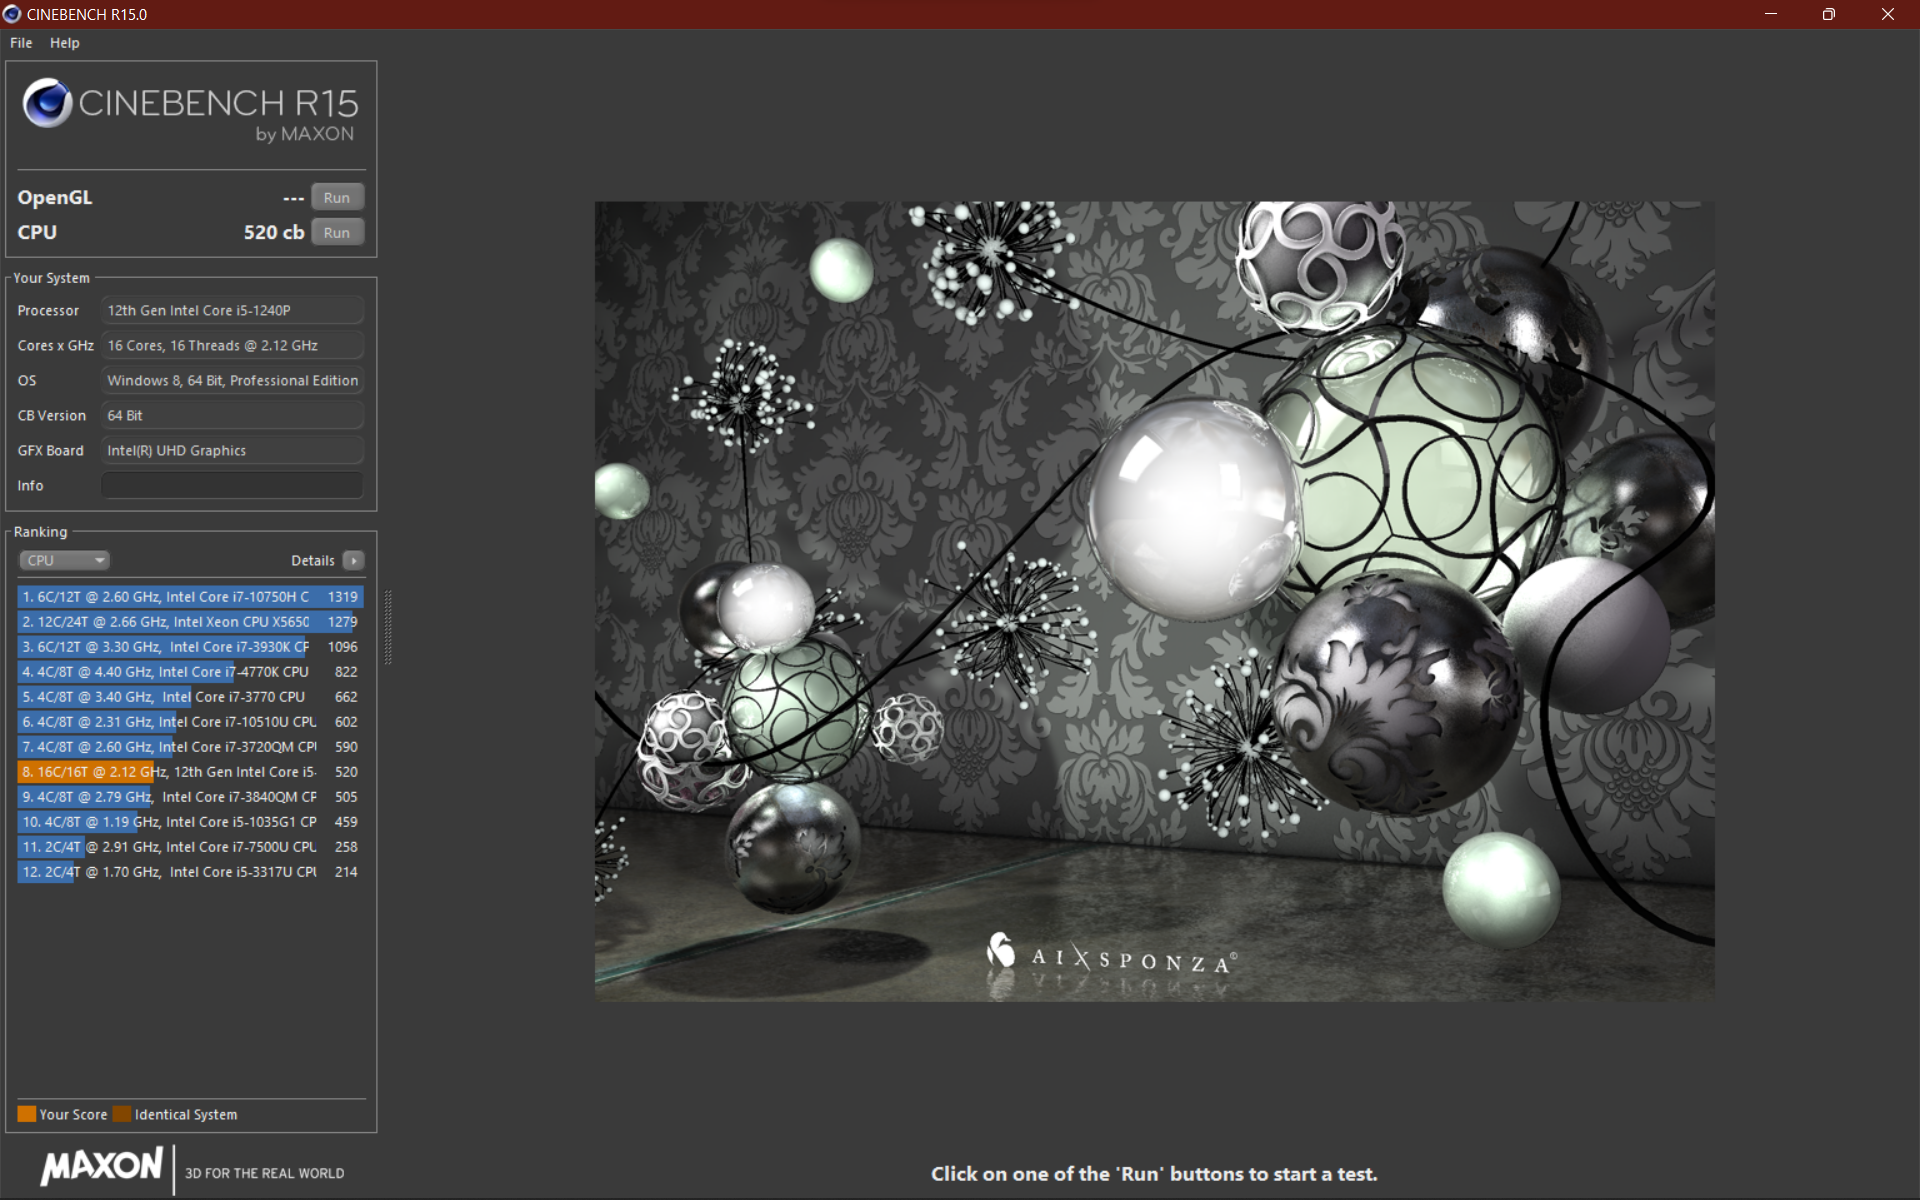

Cinebench R15 Multi Sustained Load
Cinebench R23: Multi Core | Single Core
Cinebench R20: CPU (Multi Core) | CPU (Single Core)
Cinebench R15: CPU Multi 64Bit | CPU Single 64Bit
Blender: v2.79 BMW27 CPU | v3.3 Classroom CPU
7-Zip 18.03: 7z b 4 | 7z b 4 -mmt1
Geekbench 5.5: Multi-Core | Single-Core
HWBOT x265 Benchmark v2.2: 4k Preset
LibreOffice : 20 Documents To PDF
R Benchmark 2.5: Overall mean
V-Ray 5 Benchmark: CPU
V-Ray Benchmark Next 4.10: CPU
| CPU Performance Rating | |
| Dell Inspiron 16 Plus 7620 -1! | |
| Huawei MateBook D 16 2022 -1! | |
| Asus Vivobook Pro 16X-M7600QE -2! | |
| Lenovo ThinkPad X1 Extreme G4-20Y5CTO1WW (3050 Ti) -2! | |
| HP ZBook Power 15 G8 313S5EA -2! | |
| Average of class Office | |
| Lenovo ThinkPad T16 G1 21BWS00200 | |
| Lenovo ThinkPad E15 G3-20YG003UGE -2! | |
| Lenovo ThinkPad L15 G2 AMD -1! | |
| Average Intel Core i5-1240P | |
| Lenovo ThinkPad T15 Gen2-20W5S00100 -4! | |
| HP ProBook 450 G9 6A180EA | |
| Blender / v3.3 Classroom CPU | |
| HP ProBook 450 G9 6A180EA | |
| Average Intel Core i5-1240P (552 - 3047, n=12) | |
| Lenovo ThinkPad T16 G1 21BWS00200 | |
| Average of class Office (245 - 3964, n=80, last 2 years) | |
| Huawei MateBook D 16 2022 | |
| Dell Inspiron 16 Plus 7620 | |
| V-Ray 5 Benchmark / CPU | |
| Dell Inspiron 16 Plus 7620 | |
| Average of class Office (2829 - 13111, n=32, last 2 years) | |
| Lenovo ThinkPad L15 G2 AMD | |
| Lenovo ThinkPad T16 G1 21BWS00200 | |
| Average Intel Core i5-1240P (1334 - 7321, n=6) | |
| HP ProBook 450 G9 6A180EA | |
* ... smaller is better
AIDA64: FP32 Ray-Trace | FPU Julia | CPU SHA3 | CPU Queen | FPU SinJulia | FPU Mandel | CPU AES | CPU ZLib | FP64 Ray-Trace | CPU PhotoWorxx
| Performance Rating | |
| Lenovo ThinkPad X1 Extreme G4-20Y5CTO1WW (3050 Ti) | |
| HP ZBook Power 15 G8 313S5EA | |
| Dell Inspiron 16 Plus 7620 | |
| Huawei MateBook D 16 2022 | |
| Lenovo ThinkPad E15 G3-20YG003UGE | |
| Average of class Office | |
| Lenovo ThinkPad L15 G2 AMD | |
| Lenovo ThinkPad T16 G1 21BWS00200 | |
| Average Intel Core i5-1240P | |
| HP ProBook 450 G9 6A180EA | |
| AIDA64 / FP32 Ray-Trace | |
| HP ZBook Power 15 G8 313S5EA | |
| Lenovo ThinkPad X1 Extreme G4-20Y5CTO1WW (3050 Ti) | |
| Dell Inspiron 16 Plus 7620 | |
| Average of class Office (1685 - 31245, n=83, last 2 years) | |
| Huawei MateBook D 16 2022 | |
| Lenovo ThinkPad E15 G3-20YG003UGE | |
| Lenovo ThinkPad L15 G2 AMD | |
| Lenovo ThinkPad T16 G1 21BWS00200 | |
| Average Intel Core i5-1240P (2405 - 9694, n=16) | |
| HP ProBook 450 G9 6A180EA | |
| AIDA64 / FPU Julia | |
| Dell Inspiron 16 Plus 7620 | |
| Lenovo ThinkPad E15 G3-20YG003UGE | |
| Lenovo ThinkPad X1 Extreme G4-20Y5CTO1WW (3050 Ti) | |
| HP ZBook Power 15 G8 313S5EA | |
| Huawei MateBook D 16 2022 | |
| Average of class Office (8977 - 125394, n=83, last 2 years) | |
| Lenovo ThinkPad L15 G2 AMD | |
| Lenovo ThinkPad T16 G1 21BWS00200 | |
| Average Intel Core i5-1240P (7407 - 49934, n=16) | |
| HP ProBook 450 G9 6A180EA | |
| AIDA64 / CPU SHA3 | |
| Lenovo ThinkPad X1 Extreme G4-20Y5CTO1WW (3050 Ti) | |
| HP ZBook Power 15 G8 313S5EA | |
| Dell Inspiron 16 Plus 7620 | |
| Huawei MateBook D 16 2022 | |
| Average of class Office (590 - 5398, n=83, last 2 years) | |
| Lenovo ThinkPad E15 G3-20YG003UGE | |
| Lenovo ThinkPad L15 G2 AMD | |
| Lenovo ThinkPad T16 G1 21BWS00200 | |
| Average Intel Core i5-1240P (415 - 2462, n=16) | |
| HP ProBook 450 G9 6A180EA | |
| AIDA64 / CPU Queen | |
| Huawei MateBook D 16 2022 | |
| Dell Inspiron 16 Plus 7620 | |
| Lenovo ThinkPad X1 Extreme G4-20Y5CTO1WW (3050 Ti) | |
| HP ZBook Power 15 G8 313S5EA | |
| Lenovo ThinkPad E15 G3-20YG003UGE | |
| Lenovo ThinkPad T16 G1 21BWS00200 | |
| Lenovo ThinkPad L15 G2 AMD | |
| Average of class Office (20636 - 115197, n=83, last 2 years) | |
| Average Intel Core i5-1240P (29405 - 76736, n=16) | |
| HP ProBook 450 G9 6A180EA | |
| AIDA64 / FPU SinJulia | |
| Lenovo ThinkPad E15 G3-20YG003UGE | |
| HP ZBook Power 15 G8 313S5EA | |
| Lenovo ThinkPad X1 Extreme G4-20Y5CTO1WW (3050 Ti) | |
| Dell Inspiron 16 Plus 7620 | |
| Lenovo ThinkPad L15 G2 AMD | |
| Huawei MateBook D 16 2022 | |
| Average of class Office (1064 - 18321, n=83, last 2 years) | |
| Lenovo ThinkPad T16 G1 21BWS00200 | |
| Average Intel Core i5-1240P (2135 - 6540, n=16) | |
| HP ProBook 450 G9 6A180EA | |
| AIDA64 / FPU Mandel | |
| HP ZBook Power 15 G8 313S5EA | |
| Lenovo ThinkPad X1 Extreme G4-20Y5CTO1WW (3050 Ti) | |
| Lenovo ThinkPad E15 G3-20YG003UGE | |
| Dell Inspiron 16 Plus 7620 | |
| Lenovo ThinkPad L15 G2 AMD | |
| Average of class Office (4415 - 66922, n=83, last 2 years) | |
| Huawei MateBook D 16 2022 | |
| Lenovo ThinkPad T16 G1 21BWS00200 | |
| Average Intel Core i5-1240P (5113 - 23992, n=16) | |
| HP ProBook 450 G9 6A180EA | |
| AIDA64 / CPU ZLib | |
| Dell Inspiron 16 Plus 7620 | |
| Lenovo ThinkPad X1 Extreme G4-20Y5CTO1WW (3050 Ti) | |
| HP ZBook Power 15 G8 313S5EA | |
| Huawei MateBook D 16 2022 | |
| Average of class Office (138.6 - 1366, n=83, last 2 years) | |
| Lenovo ThinkPad E15 G3-20YG003UGE | |
| Lenovo ThinkPad T16 G1 21BWS00200 | |
| Average Intel Core i5-1240P (101.6 - 812, n=16) | |
| Lenovo ThinkPad L15 G2 AMD | |
| HP ProBook 450 G9 6A180EA | |
| AIDA64 / FP64 Ray-Trace | |
| HP ZBook Power 15 G8 313S5EA | |
| Lenovo ThinkPad X1 Extreme G4-20Y5CTO1WW (3050 Ti) | |
| Dell Inspiron 16 Plus 7620 | |
| Average of class Office (859 - 17834, n=83, last 2 years) | |
| Lenovo ThinkPad E15 G3-20YG003UGE | |
| Huawei MateBook D 16 2022 | |
| Lenovo ThinkPad L15 G2 AMD | |
| Lenovo ThinkPad T16 G1 21BWS00200 | |
| Average Intel Core i5-1240P (1154 - 5258, n=16) | |
| HP ProBook 450 G9 6A180EA | |
| AIDA64 / CPU PhotoWorxx | |
| Huawei MateBook D 16 2022 | |
| Dell Inspiron 16 Plus 7620 | |
| Average of class Office (9310 - 55359, n=83, last 2 years) | |
| Average Intel Core i5-1240P (11873 - 43661, n=16) | |
| Lenovo ThinkPad E15 G3-20YG003UGE | |
| Lenovo ThinkPad X1 Extreme G4-20Y5CTO1WW (3050 Ti) | |
| HP ProBook 450 G9 6A180EA | |
| Lenovo ThinkPad T16 G1 21BWS00200 | |
| HP ZBook Power 15 G8 313S5EA | |
| Lenovo ThinkPad L15 G2 AMD | |
System Performance
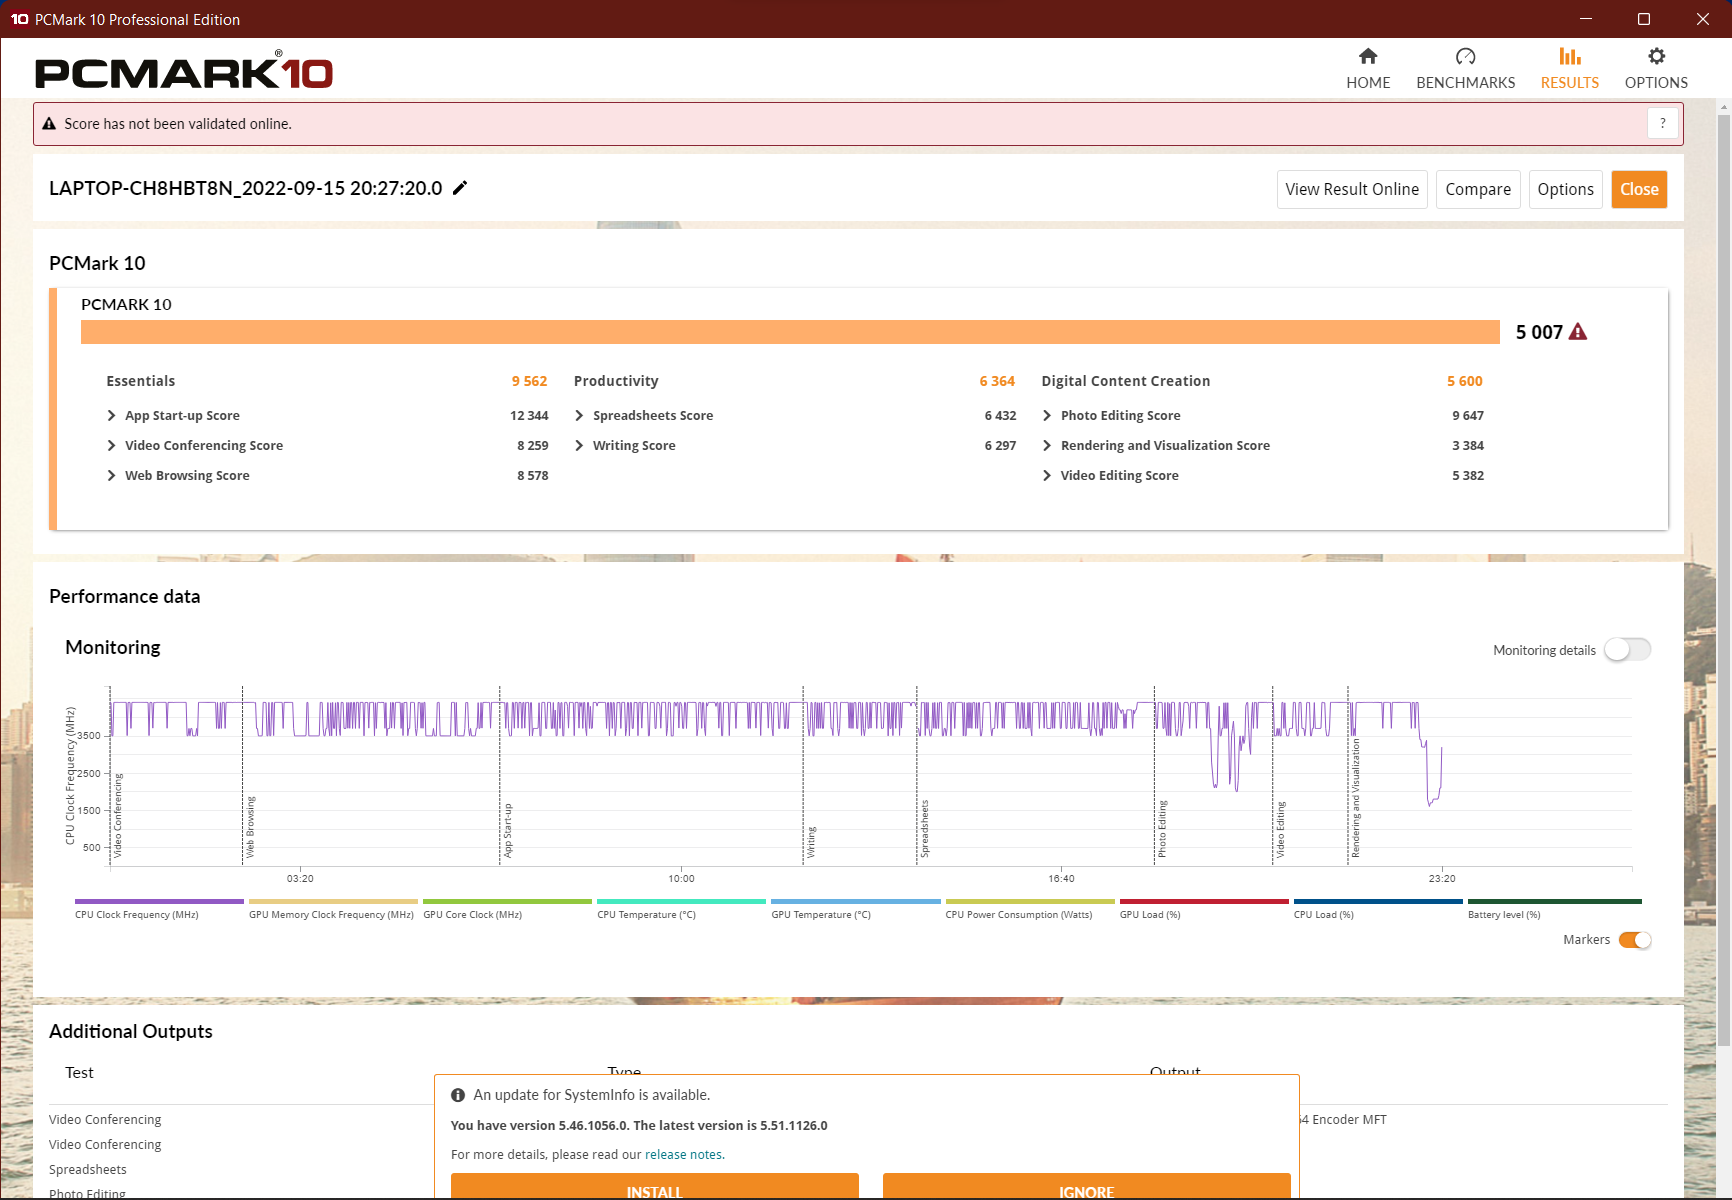
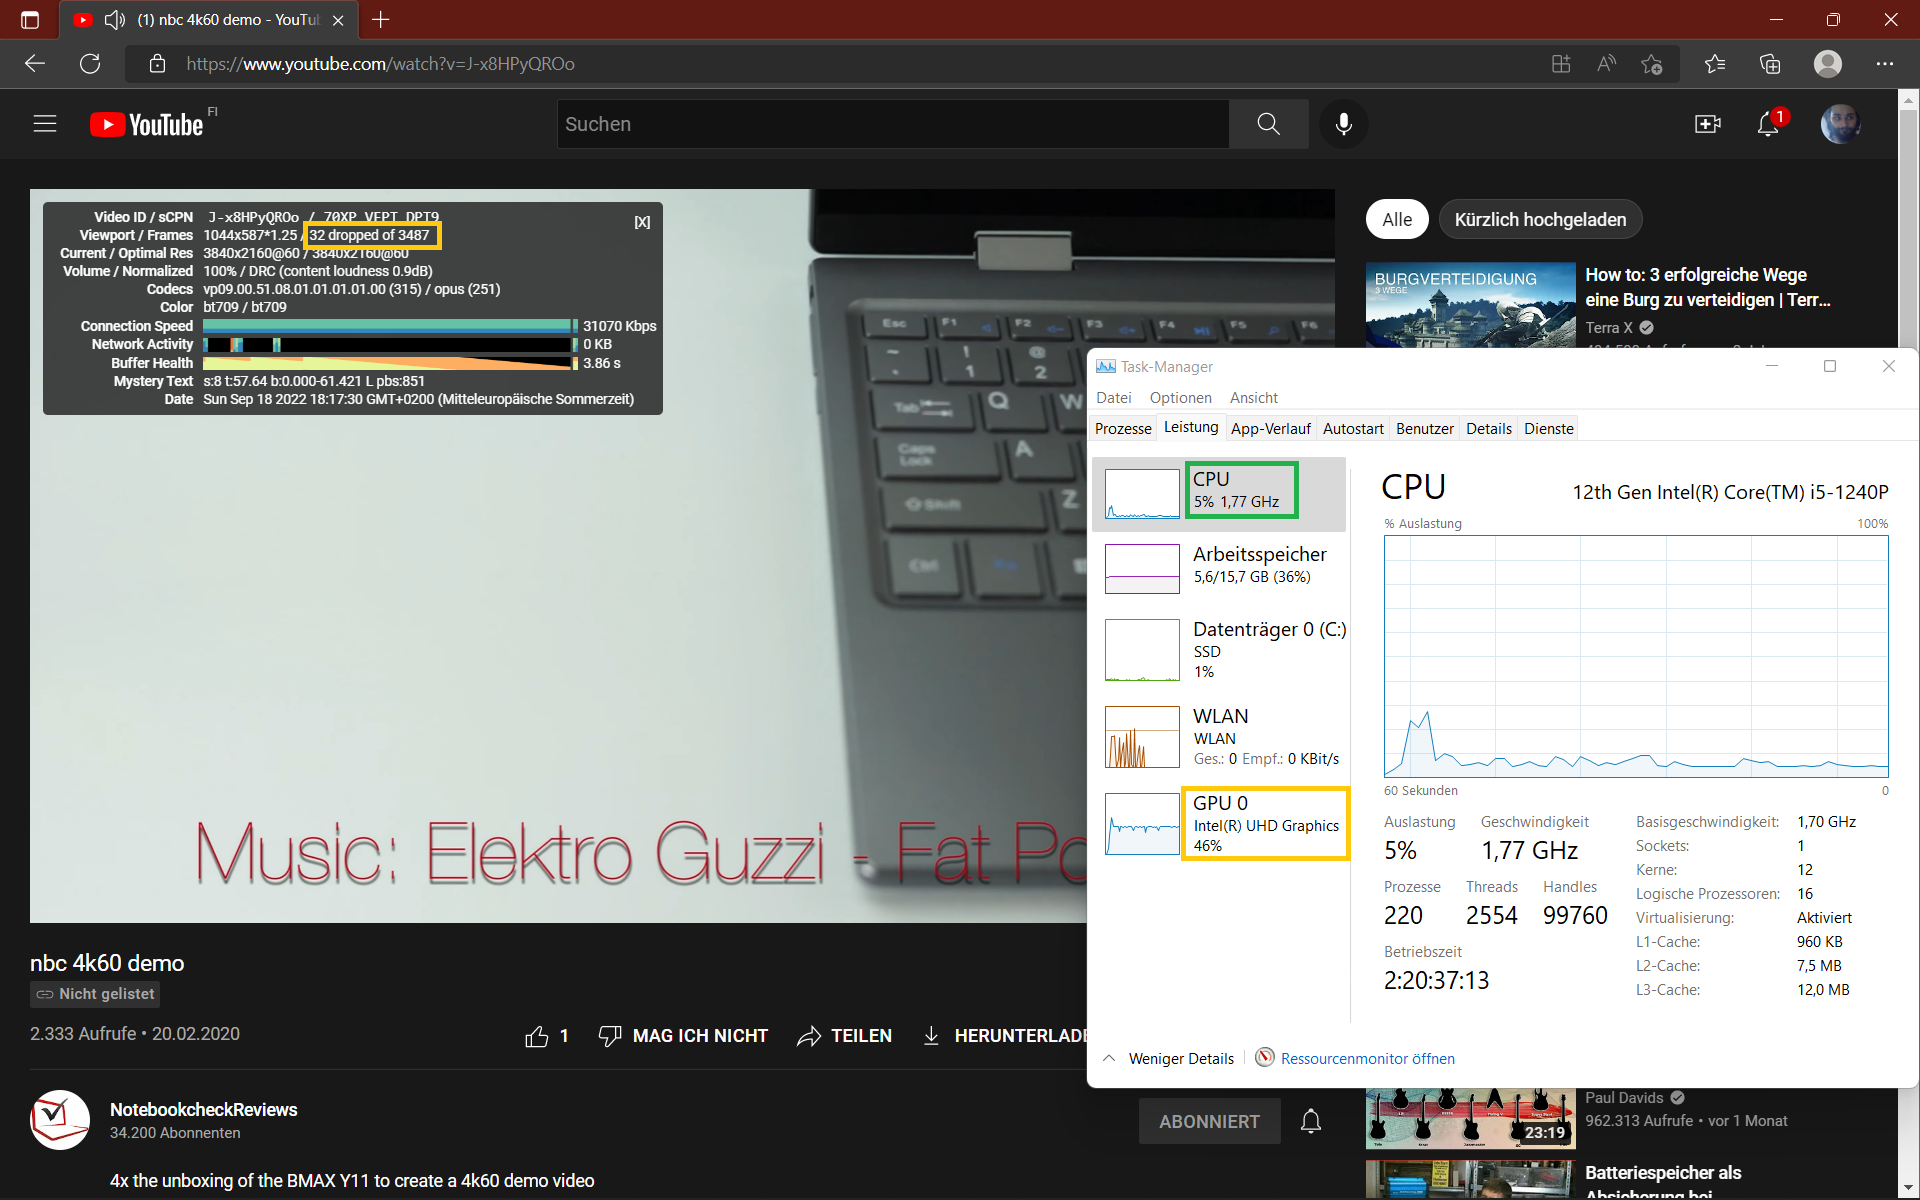
Due to the strong short-term turbo, the system is very responsive despite the single-channel RAM. Web surfing during YouTube 4K playback is not a problem, but frame drops do occur.
This could certainly be fixed by the insertion of a second RAM module, as well as by improving the overall system performance. The Alder Lake CPU performs very well in the web surfing benchmarks due to the turbo, but PCMark performance is average.
CrossMark: Overall | Productivity | Creativity | Responsiveness
Sunspider: 1.0 Total Score
Mozilla Kraken 1.1: Total
Speedometer 2.0: Result
Octane V2: Total Score
Jetstream 2: 2.0 Total Score
WebXPRT 3: Overall
WebXPRT 4: Overall
| PCMark 10 / Score | |
| Dell Inspiron 16 Plus 7620 | |
| Lenovo ThinkPad X1 Extreme G4-20Y5CTO1WW (3050 Ti) | |
| Average of class Office (2823 - 7626, n=73, last 2 years) | |
| Huawei MateBook D 16 2022 | |
| Lenovo ThinkPad L15 G2 AMD | |
| Lenovo ThinkPad E15 G3-20YG003UGE | |
| Lenovo ThinkPad T15 Gen2-20W5S00100 | |
| Average Intel Core i5-1240P, Intel Iris Xe Graphics G7 80EUs (4881 - 5345, n=11) | |
| Lenovo ThinkPad T16 G1 21BWS00200 | |
| HP ZBook Power 15 G8 313S5EA | |
| HP ProBook 450 G9 6A180EA | |
| PCMark 10 / Essentials | |
| Huawei MateBook D 16 2022 | |
| Lenovo ThinkPad X1 Extreme G4-20Y5CTO1WW (3050 Ti) | |
| Dell Inspiron 16 Plus 7620 | |
| Lenovo ThinkPad L15 G2 AMD | |
| Average of class Office (6567 - 11594, n=73, last 2 years) | |
| Average Intel Core i5-1240P, Intel Iris Xe Graphics G7 80EUs (8890 - 10652, n=11) | |
| Lenovo ThinkPad T16 G1 21BWS00200 | |
| HP ProBook 450 G9 6A180EA | |
| Lenovo ThinkPad E15 G3-20YG003UGE | |
| Lenovo ThinkPad T15 Gen2-20W5S00100 | |
| HP ZBook Power 15 G8 313S5EA | |
| PCMark 10 / Productivity | |
| Lenovo ThinkPad L15 G2 AMD | |
| Dell Inspiron 16 Plus 7620 | |
| Lenovo ThinkPad T15 Gen2-20W5S00100 | |
| Lenovo ThinkPad X1 Extreme G4-20Y5CTO1WW (3050 Ti) | |
| Average of class Office (3041 - 10925, n=73, last 2 years) | |
| Lenovo ThinkPad E15 G3-20YG003UGE | |
| HP ZBook Power 15 G8 313S5EA | |
| Huawei MateBook D 16 2022 | |
| HP ProBook 450 G9 6A180EA | |
| Average Intel Core i5-1240P, Intel Iris Xe Graphics G7 80EUs (6118 - 7058, n=11) | |
| Lenovo ThinkPad T16 G1 21BWS00200 | |
| PCMark 10 / Digital Content Creation | |
| Dell Inspiron 16 Plus 7620 | |
| Lenovo ThinkPad X1 Extreme G4-20Y5CTO1WW (3050 Ti) | |
| Average of class Office (2049 - 11108, n=73, last 2 years) | |
| Huawei MateBook D 16 2022 | |
| Average Intel Core i5-1240P, Intel Iris Xe Graphics G7 80EUs (5169 - 6213, n=11) | |
| Lenovo ThinkPad E15 G3-20YG003UGE | |
| Lenovo ThinkPad T16 G1 21BWS00200 | |
| Lenovo ThinkPad T15 Gen2-20W5S00100 | |
| HP ZBook Power 15 G8 313S5EA | |
| Lenovo ThinkPad L15 G2 AMD | |
| HP ProBook 450 G9 6A180EA | |
| CrossMark / Overall | |
| Huawei MateBook D 16 2022 | |
| Dell Inspiron 16 Plus 7620 | |
| Average Intel Core i5-1240P, Intel Iris Xe Graphics G7 80EUs (1392 - 1553, n=7) | |
| HP ZBook Power 15 G8 313S5EA | |
| Average of class Office (348 - 1891, n=82, last 2 years) | |
| Lenovo ThinkPad T16 G1 21BWS00200 | |
| HP ProBook 450 G9 6A180EA | |
| CrossMark / Productivity | |
| Huawei MateBook D 16 2022 | |
| Dell Inspiron 16 Plus 7620 | |
| HP ZBook Power 15 G8 313S5EA | |
| Average Intel Core i5-1240P, Intel Iris Xe Graphics G7 80EUs (1393 - 1524, n=7) | |
| Average of class Office (393 - 1880, n=82, last 2 years) | |
| Lenovo ThinkPad T16 G1 21BWS00200 | |
| HP ProBook 450 G9 6A180EA | |
| CrossMark / Creativity | |
| Huawei MateBook D 16 2022 | |
| Dell Inspiron 16 Plus 7620 | |
| Average Intel Core i5-1240P, Intel Iris Xe Graphics G7 80EUs (1426 - 1647, n=7) | |
| HP ZBook Power 15 G8 313S5EA | |
| Average of class Office (319 - 2155, n=82, last 2 years) | |
| Lenovo ThinkPad T16 G1 21BWS00200 | |
| HP ProBook 450 G9 6A180EA | |
| CrossMark / Responsiveness | |
| Huawei MateBook D 16 2022 | |
| Dell Inspiron 16 Plus 7620 | |
| Average Intel Core i5-1240P, Intel Iris Xe Graphics G7 80EUs (1267 - 1545, n=7) | |
| Lenovo ThinkPad T16 G1 21BWS00200 | |
| Average of class Office (258 - 1877, n=82, last 2 years) | |
| HP ZBook Power 15 G8 313S5EA | |
| HP ProBook 450 G9 6A180EA | |
| Sunspider / 1.0 Total Score | |
| Average of class Office (172.6 - 185.2, n=2, last 2 years) | |
| Lenovo ThinkPad T16 G1 21BWS00200 | |
| Average Intel Core i5-1240P, Intel Iris Xe Graphics G7 80EUs (n=1) | |
| HP ProBook 450 G9 6A180EA | |
| Mozilla Kraken 1.1 / Total | |
| Lenovo ThinkPad E15 G3-20YG003UGE | |
| HP ProBook 450 G9 6A180EA | |
| Average Intel Core i5-1240P, Intel Iris Xe Graphics G7 80EUs (575 - 1422, n=12) | |
| HP ZBook Power 15 G8 313S5EA | |
| Lenovo ThinkPad L15 G2 AMD | |
| Lenovo ThinkPad T15 Gen2-20W5S00100 | |
| Average of class Office (391 - 1966, n=87, last 2 years) | |
| Lenovo ThinkPad X1 Extreme G4-20Y5CTO1WW (3050 Ti) | |
| Lenovo ThinkPad T16 G1 21BWS00200 | |
| Dell Inspiron 16 Plus 7620 | |
| Huawei MateBook D 16 2022 | |
| Speedometer 2.0 / Result | |
| Average of class Office (26.1 - 539, n=20, last 2 years) | |
| Huawei MateBook D 16 2022 | |
| Average Intel Core i5-1240P, Intel Iris Xe Graphics G7 80EUs (241 - 266, n=3) | |
| Lenovo ThinkPad T16 G1 21BWS00200 | |
| HP ProBook 450 G9 6A180EA | |
| Octane V2 / Total Score | |
| Huawei MateBook D 16 2022 | |
| Average of class Office (22414 - 118679, n=22, last 2 years) | |
| Lenovo ThinkPad T16 G1 21BWS00200 | |
| Average Intel Core i5-1240P, Intel Iris Xe Graphics G7 80EUs (70915 - 80743, n=5) | |
| HP ProBook 450 G9 6A180EA | |
| HP ZBook Power 15 G8 313S5EA | |
| Jetstream 2 / 2.0 Total Score | |
| Average of class Office (74.4 - 434, n=32, last 2 years) | |
| Average Intel Core i5-1240P, Intel Iris Xe Graphics G7 80EUs (203 - 418, n=4) | |
| Dell Inspiron 16 Plus 7620 | |
| Huawei MateBook D 16 2022 | |
| Lenovo ThinkPad T16 G1 21BWS00200 | |
| HP ProBook 450 G9 6A180EA | |
| HP ZBook Power 15 G8 313S5EA | |
| WebXPRT 3 / Overall | |
| Huawei MateBook D 16 2022 | |
| Dell Inspiron 16 Plus 7620 | |
| Average of class Office (121 - 455, n=78, last 2 years) | |
| Lenovo ThinkPad X1 Extreme G4-20Y5CTO1WW (3050 Ti) | |
| HP ZBook Power 15 G8 313S5EA | |
| Lenovo ThinkPad L15 G2 AMD | |
| Lenovo ThinkPad T16 G1 21BWS00200 | |
| Average Intel Core i5-1240P, Intel Iris Xe Graphics G7 80EUs (119.2 - 268, n=11) | |
| Lenovo ThinkPad E15 G3-20YG003UGE | |
| HP ProBook 450 G9 6A180EA | |
| WebXPRT 4 / Overall | |
| Huawei MateBook D 16 2022 | |
| Dell Inspiron 16 Plus 7620 | |
| Average of class Office (80 - 328, n=80, last 2 years) | |
| Lenovo ThinkPad T16 G1 21BWS00200 | |
| Average Intel Core i5-1240P, Intel Iris Xe Graphics G7 80EUs (217 - 231, n=6) | |
| HP ProBook 450 G9 6A180EA | |
* ... smaller is better
| PCMark 10 Score | 5007 points | |
Help | ||
| AIDA64 / Memory Copy | |
| Huawei MateBook D 16 2022 | |
| Average of class Office (19927 - 108783, n=84, last 2 years) | |
| Dell Inspiron 16 Plus 7620 | |
| Average Intel Core i5-1240P (23312 - 70537, n=16) | |
| Lenovo ThinkPad X1 Extreme G4-20Y5CTO1WW (3050 Ti) | |
| Lenovo ThinkPad E15 G3-20YG003UGE | |
| HP ZBook Power 15 G8 313S5EA | |
| Lenovo ThinkPad T16 G1 21BWS00200 | |
| HP ProBook 450 G9 6A180EA | |
| Lenovo ThinkPad L15 G2 AMD | |
| AIDA64 / Memory Read | |
| Dell Inspiron 16 Plus 7620 | |
| Average of class Office (10084 - 127282, n=84, last 2 years) | |
| Huawei MateBook D 16 2022 | |
| Average Intel Core i5-1240P (18989 - 70553, n=16) | |
| Lenovo ThinkPad E15 G3-20YG003UGE | |
| Lenovo ThinkPad X1 Extreme G4-20Y5CTO1WW (3050 Ti) | |
| HP ZBook Power 15 G8 313S5EA | |
| Lenovo ThinkPad T16 G1 21BWS00200 | |
| Lenovo ThinkPad L15 G2 AMD | |
| HP ProBook 450 G9 6A180EA | |
| AIDA64 / Memory Write | |
| Average of class Office (20073 - 117935, n=84, last 2 years) | |
| Huawei MateBook D 16 2022 | |
| Dell Inspiron 16 Plus 7620 | |
| Average Intel Core i5-1240P (23454 - 62496, n=16) | |
| Lenovo ThinkPad X1 Extreme G4-20Y5CTO1WW (3050 Ti) | |
| Lenovo ThinkPad E15 G3-20YG003UGE | |
| Lenovo ThinkPad L15 G2 AMD | |
| Lenovo ThinkPad T16 G1 21BWS00200 | |
| HP ProBook 450 G9 6A180EA | |
| HP ZBook Power 15 G8 313S5EA | |
| AIDA64 / Memory Latency | |
| Average Intel Core i5-1240P (85.1 - 188.3, n=11) | |
| Huawei MateBook D 16 2022 | |
| Lenovo ThinkPad E15 G3-20YG003UGE | |
| Average of class Office (7.6 - 162.9, n=81, last 2 years) | |
| Dell Inspiron 16 Plus 7620 | |
| Lenovo ThinkPad T16 G1 21BWS00200 | |
| Lenovo ThinkPad L15 G2 AMD | |
| Lenovo ThinkPad X1 Extreme G4-20Y5CTO1WW (3050 Ti) | |
| HP ProBook 450 G9 6A180EA | |
| HP ZBook Power 15 G8 313S5EA | |
* ... smaller is better
DPC Latency
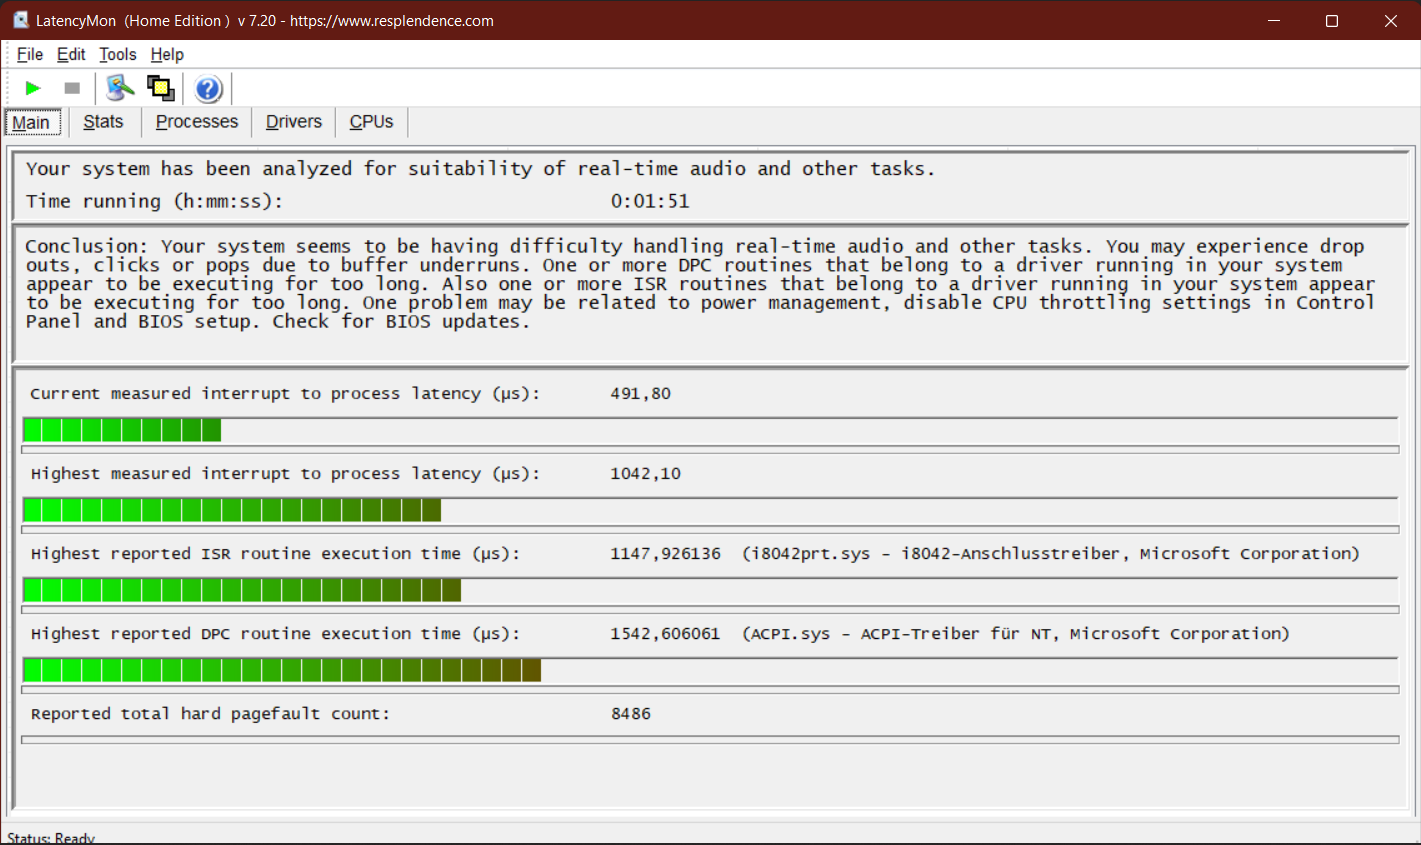
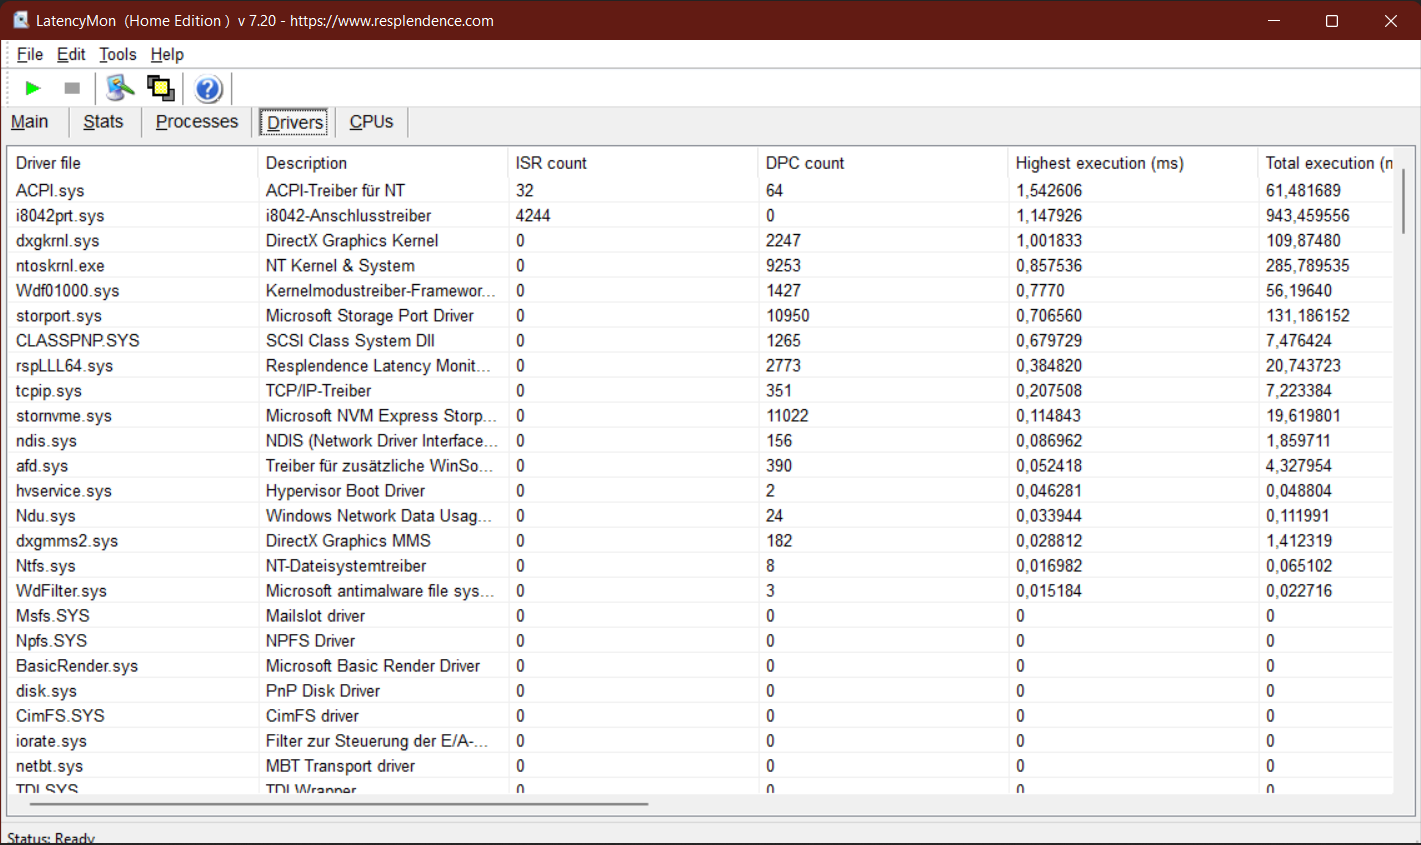
| DPC Latencies / LatencyMon - interrupt to process latency (max), Web, Youtube, Prime95 | |
| HP ProBook 450 G9 6A180EA | |
| Lenovo ThinkPad L15 G2 AMD | |
| Lenovo ThinkPad T16 G1 21BWS00200 | |
| Lenovo ThinkPad T15 Gen2-20W5S00100 | |
| Dell Inspiron 16 Plus 7620 | |
| Lenovo ThinkPad E15 G3-20YG003UGE | |
| Huawei MateBook D 16 2022 | |
| HP ZBook Power 15 G8 313S5EA | |
* ... smaller is better
Storage Devices
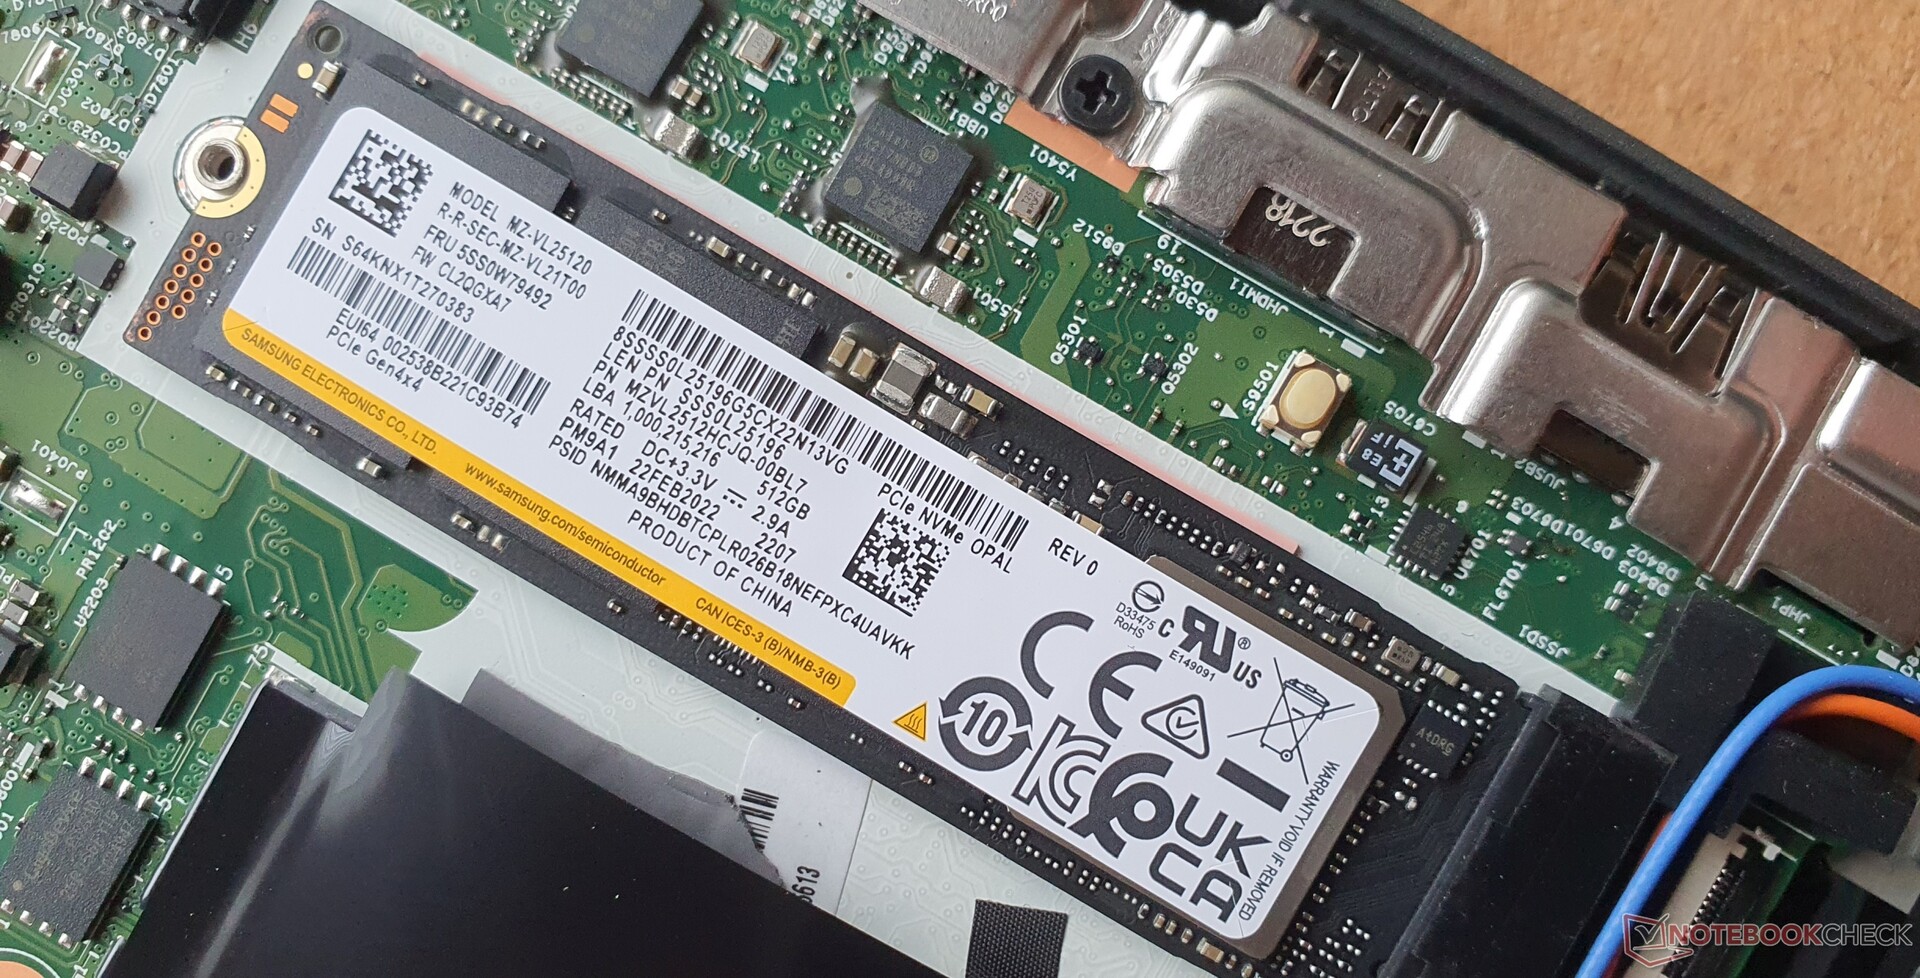
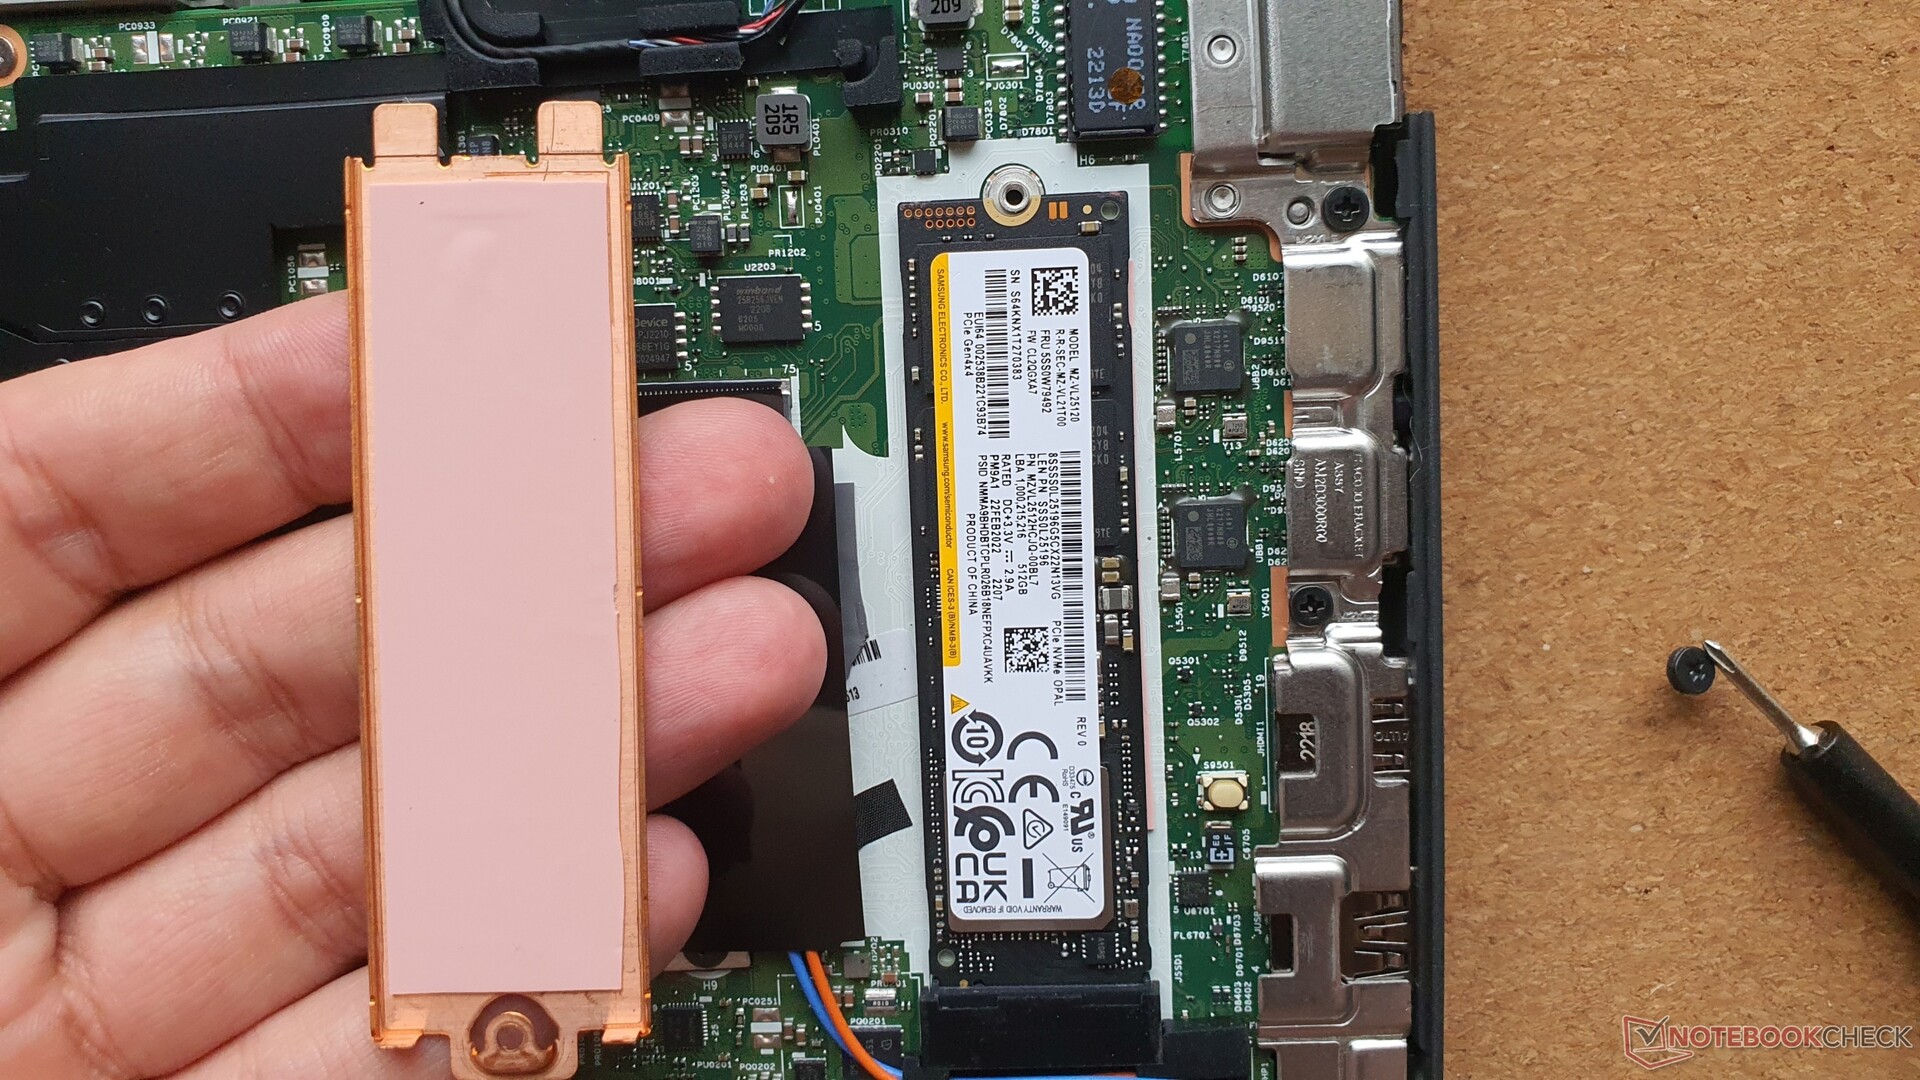
Samsung's PM9A1 is a PCIe 4.0 SSD and has a capacity of 512 GB. The speed is good, but the 4K 16/64 reads are quite slow, and they quickly drop by half in the read-loop test due to overheating. The predecessor had a faster SSD, and the rest of our comparison field performs similarly to our review sample.
| Lenovo ThinkPad T16 G1 21BWS00200 Samsung PM9A1 MZVL2512HCJQ | Lenovo ThinkPad T15 Gen2-20W5S00100 Samsung PM981a MZVLB1T0HBLR | Lenovo ThinkPad X1 Extreme G4-20Y5CTO1WW (3050 Ti) Samsung PM9A1 MZVL21T0HCLR | HP ZBook Power 15 G8 313S5EA Samsung PM9A1 MZVL2512HCJQ | HP ProBook 450 G9 6A180EA SK Hynix HFM512GD3JX013N | Huawei MateBook D 16 2022 Silicon Motion PCIe-8 SSD | Dell Inspiron 16 Plus 7620 Kioxia BG5 KBG50ZNS512G | Lenovo ThinkPad E15 G3-20YG003UGE SK Hynix PC711 1TB HFS001TDE9X084N | Lenovo ThinkPad L15 G2 AMD SK Hynix HFS512 GDE9X081N | |
|---|---|---|---|---|---|---|---|---|---|
| DiskSpd | 104% | 18% | 60% | -38% | 36% | -15% | 67% | -10% | |
| seq read (MB/s) | 3645 | 2090 -43% | 3285 -10% | 3354.8 -8% | 1914 -47% | 2012 -45% | 2355 -35% | 1624 -55% | 1688 -54% |
| seq write (MB/s) | 2809 | 2270 -19% | 2886 3% | 1353.3 -52% | 1762 -37% | 1438 -49% | 2020 -28% | 1901 -32% | 2072 -26% |
| seq q8 t1 read (MB/s) | 6524 | 3448 -47% | 6641 2% | 6230 -5% | 3463 -47% | 2883 -56% | 2569 -61% | 3269 -50% | 3582 -45% |
| seq q8 t1 write (MB/s) | 4812 | 2945 -39% | 4922 2% | 4757.9 -1% | 2600 -46% | 1911 -60% | 2752 -43% | 3250 -32% | 3072 -36% |
| 4k q1 t1 read (MB/s) | 68.2 | 74.4 9% | 78.4 15% | 51.8 -24% | 52.7 -23% | 43.1 -37% | 62.7 -8% | 57.4 -16% | 46.7 -32% |
| 4k q1 t1 write (MB/s) | 134.8 | 231 71% | 161 19% | 150.2 11% | 112.4 -17% | 273 103% | 162.6 21% | 128 -5% | 123 -9% |
| 4k q32 t16 read (MB/s) | 683 | 2506 267% | 1270 86% | 2187 220% | 328 -52% | 1391 104% | 652 -5% | 2037 198% | 983 44% |
| 4k q32 t16 write (MB/s) | 293 | 2137 629% | 373 27% | 1284.7 338% | 192.2 -34% | 1241 324% | 408 39% | 1833 526% | 521 78% |
| AS SSD | 11% | 28% | 22% | -21% | 11% | -23% | 12% | -8% | |
| Seq Read (MB/s) | 3225 | 2694 -16% | 4588 42% | 4951 54% | 2687 -17% | 2802 -13% | 2693.29 -16% | 2432 -25% | 2721 -16% |
| Seq Write (MB/s) | 1567 | 2370 51% | 1625 4% | 3725 138% | 1476.14 -6% | 1879 20% | 1683.46 7% | 1266 -19% | 1329 -15% |
| 4K Read (MB/s) | 69.7 | 68.4 -2% | 75.2 8% | 52.9 -24% | 60 -14% | 61.03 -12% | 65.01 -7% | 48.88 -30% | 51.5 -26% |
| 4K Write (MB/s) | 170.9 | 208.1 22% | 182.9 7% | 105.35 -38% | 176.81 3% | 248.56 45% | 197.81 16% | 128.4 -25% | 132.5 -22% |
| 4K-64 Read (MB/s) | 720 | 1961 172% | 1318 83% | 2200.26 206% | 696.46 -3% | 1135.53 58% | 855.48 19% | 1805 151% | 932 29% |
| 4K-64 Write (MB/s) | 2682 | 1935 -28% | 3056 14% | 2314.41 -14% | 1624.91 -39% | 1402.68 -48% | 395.8 -85% | 2470 -8% | 1856 -31% |
| Access Time Read * (ms) | 0.059 | 0.032 46% | 0.041 31% | 0.054 8% | 0.04 32% | 0.025 58% | 0.078 -32% | 0.044 25% | 0.038 36% |
| Access Time Write * (ms) | 0.024 | 0.081 -238% | 0.022 8% | 0.04 -67% | 0.028 -17% | 0.016 33% | 0.06 -150% | 0.038 -58% | 0.028 -17% |
| Score Read (Points) | 1112 | 2299 107% | 1852 67% | 2748 147% | 1025 -8% | 1477 33% | 1190 7% | 2097 89% | 1256 13% |
| Score Write (Points) | 3010 | 2380 -21% | 3402 13% | 2792 -7% | 1949 -35% | 1839 -39% | 762 -75% | 2725 -9% | 2122 -30% |
| Score Total (Points) | 4630 | 5846 26% | 6069 31% | 6880 49% | 3457 -25% | 4039 -13% | 2529 -45% | 5837 26% | 3961 -14% |
| Copy ISO MB/s (MB/s) | 1639 | 1287.6 -21% | 863.41 -47% | 1352.52 -17% | 1634.1 0% | 1301 -21% | |||
| Copy Program MB/s (MB/s) | 326.8 | 115.3 -65% | 127.34 -61% | 435.92 33% | 379.46 16% | 554 70% | |||
| Copy Game MB/s (MB/s) | 942.7 | 390.1 -59% | 384.67 -59% | 1058.52 12% | 1174.45 25% | 993 5% | |||
| Total Average (Program / Settings) | 58% /
50% | 23% /
24% | 41% /
36% | -30% /
-27% | 24% /
20% | -19% /
-20% | 40% /
32% | -9% /
-9% |
* ... smaller is better
* ... smaller is better
Sustained Read Performance: DiskSpd Read Loop, Queue Depth 8
Graphics Card
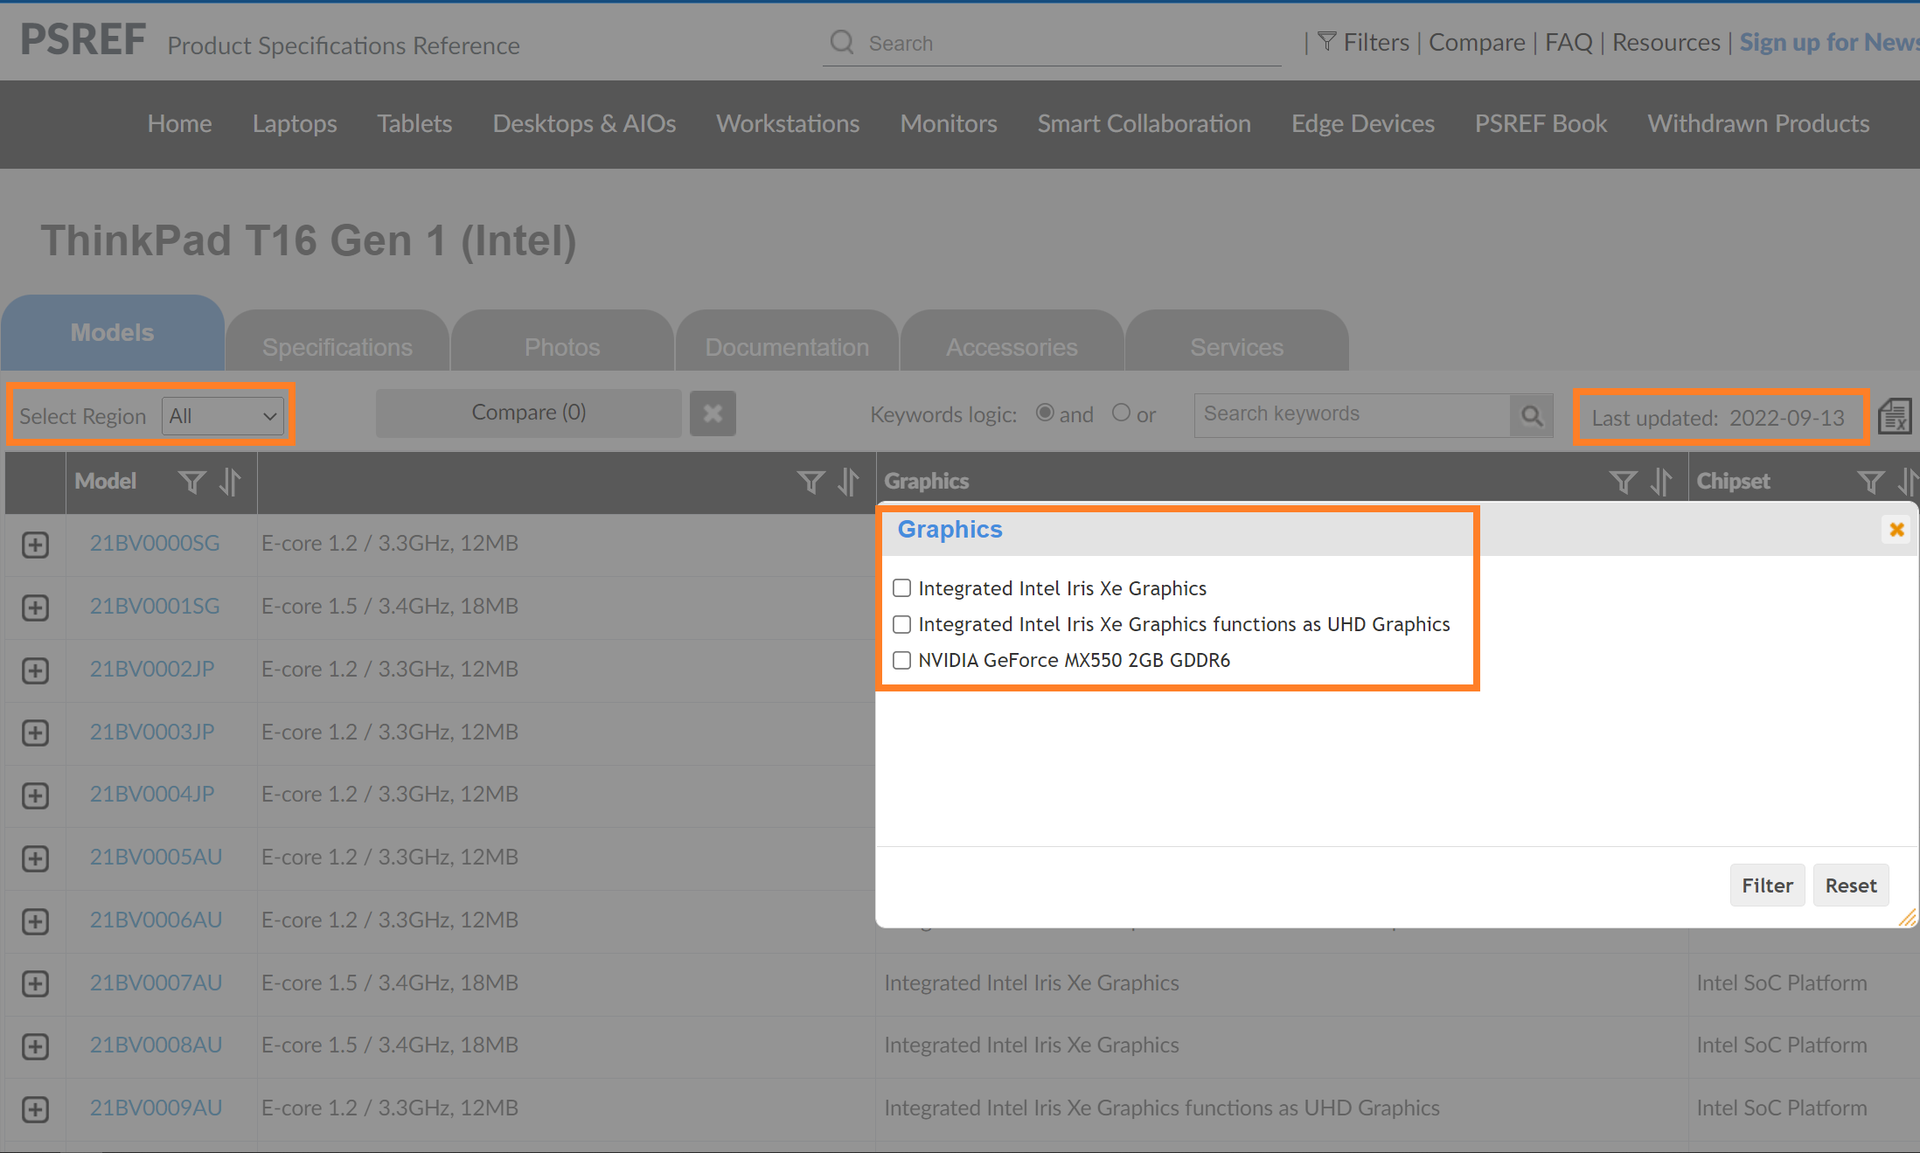
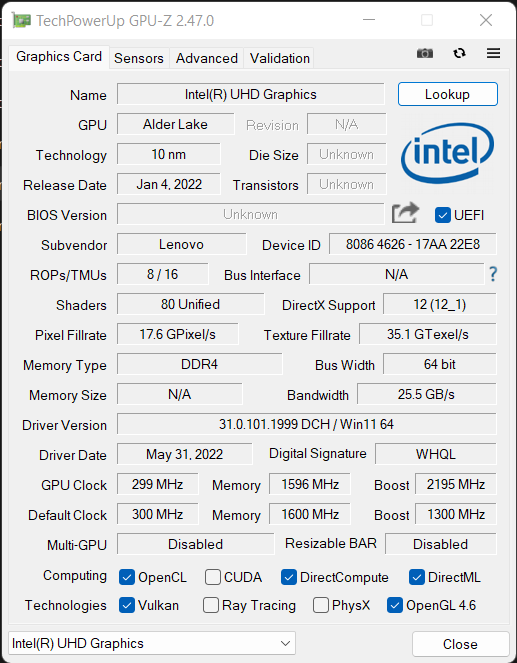
The integrated Intel UHD Graphics is technically a Xe G7 (80 EUs) that is bound to single-channel RAM. Accordingly, its performance is limited and low detail levels are the order of the day. Since the notebook is not designed for gaming, this is tolerable and can be improved significantly with a second RAM module. The MX450 of the predecessor would also be a good accompanying improvement, while the optionally available GeForce MX550 is even faster.
The ThinkPad T16 was also announced with an optional Nvidia GeForce RTX 2050, which is not even listed in the spec sheets, but only as a note that it is not available in the EMEA region. In battery mode, the fps in The Witcher 3 @Medium settings drop from 32 to 24, corresponding to a throttling of 25%. The full 1,300 MHz drops to ~750 MHz.
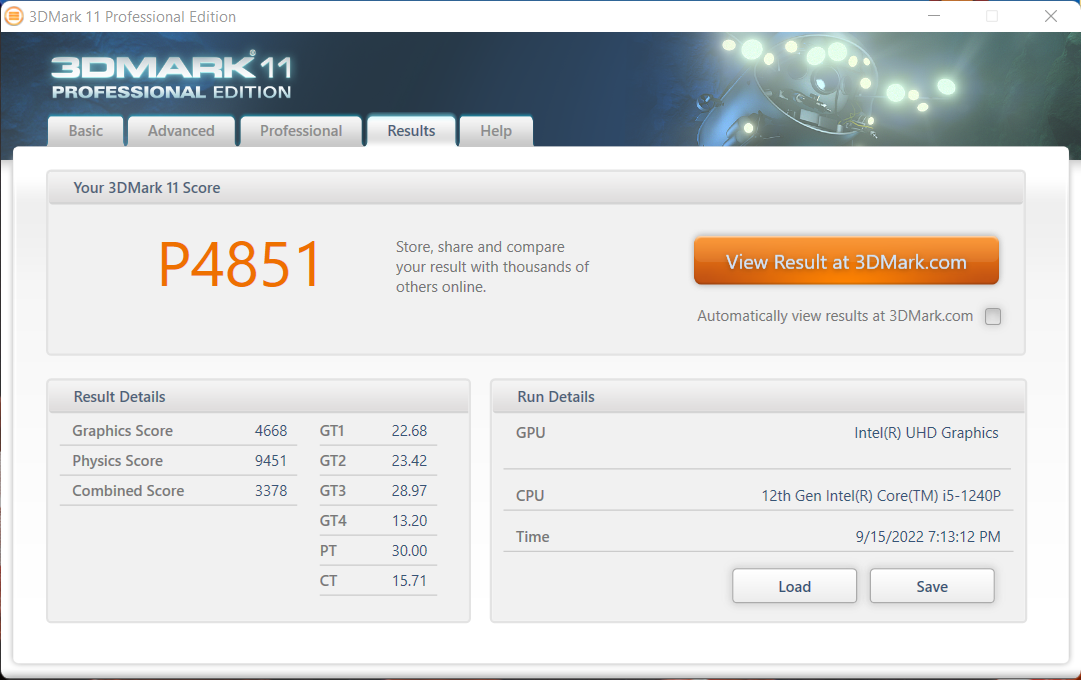
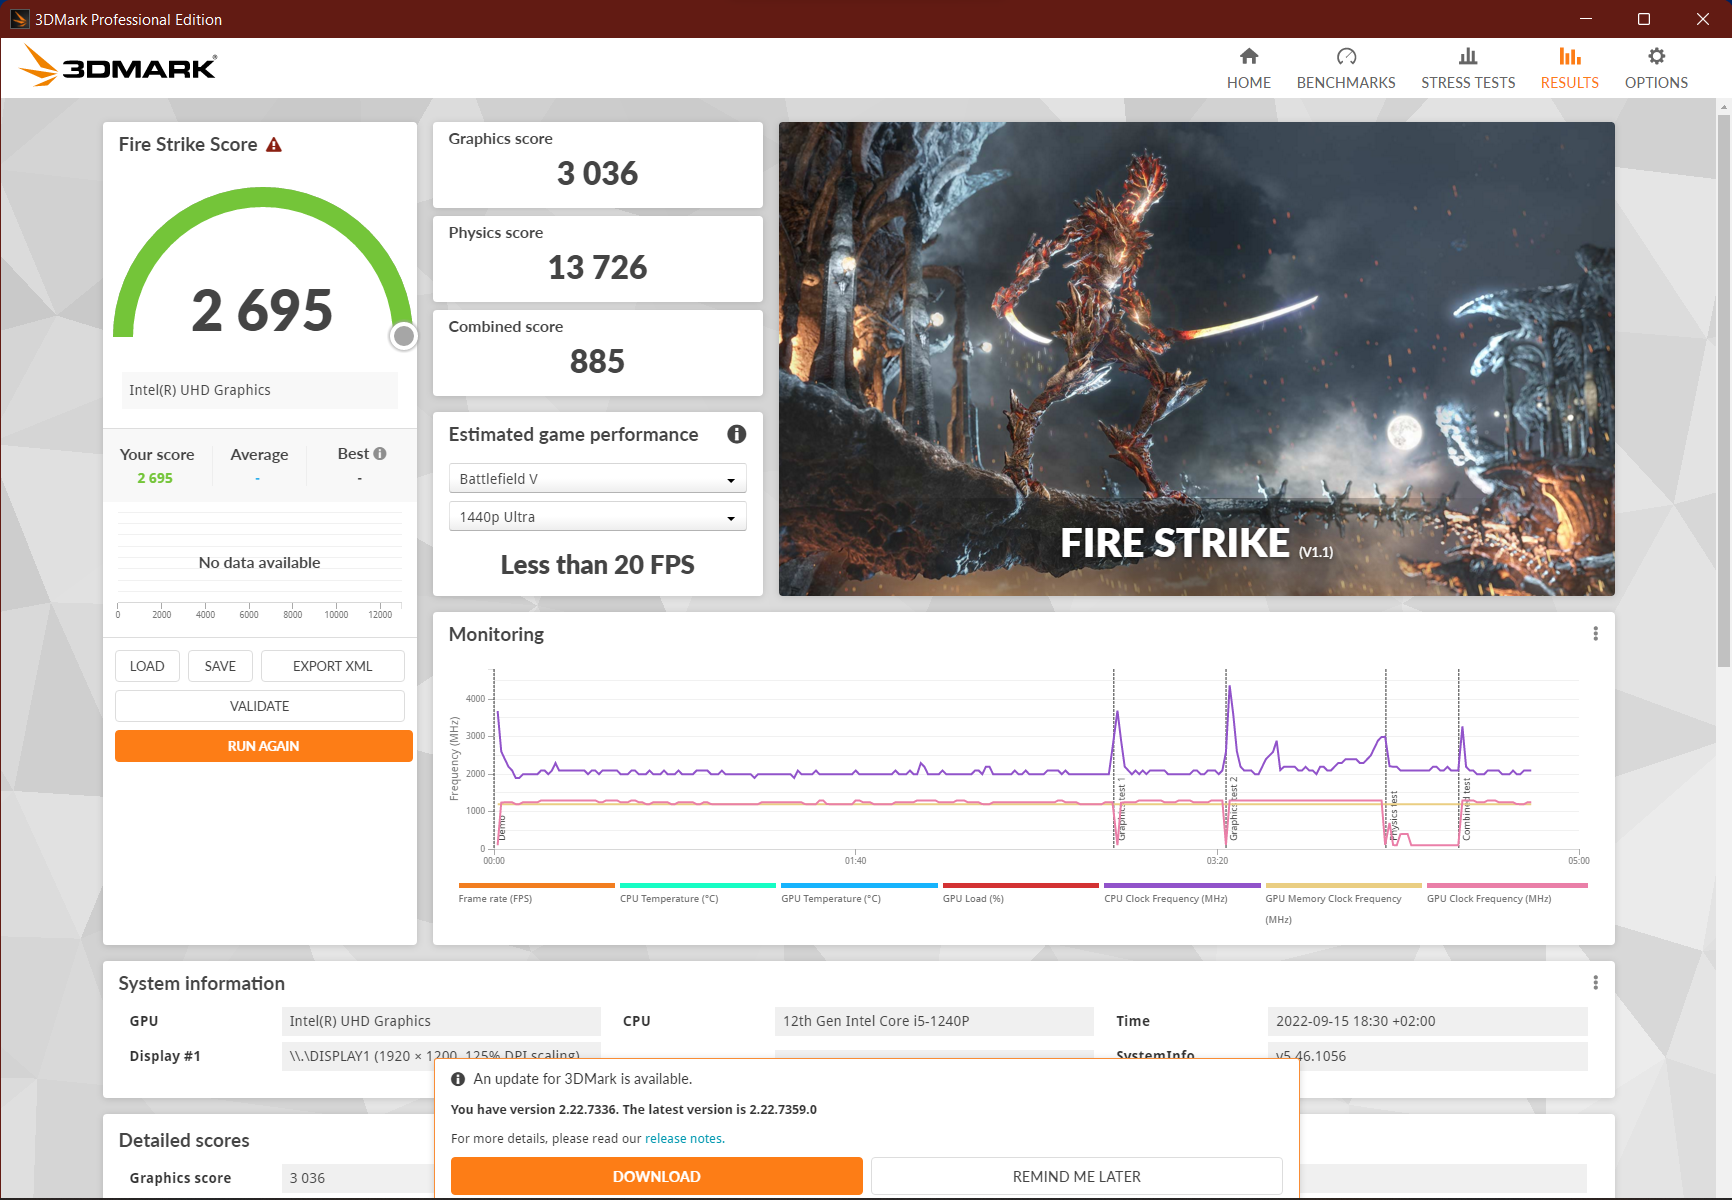
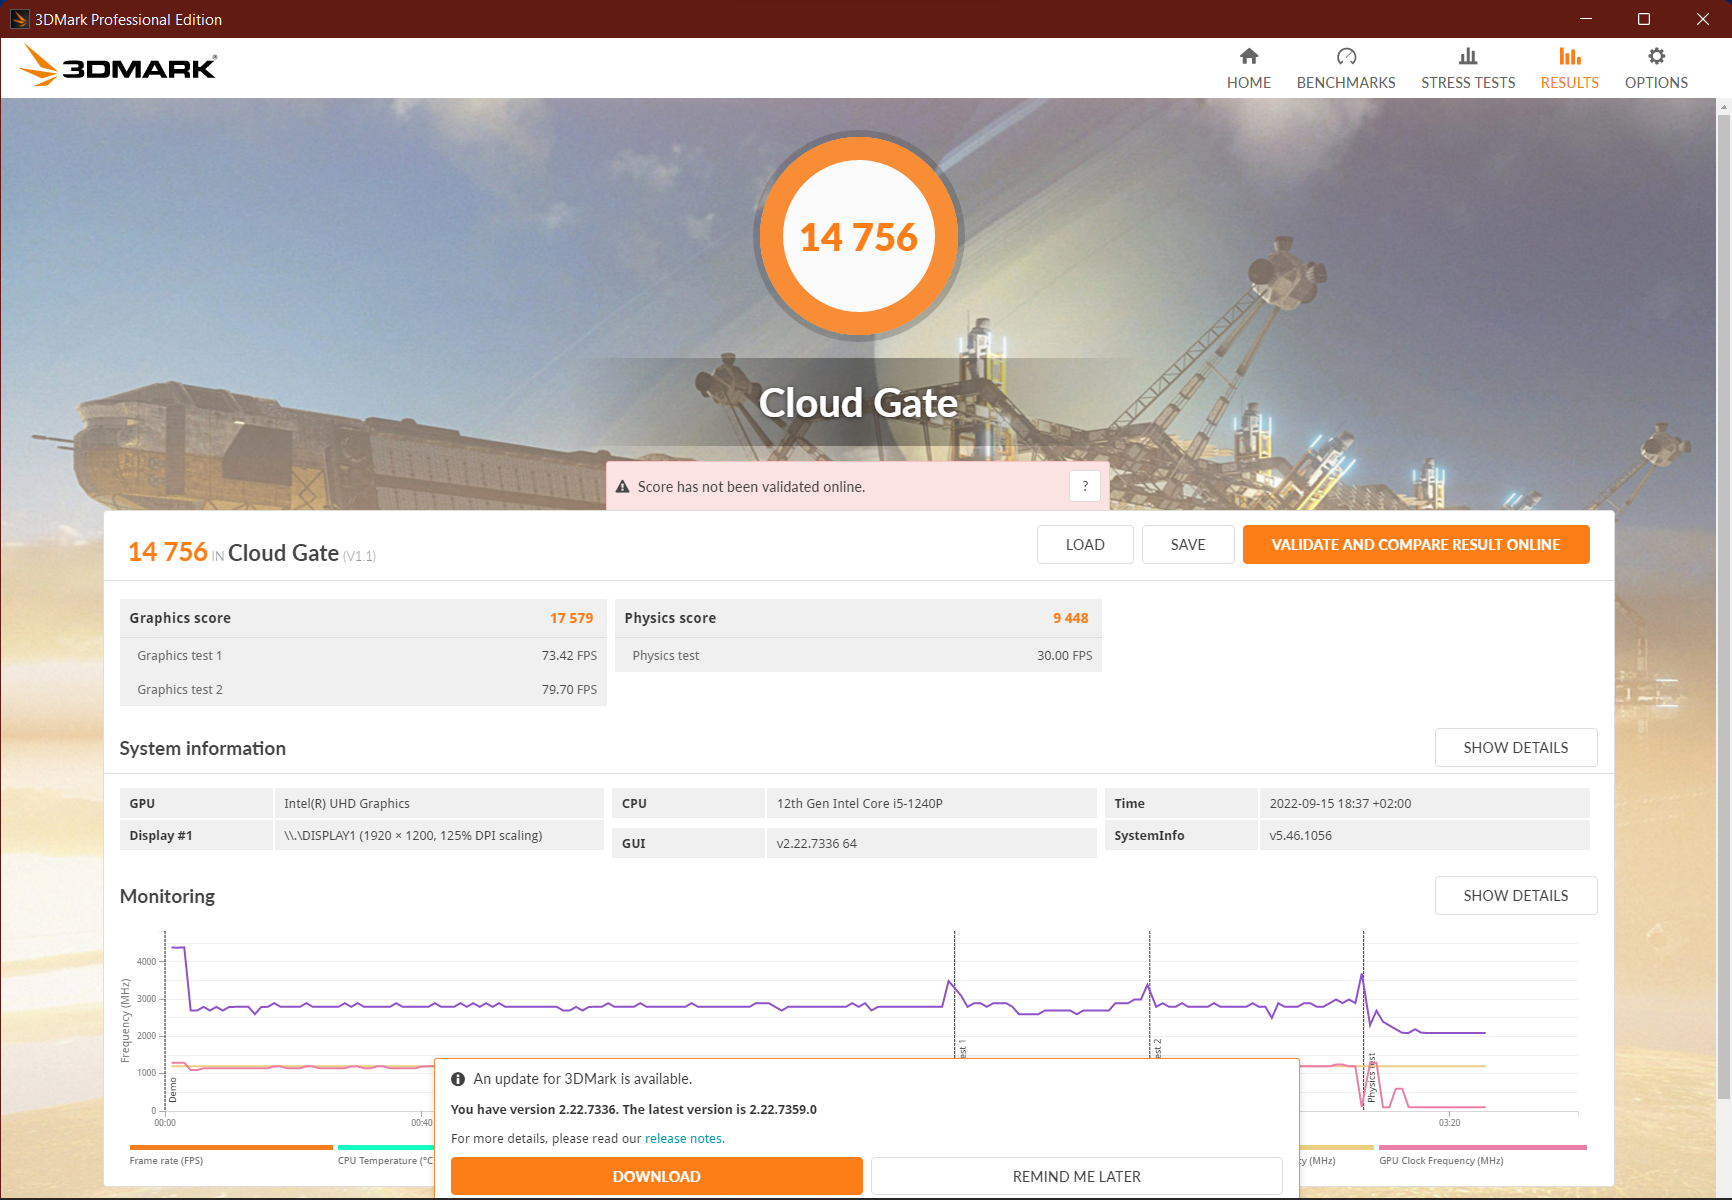
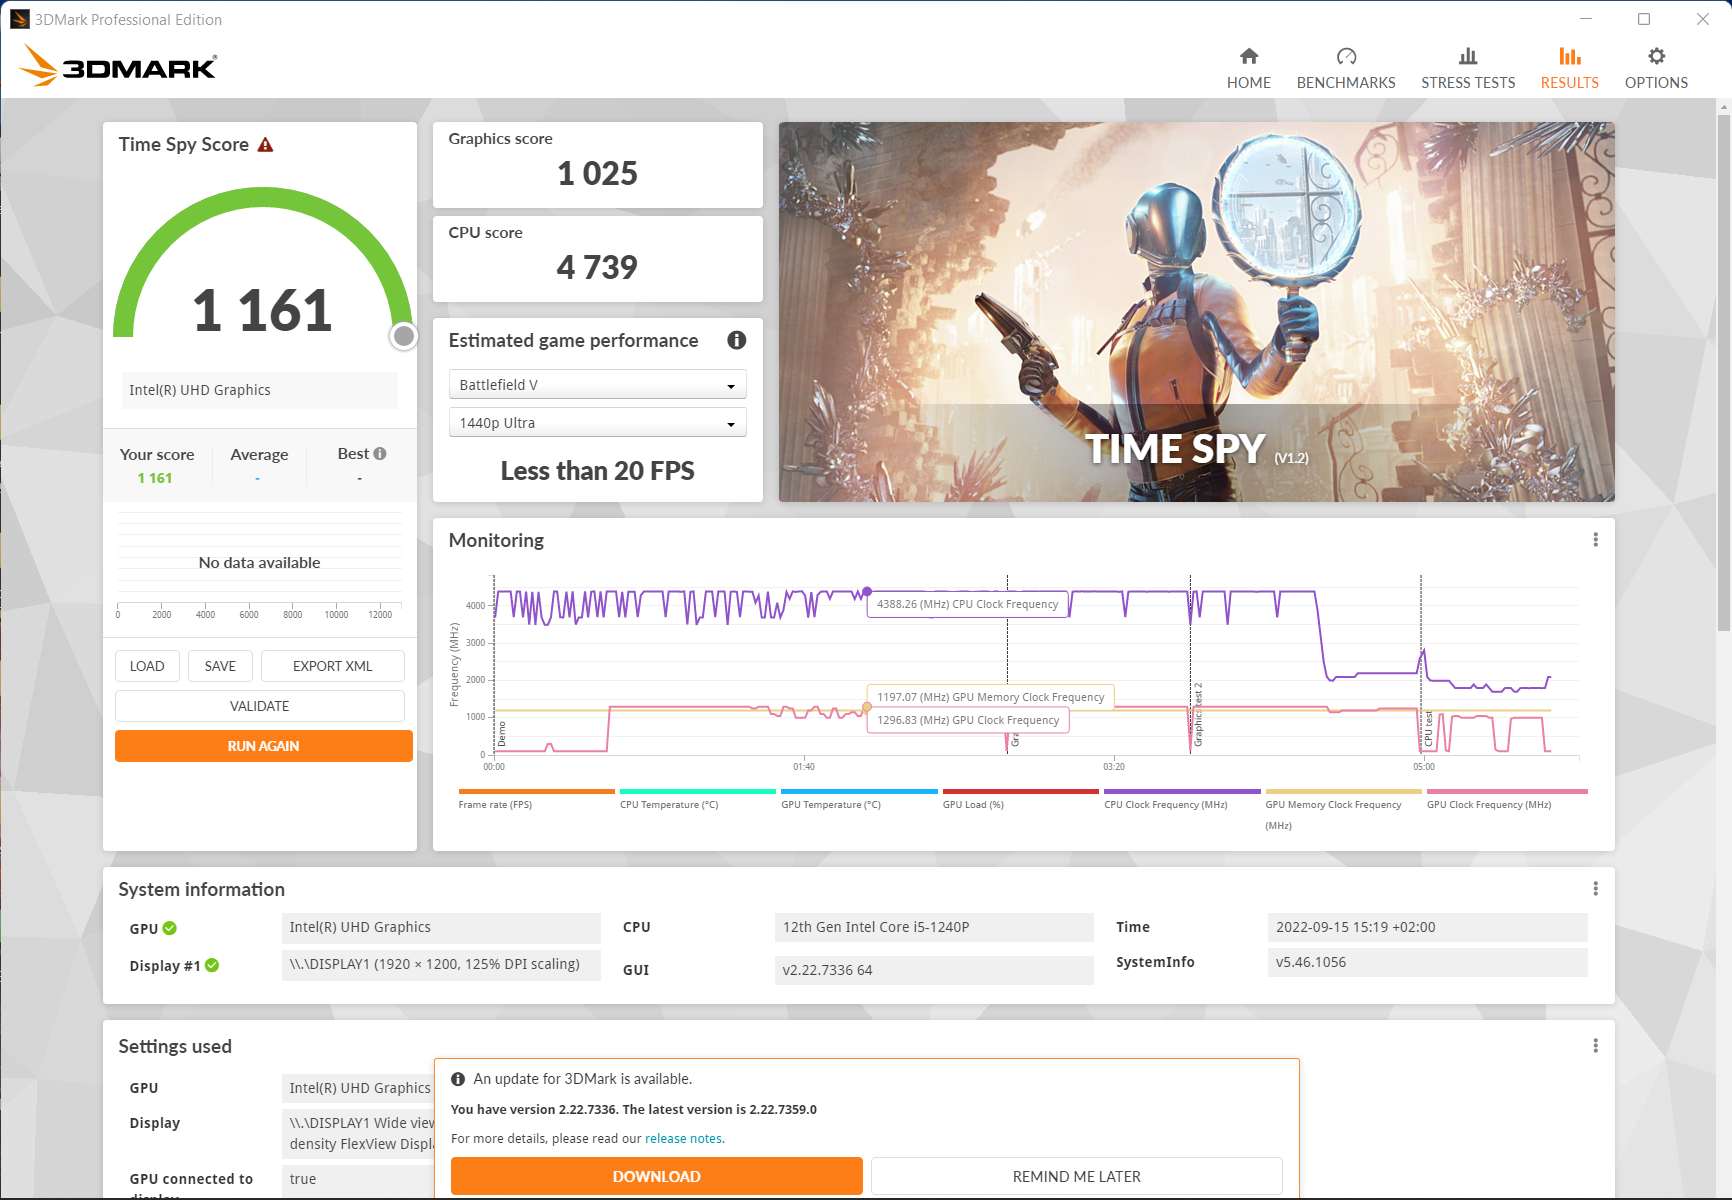
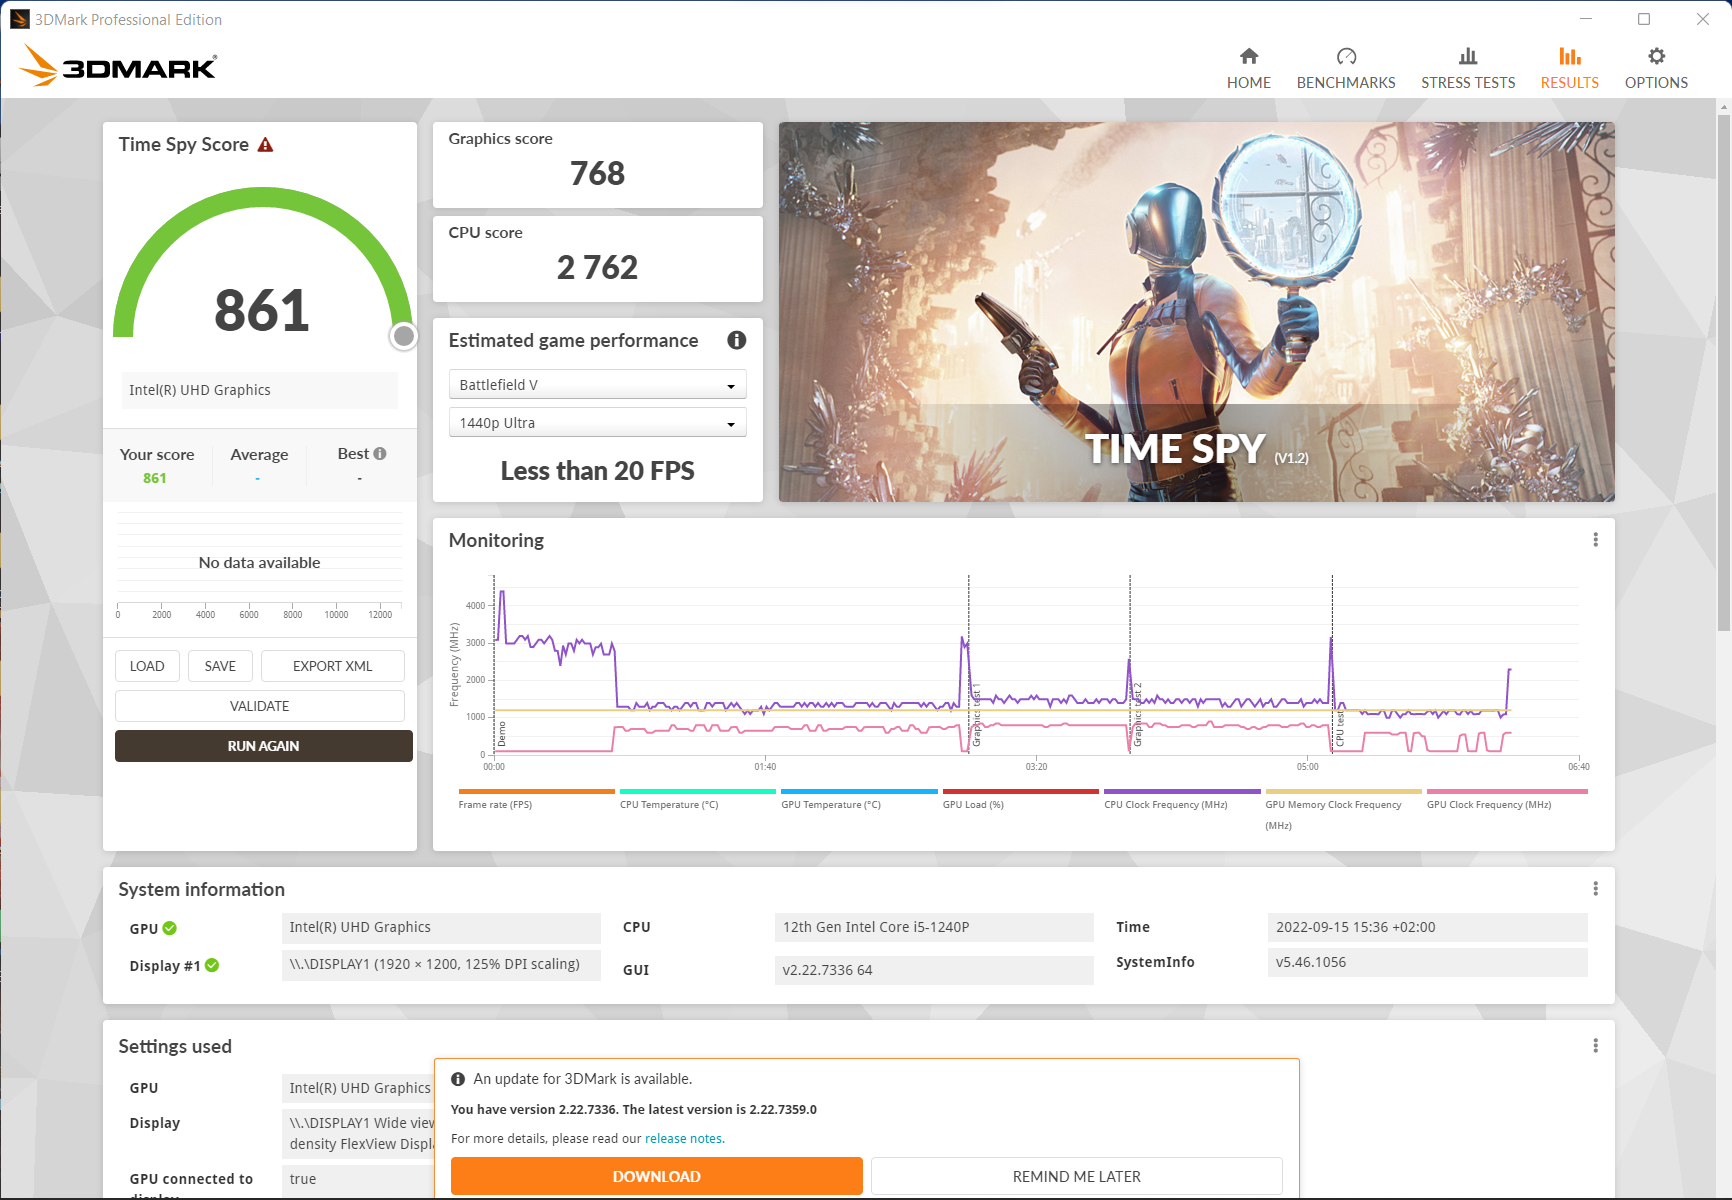
| 3DMark 11 Performance | 4851 points | |
| 3DMark Cloud Gate Standard Score | 14756 points | |
| 3DMark Fire Strike Score | 2695 points | |
| 3DMark Time Spy Score | 1161 points | |
Help | ||
| Shadow of the Tomb Raider - 1280x720 Lowest Preset | |
| HP ZBook Power 15 G8 313S5EA | |
| Average of class Office (25 - 105, n=2, last 2 years) | |
| Average Intel Iris Xe Graphics G7 80EUs (31 - 62.8, n=6) | |
| HP ProBook 450 G9 6A180EA | |
| Lenovo ThinkPad T16 G1 21BWS00200 | |
| GRID Legends - 1920x1080 Medium Preset | |
| HP ZBook Power 15 G8 313S5EA | |
| Average Intel Iris Xe Graphics G7 80EUs (25.7 - 39.7, n=4) | |
| HP ProBook 450 G9 6A180EA | |
| Lenovo ThinkPad T16 G1 21BWS00200 | |
| Average of class Office (n=1last 2 years) | |
Witcher 3 FPS Chart
| low | med. | high | ultra | |
|---|---|---|---|---|
| GTA V (2015) | 61.9 | 50.1 | 9.54 | |
| The Witcher 3 (2015) | 50.7 | 32.1 | 15.7 | 8.36 |
| Dota 2 Reborn (2015) | 97.5 | 66.3 | 35.2 | 32.7 |
| Final Fantasy XV Benchmark (2018) | 24.9 | 13.5 | ||
| X-Plane 11.11 (2018) | 42.5 | 29.1 | 26.5 | |
| Far Cry 5 (2018) | 30 | 15 | 14 | 13 |
| Strange Brigade (2018) | 52.7 | 20.3 | 17 | 13.8 |
| Shadow of the Tomb Raider (2018) | 31 | 11 | ||
| GRID Legends (2022) | 36.2 | 25.7 | 21 |
Emissions - A mostly silent 16-inch laptop from Lenovo
Noise
When idle, the ThinkPad T16 remains absolutely silent. Even during intensive web surfing and CPU-intensive tasks, the fan remains so quiet at an average of 25 dB(A) that you can hardly distinguish it from ambient noise.
Only under combined load, such as when gaming, do you realize that this is not a passively cooled device - although the laptop still maintains a low profile at 32 dB(A). However, the fan then runs at quite high tones. At least there are no annoying electronic noises.
Only the ThinkPad L15 G2 AMD and HP's ProBook 450 G9 are similarly quiet in comparison.
Noise Level
| Idle |
| 23.3 / 23.3 / 23.3 dB(A) |
| Load |
| 25.1 / 34 dB(A) |
 | ||
30 dB silent 40 dB(A) audible 50 dB(A) loud |
||
min: | ||
| Lenovo ThinkPad T16 G1 21BWS00200 Iris Xe G7 80EUs, i5-1240P, Samsung PM9A1 MZVL2512HCJQ | Lenovo ThinkPad T15 Gen2-20W5S00100 GeForce MX450, i7-1165G7, Samsung PM981a MZVLB1T0HBLR | Lenovo ThinkPad E15 G3-20YG003UGE Vega 8, R7 5700U, SK Hynix PC711 1TB HFS001TDE9X084N | Lenovo ThinkPad L15 G2 AMD Vega 7, R5 5600U, SK Hynix HFS512 GDE9X081N | HP ProBook 450 G9 6A180EA Iris Xe G7 96EUs, i7-1255U, SK Hynix HFM512GD3JX013N | HP ZBook Power 15 G8 313S5EA T600 Laptop GPU, i7-11800H, Samsung PM9A1 MZVL2512HCJQ | Dell Inspiron 16 Plus 7620 GeForce RTX 3050 Ti Laptop GPU, i7-12700H, Kioxia BG5 KBG50ZNS512G | Huawei MateBook D 16 2022 Iris Xe G7 96EUs, i7-12700H, Silicon Motion PCIe-8 SSD | Asus Vivobook Pro 16X-M7600QE GeForce RTX 3050 Ti Laptop GPU, R9 5900HX, SK Hynix HFM001TD3JX013N | |
|---|---|---|---|---|---|---|---|---|---|
| Noise | -12% | -10% | -4% | -5% | -33% | -34% | -21% | -27% | |
| off / environment * (dB) | 23.3 | 24.2 -4% | 23.8 -2% | 24.22 -4% | 25.5 -9% | 25.54 -10% | 23.3 -0% | 24.2 -4% | 26 -12% |
| Idle Minimum * (dB) | 23.3 | 24.2 -4% | 23.8 -2% | 24.22 -4% | 25.5 -9% | 25.54 -10% | 25.7 -10% | 24.2 -4% | 27 -16% |
| Idle Average * (dB) | 23.3 | 24.2 -4% | 23.8 -2% | 24.22 -4% | 25.5 -9% | 25.54 -10% | 26.1 -12% | 25.8 -11% | 27 -16% |
| Idle Maximum * (dB) | 23.3 | 24.2 -4% | 28 -20% | 24.22 -4% | 25.5 -9% | 25.54 -10% | 30.6 -31% | 30.5 -31% | 27.5 -18% |
| Load Average * (dB) | 25.1 | 34.5 -37% | 32.9 -31% | 25.84 -3% | 28 -12% | 48.85 -95% | 46.2 -84% | 39.8 -59% | 41.7 -66% |
| Witcher 3 ultra * (dB) | 32.1 | 37.6 -17% | 46.58 -45% | 49.2 -53% | 39.8 -24% | ||||
| Load Maximum * (dB) | 34 | 37.6 -11% | 35 -3% | 36.02 -6% | 27.7 19% | 50.98 -50% | 49.4 -45% | 39.8 -17% | 45.3 -33% |
* ... smaller is better
Temperature
The ThinkPad T16 stays cool in most scenarios, only heating up to a normal degree under sustained load. You don't notice much of this in the keyboard area, but only above it and even this does not feel too hot for a long time. The underside generally stays cooler, so you can use the ThinkPad T16 on your lap.
The direct predecessor and also the ThinkPad E15 heat up considerably more with a maximum of 55 °C and 60 °C, respectively, on the bottom. The ZBook Power 15 and Vivobook Pro 16X, on the other hand, remain similarly cool.
(±) The maximum temperature on the upper side is 45 °C / 113 F, compared to the average of 34.3 °C / 94 F, ranging from 21.2 to 62.5 °C for the class Office.
(±) The bottom heats up to a maximum of 42.8 °C / 109 F, compared to the average of 36.8 °C / 98 F
(+) In idle usage, the average temperature for the upper side is 30.4 °C / 87 F, compared to the device average of 29.5 °C / 85 F.
(±) Playing The Witcher 3, the average temperature for the upper side is 35.9 °C / 97 F, compared to the device average of 29.5 °C / 85 F.
(+) The palmrests and touchpad are reaching skin temperature as a maximum (33.4 °C / 92.1 F) and are therefore not hot.
(-) The average temperature of the palmrest area of similar devices was 27.6 °C / 81.7 F (-5.8 °C / -10.4 F).
| Lenovo ThinkPad T16 G1 21BWS00200 Intel Core i5-1240P, Intel Iris Xe Graphics G7 80EUs | Lenovo ThinkPad T15 Gen2-20W5S00100 Intel Core i7-1165G7, NVIDIA GeForce MX450 | Lenovo ThinkPad E15 G3-20YG003UGE AMD Ryzen 7 5700U, AMD Radeon RX Vega 8 (Ryzen 4000/5000) | Lenovo ThinkPad L15 G2 AMD AMD Ryzen 5 5600U, AMD Radeon RX Vega 7 | HP ProBook 450 G9 6A180EA Intel Core i7-1255U, Intel Iris Xe Graphics G7 96EUs | HP ZBook Power 15 G8 313S5EA Intel Core i7-11800H, NVIDIA T600 Laptop GPU | Dell Inspiron 16 Plus 7620 Intel Core i7-12700H, NVIDIA GeForce RTX 3050 Ti Laptop GPU | Huawei MateBook D 16 2022 Intel Core i7-12700H, Intel Iris Xe Graphics G7 96EUs | Asus Vivobook Pro 16X-M7600QE AMD Ryzen 9 5900HX, NVIDIA GeForce RTX 3050 Ti Laptop GPU | |
|---|---|---|---|---|---|---|---|---|---|
| Heat | 8% | -2% | 6% | -1% | 16% | 3% | 5% | 11% | |
| Maximum Upper Side * (°C) | 45 | 42.2 6% | 46.4 -3% | 42.8 5% | 40.5 10% | 41.4 8% | 46 -2% | 41.8 7% | 39.4 12% |
| Maximum Bottom * (°C) | 42.8 | 55.1 -29% | 60.9 -42% | 46 -7% | 47.6 -11% | 41.5 3% | 45.8 -7% | 47.3 -11% | 43.6 -2% |
| Idle Upper Side * (°C) | 33 | 23.8 28% | 26.5 20% | 26.9 18% | 32.6 1% | 23.8 28% | 29.2 12% | 28.3 14% | 27.6 16% |
| Idle Bottom * (°C) | 33.6 | 25.1 25% | 27.5 18% | 31.1 7% | 34.2 -2% | 25 26% | 31 8% | 30.2 10% | 27.5 18% |
* ... smaller is better
Stress Testing
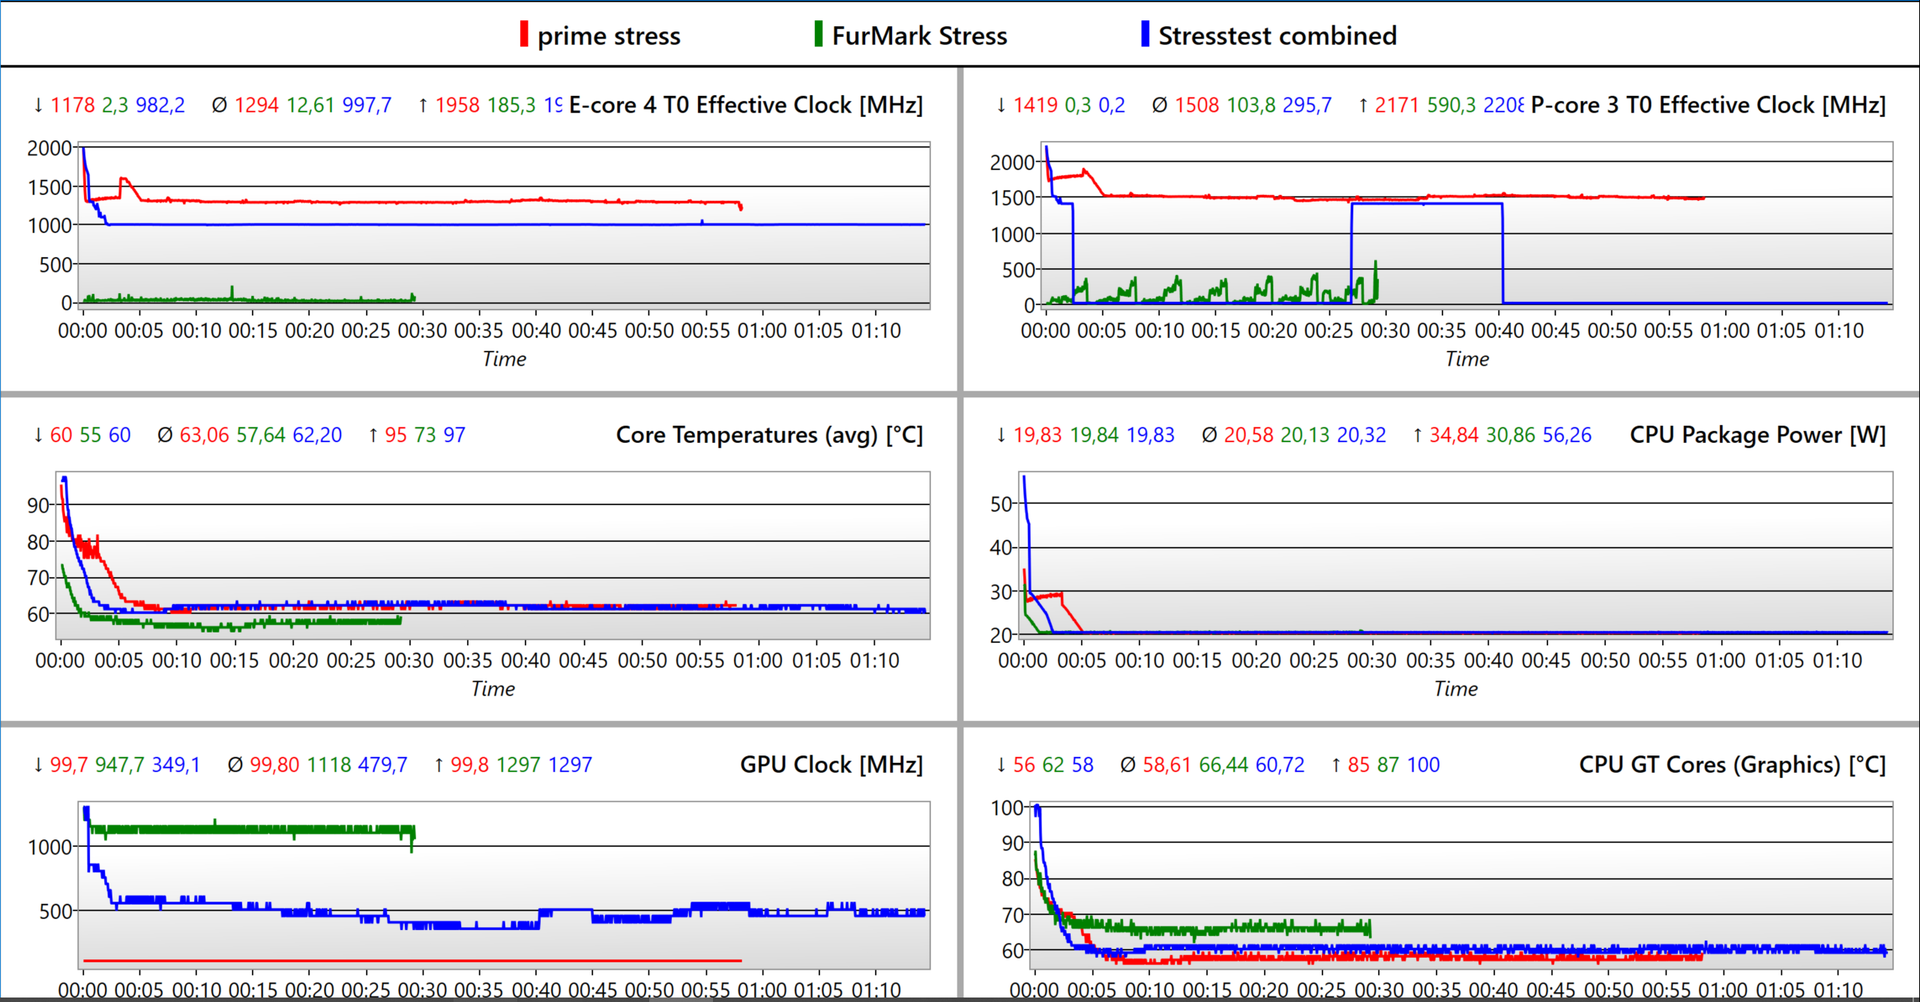
Under combined load (Prime95+FurMark), the P-cores dropped from 2.2 to 1.4 GHz after a short time - slightly below the base clock of 1.7 GHz. One of the cores (P-Core 0) seems to be deactivated most of the time (0 MHz). The temperature drops from an initial 95 °C to a stable 62 °C. The iGPU slips from 1300 MHz to 480 MHz at 61 °C. Once again, the problem is the set power limit of 20 watts.
Under pure CPU stress, the P-cores also do not reach their base clock, but clock at 1.5 GHz (all cores active). Only when the iGPU is stressed, does it manage 1,118 MHz at 66 °C.
| CPU Clock P- & E-Cores (GHz) | GPU Clock (MHz) | Average CPU Temperature (°C) | Average GPU Temperature (°C) | |
| System Idle | - | 100 | 34 | 36 |
| Prime95 + FurMark Stress | 1,4 / 1 | 480 | 62 | 61 |
| Prime95 Stress | 1,5 / 1,3 | 100 | 63 | 58 |
| FurMark Stress | 0,1 / 0,01 | 1.120 | 58 | 66 |
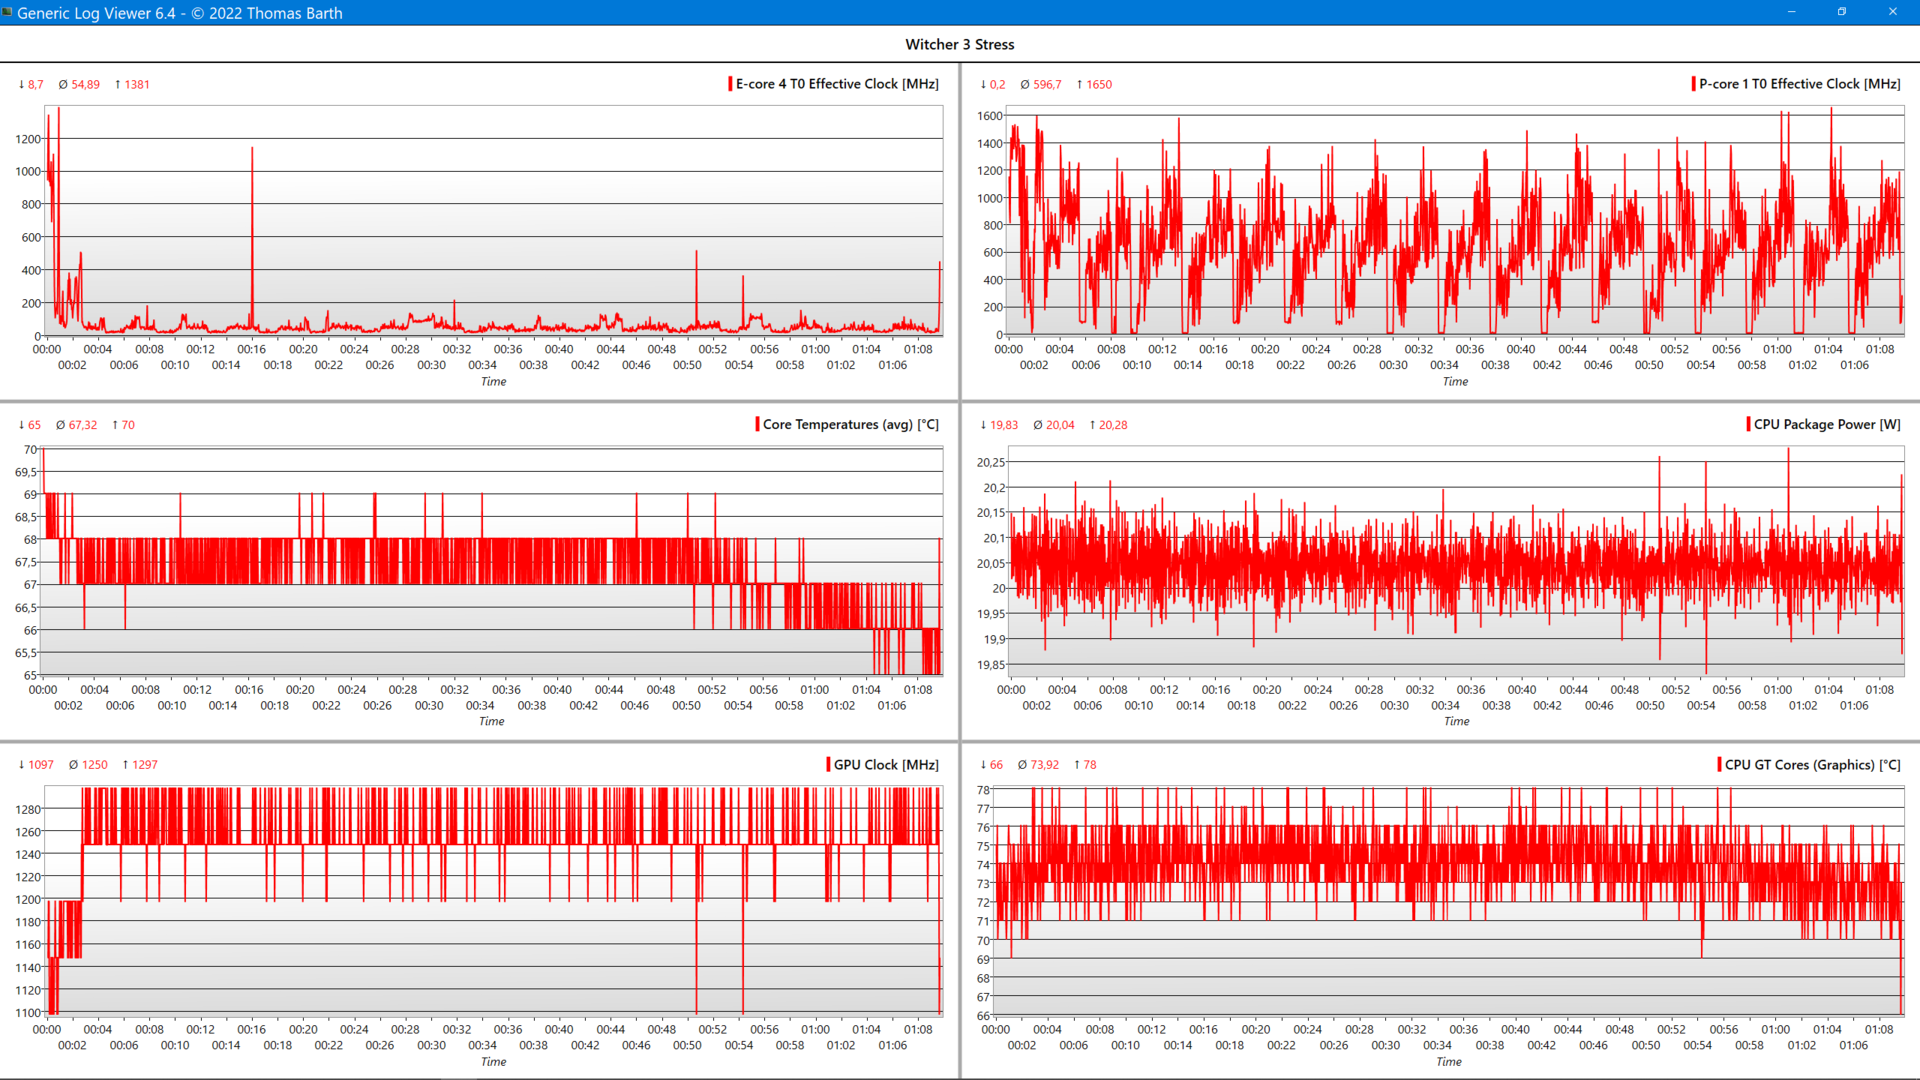
| Witcher 3 Stress | 0,6 / 0,05 | 1.250 | 67 | 74 |
Speakers
Fortunately, the speakers of the T-series have been improved. Bass is still missing, but mids and trebles are balanced and reproduced linearly.
This is acceptable for movies and videos, but music enjoyment is only possible with an external sound system or headphones connected via jack or Bluetooth. With a maximum of 75 dB(A), you can fill an average-sized room with sound.
Lenovo ThinkPad T16 G1 21BWS00200 audio analysis
(±) | speaker loudness is average but good (75.16 dB)
Bass 100 - 315 Hz
(-) | nearly no bass - on average 20.5% lower than median
(-) | bass is not linear (15.5% delta to prev. frequency)
Mids 400 - 2000 Hz
(+) | balanced mids - only 2.3% away from median
(+) | mids are linear (4.1% delta to prev. frequency)
Highs 2 - 16 kHz
(+) | balanced highs - only 3.2% away from median
(+) | highs are linear (5.5% delta to prev. frequency)
Overall 100 - 16.000 Hz
(±) | linearity of overall sound is average (17% difference to median)
Compared to same class
» 22% of all tested devices in this class were better, 7% similar, 71% worse
» The best had a delta of 7%, average was 21%, worst was 53%
Compared to all devices tested
» 29% of all tested devices were better, 8% similar, 63% worse
» The best had a delta of 4%, average was 24%, worst was 134%
Huawei MateBook D 16 2022 audio analysis
(±) | speaker loudness is average but good (76 dB)
Bass 100 - 315 Hz
(-) | nearly no bass - on average 17.7% lower than median
(±) | linearity of bass is average (9.8% delta to prev. frequency)
Mids 400 - 2000 Hz
(+) | balanced mids - only 1.9% away from median
(+) | mids are linear (5.6% delta to prev. frequency)
Highs 2 - 16 kHz
(+) | balanced highs - only 4.4% away from median
(+) | highs are linear (3.1% delta to prev. frequency)
Overall 100 - 16.000 Hz
(±) | linearity of overall sound is average (16.2% difference to median)
Compared to same class
» 38% of all tested devices in this class were better, 8% similar, 55% worse
» The best had a delta of 5%, average was 18%, worst was 45%
Compared to all devices tested
» 25% of all tested devices were better, 5% similar, 70% worse
» The best had a delta of 4%, average was 24%, worst was 134%
Power Management - 14-hour battery in the 16-inch ThinkPad
Power Consumption
We measured a low idle power consumption of ~6 watts and a minimum of 2.9 watts. Our comparison field, including AMD derivatives, is no match for this. Under load, we measured an average of 27.9 watts - a value that is due to the throttled CPU. Combined load (CPU+iGPU) results in 42.6 watts.
Power peaks of up to 90 watts, caused by the short-term turbo, can be absorbed well by the 135 W power adapter. Moreover, the power adapter allows the large 86 Wh battery to be quickly charged to 80% in one hour. It remains questionable whether a 100-watt power adapter, which would be a little more compact and is offered with the AMD version, would do the job just as well.
| Off / Standby | |
| Idle | |
| Load |
|
Key:
min: | |
| Lenovo ThinkPad T16 G1 21BWS00200 i5-1240P, Iris Xe G7 80EUs, Samsung PM9A1 MZVL2512HCJQ, IPS, 1920x1200, 16" | Lenovo ThinkPad T15 Gen2-20W5S00100 i7-1165G7, GeForce MX450, Samsung PM981a MZVLB1T0HBLR, IPS, 1920x1080, 15.6" | Lenovo ThinkPad X1 Extreme G4-20Y5CTO1WW (3050 Ti) i7-11800H, GeForce RTX 3050 Ti Laptop GPU, Samsung PM9A1 MZVL21T0HCLR, IPS LED, 3840x2400, 16" | HP ProBook 450 G9 6A180EA i7-1255U, Iris Xe G7 96EUs, SK Hynix HFM512GD3JX013N, , 1920x1080, 15.6" | HP ZBook Power 15 G8 313S5EA i7-11800H, T600 Laptop GPU, Samsung PM9A1 MZVL2512HCJQ, IPS LED, 1920x1080, 15.6" | Huawei MateBook D 16 2022 i7-12700H, Iris Xe G7 96EUs, Silicon Motion PCIe-8 SSD, IPS, 1920x1200, 16" | Dell Inspiron 16 Plus 7620 i7-12700H, GeForce RTX 3050 Ti Laptop GPU, Kioxia BG5 KBG50ZNS512G, IPS, 3072x1920, 16" | Lenovo ThinkPad L15 G2 AMD R5 5600U, Vega 7, SK Hynix HFS512 GDE9X081N, IPS LED, 1920x1080, 15.6" | Average of class Office | |
|---|---|---|---|---|---|---|---|---|---|
| Power Consumption | -44% | -210% | -8% | -55% | -70% | -151% | -14% | -27% | |
| Idle Minimum * (Watt) | 2.9 | 4.5 -55% | 10.3 -255% | 4.5 -55% | 4.17 -44% | 6.1 -110% | 6.8 -134% | 4.57 -58% | 4.55 ? -57% |
| Idle Average * (Watt) | 6 | 8.8 -47% | 22.06 -268% | 7.3 -22% | 6.32 -5% | 10.6 -77% | 9.6 -60% | 8.2 -37% | 7.42 ? -24% |
| Idle Maximum * (Watt) | 6.9 | 11.6 -68% | 23 -233% | 8.1 -17% | 7.1 -3% | 11.5 -67% | 17 -146% | 9.3 -35% | 8.84 ? -28% |
| Load Average * (Watt) | 27.3 | 60 -120% | 102.57 -276% | 32.8 -20% | 80.41 -195% | 65.5 -140% | 117.5 -330% | 31.9 -17% | 41.6 ? -52% |
| Witcher 3 ultra * (Watt) | 42.6 | 39.2 8% | 106 -149% | 32 25% | 62.3 -46% | 61.2 -44% | 113.1 -165% | 34.5 19% | |
| Load Maximum * (Watt) | 81.53 | 68.5 16% | 147.8 -81% | 47 42% | 110.18 -35% | 68.4 16% | 137.4 -69% | 47.4 42% | 61.8 ? 24% |
* ... smaller is better
Power consumption Witcher 3 / Stress test
Power consumption with an external monitor
Battery Life
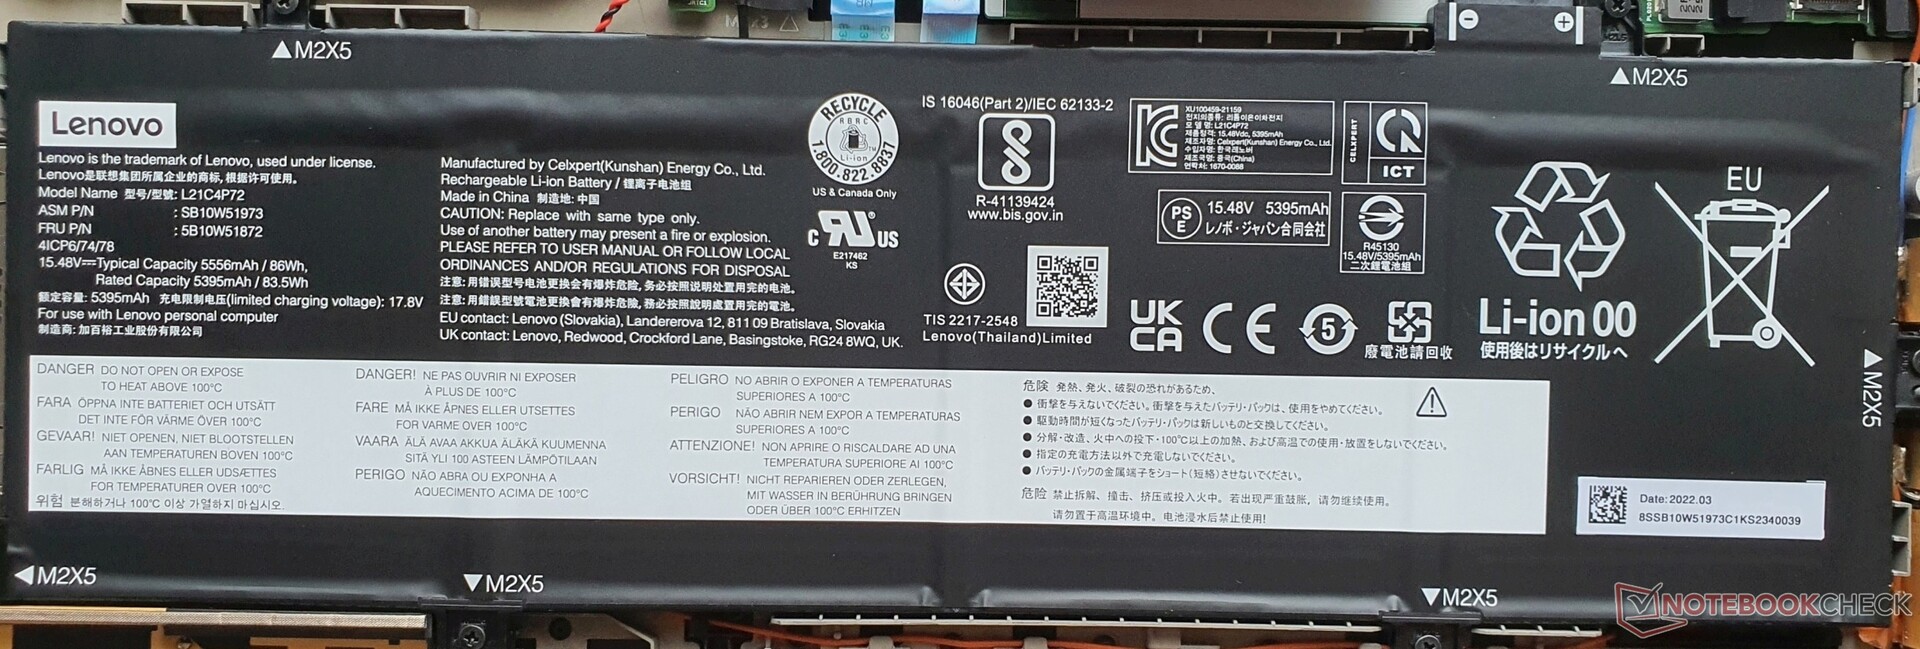
Despite our model's large 86 Wh battery, we didn't expect the WLAN test to last for more than 14 hours. We use a script that simulates web surfing at a fixed 150 nits, using the "Balanced" energy profile in Windows. The Core i5-1240P seems to be more economical than the Core i7-1280P, probably because the latter has more P-cores. The low-power display with FHD+ resolution also has a positive effect, especially at full brightness of 390 nits, where the ThinkPad achieves almost 11 hours.
An exciting prospect is whether an AMD variant of the T16 will be able to offer even more. The full-load runtime of 3.5 hours is correspondingly long due to the low power limit of 20 watts.
| Lenovo ThinkPad T16 G1 21BWS00200 i5-1240P, Iris Xe G7 80EUs, 86 Wh | Lenovo ThinkPad T15 Gen2-20W5S00100 i7-1165G7, GeForce MX450, 57 Wh | Lenovo ThinkPad E15 G3-20YG003UGE R7 5700U, Vega 8, 57 Wh | Lenovo ThinkPad L15 G2 AMD R5 5600U, Vega 7, 45 Wh | HP ProBook 450 G9 6A180EA i7-1255U, Iris Xe G7 96EUs, 51 Wh | HP ZBook Power 15 G8 313S5EA i7-11800H, T600 Laptop GPU, 83 Wh | Dell Inspiron 16 Plus 7620 i7-12700H, GeForce RTX 3050 Ti Laptop GPU, 86 Wh | Huawei MateBook D 16 2022 i7-12700H, Iris Xe G7 96EUs, 60 Wh | Asus Vivobook Pro 16X-M7600QE R9 5900HX, GeForce RTX 3050 Ti Laptop GPU, 96 Wh | |
|---|---|---|---|---|---|---|---|---|---|
| Battery Runtime | -44% | -29% | -45% | -17% | -19% | -49% | -50% | -45% | |
| H.264 (h) | 10.4 | 10.1 -3% | |||||||
| WiFi v1.3 (h) | 14.1 | 7.9 -44% | 10 -29% | 7.8 -45% | 10.1 -28% | 12.3 -13% | 9.6 -32% | 7.1 -50% | 11.3 -20% |
| Load (h) | 3.5 | 3.3 -6% | 2.1 -40% | 1.2 -66% | 1.1 -69% | ||||
| Witcher 3 ultra (h) | 2.7 |
Pros
Cons
Verdict - ThinkPad T16: Strong display, long runtimes, throttled performance

The ThinkPad T16 G1 Intel offers a lot: a 16-inch, bright 16:10 low-power display, very long battery runtimes, diverse equipment and mostly silent operation. On top of this, a robust high-end design.
A successful redesign overall, despite the shorter key travel and missing 4K option. The PL1 limitation of 20 watts is a little annoying, which unnecessarily limits the otherwise good performance.
Lenovo offers a solid business notebook with a very long battery life, bright low-power 16:10 display and low emissions in the ThinkPad T16 G1. However, the CPU's throttling may prove to be problematic outside of office tasks.
For business users looking for a compact device with a lot of screen real estate and long battery runtimes, the T16 seems to be unrivaled in its good keyboard, features and quiet behavior. The soon to be released review of HP's EliteBook 865 G9 is thus an exciting prospect. Also exciting will be the comparison with the AMD variant of the T16, which has the potential to deliver more performance with even lower emissions and even higher runtimes, but this remains to be seen in a future review.
Those who also need workstation GPU should look at the ZBook Power 15. Those who do not need the best of the best will find a better price-performance ratio in the ThinkPad E15 AMD, which is more than twice as cheap.
Price and Availability
The Lenovo ThinkPad T16 G1 Intel laptop appears to be widely available as a freely configurable laptop via Lenovo's official website. For example, we found the laptop in the US (starting at $1,099.50), the UK (£1,169.99), India (₹97,185), France (1,427.25€), Singapore (SG$1,494.58) and Australia (AU$2,229.00). This list is not exhaustive.
Prices are as of 23.09.22 and subject to change.
Lenovo ThinkPad T16 G1 21BWS00200
- 09/21/2022 v7 (old)
Marvin Gollor
More articles related to this device
Lenovo ThinkPad T16 G1 21BWS00200 (ThinkPad T16 Series)Related Articles


Price comparison

