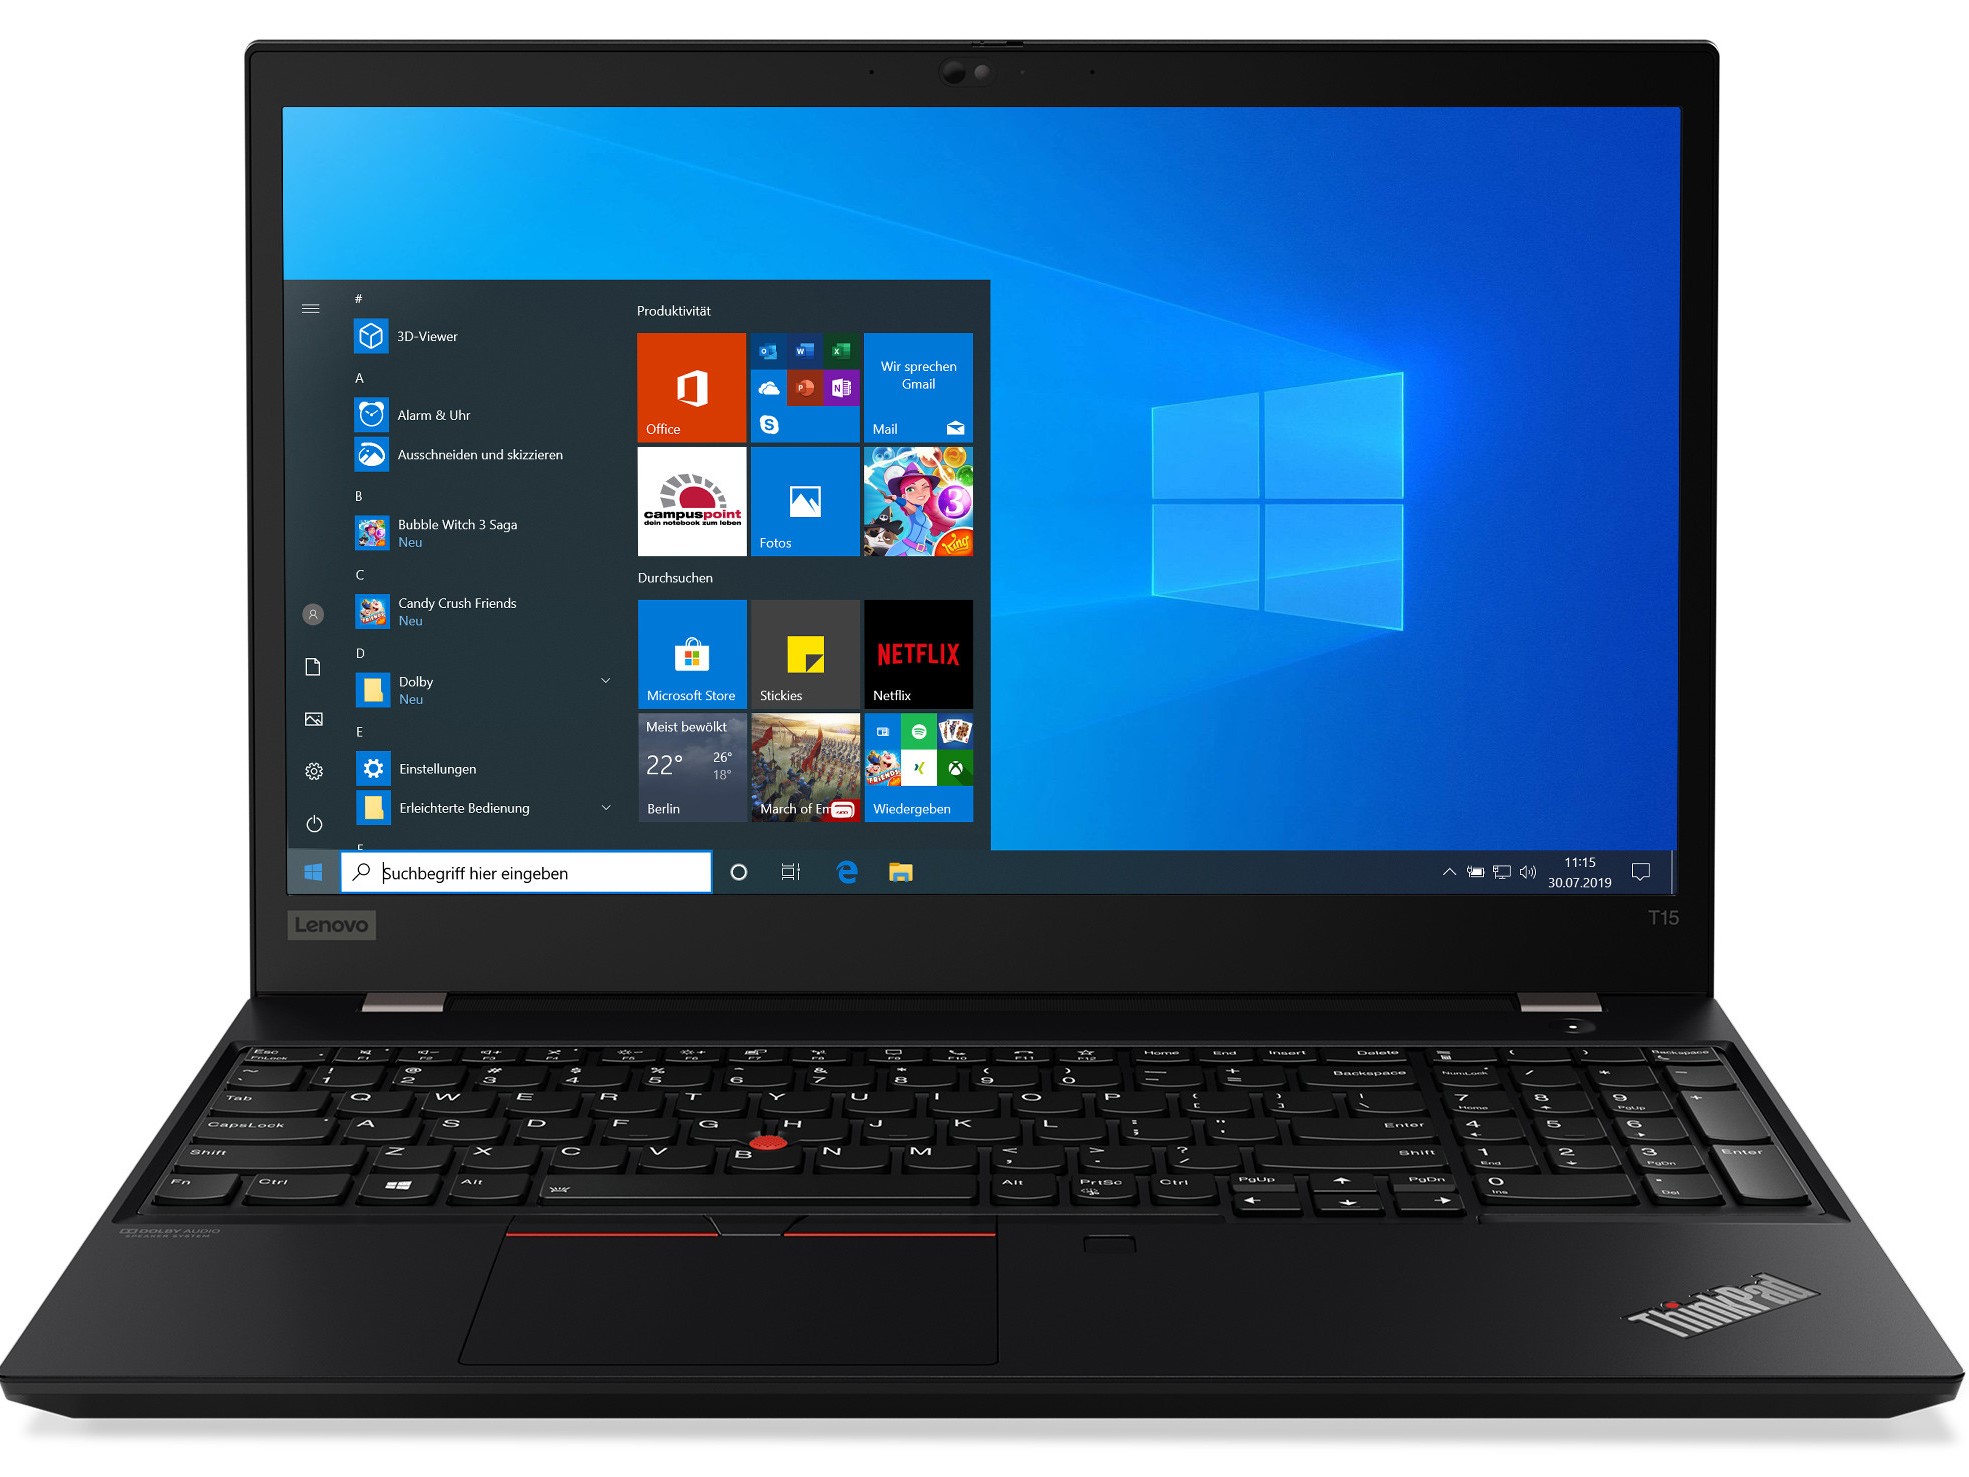
Lenovo ThinkPad T15 Gen2 laptop in review: Business combined with media GPU and Tiger Lake

The Lenovo ThinkPad T15 Gen1 remained a bit behind the possibilities of its time due to the missing AMD option. However, since Intel has caught up a lot with Tiger-Lake, this should no longer be a problem for the successor ThinkPad T15 Gen2. This is equipped with an Intel Core i7-1165G7, a Nvidia GeForce MX45016 GB RAM and a 1 TB SSD.
With prices starting at 1,350 Euros (~$1627), the notebook, which is suitable for business and also multimedia applications, faces the competition listed below. You can also add more devices from our database for comparison under each section.
Possible competitors in comparison
Rating | Date | Model | Weight | Height | Size | Resolution | Price |
|---|---|---|---|---|---|---|---|
| 87.1 % v7 (old) | 05 / 2021 | Lenovo ThinkPad T15 Gen2-20W5S00100 i7-1165G7, GeForce MX450 | 1.9 kg | 19.1 mm | 15.60" | 1920x1080 | |
| 83.4 % v7 (old) | 12 / 2020 | Asus VivoBook S15 S533EQ-BQ002T i7-1165G7, GeForce MX350 | 1.8 kg | 16.1 mm | 15.60" | 1920x1080 | |
| 87.7 % v7 (old) | 12 / 2020 | Schenker Vision 15 i7-1165G7, Iris Xe G7 96EUs | 1.7 kg | 15 mm | 15.60" | 1920x1080 | |
| 87.2 % v7 (old) | 07 / 2020 | Lenovo ThinkPad T15 Gen1-20S7S02U00 i7-10510U, GeForce MX330 | 1.8 kg | 19.95 mm | 15.60" | 3840x2160 | |
| 85.8 % v7 (old) | 02 / 2021 | Lenovo ThinkPad E15 Gen2-20TD002MGE i7-1165G7, GeForce MX450 | 1.8 kg | 18.9 mm | 15.60" | 1920x1080 |
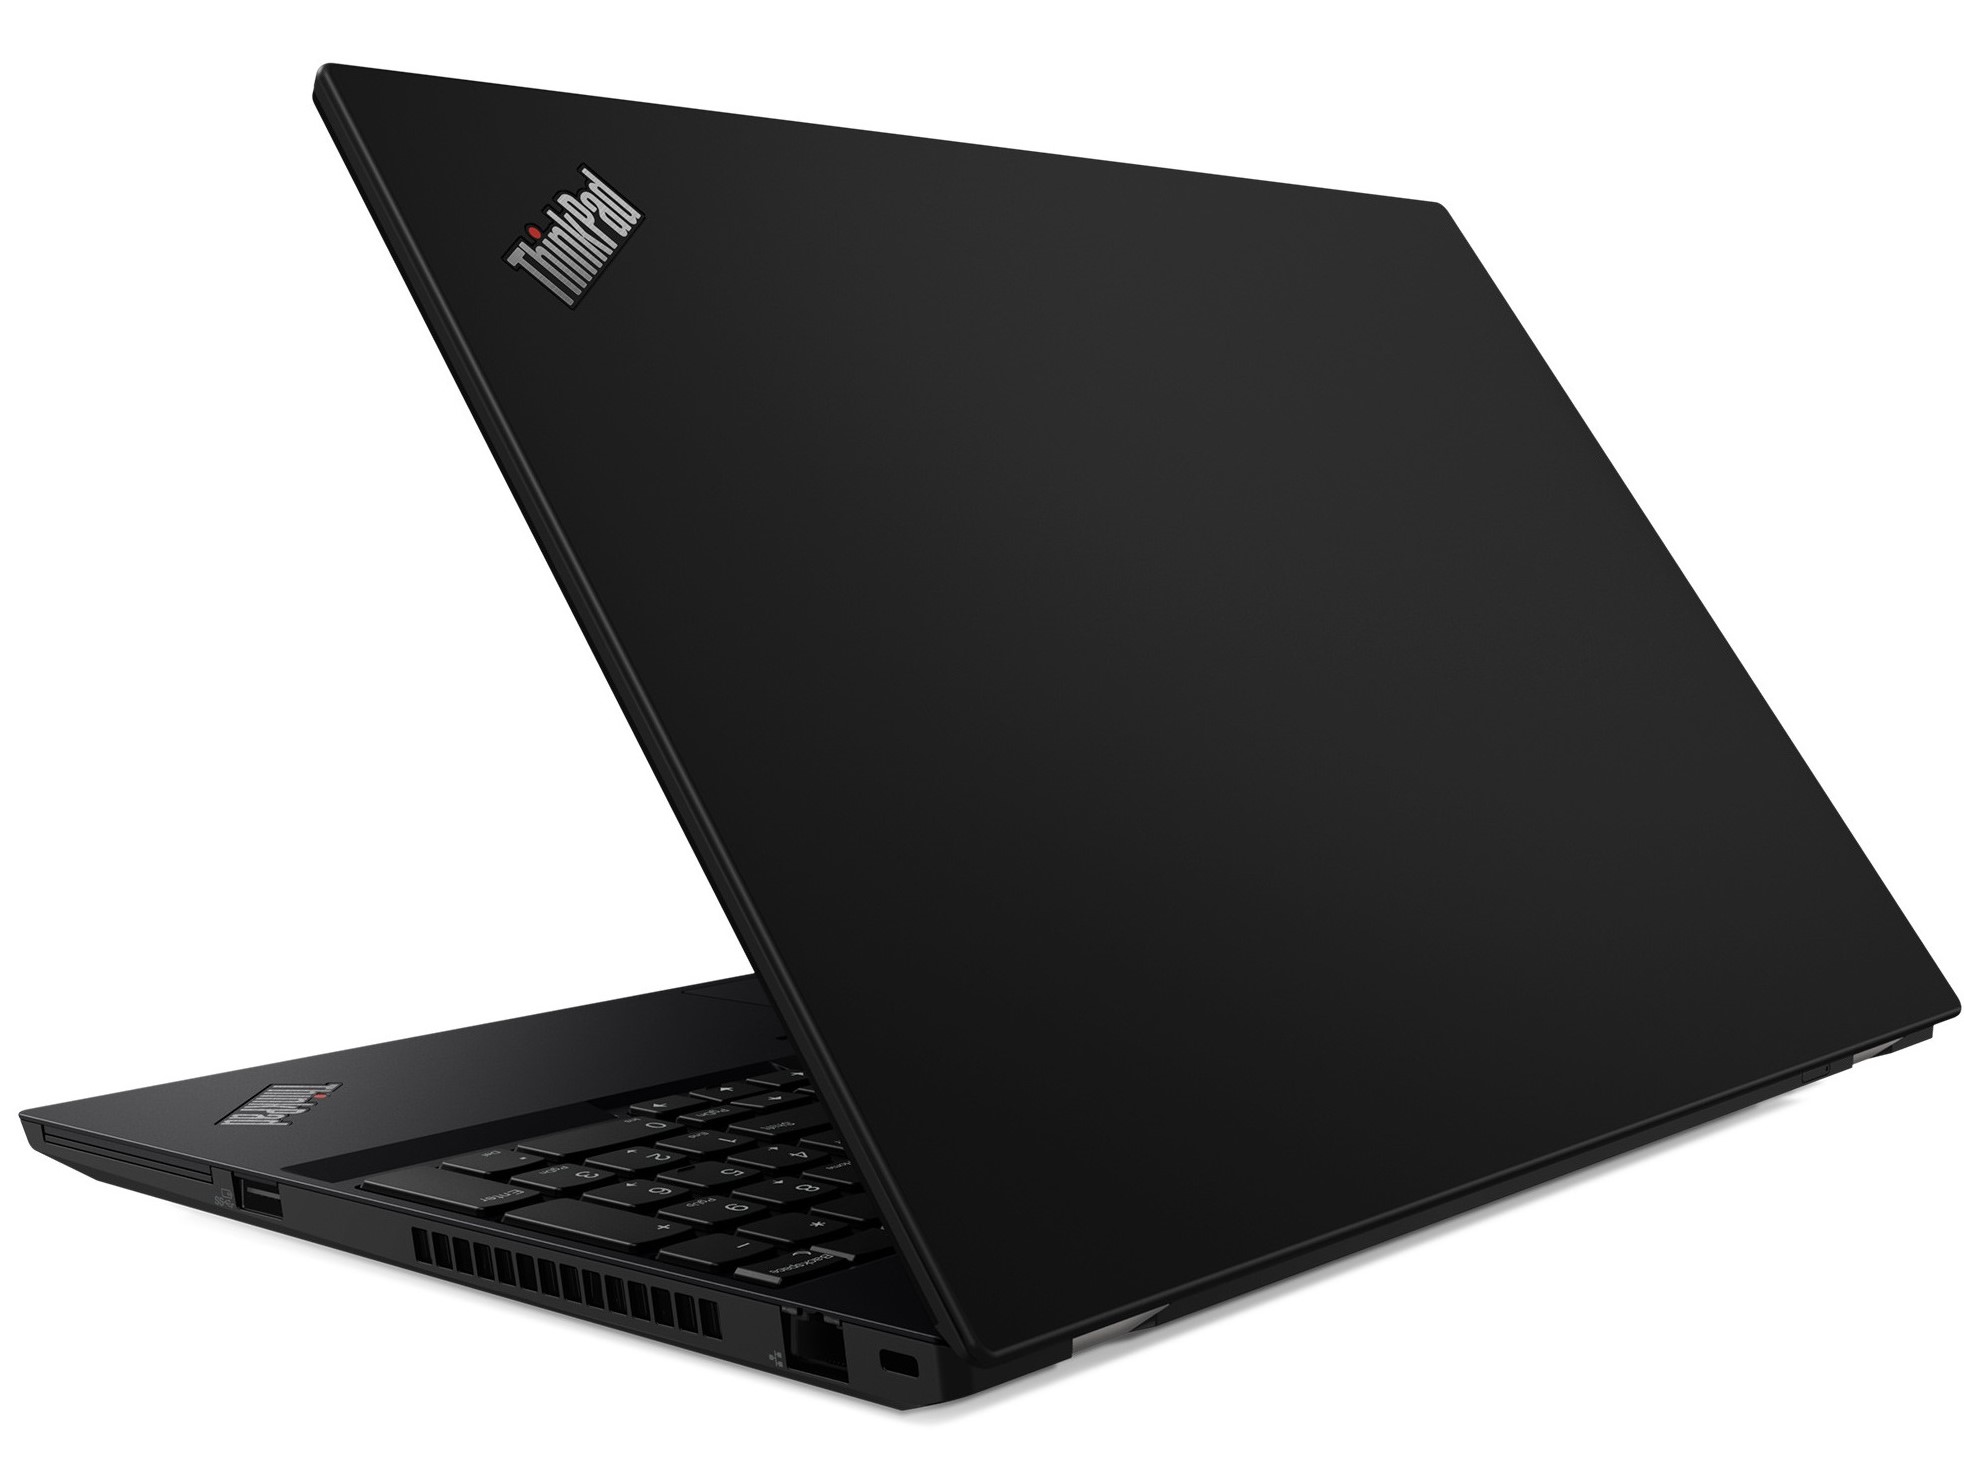
Case and equipment - ThinkPad T15 now with two Thunderbolt 4 ports
Lenovo leaves the case of the ThinkPad T15 Gen2 unchanged. Thus, it is still compact and robust at the same time, but its slightly wider display bezel makes it larger than many competitors. However, the Thunderbolt 4 ports are new, both of which can also be used to charge the T15 Gen 2.
A microSD card reader is also available again. This was unfortunately defective in our test device and would be repaired as a warranty case. However, we assume that the good write and read rates compared to the Predecessor model have not changed significantly compared to the predecessor.
Connections to wireless networks can be established by Lenovo's notebook via WiFi 6E. In combination with our reference router Netgear Nighthawk AX12, very good speeds are achieved with 1,386 MBit/s when receiving data and 1,464 MBit/s when transmitting data, which are on par with the predecessor.
The quality of the 0.9 MP webcam remains mediocre.


Connection equipment


SDCardreader
| SD Card Reader | |
| average JPG Copy Test (av. of 3 runs) | |
| Lenovo ThinkPad T15 Gen1-20S7S02U00 (Toshiba Exceria Pro M501 64 GB UHS-II) | |
| Average of class Office (22.4 - 198.5, n=27, last 2 years) | |
| Asus VivoBook S15 S533EQ-BQ002T (Toshiba Exceria Pro M501 microSDXC 64GB) | |
| maximum AS SSD Seq Read Test (1GB) | |
| Lenovo ThinkPad T15 Gen1-20S7S02U00 (Toshiba Exceria Pro M501 64 GB UHS-II) | |
| Average of class Office (27.4 - 249, n=25, last 2 years) | |
| Asus VivoBook S15 S533EQ-BQ002T (Toshiba Exceria Pro M501 microSDXC 64GB) | |
Communication
Webcam


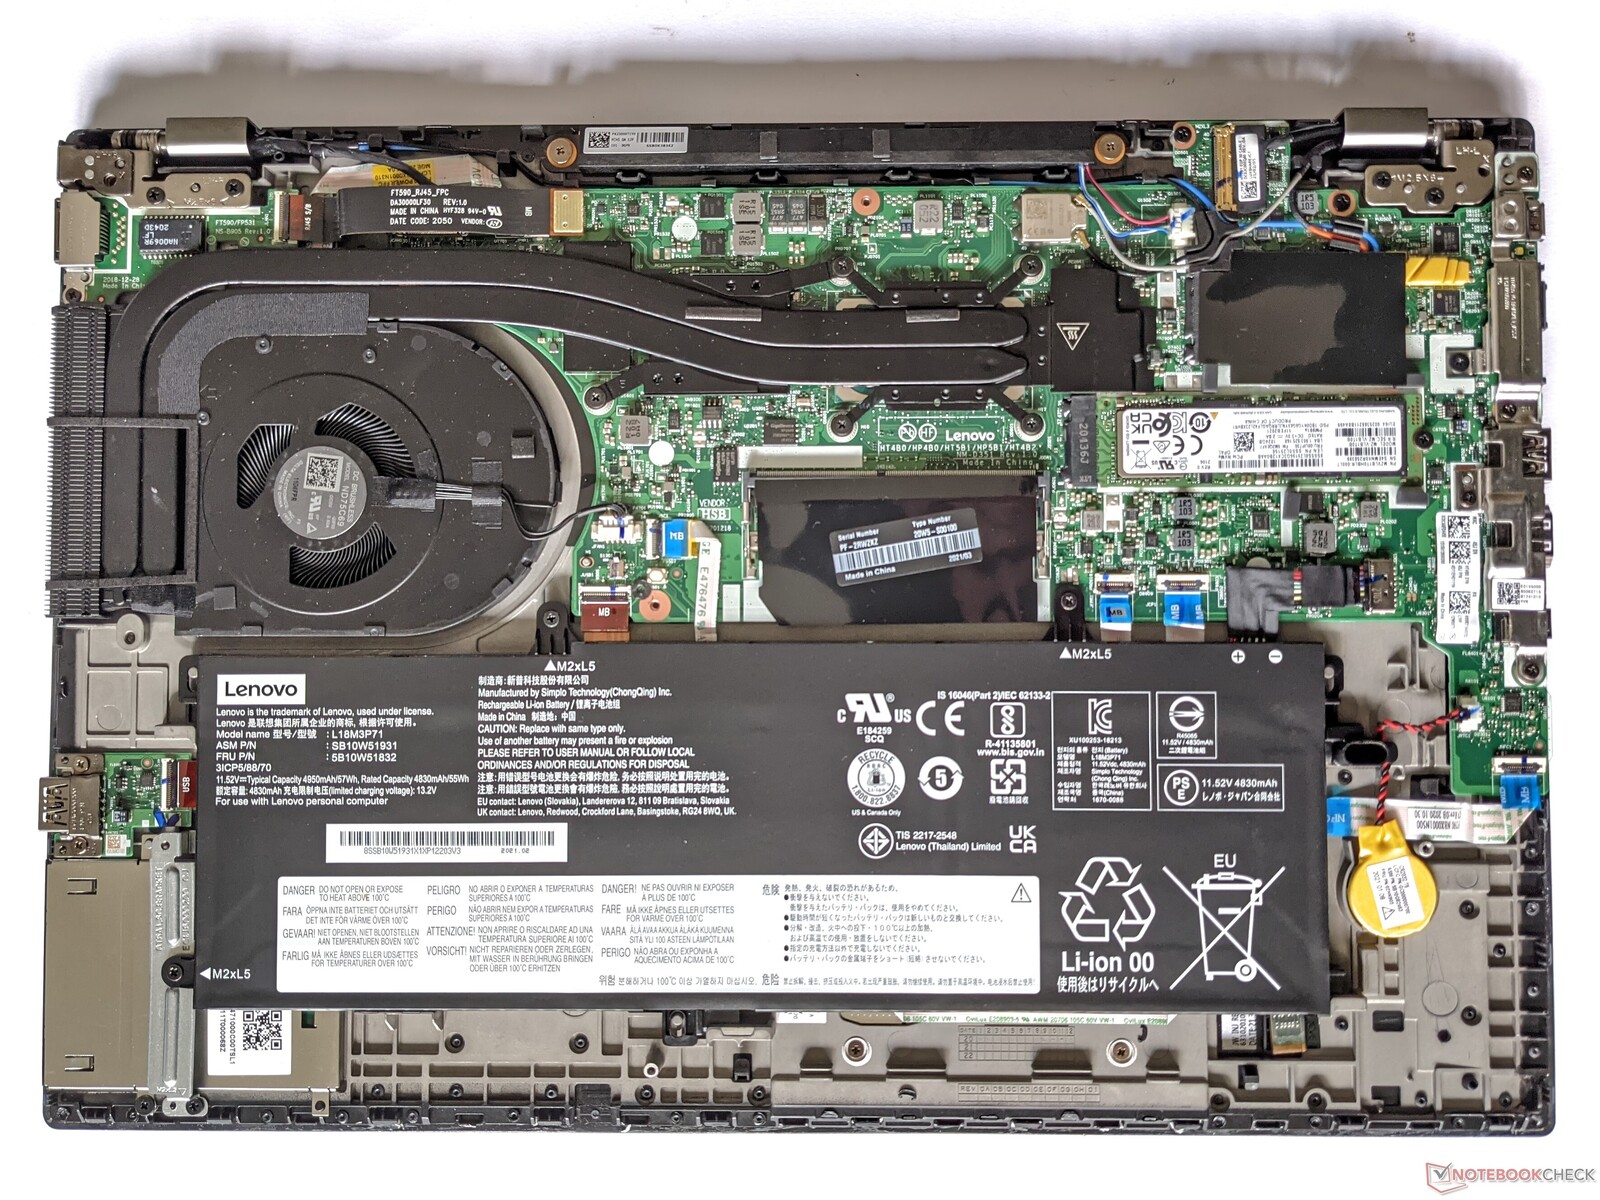
Maintenance, accessories and warranty
Before the casing of the T15 Gen2 can be opened, all screws on the bottom and the SIM slot for the optional WLAN on the back have to be removed. Even after that, the base plate is still very tightly hooked and can only be released with a lot of patience. Inside, there is a free RAM slot, the swappable SSD and a slot with antennas for a WWAN module.
Lenovo offers various docking solutions and other general accessories for the ThinkPad T15 on its own website. The warranty period is 36 months and can be extended up to 5 years for a fee.

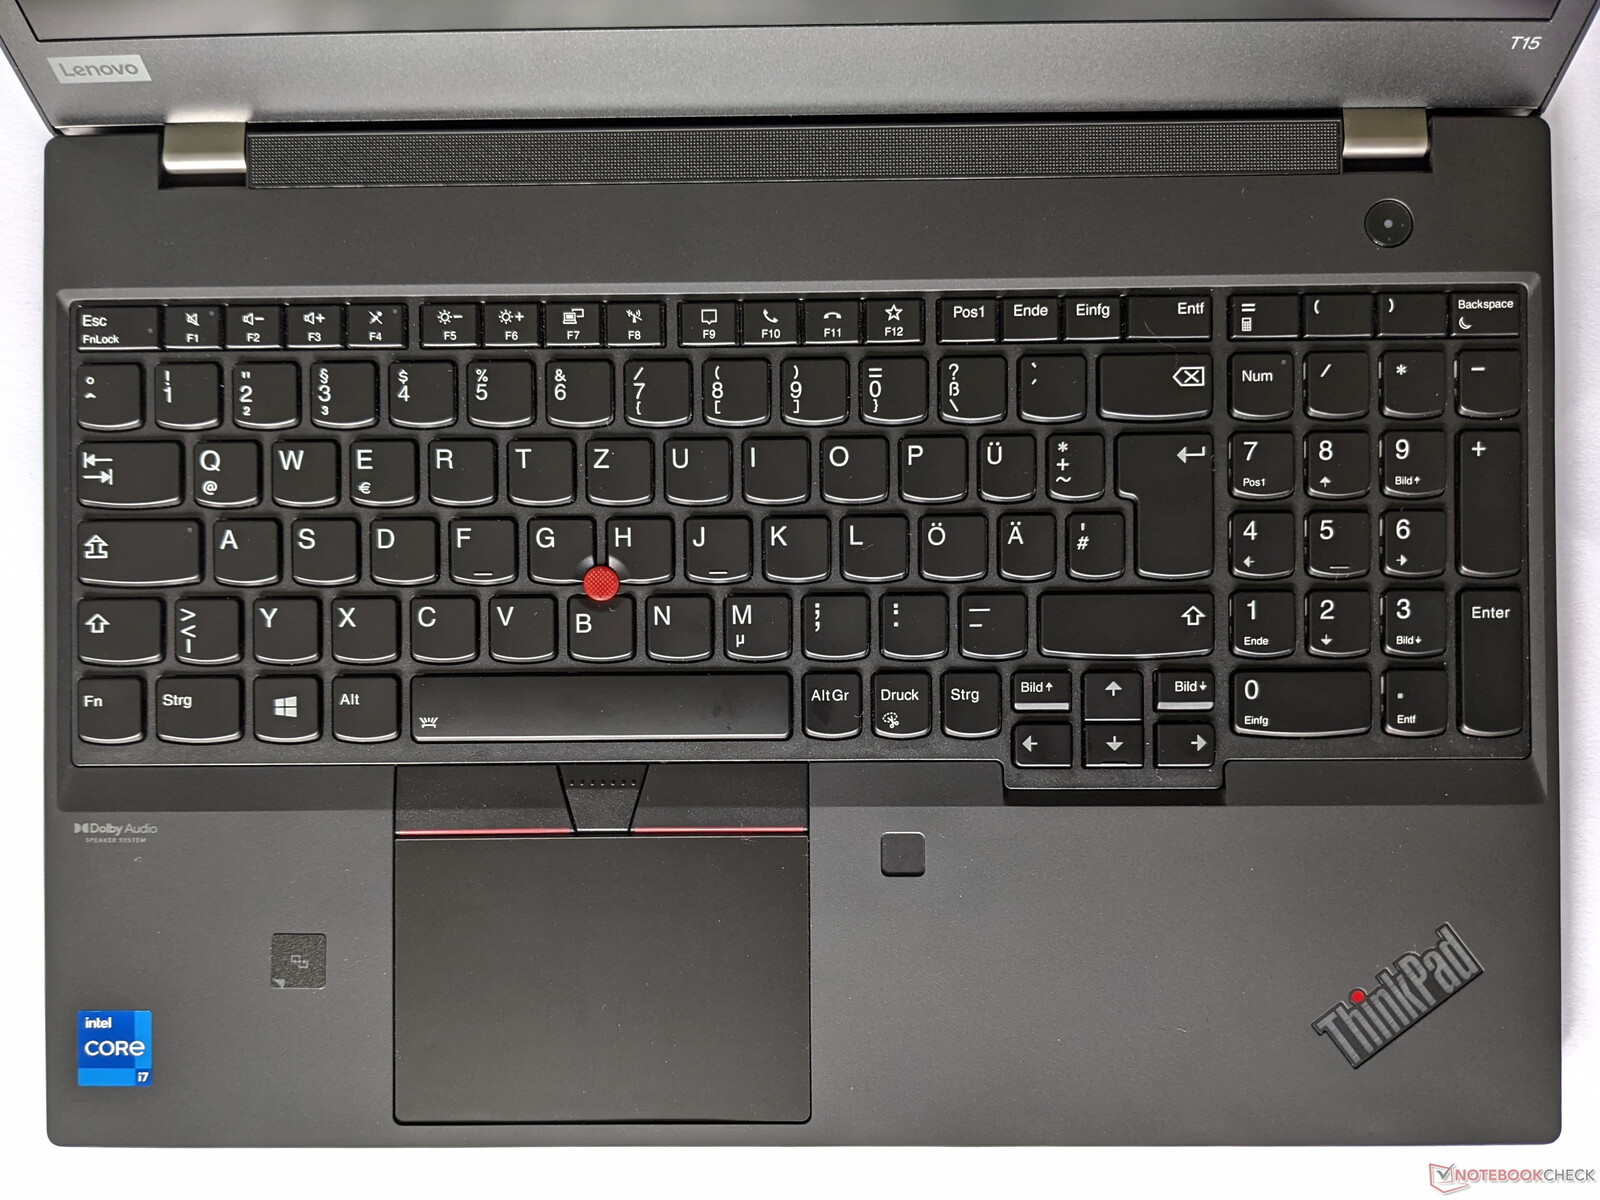
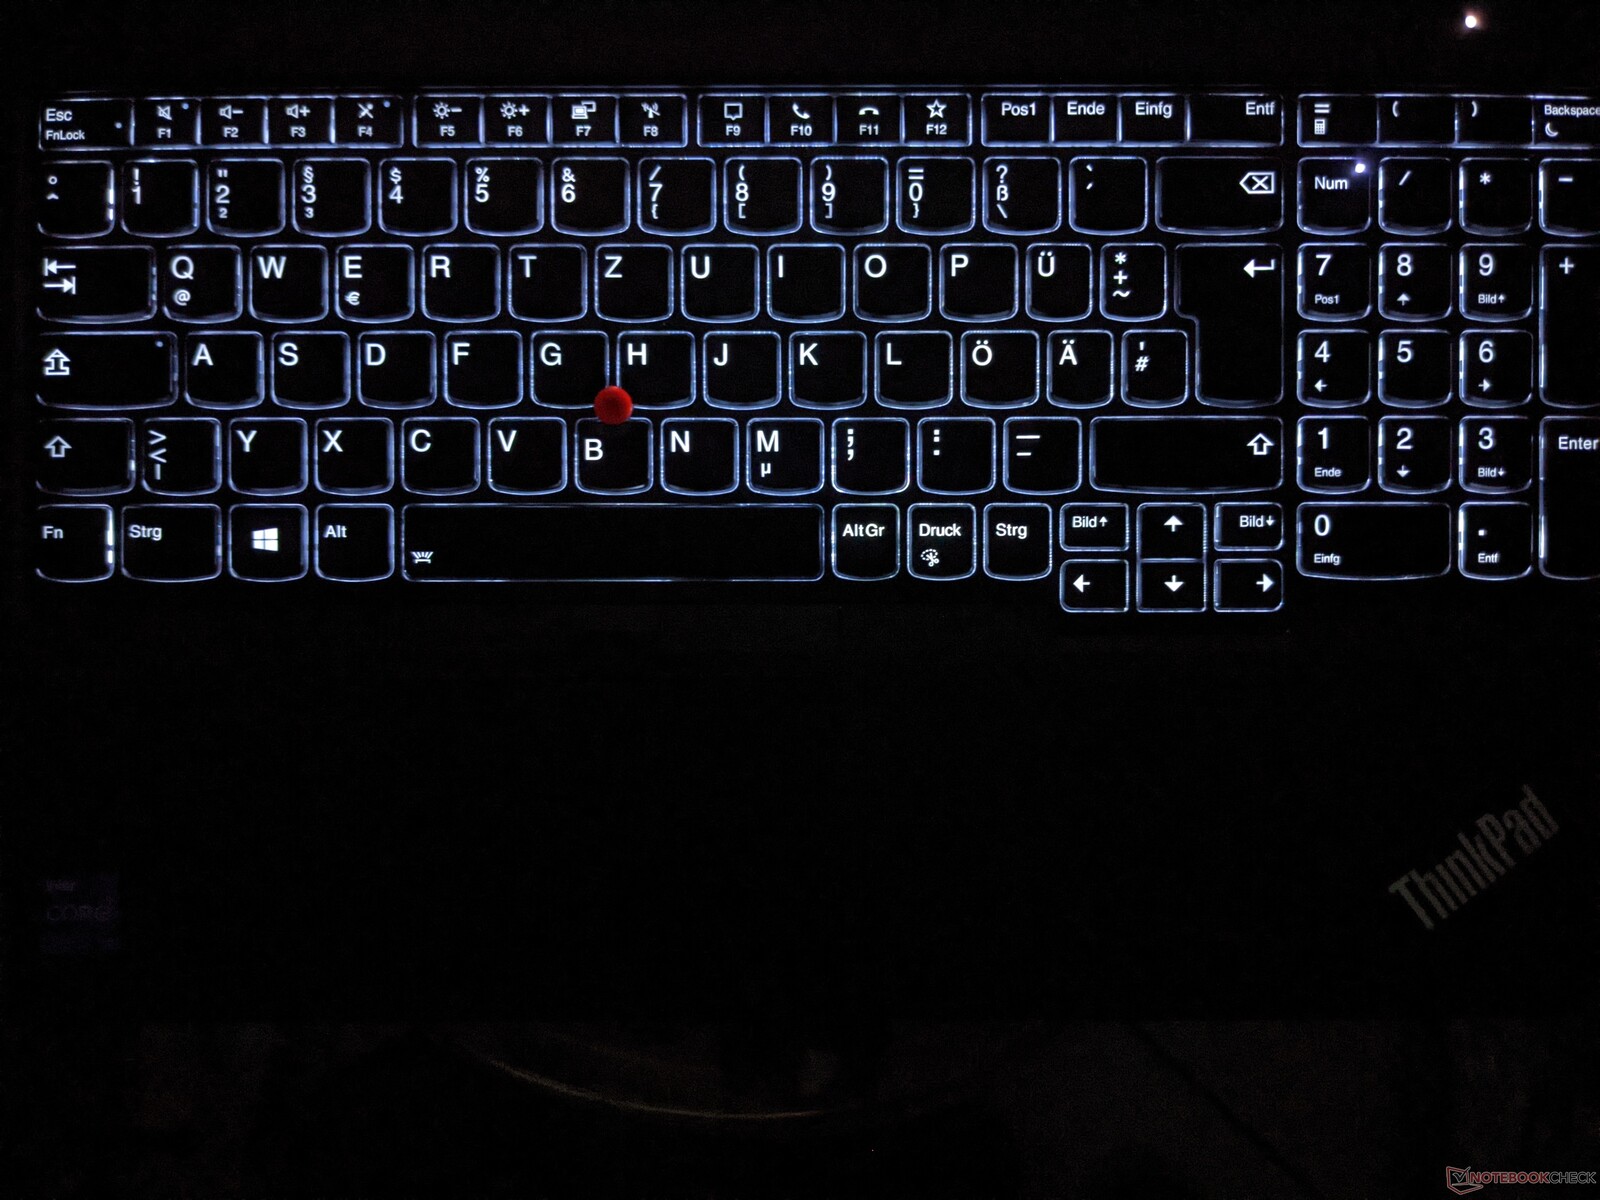
Input devices - Fast fingerprint sensor and NFC
The keyboard corresponds to Lenovo's typical layout and offers good feedback when typing. Besides the full-sized number pad, the scroll keys as well as Home, End, Del, and Print are listed separately. A two-stage key illumination also makes it easier to recognize the lettering in low-light conditions.
A clickpad and a trackpoint with separated mouse buttons are available as mouse replacements. Both are well suited for navigating the mouse pointer and clicks are triggered reliably via touch as well as mechanical pressure.
In addition, there is a fast-reacting fingerprint sensor and an NFC sensor, which are both installed next to the touchpad.
Display - grainy surface is annoying
The screen of the ThinkPad T15 Gen2 consists of a 15.6-inch IPS panel and offers a resolution of 1,920 x 1,080 pixels. The brightness of 348 cd/m² on average is on a medium level compared with our test field. The ThinkPad T15 Gen 1 had a significantly higher brightness. Lenovo does not use PWM for brightness control.
Besides the display installed here, Lenovo also offers the ThinkPad T15 Gen2 with a touch-enabled FullHD panel (300cd/m²) and a Dolby Vision-enabled UHD panel (600cd/m²).


| |||||||||||||||||||||||||
Brightness Distribution: 95 %
Center on Battery: 354 cd/m²
Contrast: 1765:1 (Black: 0.2 cd/m²)
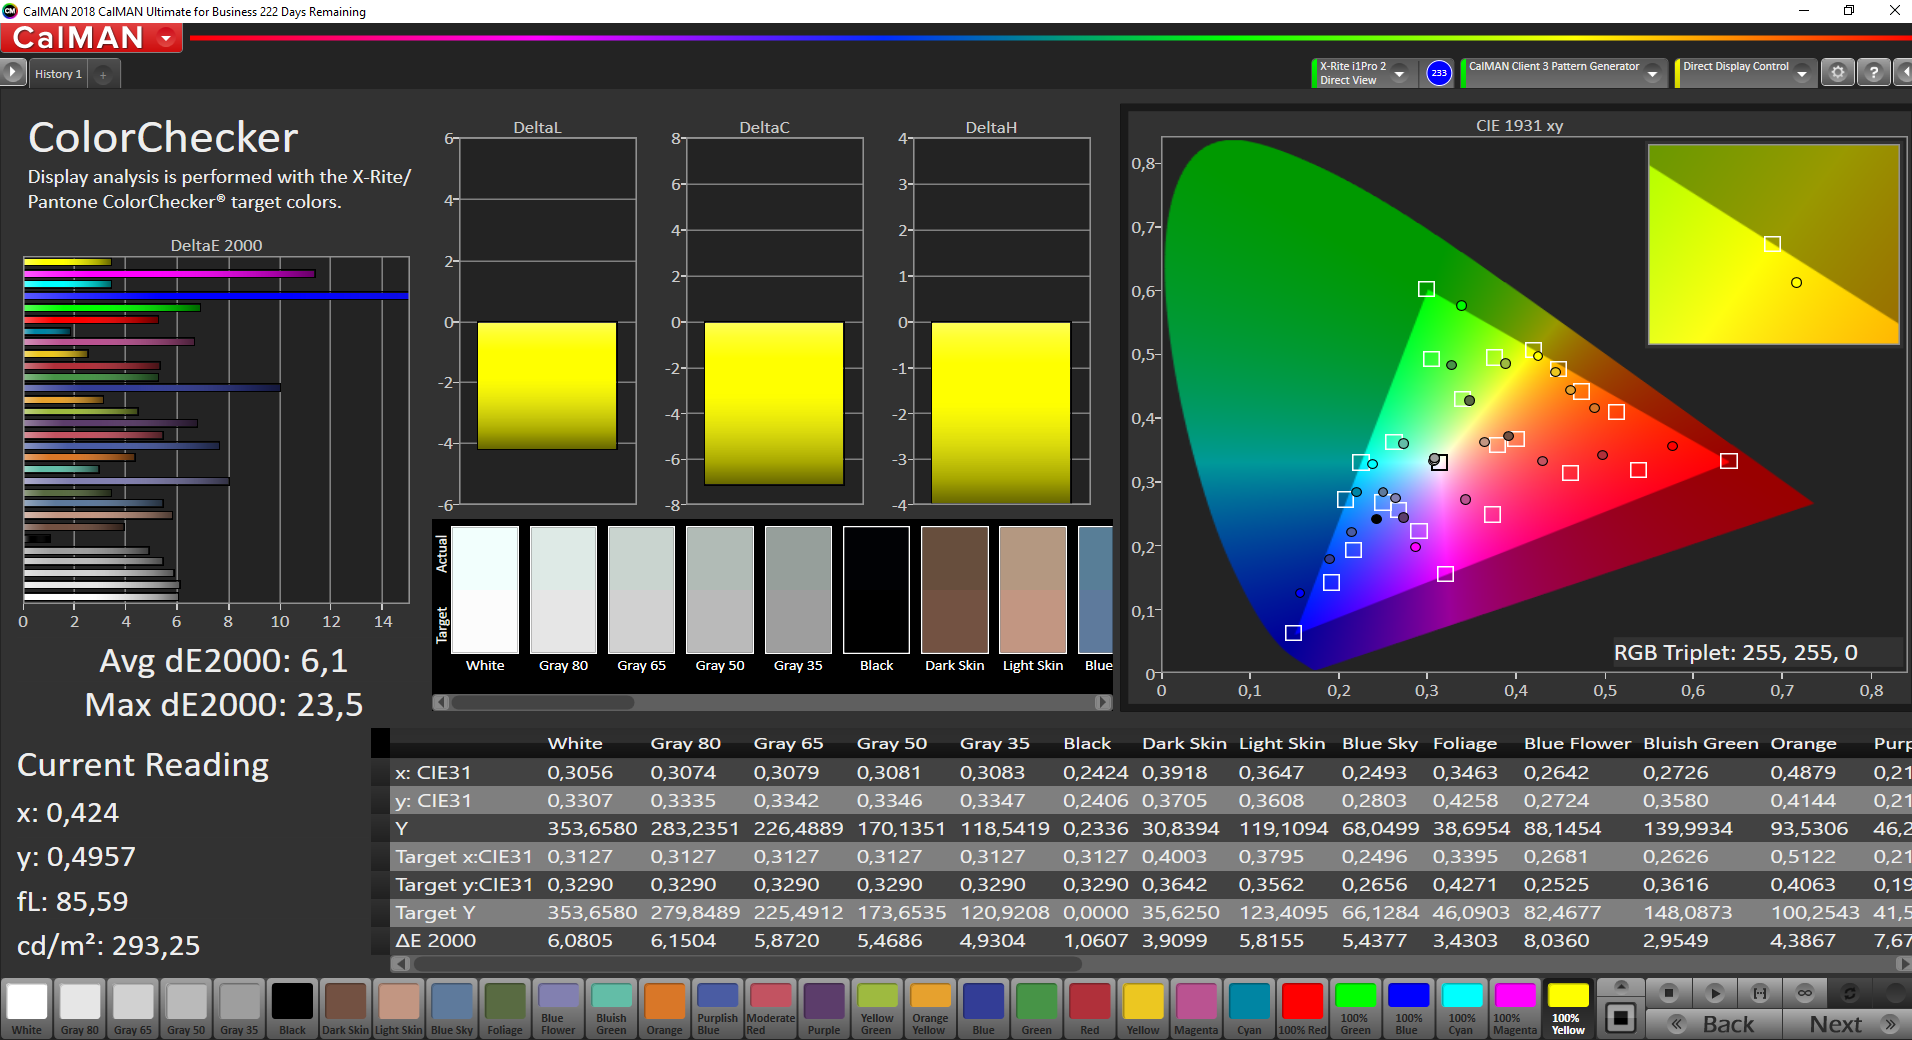
ΔE ColorChecker Calman: 6.1 | ∀{0.5-29.43 Ø4.75}
calibrated: 4.9
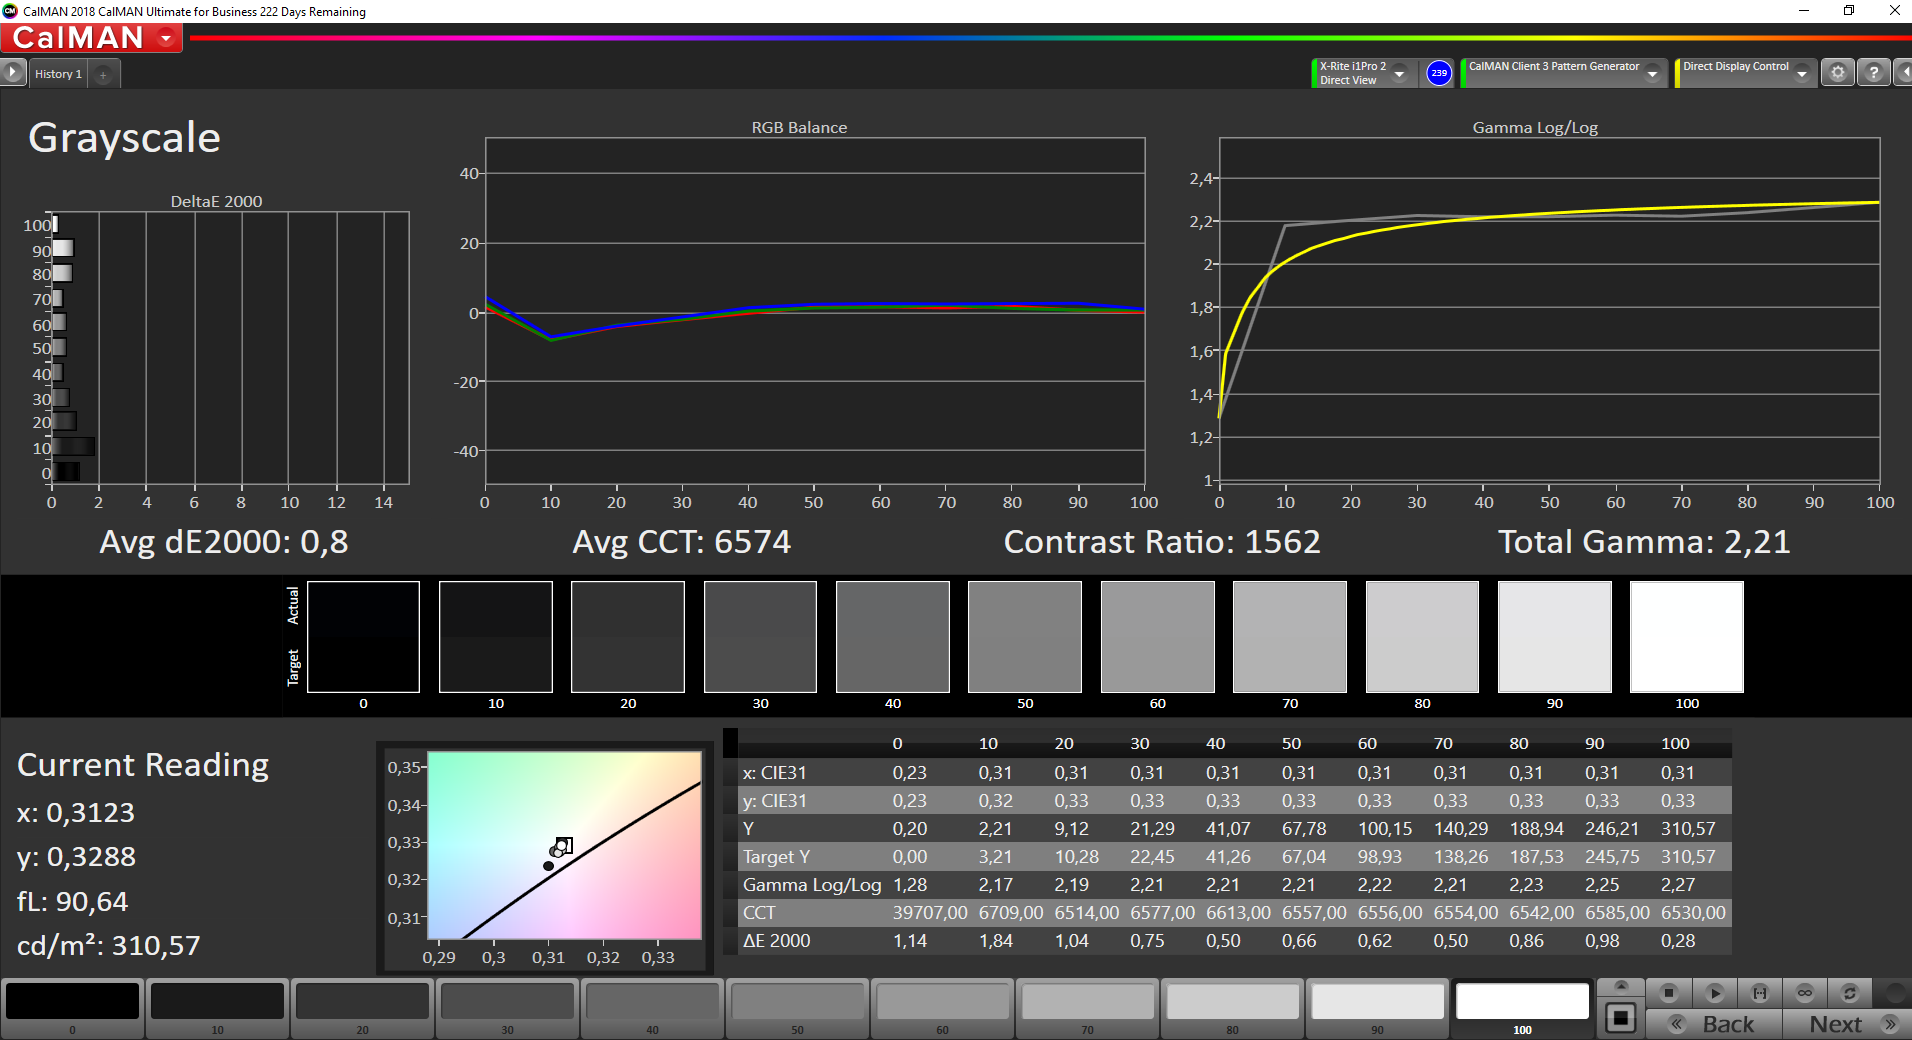
ΔE Greyscale Calman: 4.6 | ∀{0.09-98 Ø5}
59.8% sRGB (Argyll 1.6.3 3D)
38.2% AdobeRGB 1998 (Argyll 1.6.3 3D)
41.55% AdobeRGB 1998 (Argyll 3D)
60.2% sRGB (Argyll 3D)
40.18% Display P3 (Argyll 3D)
Gamma: 2.26
CCT: 6732 K
| Lenovo ThinkPad T15 Gen2-20W5S00100 B156HAN02.1, IPS, 1920x1080, 15.6" | Asus VivoBook S15 S533EQ-BQ002T Panda LM156LF-5L04, IPS, 1920x1080, 15.6" | Schenker Vision 15 BOE08F5, IPS, 1920x1080, 15.6" | Lenovo ThinkPad T15 Gen1-20S7S02U00 NE156QUM-N66, IPS LED, 3840x2160, 15.6" | Lenovo ThinkPad E15 Gen2-20TD002MGE Lenovo LEN40BA, IPS, 1920x1080, 15.6" | |
|---|---|---|---|---|---|
| Display | -3% | 66% | 98% | -4% | |
| Display P3 Coverage (%) | 40.18 | 39.01 -3% | 69.3 72% | 80.7 101% | 38.71 -4% |
| sRGB Coverage (%) | 60.2 | 58.5 -3% | 94 56% | 98.1 63% | 58.2 -3% |
| AdobeRGB 1998 Coverage (%) | 41.55 | 40.33 -3% | 70.8 70% | 95.5 130% | 39.99 -4% |
| Response Times | 19% | -23% | 23% | 59% | |
| Response Time Grey 50% / Grey 80% * (ms) | 48.8 ? | 38 ? 22% | 60 ? -23% | 42 ? 14% | 28 ? 43% |
| Response Time Black / White * (ms) | 32 ? | 27 ? 16% | 39 ? -22% | 21.6 ? 32% | 8 ? 75% |
| PWM Frequency (Hz) | |||||
| Screen | -15% | 30% | 36% | -6% | |
| Brightness middle (cd/m²) | 353 | 287 -19% | 478 35% | 489 39% | 248 -30% |
| Brightness (cd/m²) | 348 | 261 -25% | 462 33% | 501 44% | 244 -30% |
| Brightness Distribution (%) | 95 | 84 -12% | 94 -1% | 91 -4% | 87 -8% |
| Black Level * (cd/m²) | 0.2 | 0.51 -155% | 0.27 -35% | 0.35 -75% | 0.27 -35% |
| Contrast (:1) | 1765 | 563 -68% | 1770 0% | 1397 -21% | 919 -48% |
| Colorchecker dE 2000 * | 6.1 | 4.72 23% | 3.2 48% | 3 51% | 5.07 17% |
| Colorchecker dE 2000 max. * | 23.5 | 17.94 24% | 8.4 64% | 5.1 78% | 17.47 26% |
| Colorchecker dE 2000 calibrated * | 4.9 | 3.74 24% | 2 59% | 0.8 84% | |
| Greyscale dE 2000 * | 4.6 | 2.2 52% | 4.5 2% | 4 13% | 1.91 58% |
| Gamma | 2.26 97% | 2.51 88% | 2.16 102% | 2.24 98% | 2.39 92% |
| CCT | 6732 97% | 6758 96% | 6788 96% | 7400 88% | 6697 97% |
| Color Space (Percent of AdobeRGB 1998) (%) | 38.2 | 37 -3% | 63.1 65% | 84.7 122% | 37 -3% |
| Color Space (Percent of sRGB) (%) | 59.8 | 58 -3% | 93.6 57% | 98.1 64% | 58 -3% |
| Total Average (Program / Settings) | 0% /
-8% | 24% /
30% | 52% /
46% | 16% /
3% |
* ... smaller is better


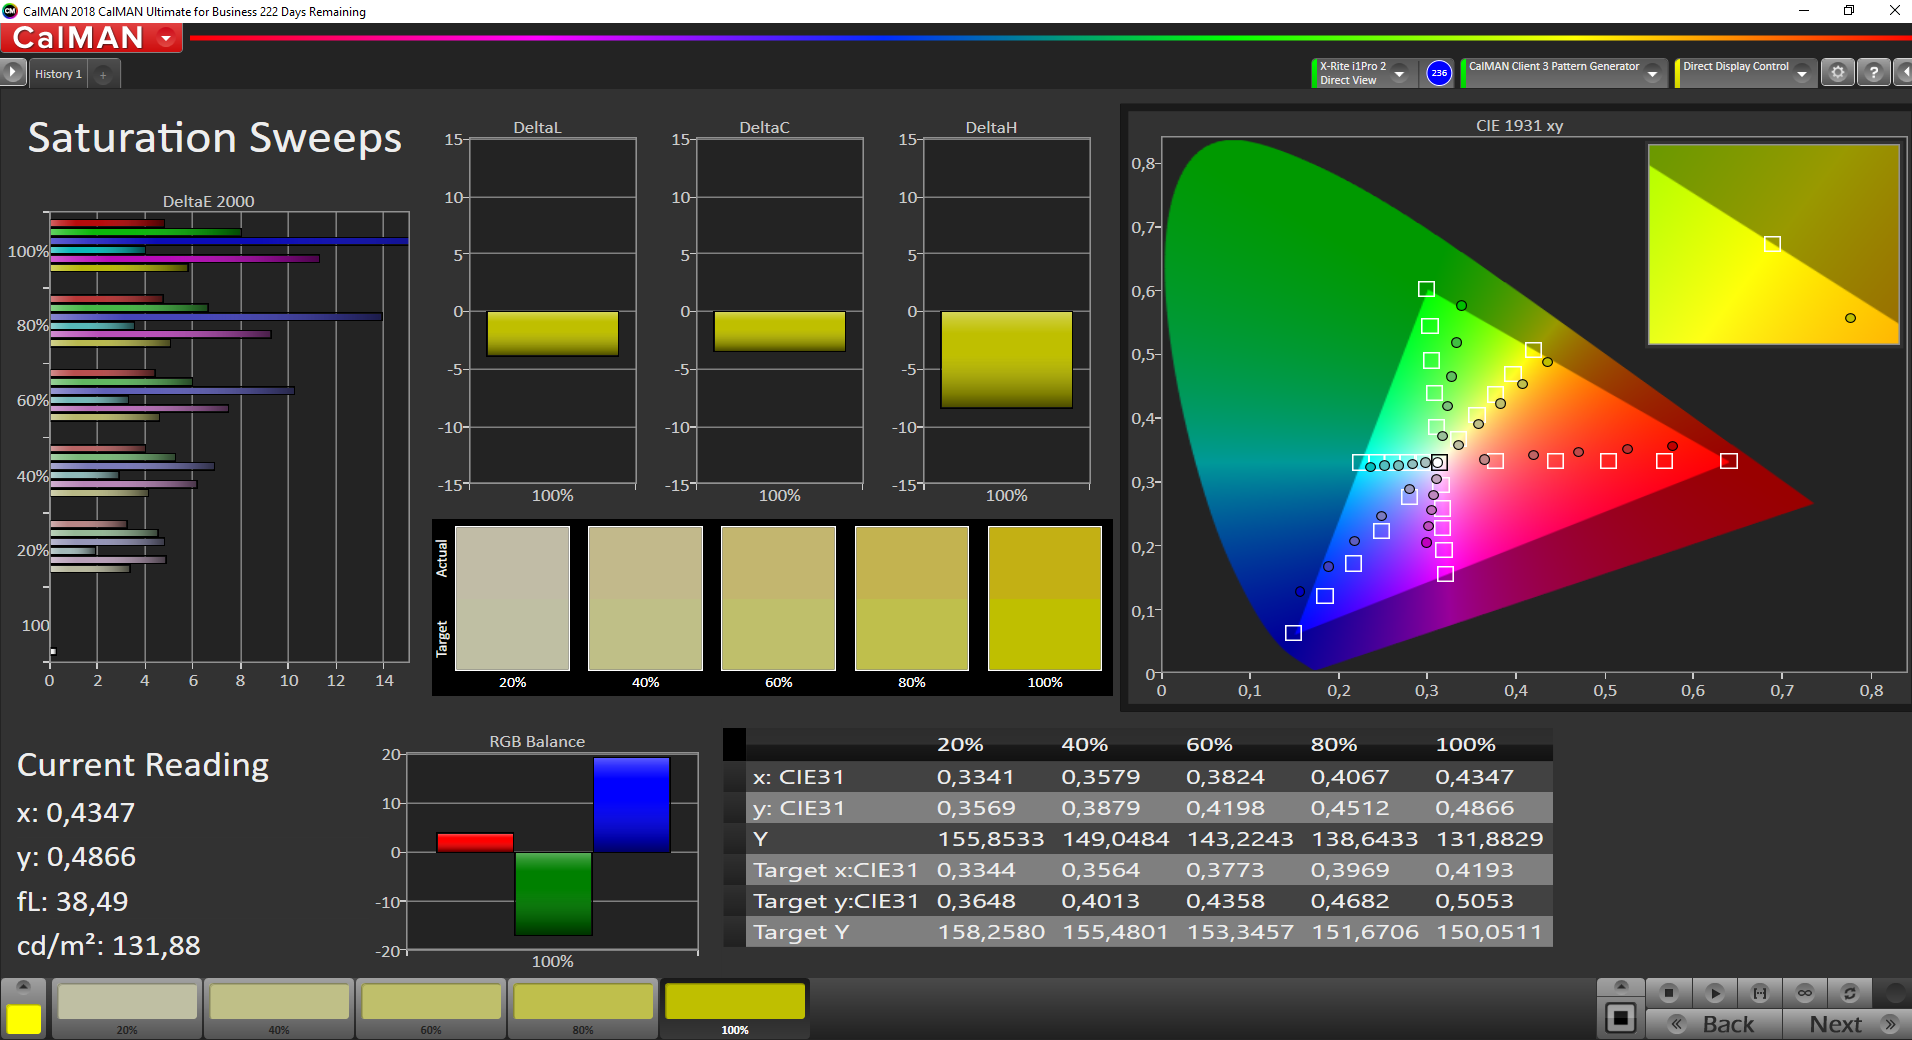
The T15 Gen2's screen experiences an improvement in contrast ratio and black value, which are now at 1,765:1 and 0.2 cd/m², respectively. Thus, Lenovo's ThinkBook can lead our test field. On the other hand, the color space coverage is lower with 59.8% (sRGB) and 38.2% (AdobeRGB) for the panel installed here.
The CalMAN analysis also shows that the screen displays colors quite balanced ex-factory and with a DeltaE2000 deviation of 4.6. This value can be improved to 0.8 with a calibration. The corresponding ICC file can be downloaded in the top left window next to the screen's illumination graphic.


Display Response Times
| ↔ Response Time Black to White | ||
|---|---|---|
| 32 ms ... rise ↗ and fall ↘ combined | ↗ 17.2 ms rise | 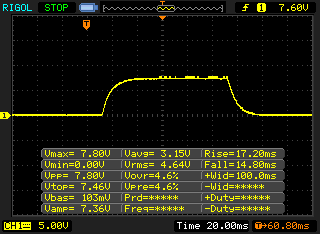 |
| ↘ 14.8 ms fall | ||
| The screen shows slow response rates in our tests and will be unsatisfactory for gamers. In comparison, all tested devices range from 0.1 (minimum) to 240 (maximum) ms. » 85 % of all devices are better. This means that the measured response time is worse than the average of all tested devices (20.1 ms). | ||
| ↔ Response Time 50% Grey to 80% Grey | ||
| 48.8 ms ... rise ↗ and fall ↘ combined | ↗ 22.8 ms rise |  |
| ↘ 26 ms fall | ||
| The screen shows slow response rates in our tests and will be unsatisfactory for gamers. In comparison, all tested devices range from 0.165 (minimum) to 636 (maximum) ms. » 84 % of all devices are better. This means that the measured response time is worse than the average of all tested devices (31.4 ms). | ||
Screen Flickering / PWM (Pulse-Width Modulation)
| Screen flickering / PWM not detected | 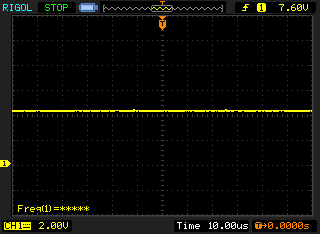 | ||
In comparison: 53 % of all tested devices do not use PWM to dim the display. If PWM was detected, an average of 7986 (minimum: 5 - maximum: 343500) Hz was measured. | |||
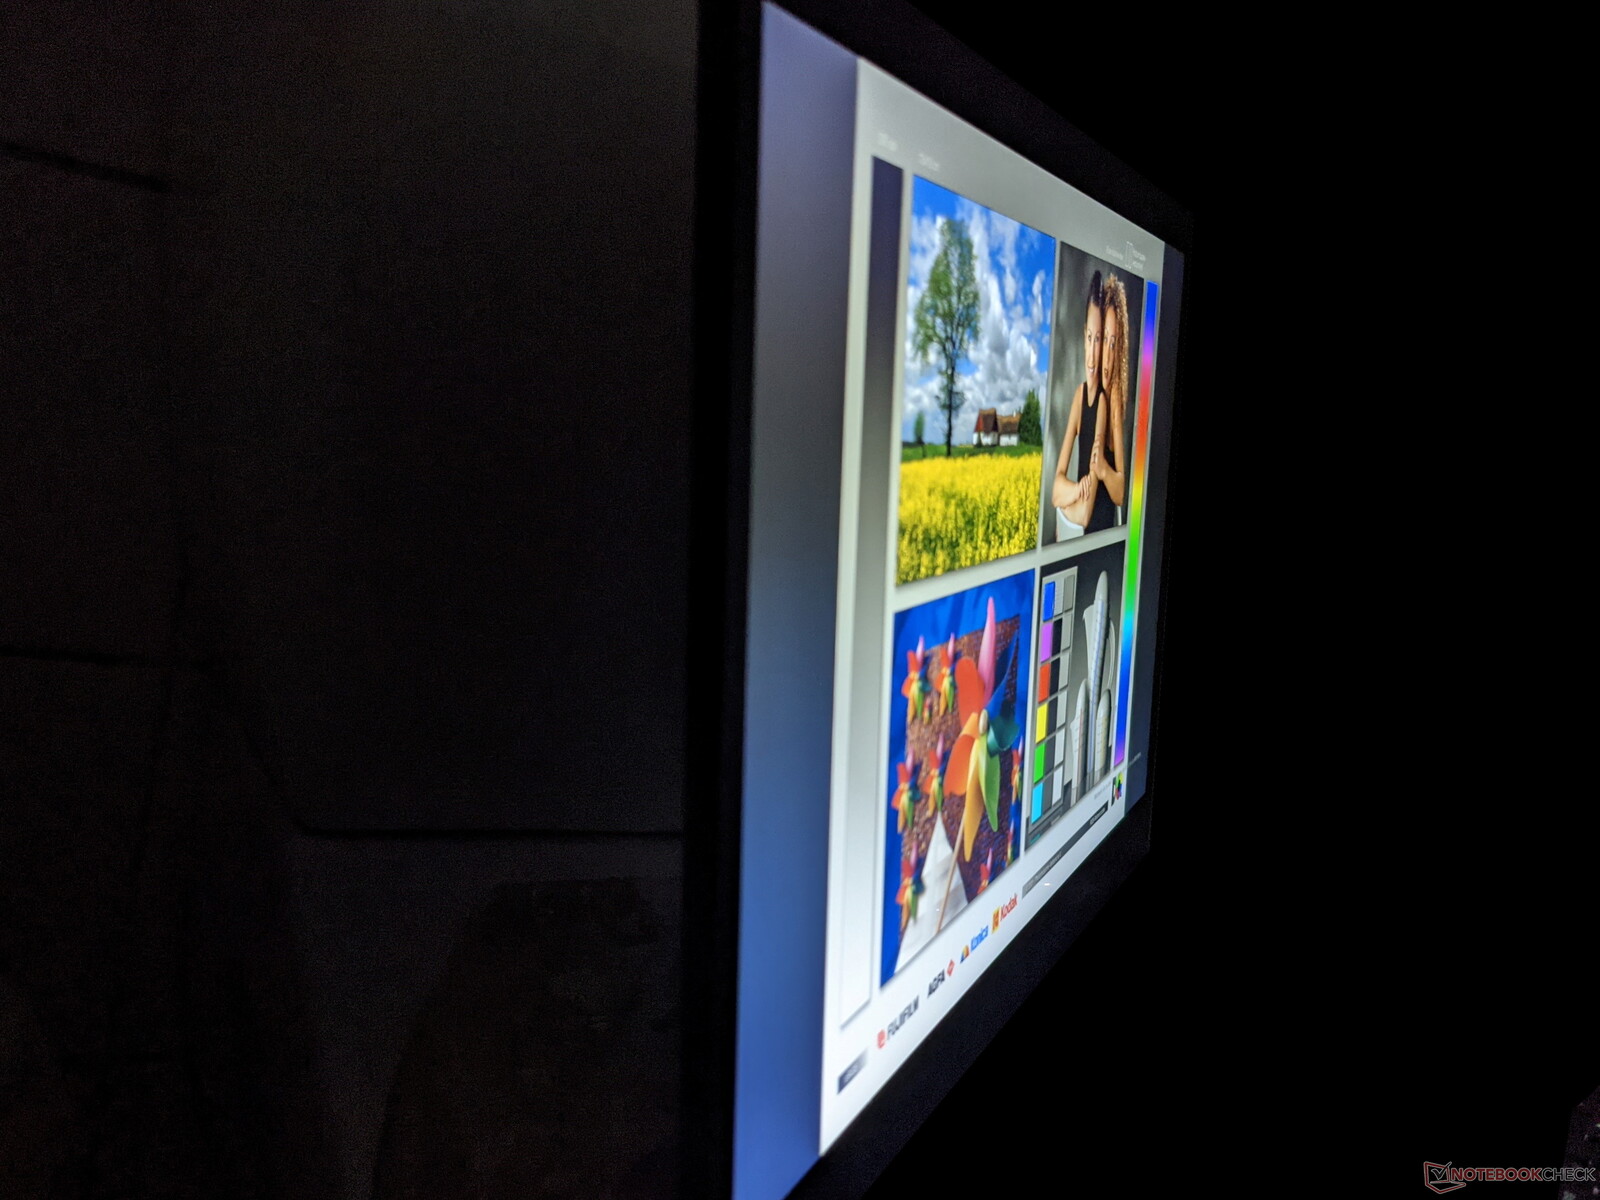
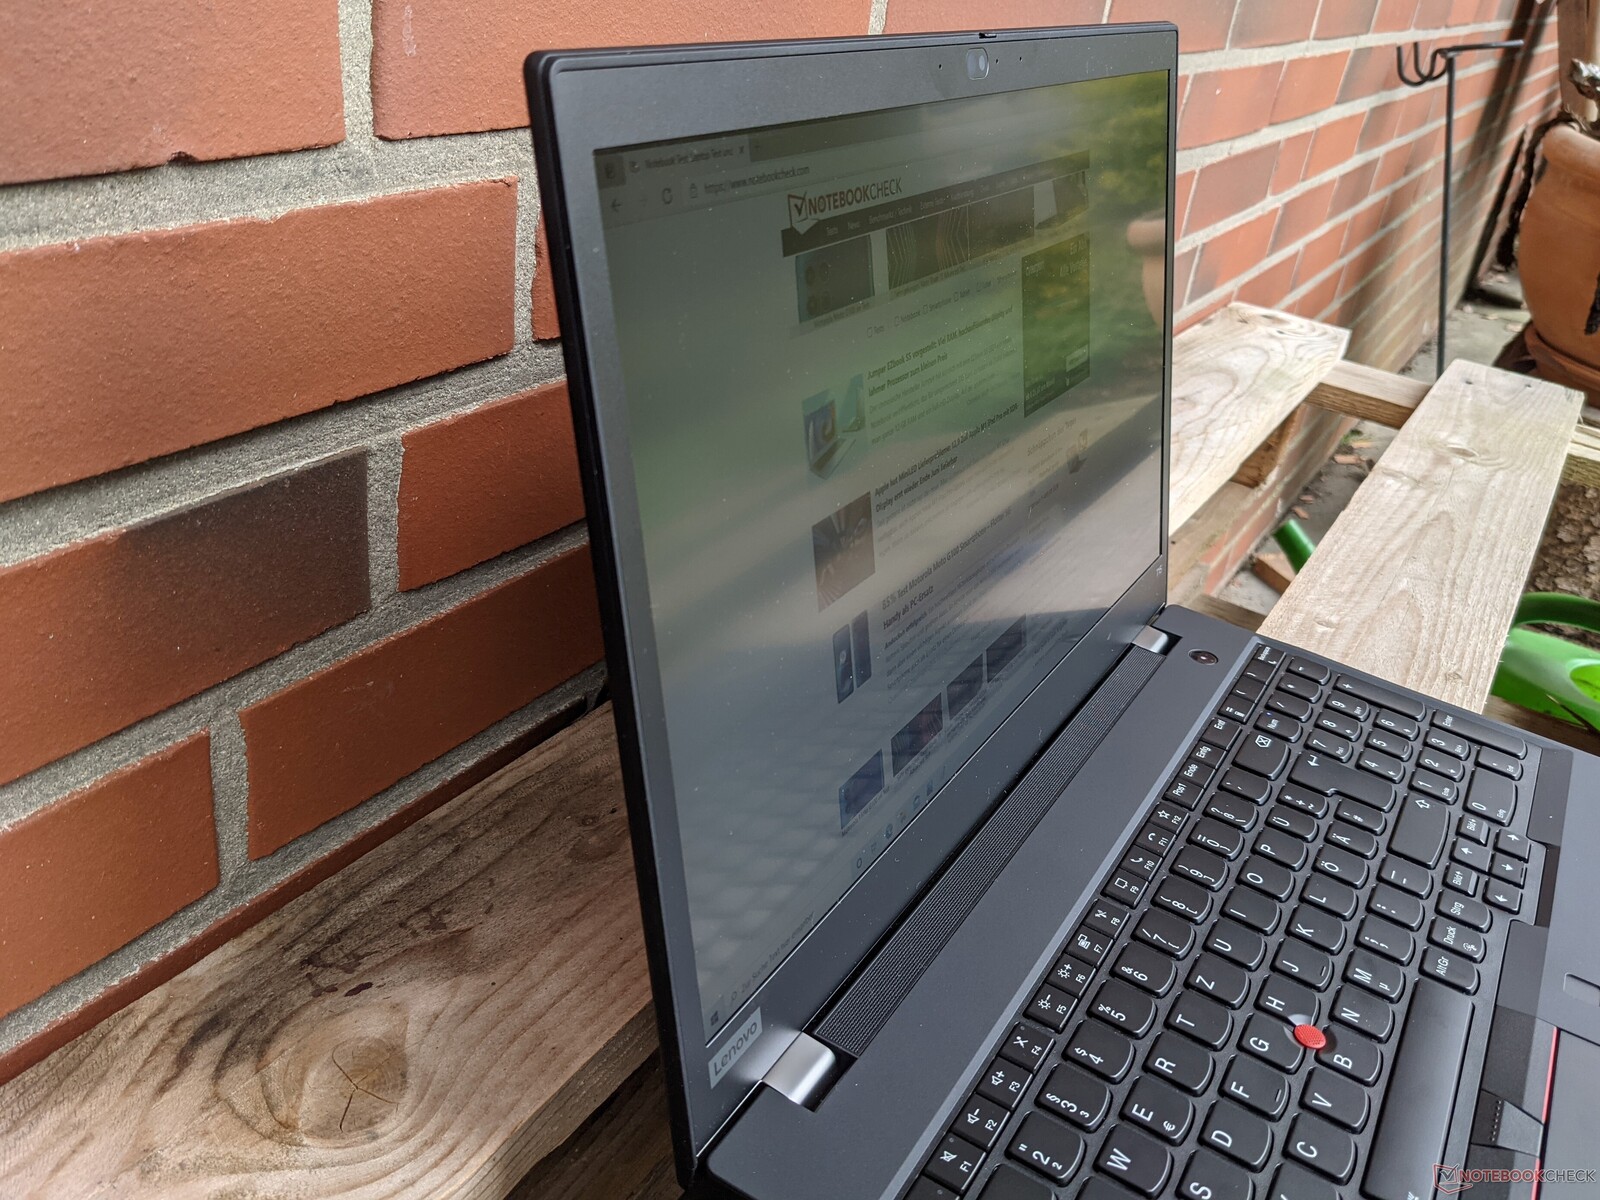
The ThinkPad T15 Gen2 can be used outdoors as long as shady places are preferred. Working in direct sunlight is possible, but image content is difficult to read. In addition, the matte surface of the display is very coarse-grained and thus also contributes to limited visibility.
The built-in IPS panel has very stable viewing angles, which allows reading content from almost any viewing angle without distortions or falsifying colors.

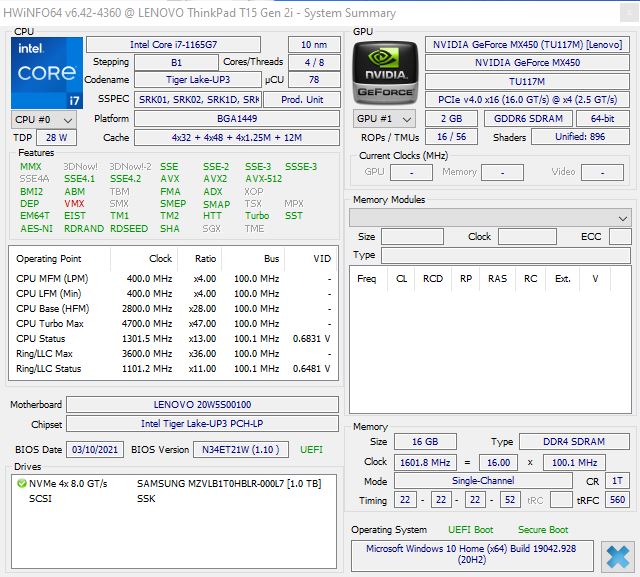
Performance - MX450 with low clock frequency

Processor
Lenovo uses an Intel Core i7-1165G7 in our test configuration. This processor belongs to the Tiger Lake generation and can process up to eight tasks simultaneously with its four cores. The clock rates are between 2.8 and 4.7 GHz, whereby the performance under longer load depends on the set TDP and the cooling system.
With a PL1 of 35 watts and a PL2 of 64 watts, Lenovo is at the upper end of the configuration options. The performance is correspondingly good, which ensures one of the upper places in our test field depending on the discipline. The T15 Gen2 can also keep up with the competition under permanent load. The performance drop of approximately 6% in our Cinebench R15 endurance test is only slight.
Cinebench R20: CPU (Single Core) | CPU (Multi Core)
Cinebench R15: CPU Single 64Bit | CPU Multi 64Bit
Blender: v2.79 BMW27 CPU
7-Zip 18.03: 7z b 4 -mmt1 | 7z b 4
Geekbench 5.5: Single-Core | Multi-Core
HWBOT x265 Benchmark v2.2: 4k Preset
LibreOffice : 20 Documents To PDF
R Benchmark 2.5: Overall mean
| Cinebench R23 / Single Core | |
| Average of class Office (708 - 2130, n=80, last 2 years) | |
| Asus VivoBook S15 S533EQ-BQ002T | |
| Average Intel Core i7-1165G7 (1110 - 1539, n=59) | |
| Schenker Vision 15 | |
| Cinebench R23 / Multi Core | |
| Average of class Office (1577 - 22808, n=80, last 2 years) | |
| Asus VivoBook S15 S533EQ-BQ002T | |
| Average Intel Core i7-1165G7 (2525 - 6862, n=64) | |
| Schenker Vision 15 | |
| Cinebench R20 / CPU (Single Core) | |
| Average of class Office (285 - 816, n=79, last 2 years) | |
| Asus VivoBook S15 S533EQ-BQ002T | |
| Lenovo ThinkPad T15 Gen2-20W5S00100 | |
| Average Intel Core i7-1165G7 (442 - 589, n=81) | |
| Schenker Vision 15 | |
| Lenovo ThinkPad E15 Gen2-20TD002MGE | |
| Lenovo ThinkPad T15 Gen1-20S7S02U00 | |
| Cinebench R20 / CPU (Multi Core) | |
| Average of class Office (590 - 8840, n=79, last 2 years) | |
| Lenovo ThinkPad T15 Gen2-20W5S00100 | |
| Lenovo ThinkPad E15 Gen2-20TD002MGE | |
| Asus VivoBook S15 S533EQ-BQ002T | |
| Schenker Vision 15 | |
| Average Intel Core i7-1165G7 (1060 - 2657, n=81) | |
| Lenovo ThinkPad T15 Gen1-20S7S02U00 | |
| Cinebench R15 / CPU Single 64Bit | |
| Average of class Office (99.5 - 312, n=81, last 2 years) | |
| Schenker Vision 15 | |
| Lenovo ThinkPad T15 Gen2-20W5S00100 | |
| Lenovo ThinkPad E15 Gen2-20TD002MGE | |
| Asus VivoBook S15 S533EQ-BQ002T | |
| Average Intel Core i7-1165G7 (115 - 230, n=78) | |
| Lenovo ThinkPad T15 Gen1-20S7S02U00 | |
| Cinebench R15 / CPU Multi 64Bit | |
| Average of class Office (246 - 3380, n=81, last 2 years) | |
| Schenker Vision 15 | |
| Lenovo ThinkPad E15 Gen2-20TD002MGE | |
| Lenovo ThinkPad T15 Gen2-20W5S00100 | |
| Asus VivoBook S15 S533EQ-BQ002T | |
| Average Intel Core i7-1165G7 (553 - 1027, n=86) | |
| Lenovo ThinkPad T15 Gen1-20S7S02U00 | |
| Blender / v2.79 BMW27 CPU | |
| Lenovo ThinkPad T15 Gen1-20S7S02U00 | |
| Lenovo ThinkPad T15 Gen2-20W5S00100 | |
| Average Intel Core i7-1165G7 (468 - 1138, n=80) | |
| Asus VivoBook S15 S533EQ-BQ002T | |
| Lenovo ThinkPad E15 Gen2-20TD002MGE | |
| Schenker Vision 15 | |
| Average of class Office (158 - 1956, n=82, last 2 years) | |
| 7-Zip 18.03 / 7z b 4 -mmt1 | |
| Asus VivoBook S15 S533EQ-BQ002T | |
| Lenovo ThinkPad T15 Gen2-20W5S00100 | |
| Average of class Office (3046 - 6469, n=81, last 2 years) | |
| Lenovo ThinkPad E15 Gen2-20TD002MGE | |
| Average Intel Core i7-1165G7 (4478 - 5507, n=80) | |
| Schenker Vision 15 | |
| Lenovo ThinkPad T15 Gen1-20S7S02U00 | |
| 7-Zip 18.03 / 7z b 4 | |
| Average of class Office (7532 - 76886, n=82, last 2 years) | |
| Schenker Vision 15 | |
| Lenovo ThinkPad E15 Gen2-20TD002MGE | |
| Asus VivoBook S15 S533EQ-BQ002T | |
| Average Intel Core i7-1165G7 (15347 - 27405, n=80) | |
| Lenovo ThinkPad T15 Gen2-20W5S00100 | |
| Lenovo ThinkPad T15 Gen1-20S7S02U00 | |
| Geekbench 5.5 / Single-Core | |
| Average of class Office (811 - 2128, n=78, last 2 years) | |
| Schenker Vision 15 | |
| Asus VivoBook S15 S533EQ-BQ002T | |
| Lenovo ThinkPad E15 Gen2-20TD002MGE | |
| Average Intel Core i7-1165G7 (1302 - 1595, n=77) | |
| Lenovo ThinkPad T15 Gen2-20W5S00100 | |
| Lenovo ThinkPad T15 Gen1-20S7S02U00 | |
| Geekbench 5.5 / Multi-Core | |
| Average of class Office (1719 - 16999, n=78, last 2 years) | |
| Schenker Vision 15 | |
| Average Intel Core i7-1165G7 (3078 - 5926, n=77) | |
| Asus VivoBook S15 S533EQ-BQ002T | |
| Lenovo ThinkPad E15 Gen2-20TD002MGE | |
| Lenovo ThinkPad T15 Gen2-20W5S00100 | |
| Lenovo ThinkPad T15 Gen1-20S7S02U00 | |
| HWBOT x265 Benchmark v2.2 / 4k Preset | |
| Average of class Office (1.72 - 26, n=80, last 2 years) | |
| Schenker Vision 15 | |
| Lenovo ThinkPad E15 Gen2-20TD002MGE | |
| Lenovo ThinkPad T15 Gen2-20W5S00100 | |
| Average Intel Core i7-1165G7 (1.39 - 8.47, n=80) | |
| Asus VivoBook S15 S533EQ-BQ002T | |
| Lenovo ThinkPad T15 Gen1-20S7S02U00 | |
| LibreOffice / 20 Documents To PDF | |
| Average of class Office (41.5 - 129.6, n=80, last 2 years) | |
| Lenovo ThinkPad T15 Gen1-20S7S02U00 | |
| Lenovo ThinkPad E15 Gen2-20TD002MGE | |
| Average Intel Core i7-1165G7 (21.5 - 88.1, n=78) | |
| Schenker Vision 15 | |
| Asus VivoBook S15 S533EQ-BQ002T | |
| Lenovo ThinkPad T15 Gen2-20W5S00100 | |
| R Benchmark 2.5 / Overall mean | |
| Lenovo ThinkPad T15 Gen1-20S7S02U00 | |
| Average Intel Core i7-1165G7 (0.552 - 1.002, n=80) | |
| Lenovo ThinkPad E15 Gen2-20TD002MGE | |
| Lenovo ThinkPad T15 Gen2-20W5S00100 | |
| Schenker Vision 15 | |
| Asus VivoBook S15 S533EQ-BQ002T | |
| Average of class Office (0.4098 - 1.06, n=80, last 2 years) | |
* ... smaller is better
System performance
The Lenovo ThinkPad T15 Gen 2 can only secure a place in the midfield in the PCMark 10 test for assessing the system performance. While the single score of the "Productivity" discipline is still very good, the other scores are a bit below expectations. Nevertheless, the notebook can be used smoothly in everyday use. The operating system and applications start quickly and we couldn't determine any micro-stutters or similar.
Which performance other notebooks achieve in comparison can be seen in our CPU benchmark list.
| PCMark 10 Score | 5258 points | |
Help | ||
DPC latencies
In the test with LatencyMon, the ThinkPad T15 Gen2 shows increased interruption times. Thus, it is only suitable for real-time applications to a limited extent.


| DPC Latencies / LatencyMon - interrupt to process latency (max), Web, Youtube, Prime95 | |
| Schenker Vision 15 | |
| Lenovo ThinkPad E15 Gen2-20TD002MGE | |
| Lenovo ThinkPad T15 Gen1-20S7S02U00 | |
| Lenovo ThinkPad T15 Gen2-20W5S00100 | |
| Asus VivoBook S15 S533EQ-BQ002T | |
* ... smaller is better
Mass storage
Lenovo installed a 1 TB Samsung PM981a SSD in our test configuration. This offers very good write and read rates and reached second place in our test field.
What performance can be expected from other mass storage devices can be seen in our HDD/SSD benchmark list.
| Lenovo ThinkPad T15 Gen2-20W5S00100 Samsung PM981a MZVLB1T0HBLR | Asus VivoBook S15 S533EQ-BQ002T Intel SSD 660p 1TB SSDPEKNW010T8 | Schenker Vision 15 Samsung SSD 980 Pro 1TB MZ-V8P1T0BW | Lenovo ThinkPad T15 Gen1-20S7S02U00 Toshiba XG6 KXG6AZNV1T02 | Lenovo ThinkPad E15 Gen2-20TD002MGE Samsung PM991 MZALQ512HALU | Average Samsung PM981a MZVLB1T0HBLR | |
|---|---|---|---|---|---|---|
| CrystalDiskMark 5.2 / 6 | -22% | 50% | -24% | -42% | -18% | |
| Write 4K (MB/s) | 227.6 | 214.4 -6% | 238.1 5% | 159.1 -30% | 118.8 -48% | 139.7 ? -39% |
| Read 4K (MB/s) | 75.5 | 58.5 -23% | 79.2 5% | 55.6 -26% | 37.55 -50% | 49.9 ? -34% |
| Write Seq (MB/s) | 2100 | 1678 -20% | 4139 97% | 1435 -32% | 1224 -42% | 2036 ? -3% |
| Read Seq (MB/s) | 2017 | 1648 -18% | 4133 105% | 1435 -29% | 1589 -21% | 2014 ? 0% |
| Write 4K Q32T1 (MB/s) | 646 | 644 0% | 697 8% | 512 -21% | 409.5 -37% | 461 ? -29% |
| Read 4K Q32T1 (MB/s) | 728 | 600 -18% | 758 4% | 541 -26% | 335.5 -54% | 499 ? -31% |
| Write Seq Q32T1 (MB/s) | 2983 | 1760 -41% | 5187 74% | 2682 -10% | 1427 -52% | 2903 ? -3% |
| Read Seq Q32T1 (MB/s) | 3558 | 1853 -48% | 7117 100% | 2902 -18% | 2353 -34% | 3479 ? -2% |
| AS SSD | -51% | 31% | -21% | -60% | -15% | |
| Seq Read (MB/s) | 2694 | 1754 -35% | 5427 101% | 2372 -12% | 1886 -30% | 2553 ? -5% |
| Seq Write (MB/s) | 2370 | 1567 -34% | 3886 64% | 2230 -6% | 1226 -48% | 2084 ? -12% |
| 4K Read (MB/s) | 68.4 | 53 -23% | 72.9 7% | 50.2 -27% | 32.37 -53% | 53.1 ? -22% |
| 4K Write (MB/s) | 208.1 | 167.9 -19% | 219.3 5% | 139.8 -33% | 100.8 -52% | 131.2 ? -37% |
| 4K-64 Read (MB/s) | 1961 | 586 -70% | 2209 13% | 1430 -27% | 842 -57% | 1477 ? -25% |
| 4K-64 Write (MB/s) | 1935 | 858 -56% | 2265 17% | 1368 -29% | 485 -75% | 1805 ? -7% |
| Access Time Read * (ms) | 0.032 | 0.097 -203% | 0.033 -3% | 0.059 -84% | 0.102 -219% | 0.04983 ? -56% |
| Access Time Write * (ms) | 0.081 | 0.038 53% | 0.02 75% | 0.03 63% | 0.037 54% | 0.04222 ? 48% |
| Score Read (Points) | 2299 | 815 -65% | 2825 23% | 1718 -25% | 1063 -54% | 1786 ? -22% |
| Score Write (Points) | 2380 | 1182 -50% | 2873 21% | 1731 -27% | 708 -70% | 2144 ? -10% |
| Score Total (Points) | 5846 | 2421 -59% | 7069 21% | 4325 -26% | 2286 -61% | 4826 ? -17% |
| Total Average (Program / Settings) | -37% /
-39% | 41% /
39% | -23% /
-22% | -51% /
-53% | -17% /
-16% |
* ... smaller is better

Continuous power read: DiskSpd Read Loop, Queue Depth 8
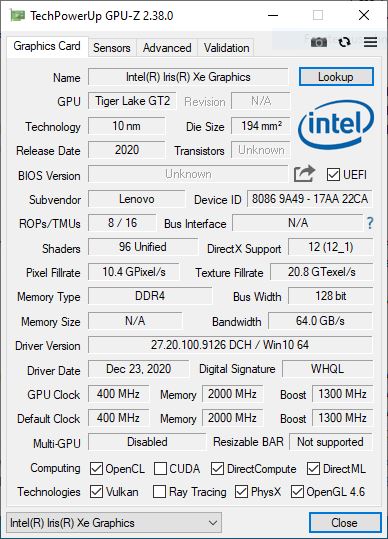
Graphics card
Besides the internal Intel Iris Xe Graphics G7 Lenovo also installs an Nvidia GeForce MX450 in the ThinkPad T15 Gen2. However, it delivers sobering results in the 3DMark benchmarks that are only slightly above the level of the internal graphics unit.
This is due to the fact that the MX450 is operated with a base clock of only 750 MHz in its lowest configuration. For comparison, we use the Lenovo ThinkPad E15 Gen2 whose MX450 operates with a base clock of 1,395 MHz and leads our test field in most disciplines.
How other graphics units performed in our test can be seen in our GPU benchmark list.
| 3DMark 11 Performance | 7035 points | |
| 3DMark Cloud Gate Standard Score | 19688 points | |
| 3DMark Fire Strike Score | 4299 points | |
| 3DMark Time Spy Score | 1222 points | |
Help | ||
Gaming performance
The MX450's performance varies a lot in games. Depending on the title, smooth frame rates in FullHD with reduced detail levels are possible, but it strongly depends on the respective game. In comparison, the possible frame rates vary between below average and good depending on the game.
We have listed what gaming performance can be expected in other titles in our GPU games list.
| The Witcher 3 - 1366x768 Medium Graphics & Postprocessing | |
| Schenker Vision 15 | |
| Average NVIDIA GeForce MX450 (34 - 81.4, n=14) | |
| Lenovo ThinkPad T15 Gen2-20W5S00100 | |
| Average of class Office (15.2 - 106.3, n=13, last 2 years) | |
| Asus VivoBook S15 S533EQ-BQ002T | |
| Lenovo ThinkPad T15 Gen1-20S7S02U00 | |
| Lenovo ThinkPad E15 Gen2-20TD002MGE | |
| Final Fantasy XV Benchmark - 1920x1080 Standard Quality | |
| Average of class Office (10.6 - 105.7, n=77, last 2 years) | |
| Average NVIDIA GeForce MX450 (25 - 34.5, n=13) | |
| Lenovo ThinkPad E15 Gen2-20TD002MGE | |
| Lenovo ThinkPad T15 Gen2-20W5S00100 | |
| Far Cry 5 - 1920x1080 Medium Preset AA:T | |
| Lenovo ThinkPad T15 Gen2-20W5S00100 | |
| Average NVIDIA GeForce MX450 (24 - 41, n=7) | |
| Average of class Office (18 - 59, n=19, last 2 years) | |
| Schenker Vision 15 | |
| Lenovo ThinkPad E15 Gen2-20TD002MGE | |
The cooling system of the T15 Gen2 can compensate for fluctuations when games are played over a longer period of time. Therefore, performance drops during long gaming times are not to be expected.
| low | med. | high | ultra | |
|---|---|---|---|---|
| The Witcher 3 (2015) | 98.5 | 53.8 | 32.5 | 18 |
| Dota 2 Reborn (2015) | 125 | 115 | 86.6 | 78.6 |
| Final Fantasy XV Benchmark (2018) | 52.8 | 25.1 | 12.7 | |
| X-Plane 11.11 (2018) | 87.2 | 63.9 | 39.6 | |
| Far Cry 5 (2018) | 73 | 34 | 26 | 24 |
| Cyberpunk 2077 1.0 (2020) | 33.9 | 14 | 8.3 | 3.2 |
Emissions - Low-noise fan
Noise emissions
The fan of the Lenovo ThinkPad T15 Gen2 is audible with a volume of up to 37.6 dB(A), but it does not push itself to the fore with its even noise. We could not determine any other noises in our test device.
Noise level
| Idle |
| 24.2 / 24.2 / 24.2 dB(A) |
| Load |
| 34.5 / 37.6 dB(A) |
 | ||
30 dB silent 40 dB(A) audible 50 dB(A) loud |
||
min: | ||
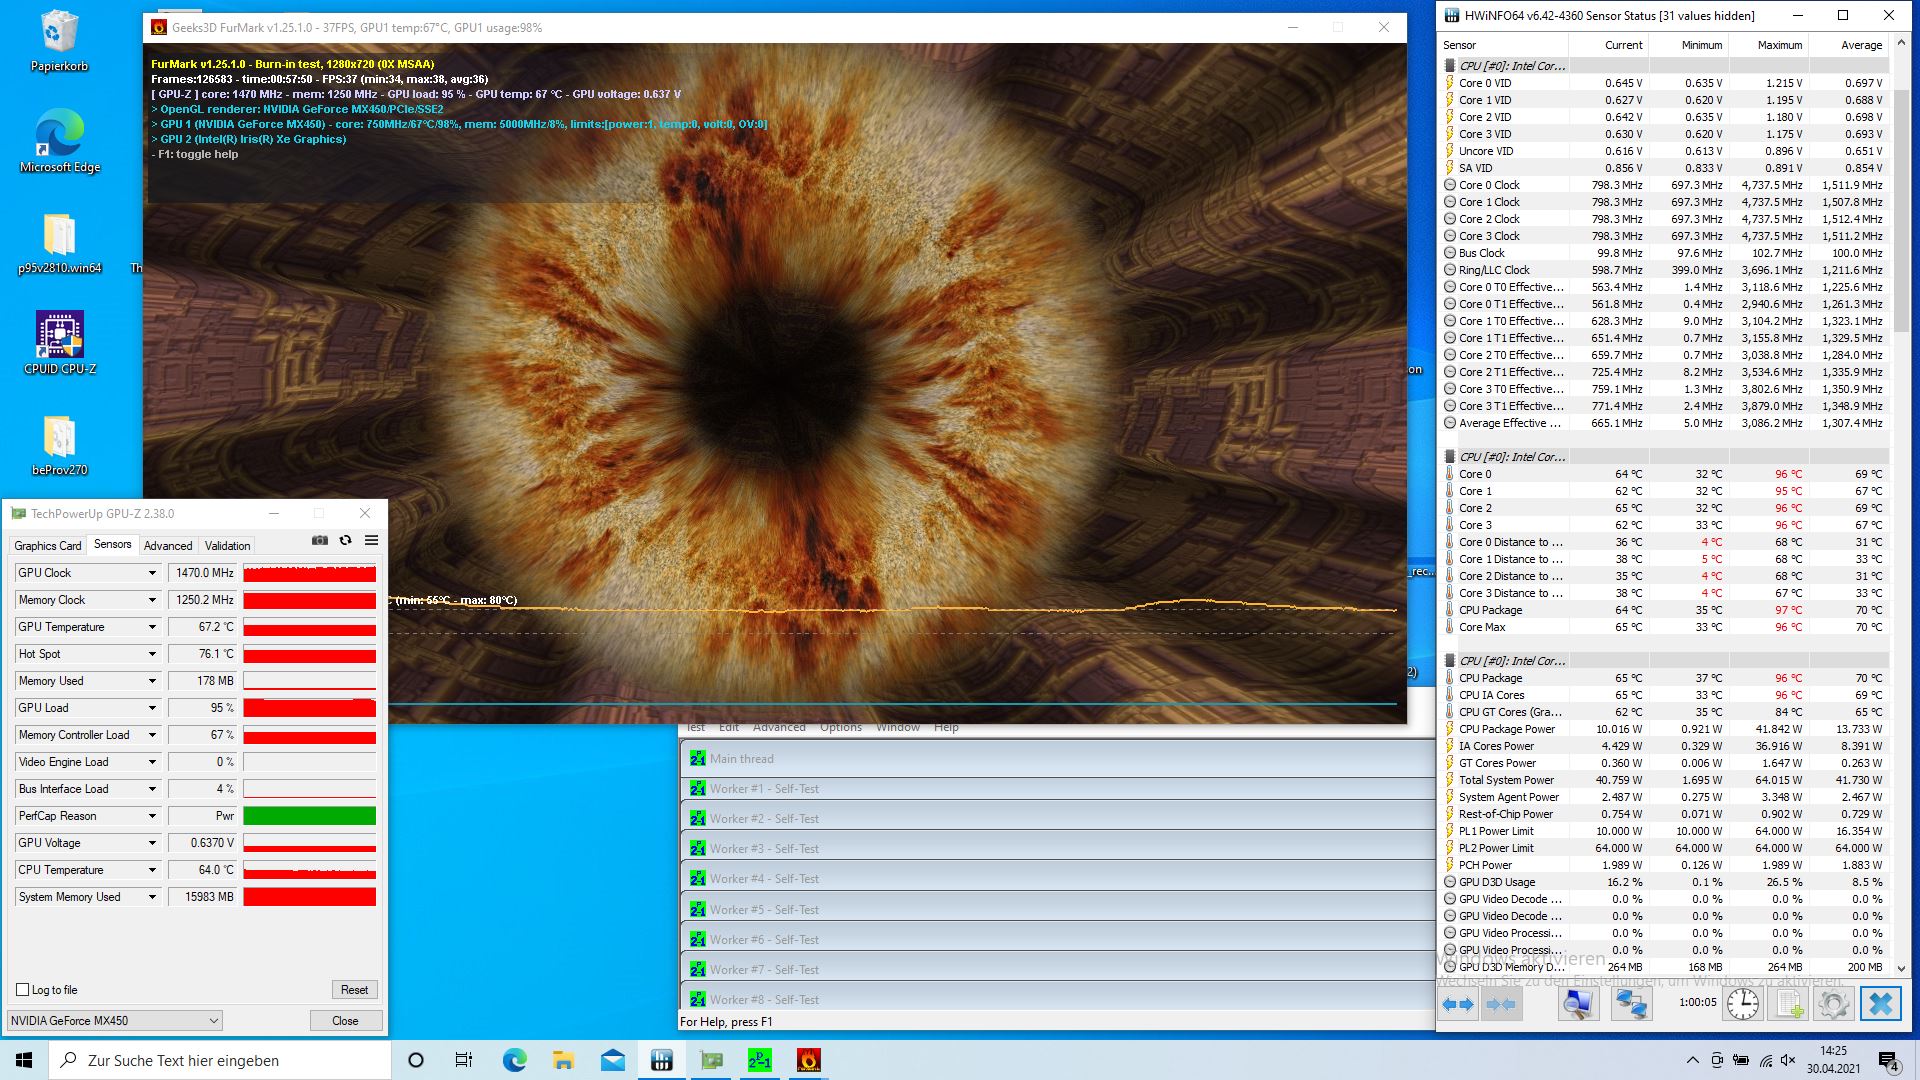
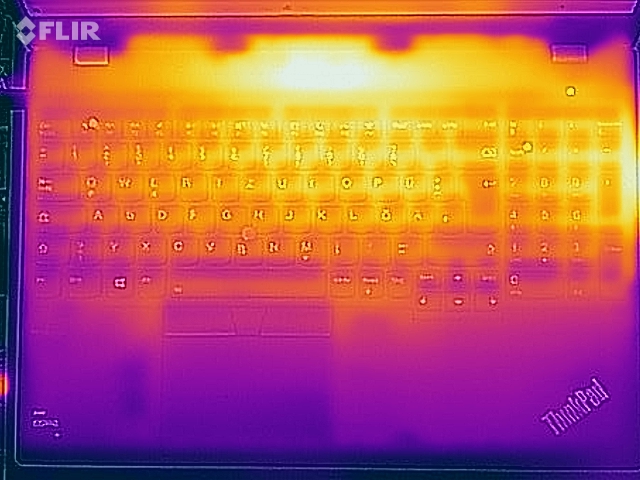
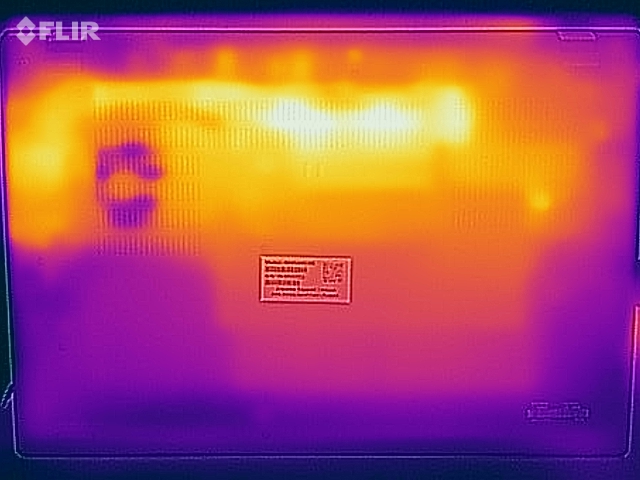
Temperature
The surfaces of the Lenovo notebook heat up to 55.1 °C (131.8 °F) under load. The warmest point is at the rear center of the bottom. The palm rests are cool enough at all times with temperatures of up to 30 °C (86 °F) to allow working with the laptop.
During our approximately one-hour endurance stress test, the temperatures inside rose up to 97 °C (206.6 °F). The clock rates drop to an average of 1.5 GHz, which is below the base clock. However, the system remained operable and quickly stabilized again after the end of the test. Users will therefore not have to deal with restrictions due to excessive temperatures.
(±) The maximum temperature on the upper side is 42.2 °C / 108 F, compared to the average of 34.3 °C / 94 F, ranging from 21.2 to 62.5 °C for the class Office.
(-) The bottom heats up to a maximum of 55.1 °C / 131 F, compared to the average of 36.8 °C / 98 F
(+) In idle usage, the average temperature for the upper side is 22.9 °C / 73 F, compared to the device average of 29.5 °C / 85 F.
(±) Playing The Witcher 3, the average temperature for the upper side is 35.7 °C / 96 F, compared to the device average of 29.5 °C / 85 F.
(+) The palmrests and touchpad are cooler than skin temperature with a maximum of 30.3 °C / 86.5 F and are therefore cool to the touch.
(-) The average temperature of the palmrest area of similar devices was 27.5 °C / 81.5 F (-2.8 °C / -5 F).
Speaker
The speakers of the ThinkPad T15 Gen2 offer a medium volume and a sound spectrum that is pronounced on the mid to high tones. Thus, they are well suited for rendering speech, but external speakers or headphones should be preferred for media content.
Lenovo ThinkPad T15 Gen2-20W5S00100 audio analysis
(±) | speaker loudness is average but good (76.3 dB)
Bass 100 - 315 Hz
(-) | nearly no bass - on average 21% lower than median
(±) | linearity of bass is average (12.1% delta to prev. frequency)
Mids 400 - 2000 Hz
(±) | higher mids - on average 5.6% higher than median
(+) | mids are linear (6.4% delta to prev. frequency)
Highs 2 - 16 kHz
(+) | balanced highs - only 4.2% away from median
(+) | highs are linear (4.8% delta to prev. frequency)
Overall 100 - 16.000 Hz
(±) | linearity of overall sound is average (21.9% difference to median)
Compared to same class
» 56% of all tested devices in this class were better, 8% similar, 36% worse
» The best had a delta of 7%, average was 21%, worst was 53%
Compared to all devices tested
» 63% of all tested devices were better, 7% similar, 31% worse
» The best had a delta of 4%, average was 24%, worst was 134%
Lenovo ThinkPad E15 Gen2-20TD002MGE audio analysis
(±) | speaker loudness is average but good (72.9 dB)
Bass 100 - 315 Hz
(-) | nearly no bass - on average 25.7% lower than median
(±) | linearity of bass is average (14% delta to prev. frequency)
Mids 400 - 2000 Hz
(+) | balanced mids - only 3.8% away from median
(+) | mids are linear (4.3% delta to prev. frequency)
Highs 2 - 16 kHz
(±) | higher highs - on average 5.4% higher than median
(±) | linearity of highs is average (7.6% delta to prev. frequency)
Overall 100 - 16.000 Hz
(±) | linearity of overall sound is average (21.2% difference to median)
Compared to same class
» 51% of all tested devices in this class were better, 9% similar, 40% worse
» The best had a delta of 7%, average was 21%, worst was 53%
Compared to all devices tested
» 59% of all tested devices were better, 7% similar, 34% worse
» The best had a delta of 4%, average was 24%, worst was 134%
Power management - Eight hours of battery life
Energy consumption
With an average power consumption of 8.8 watts in idle mode and 60 watts under load, the ThinkPad T15 Gen2 has the second highest energy consumption in our test field. The maximum load value of 68.5 watts briefly exceeds the 65-watt power supply included in the delivery, but quickly settles at 43 watts.
If the keyboard illumination is enabled, 10.3 watts are needed in idle mode on level 1 and 11.6 watts on level 2. Without the backlight, the idle maximum drops to 9.6 watts.
| Off / Standby | |
| Idle | |
| Load |
|
Key:
min: | |
| Lenovo ThinkPad T15 Gen2-20W5S00100 i7-1165G7, GeForce MX450, Samsung PM981a MZVLB1T0HBLR, IPS, 1920x1080, 15.6" | Asus VivoBook S15 S533EQ-BQ002T i7-1165G7, GeForce MX350, Intel SSD 660p 1TB SSDPEKNW010T8, IPS, 1920x1080, 15.6" | Schenker Vision 15 i7-1165G7, Iris Xe G7 96EUs, Samsung SSD 980 Pro 1TB MZ-V8P1T0BW, IPS, 1920x1080, 15.6" | Lenovo ThinkPad T15 Gen1-20S7S02U00 i7-10510U, GeForce MX330, Toshiba XG6 KXG6AZNV1T02, IPS LED, 3840x2160, 15.6" | Lenovo ThinkPad E15 Gen2-20TD002MGE i7-1165G7, GeForce MX450, Samsung PM991 MZALQ512HALU, IPS, 1920x1080, 15.6" | Average NVIDIA GeForce MX450 | Average of class Office | |
|---|---|---|---|---|---|---|---|
| Power Consumption | 12% | 15% | -23% | 17% | -2% | 15% | |
| Idle Minimum * (Watt) | 4.5 | 3 33% | 3.5 22% | 4.3 4% | 4.4 2% | 4.91 ? -9% | 4.41 ? 2% |
| Idle Average * (Watt) | 8.8 | 6.4 27% | 6.3 28% | 13.8 -57% | 8.2 7% | 8.36 ? 5% | 7.39 ? 16% |
| Idle Maximum * (Watt) | 11.6 | 7.9 32% | 6.8 41% | 16.2 -40% | 10.3 11% | 11.1 ? 4% | 8.66 ? 25% |
| Load Average * (Watt) | 60 | 59 2% | 43.2 28% | 66 -10% | 25 58% | 58.4 ? 3% | 42.7 ? 29% |
| Witcher 3 ultra * (Watt) | 39.2 | 48 -22% | 52 -33% | 53 -35% | |||
| Load Maximum * (Watt) | 68.5 | 68 1% | 67.7 1% | 67.4 2% | 64 7% | 76.2 ? -11% | 64.9 ? 5% |
* ... smaller is better
Battery life
The Lenovo ThinkPad T15 Gen2 achieves a runtime of just under eight hours in our practical Wi-Fi test. Although it lasts longer than the predecessor, other devices in this class perform better with partly lower battery capacity.
The T15 Gen2 also supports fast charging, which means that 80% of the battery is available again after one hour.
| Lenovo ThinkPad T15 Gen2-20W5S00100 i7-1165G7, GeForce MX450, 57 Wh | Asus VivoBook S15 S533EQ-BQ002T i7-1165G7, GeForce MX350, 50 Wh | Schenker Vision 15 i7-1165G7, Iris Xe G7 96EUs, 73 Wh | Lenovo ThinkPad T15 Gen1-20S7S02U00 i7-10510U, GeForce MX330, 57 Wh | Lenovo ThinkPad E15 Gen2-20TD002MGE i7-1165G7, GeForce MX450, 45 Wh | Average of class Office | |
|---|---|---|---|---|---|---|
| Battery runtime | ||||||
| WiFi v1.3 (h) | 7.9 | 8.4 6% | 15.2 92% | 7.1 -10% | 8 1% | 12.7 ? 61% |
Pros
Cons
Verdict - Tiger-Lake brings more CPU performance

The Lenovo ThinkPad T15 Gen2 undoubtedly offers more performance than the predecessor. The Tiger-Lake CPU improves the everyday performance, and maintenance options, such as the free RAM slot or the prepared slot for WWAN, also allow subsequent upgrades. Theoretically, the Nvidia GeForce MX450 can also increase the graphics performance a bit.
Lenovo clearly increases the performance of the ThinkPad T15 in the second generation, but the MX450 only brings a small added value here.
In practice, however, the MX450 barely shows a higher performance than the CPU's internal Intel Iris Xe Graphics G7. Although this keeps the heat output in check, the second graphics unit hardly offers any added value. Users who can do without the business features of the ThinkPad T15 Gen2 would be better off with the ThinkPad E15 Gen2, which has an MX450 with its full performance.
Price and availability
The Lenovo ThinkPad T15 Gen2 is available from various retailers. For example, without an operating system at Campuspoint for 1,349 Euros (~$1626).
Lenovo ThinkPad T15 Gen2-20W5S00100
- 05/01/2021 v7 (old)
Mike Wobker
Price comparison

