

Geekom Mini IT8 SFF desktop hands-on
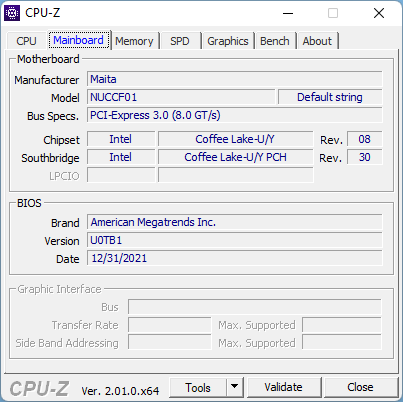
Mini desktops have grown in popularity over the past few years, and there are now more options in this market than ever before. One of the latest releases is the Geekom Mini IT8. It packs quite a few ports and a competent Intel Core i5-8259U with Intel Iris Plus Graphics 655 in its compact case. However, the aging Coffee Lake platform and lackluster driver support cause some issues, particularly with gaming and graphics load.
In this hands-on review, will take a quick look at many aspects of the Geekom Mini IT8, including performance, build quality, and our overall impression. Since this is a shorter hands-on overview, we will not attribute a final rating to the Mini IT8. As a quick note, our review unit was provided by Geekom.
Competitors include other mini PCs like the Beelink SER4, Beelink GK Mini PC Review: Ready-to-Go HTPCBeelink GTI 11, GMK NucBox 2, Intel NUC11TNKi5, and (to some extent) Intel Hades Canyon NUC8i7HVK. We will also compare the Chuwi CoreBook X and CoreBook X Pro as they have the same Core i5-8259U and Intel Iris Plus Graphics 655 as the Mini IT8.
potential competitors in comparison
Rating | Date | Model | Weight | Height | Size | Resolution | Price |
|---|---|---|---|---|---|---|---|
v (old) | 05 / 2022 | Geekom Mini IT8-GM08i5T i5-8259U, Iris Plus Graphics 655 | 586 g | 45.5 mm | x | ||
v (old) | 04 / 2022 | Beelink SER4 R7 4800U, Vega 8 | 494 g | 40 mm | x | ||
v (old) | 12 / 2021 | Beelink GTI 11 i5-1135G7, Iris Xe G7 80EUs | 638 g | 39 mm | x | ||
v (old) | 03 / 2021 | GMK NucBox 2 i5-8259U, Iris Plus Graphics 655 | 430 g | 50 mm | x | ||
v (old) | 04 / 2021 | Intel NUC11TNKi5 i5-1135G7, Iris Xe G7 80EUs | 504 g | 37 mm | x | ||
v (old) | 03 / 2018 | Intel Hades Canyon NUC8i7HVK i7-8809G, Vega M GH | 1.3 kg | 39 mm | x | ||
| 74.8 % v7 (old) | 09 / 2021 | Chuwi CoreBook X Pro i5-8259U, Iris Plus Graphics 655 | 1.8 kg | 17.9 mm | 15.60" | 1920x1080 | |
| 79 % v7 (old) | 07 / 2021 | Chuwi CoreBook X i5-8259U, Iris Plus Graphics 655 | 1.5 kg | 20.6 mm | 14.00" | 2160x1440 |
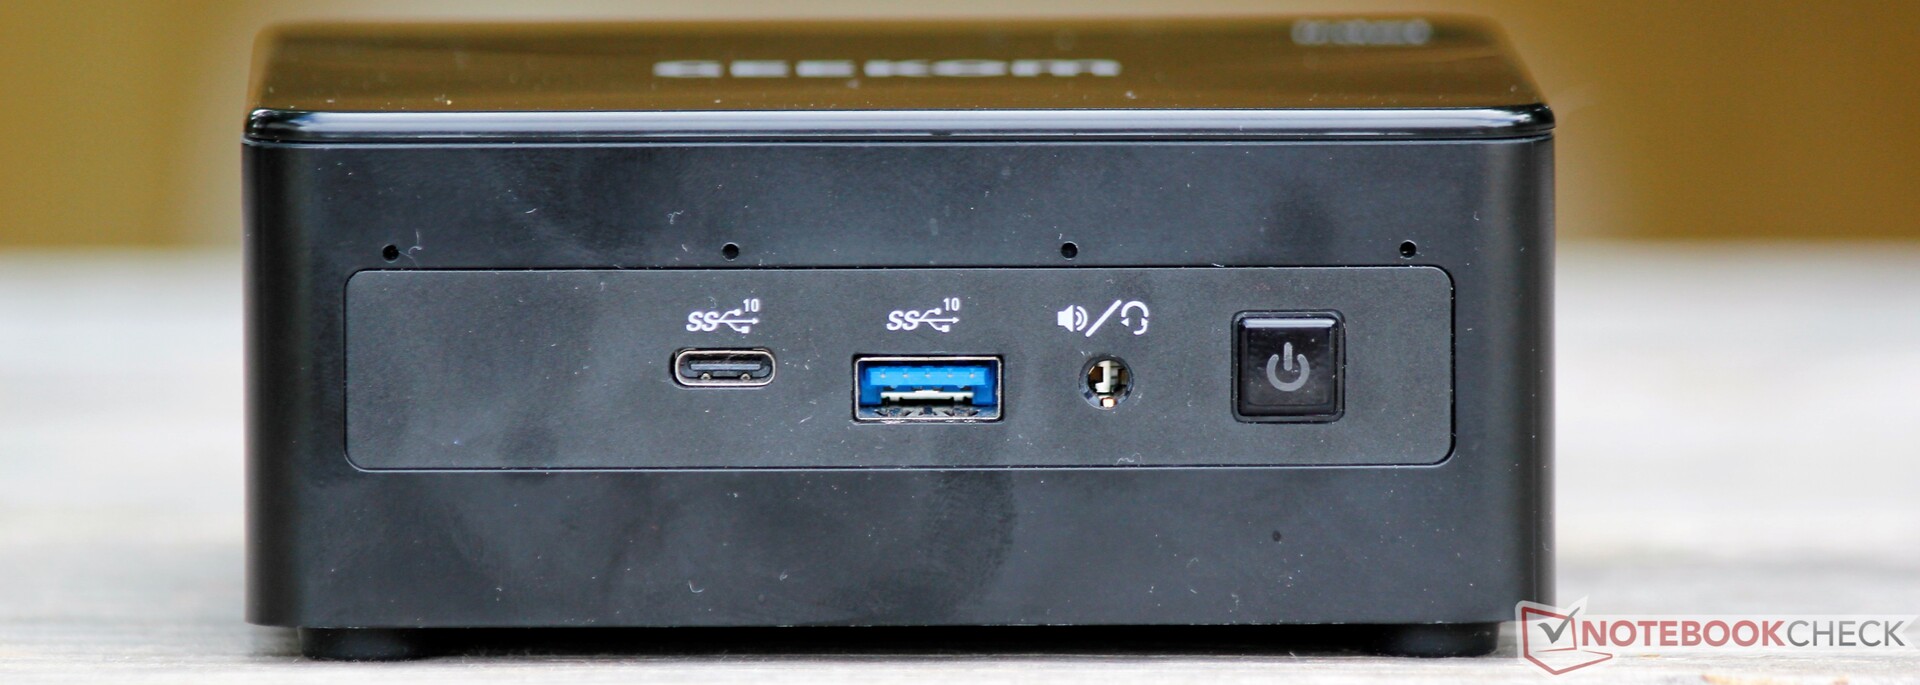
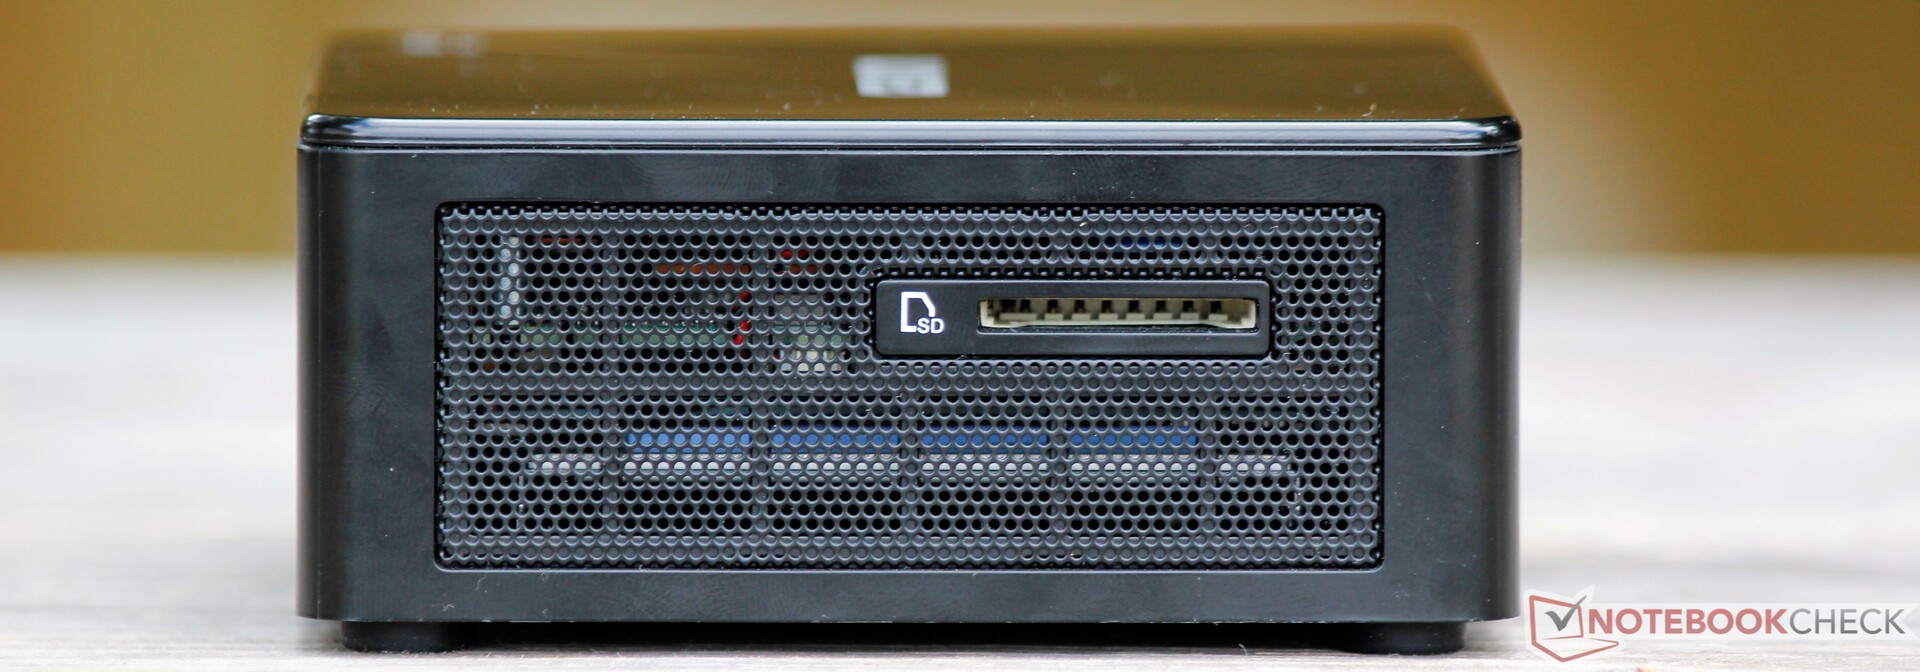
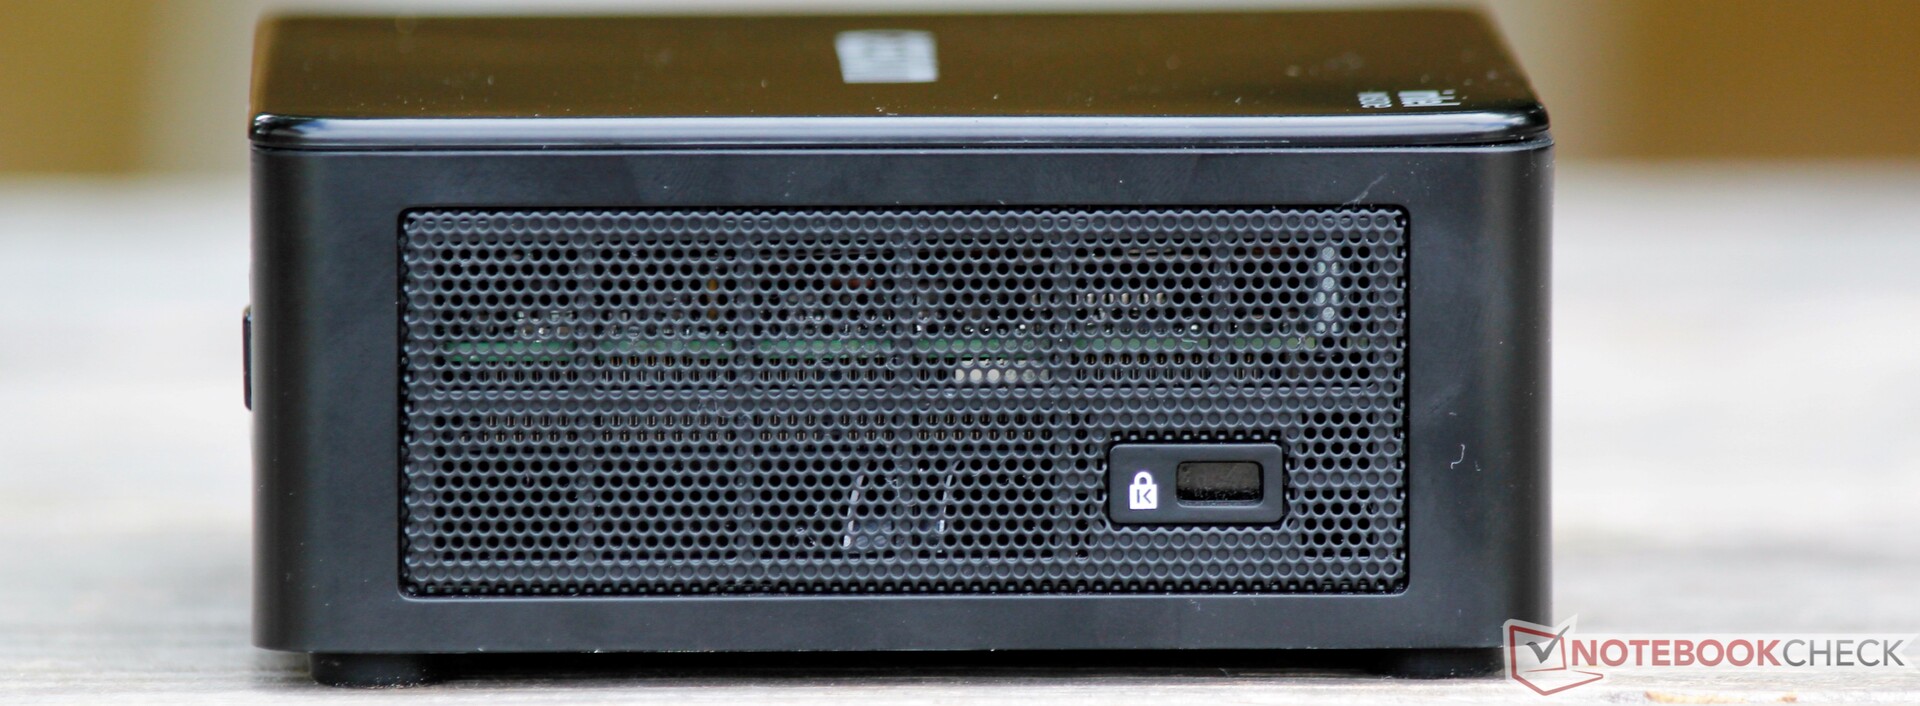
Case and Connectivity
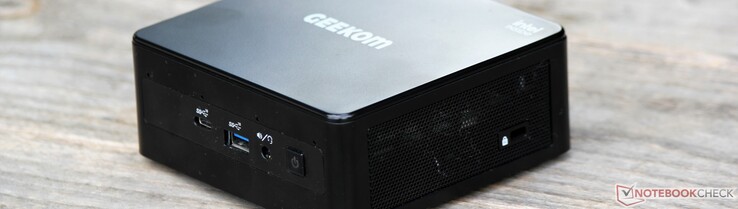
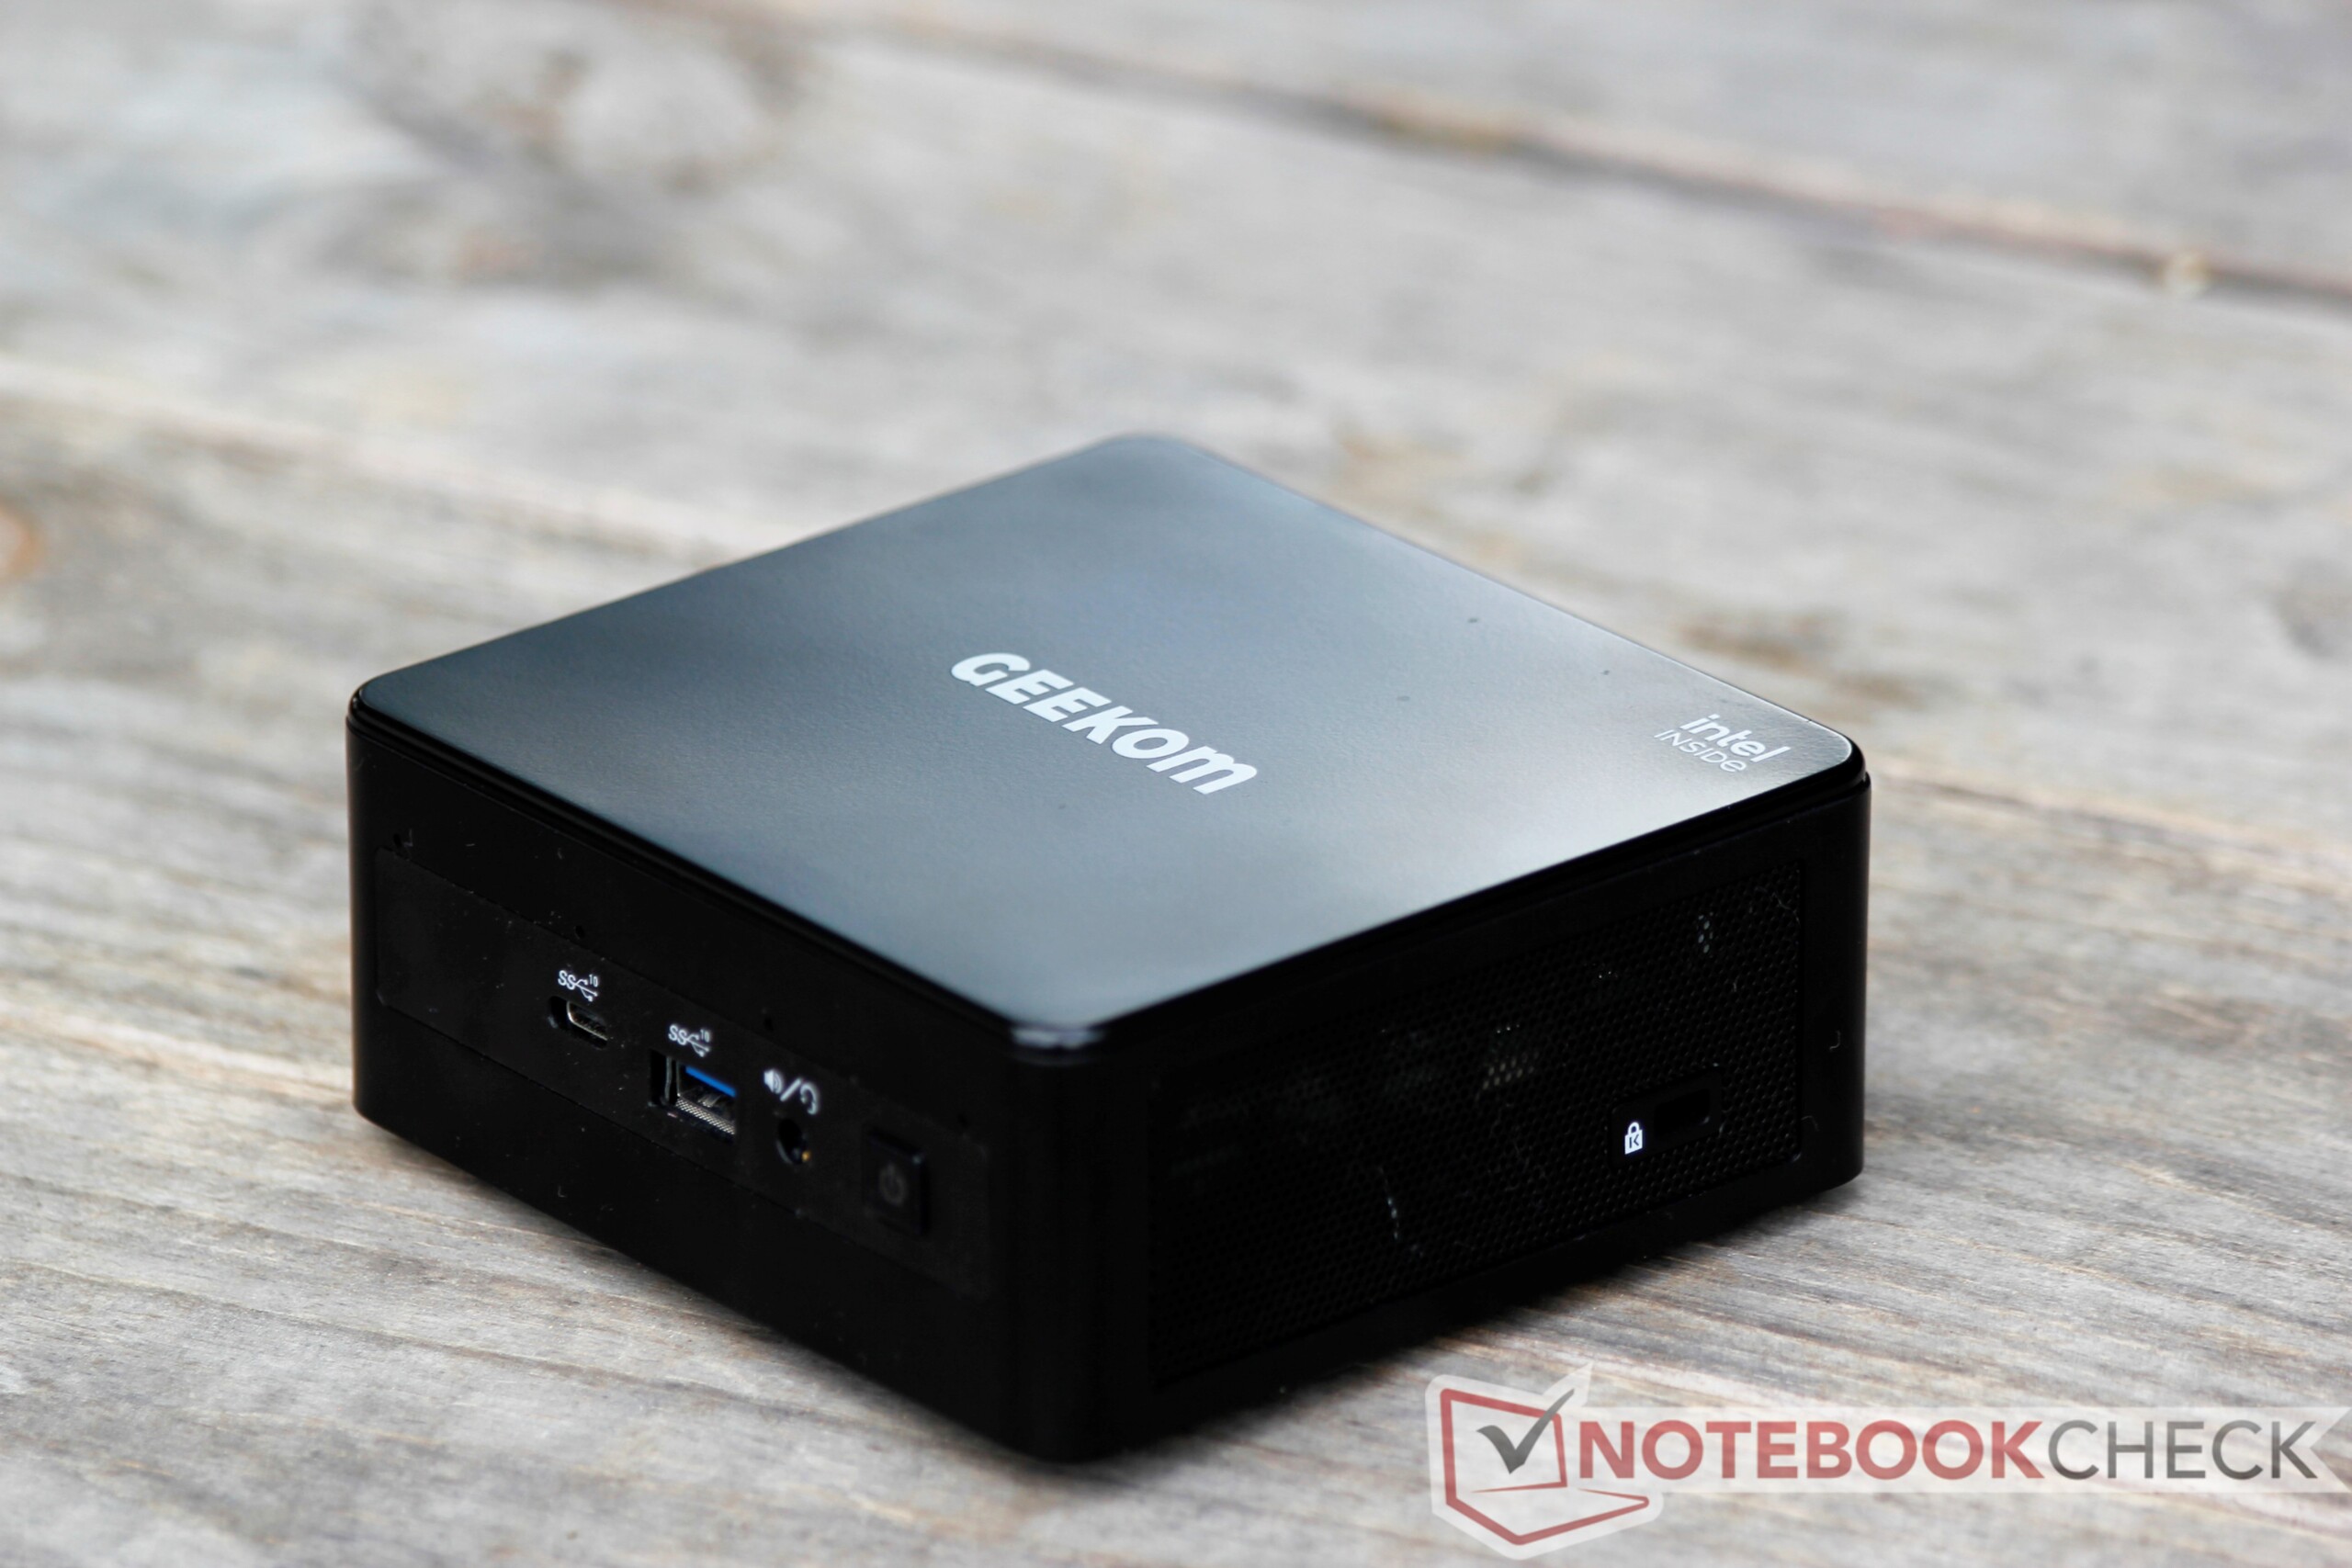
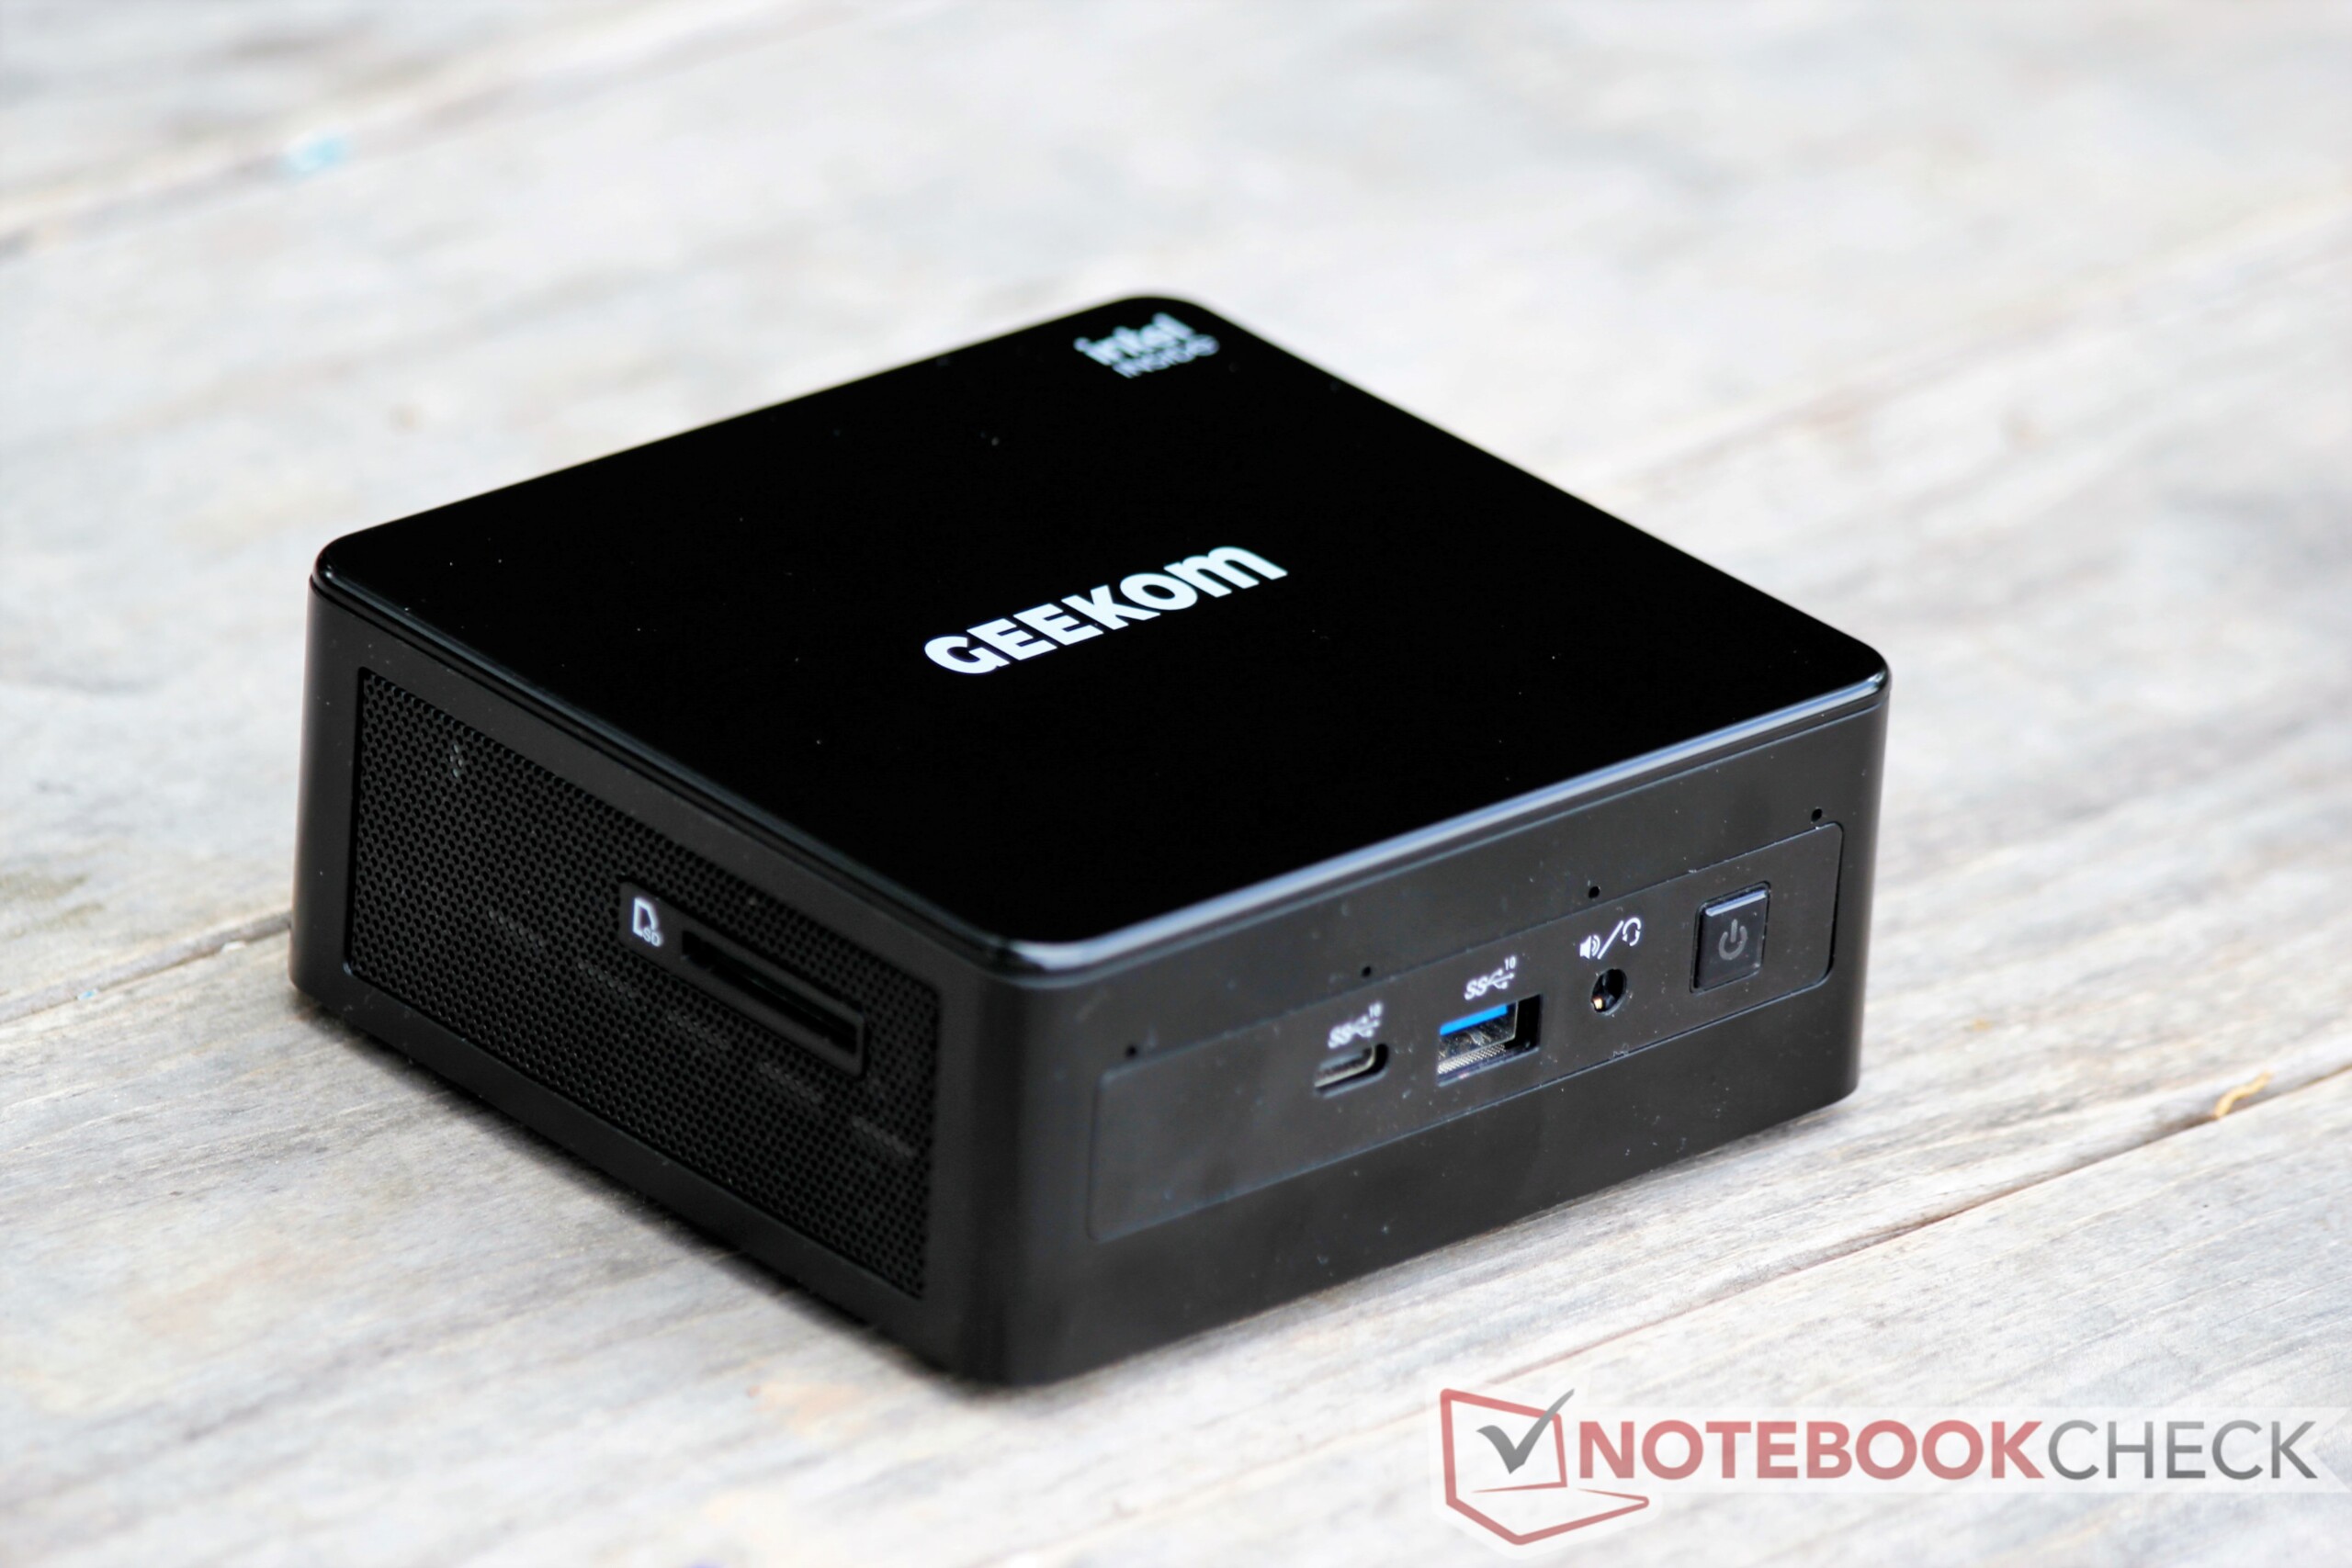
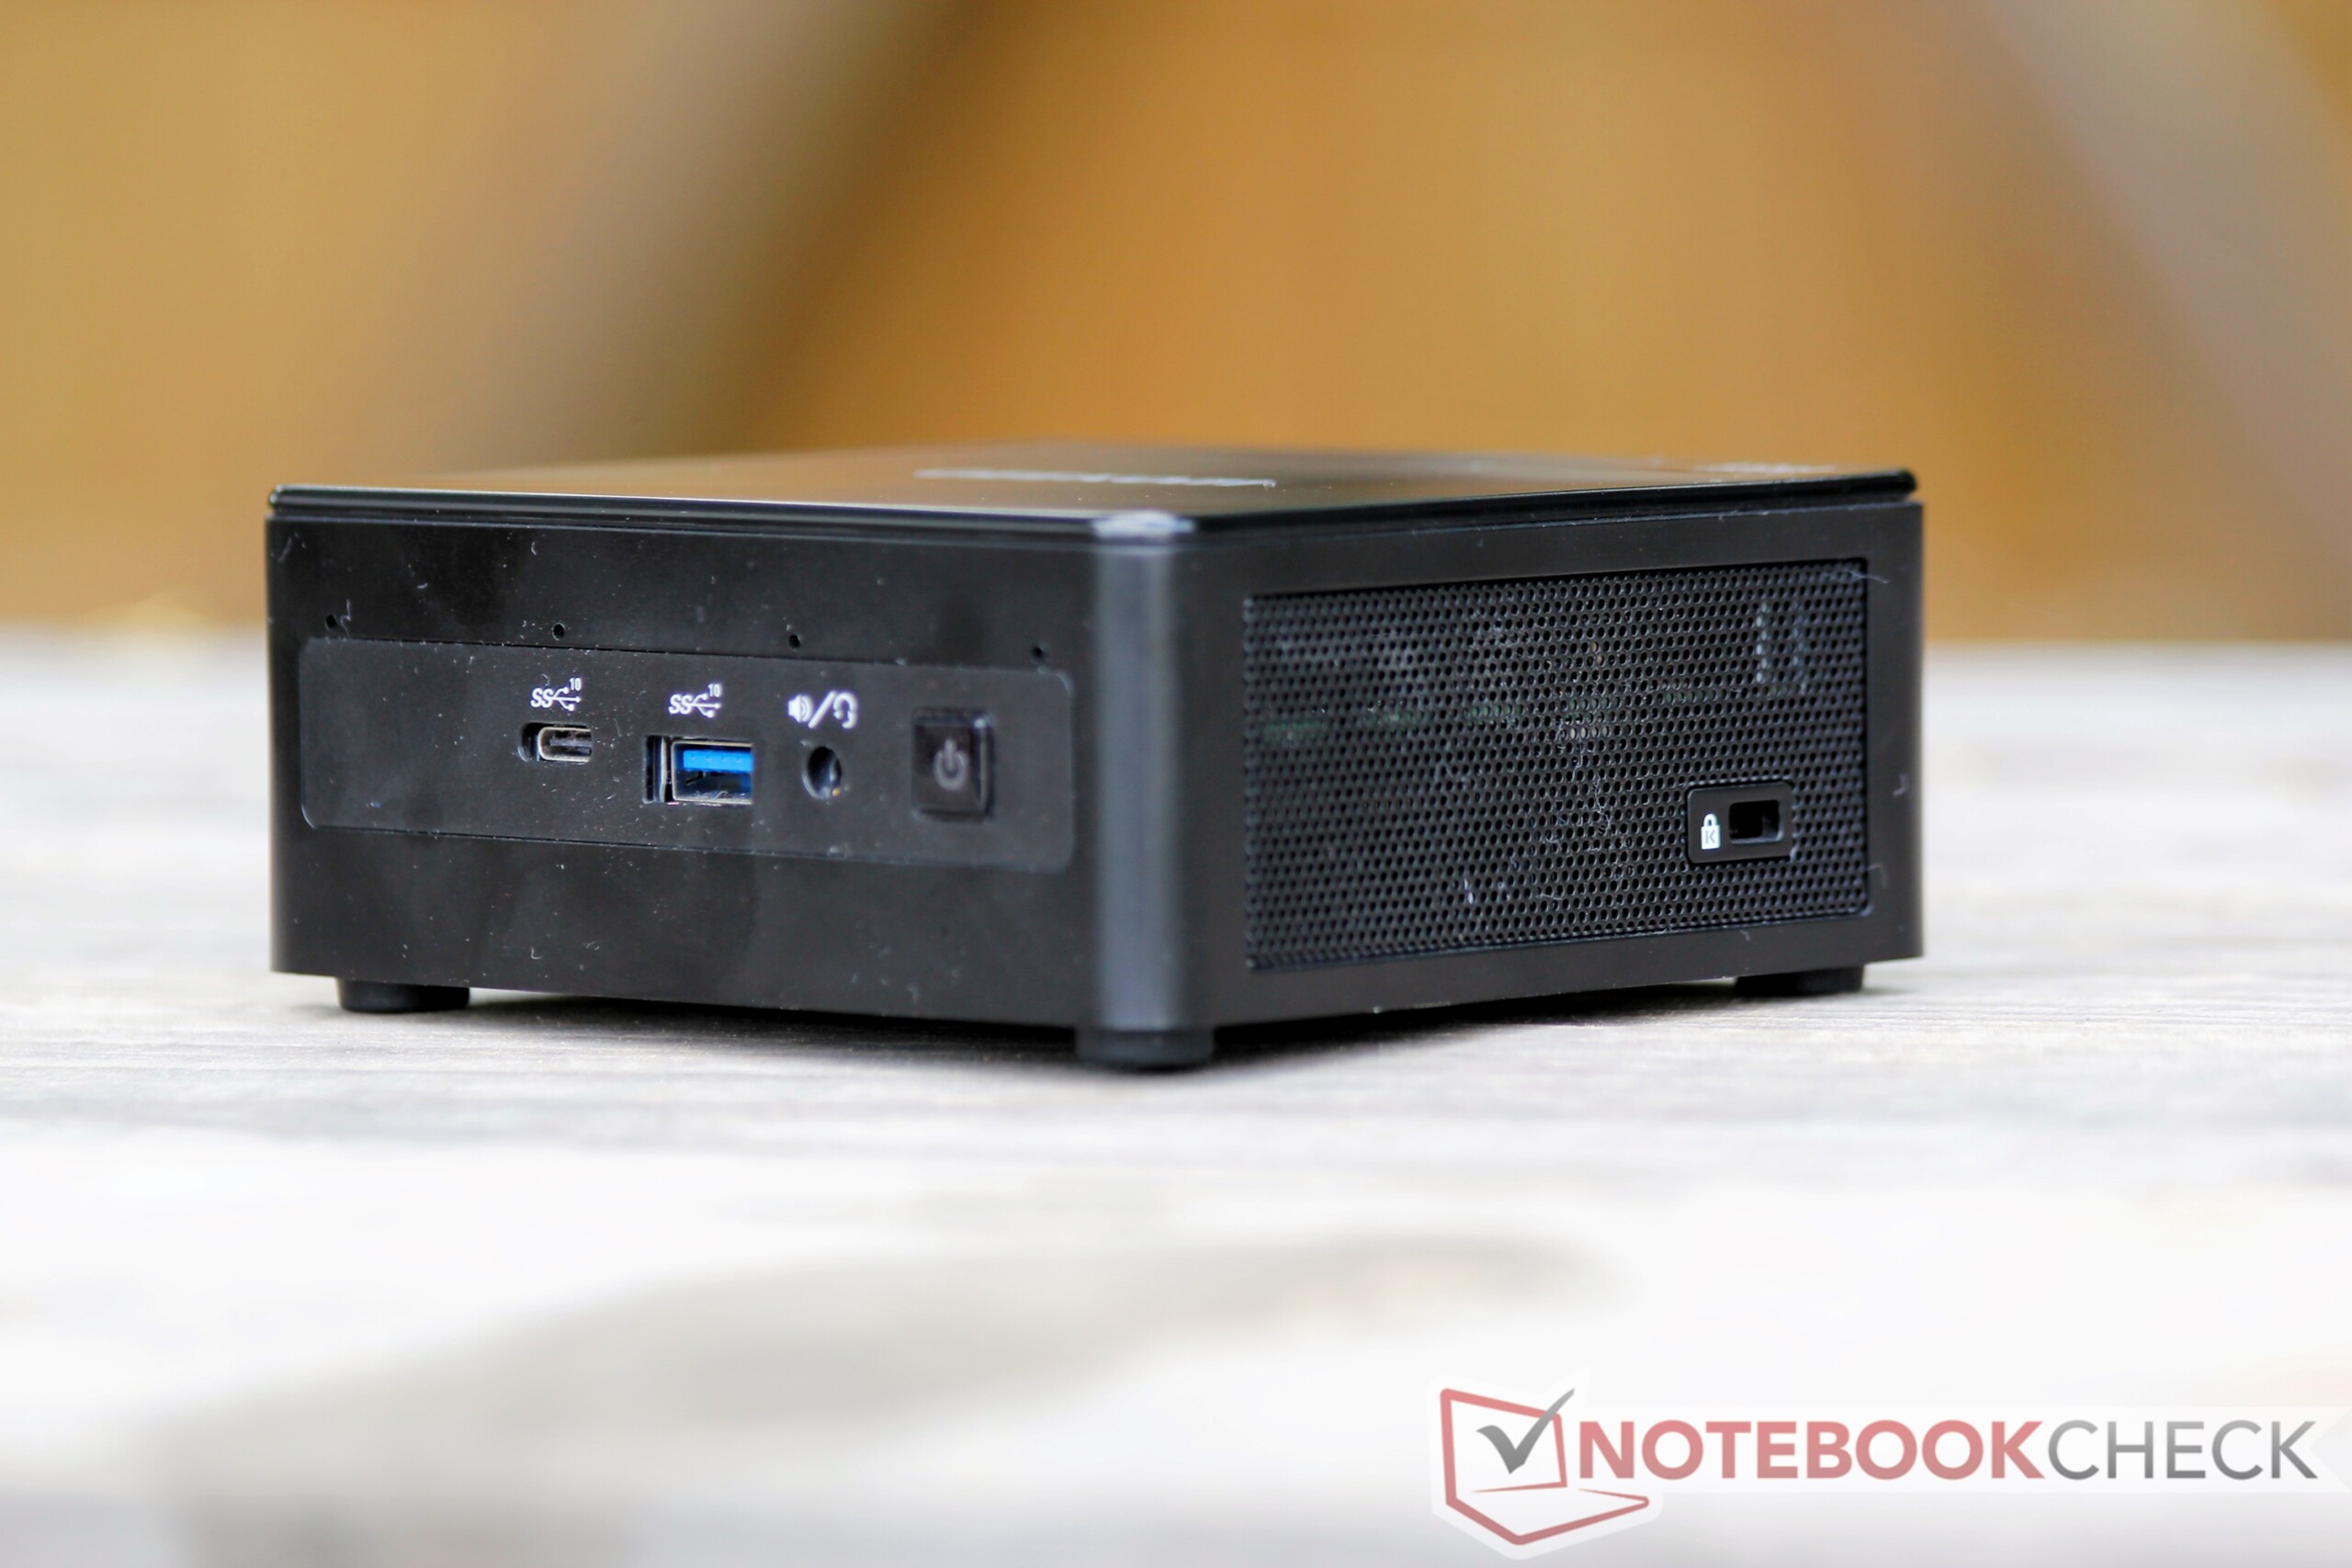
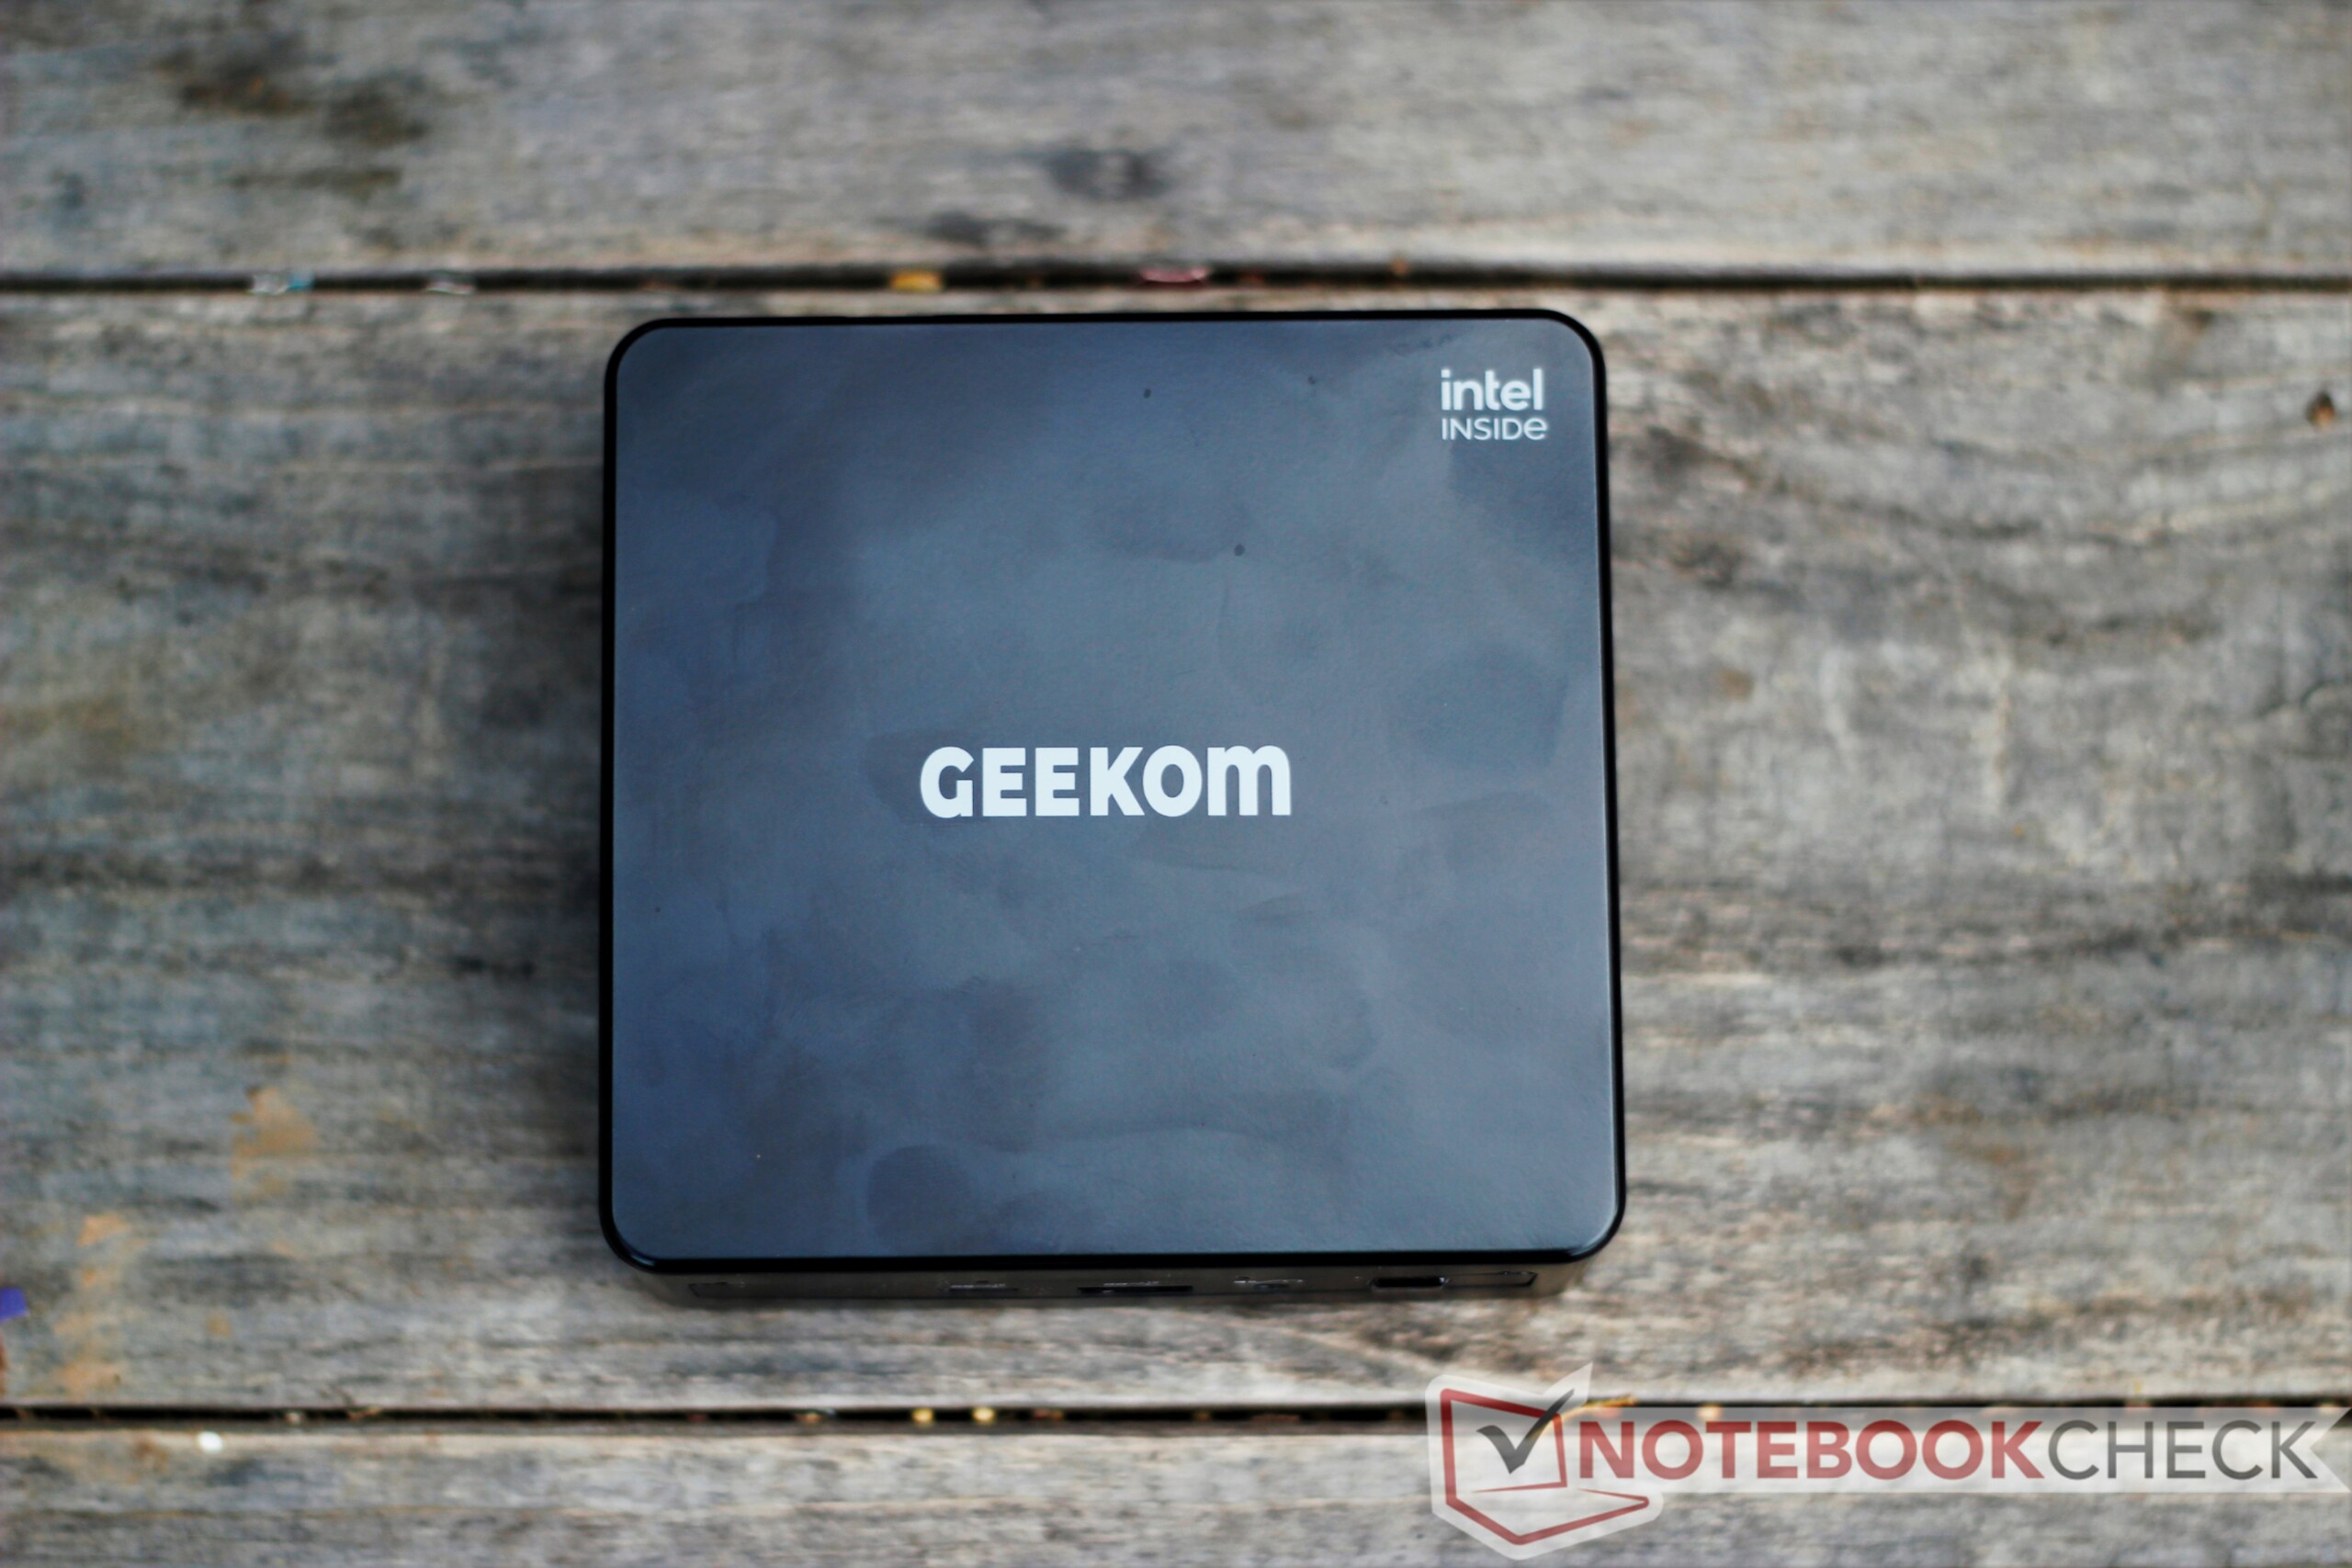
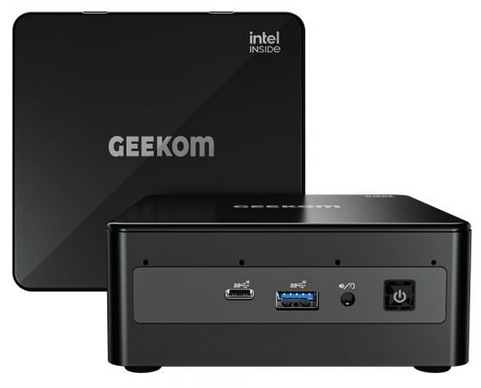
The case is mostly made from semi-glossy plastic. Metal vents sit on the sides, and the base plate is hewn from anodized aluminum. The build quality is robust and sturdy. This is to be expected considering the IT8's tiny volume. The machine feels rather heavy in the hand, owing largely to how densely the components are packed inside. Overall, the Mini IT8 leaves a good impression; there are no structural concerns. The black color is largely unassuming, but fingerprints easily show along the top.
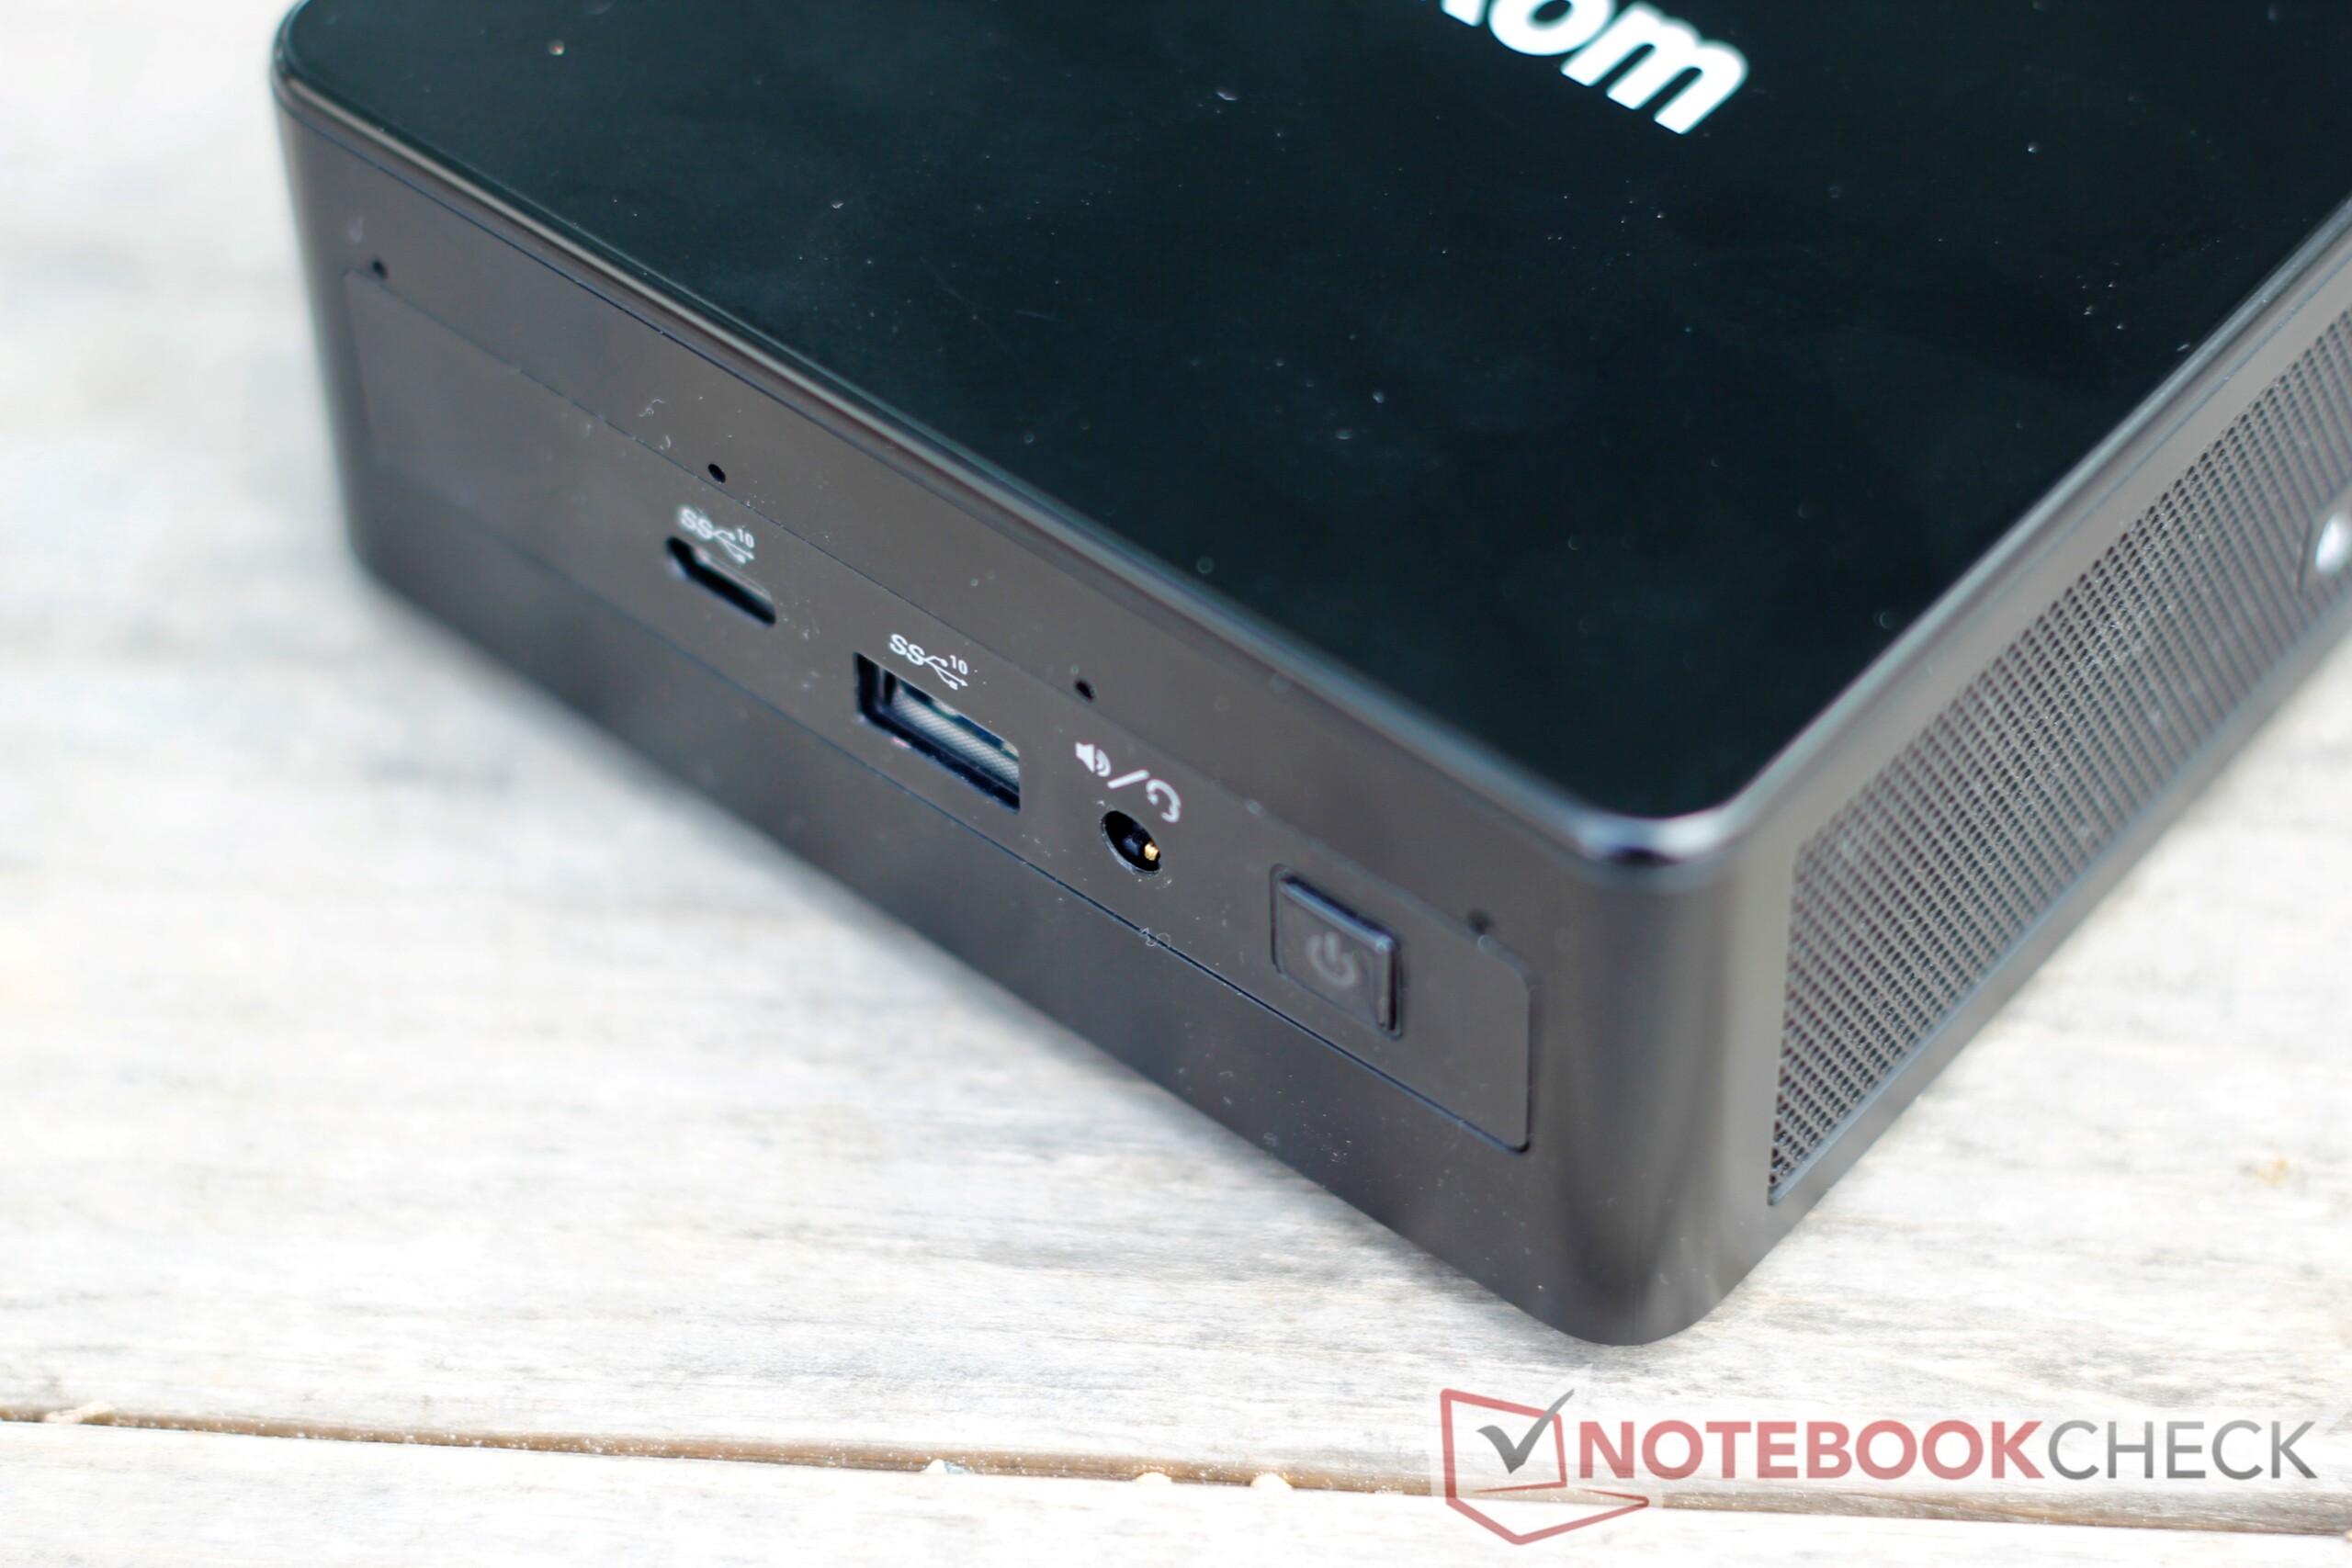
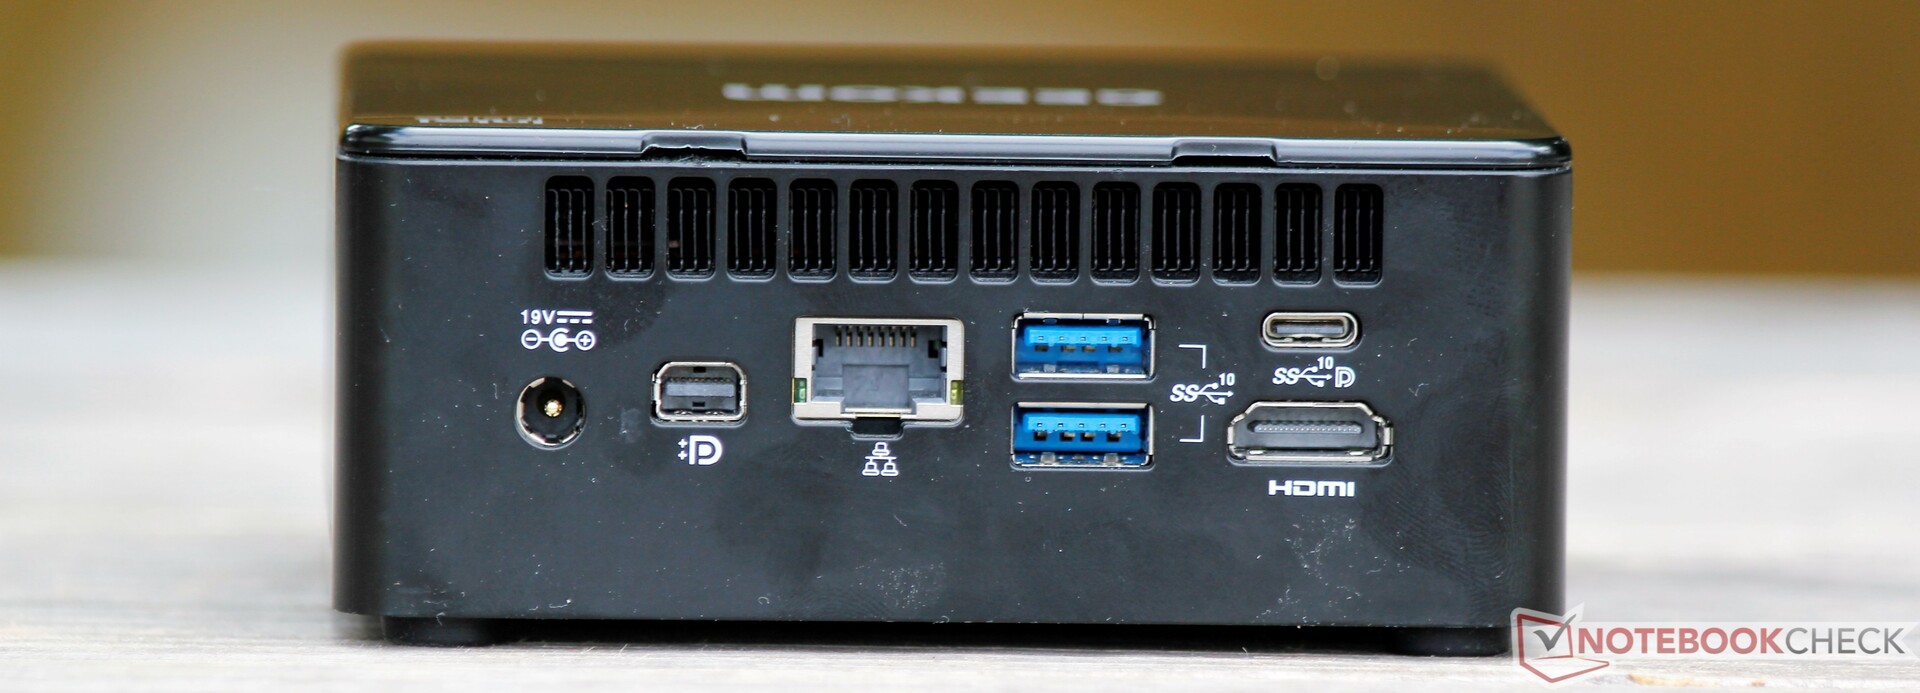
Connectivity is fairly good considering the Mini IT8's small size. It features five total USB 3.2 Gen 2 (10 Gbps) USB ports, two of which are Type-C. The Type-C port on the back also supports DisplayPort. This allows users to connect up to 3 displays (in conjunction with the HDMI 2.0b and Mini DisplayPort 1.4 ports). The SD card reader on the side is a nice addition.
Connectivity
Maintenance
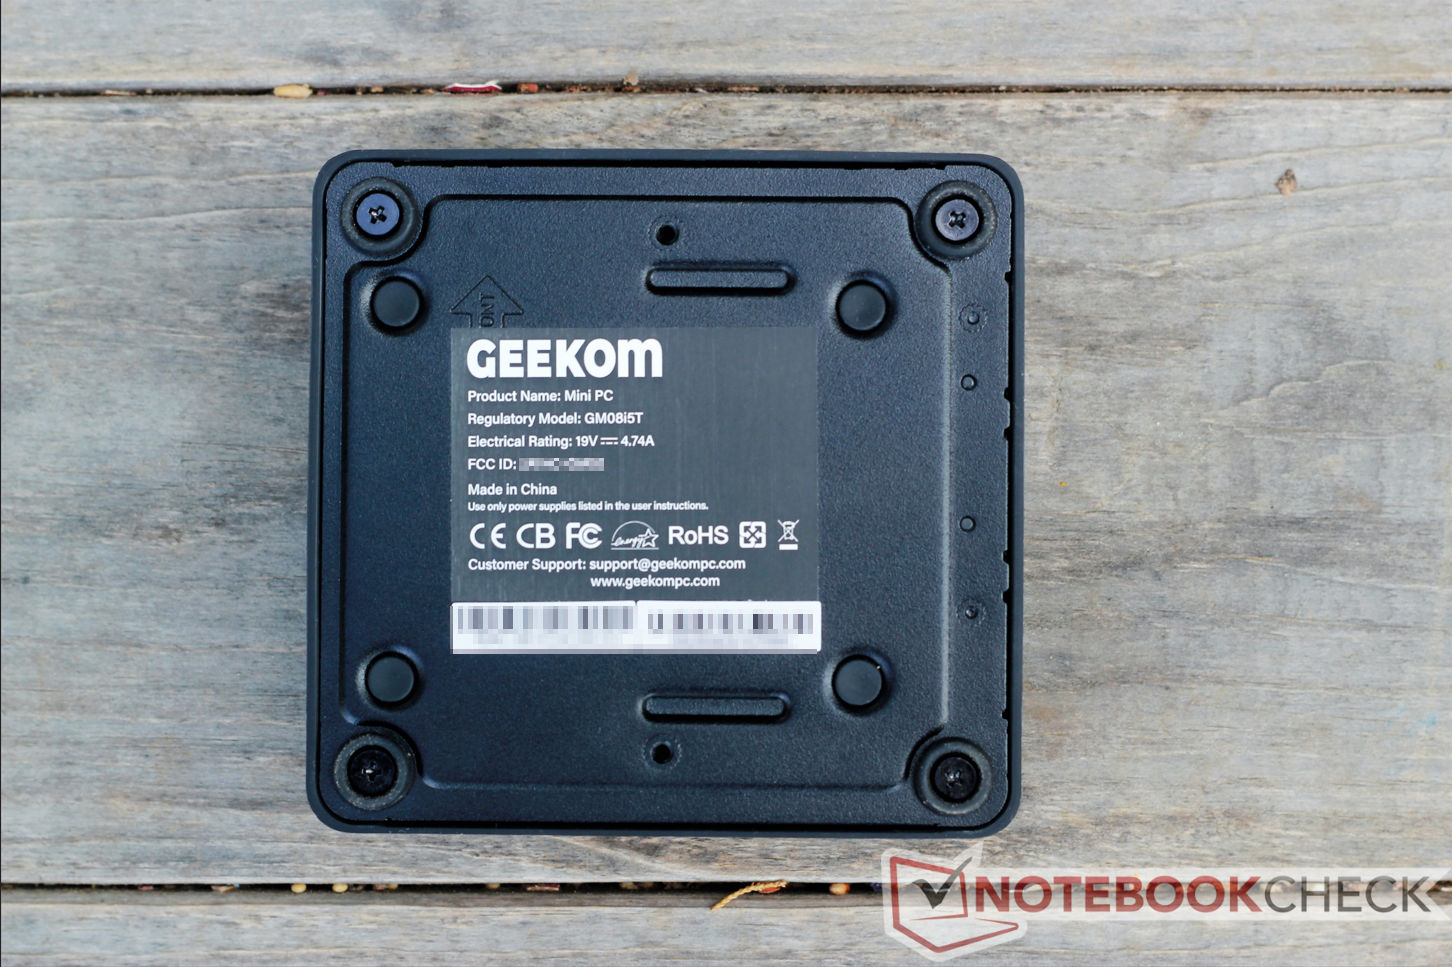
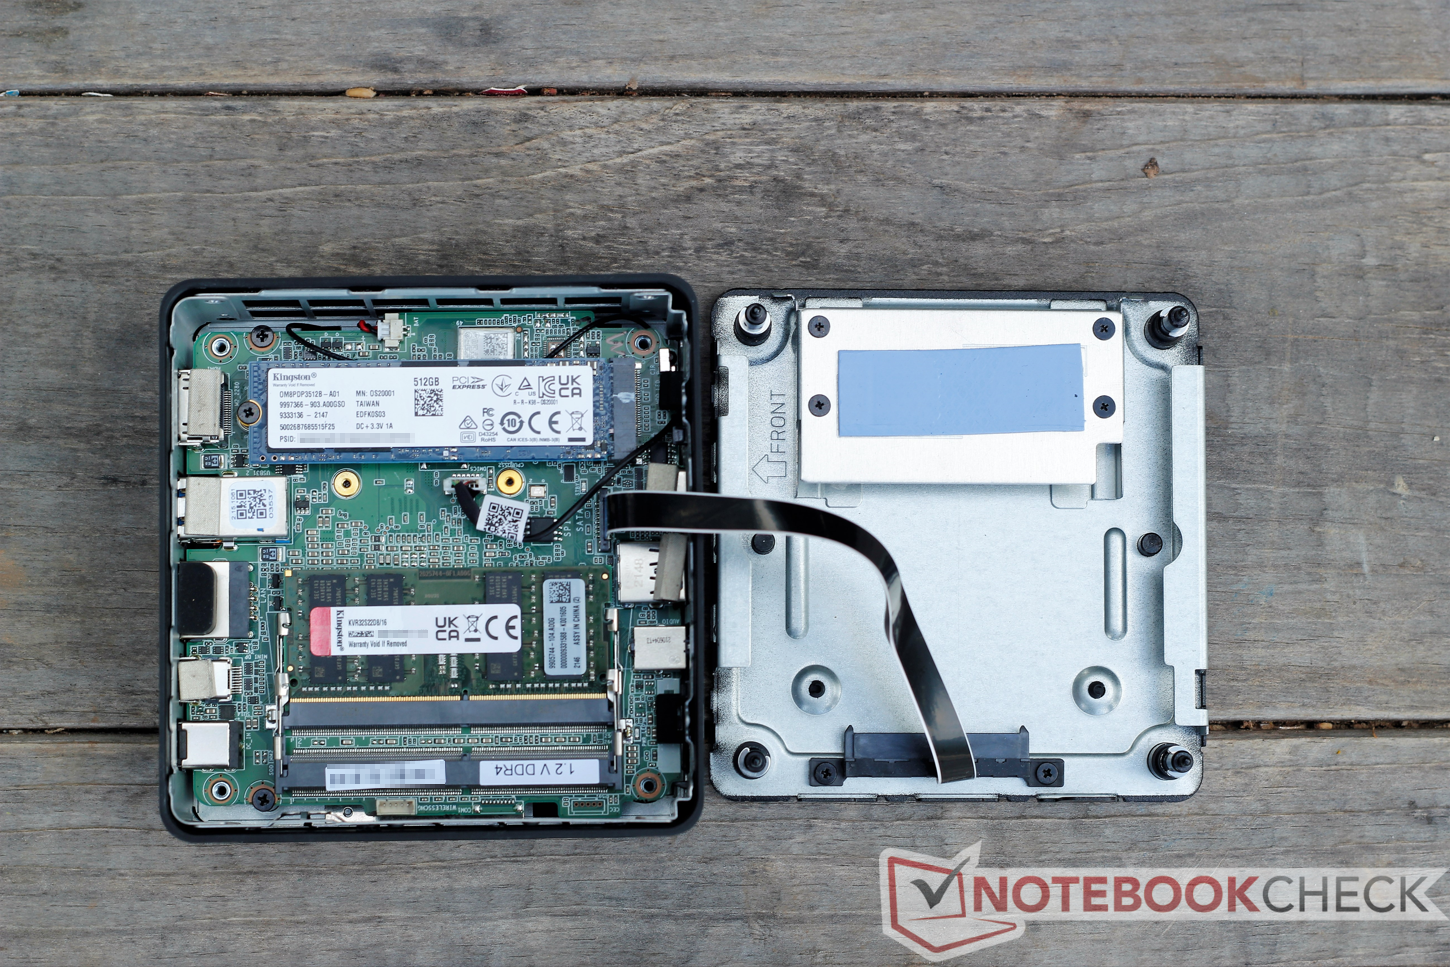
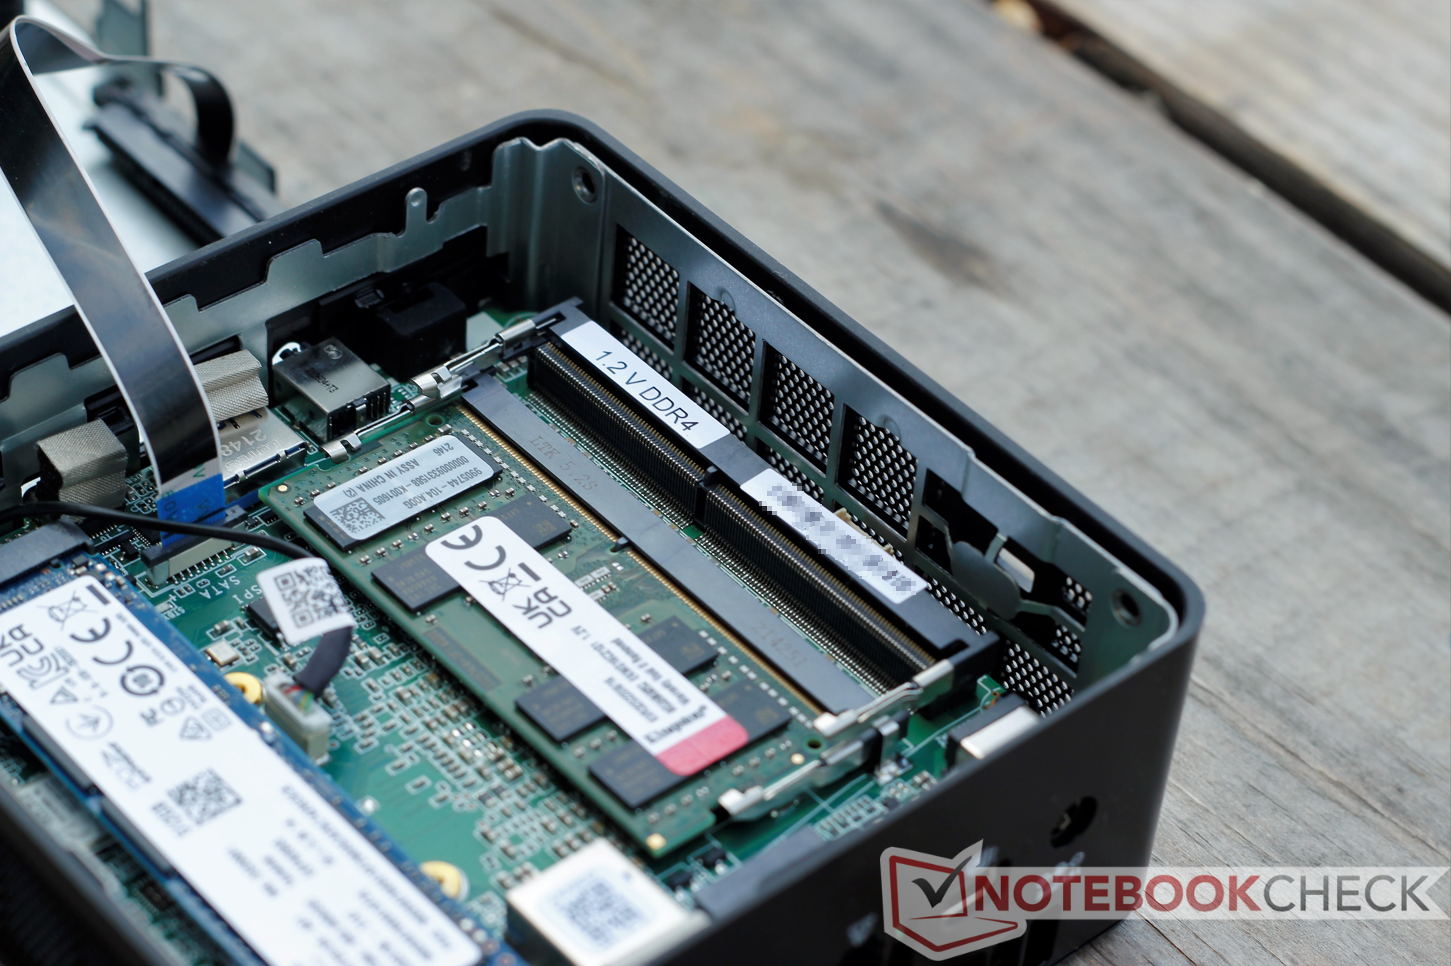
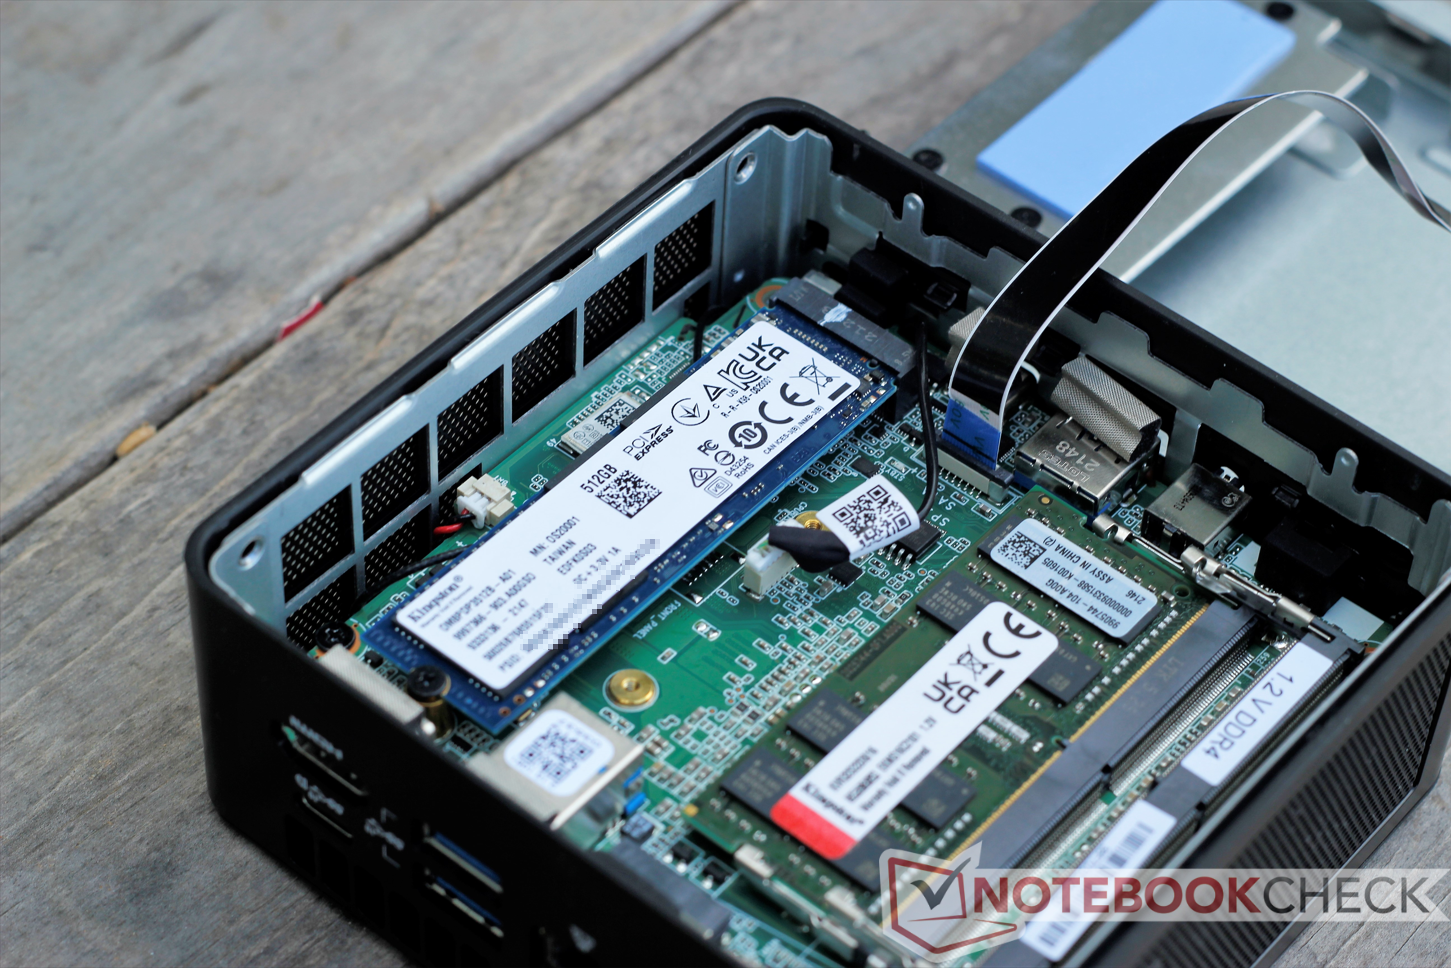
Accessing the internals of the Mini IT8 is very easy. Four self-retaining screws hold the bottom plate on. Once these are loosened, users can gently pull the bottom off. Caution is advised: there is a thin ribbon cable connecting the SATA slot on the bottom panel to the motherboard.
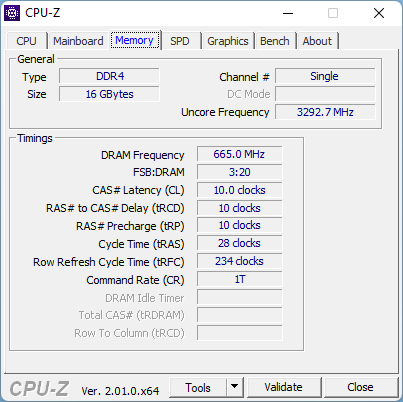
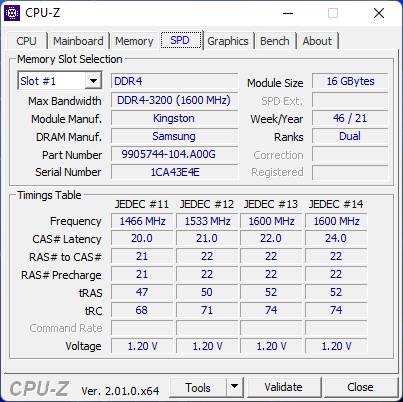
Once inside, users have access to the empty 2.5-inch SATA drive bay, the PCIe SSD, and two DDR4 SODIMM slots (one of which is populated out of the box). Further disassembly is required to access the soldered processor for repasting, but it is tricky to get the motherboard out.
Performance
The Geekom Mini IT8 is powered by an Intel Core i5-8259U and integrated Intel Iris Plus Graphics 655 GPU. Despite being based on the aging Coffee Lake architecture, the quad-core Hyperthreaded chip is still fairly competent, especially for general office work and web browsing. However, since it is a U-series processor, it is limited by its 15 Watt TDP. Compared to other mini desktops, the i5-8259U falls behind in most benchmarks.
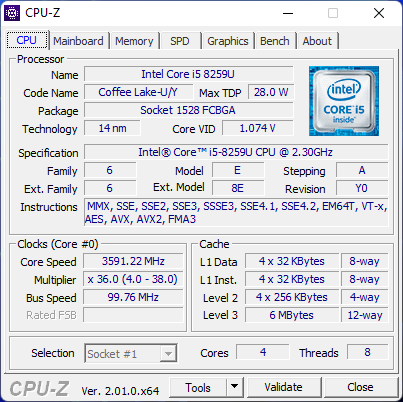
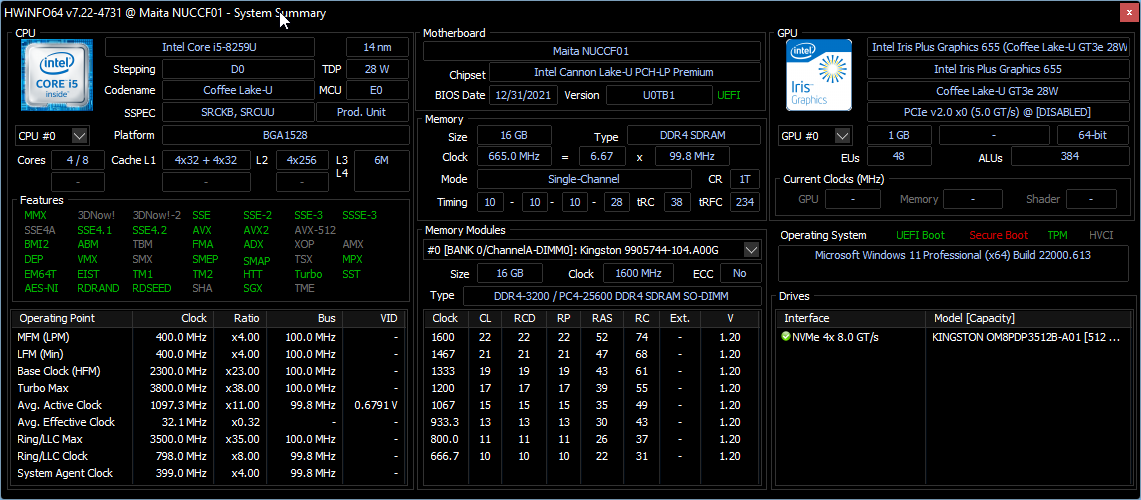
Processor
The Core i5-8259U offers enough power for general computing and should be adequate for most users. The CPU has four Hyperthreaded cores with a base clock of 2.3 GHz and a single-core Turbo boost up to 3.8 GHz.
While the Geekom Mini IT8's CPU is capable of handling most office tasks, web browsing, and general tasks quite easily, it noticeably lags behind newer chips like the Tiger Lake Core i5-1135G7 present in both the Intel NUC11TNKi5 and Beelink GTI 11. AMD's Ryzen 7 4800U, as demonstrated in the Beelink SER4, is 32% faster in Cinebench R20's single-core tests and more than doubles the 8259U's multi-core score (likely due to the 4800U's 16 threads).
On the plus side, the Geekom Mini IT8 exhibits no throttling. It remains steady throughout our Cinebench R15 multi-core test loop.
Cinebench R15 Multi Loop
Cinebench R15: CPU Single 64Bit | CPU Multi 64Bit
Blender: v2.79 BMW27 CPU
7-Zip 18.03: 7z b 4 -mmt1 | 7z b 4
Geekbench 5.5: Single-Core | Multi-Core
HWBOT x265 Benchmark v2.2: 4k Preset
LibreOffice : 20 Documents To PDF
R Benchmark 2.5: Overall mean
| Cinebench R20 / CPU (Single Core) | |
| Average of class Desktop (674 - 902, n=13, last 2 years) | |
| Intel NUC11PAQi7 | |
| Beelink GTR5 | |
| Beelink GTI 11 | |
| Intel NUC11TNKi5 | |
| Beelink SER4 | |
| Intel NUC10i5FNK | |
| Intel Hades Canyon NUC8i7HVK | |
| Chuwi CoreBook X | |
| GMK NucBox 2 | |
| Chuwi CoreBook X Pro | |
| Average Intel Core i5-8259U (369 - 386, n=5) | |
| Beelink SER3 | |
| Geekom Mini IT8-GM08i5T | |
| Cinebench R20 / CPU (Multi Core) | |
| Average of class Desktop (5710 - 16722, n=13, last 2 years) | |
| Beelink GTR5 | |
| Beelink SER4 | |
| Intel NUC11PAQi7 | |
| Beelink GTI 11 | |
| Intel Hades Canyon NUC8i7HVK | |
| Intel NUC11TNKi5 | |
| Intel NUC10i5FNK | |
| Beelink SER3 | |
| Chuwi CoreBook X Pro | |
| Average Intel Core i5-8259U (1385 - 1567, n=5) | |
| Geekom Mini IT8-GM08i5T | |
| GMK NucBox 2 | |
| Chuwi CoreBook X | |
| Cinebench R15 / CPU Single 64Bit | |
| Average of class Desktop (246 - 356, n=17, last 2 years) | |
| Beelink GTR5 | |
| Intel NUC11PAQi7 | |
| Intel NUC11TNKi5 | |
| Beelink GTI 11 | |
| Beelink SER4 | |
| Intel Hades Canyon NUC8i7HVK | |
| Intel NUC10i5FNK | |
| Chuwi CoreBook X Pro | |
| GMK NucBox 2 | |
| Average Intel Core i5-8259U (132 - 154, n=6) | |
| Geekom Mini IT8-GM08i5T | |
| Beelink SER3 | |
| Chuwi CoreBook X | |
| Cinebench R15 / CPU Multi 64Bit | |
| Average of class Desktop (2652 - 6588, n=17, last 2 years) | |
| Beelink GTR5 | |
| Beelink SER4 | |
| Intel NUC11PAQi7 | |
| Beelink GTI 11 | |
| Intel Hades Canyon NUC8i7HVK | |
| Intel NUC11TNKi5 | |
| Intel NUC10i5FNK | |
| Beelink SER3 | |
| Chuwi CoreBook X Pro | |
| Average Intel Core i5-8259U (575 - 687, n=7) | |
| GMK NucBox 2 | |
| Geekom Mini IT8-GM08i5T | |
| Chuwi CoreBook X | |
| Blender / v2.79 BMW27 CPU | |
| Chuwi CoreBook X | |
| GMK NucBox 2 | |
| Average Intel Core i5-8259U (688 - 769, n=6) | |
| Geekom Mini IT8-GM08i5T | |
| Chuwi CoreBook X Pro | |
| Beelink SER3 | |
| Intel NUC11TNKi5 | |
| Intel NUC10i5FNK | |
| Beelink GTI 11 | |
| Intel Hades Canyon NUC8i7HVK | |
| Intel NUC11PAQi7 | |
| Beelink SER4 | |
| Beelink GTR5 | |
| Average of class Desktop (75 - 218, n=14, last 2 years) | |
| 7-Zip 18.03 / 7z b 4 -mmt1 | |
| Average of class Desktop (5092 - 8392, n=15, last 2 years) | |
| Beelink GTR5 | |
| Intel NUC11PAQi7 | |
| Beelink GTI 11 | |
| Intel NUC11TNKi5 | |
| Beelink SER4 | |
| Intel NUC10i5FNK | |
| Intel Hades Canyon NUC8i7HVK | |
| Chuwi CoreBook X | |
| Chuwi CoreBook X Pro | |
| Geekom Mini IT8-GM08i5T | |
| GMK NucBox 2 | |
| Average Intel Core i5-8259U (3753 - 4022, n=6) | |
| Beelink SER3 | |
| 7-Zip 18.03 / 7z b 4 | |
| Average of class Desktop (54166 - 163125, n=15, last 2 years) | |
| Beelink GTR5 | |
| Beelink SER4 | |
| Geekom Mini IT8-GM08i5T | |
| Intel NUC11PAQi7 | |
| Beelink GTI 11 | |
| Intel NUC11TNKi5 | |
| Intel NUC10i5FNK | |
| Average Intel Core i5-8259U (17799 - 28824, n=6) | |
| Chuwi CoreBook X Pro | |
| Intel Hades Canyon NUC8i7HVK | |
| GMK NucBox 2 | |
| Chuwi CoreBook X | |
| Beelink SER3 | |
| Geekbench 5.5 / Single-Core | |
| Average of class Desktop (1755 - 2559, n=25, last 2 years) | |
| Beelink GTR5 | |
| Intel NUC11PAQi7 | |
| Beelink GTI 11 | |
| Intel NUC11TNKi5 | |
| Beelink SER4 | |
| Intel NUC10i5FNK | |
| GMK NucBox 2 | |
| Average Intel Core i5-8259U (948 - 984, n=3) | |
| Geekom Mini IT8-GM08i5T | |
| Geekbench 5.5 / Multi-Core | |
| Average of class Desktop (12626 - 26186, n=25, last 2 years) | |
| Beelink GTR5 | |
| Beelink SER4 | |
| Beelink GTI 11 | |
| Intel NUC11PAQi7 | |
| Intel NUC11TNKi5 | |
| Intel NUC10i5FNK | |
| Geekom Mini IT8-GM08i5T | |
| Average Intel Core i5-8259U (3359 - 3839, n=3) | |
| GMK NucBox 2 | |
| HWBOT x265 Benchmark v2.2 / 4k Preset | |
| Average of class Desktop (18.6 - 48.5, n=13, last 2 years) | |
| Beelink GTR5 | |
| Beelink SER4 | |
| Intel NUC11PAQi7 | |
| Intel Hades Canyon NUC8i7HVK | |
| Beelink GTI 11 | |
| Intel NUC11TNKi5 | |
| Intel NUC10i5FNK | |
| Chuwi CoreBook X Pro | |
| GMK NucBox 2 | |
| Geekom Mini IT8-GM08i5T | |
| Average Intel Core i5-8259U (4.72 - 5.49, n=6) | |
| Chuwi CoreBook X | |
| Beelink SER3 | |
| LibreOffice / 20 Documents To PDF | |
| Beelink SER3 | |
| Chuwi CoreBook X | |
| Chuwi CoreBook X Pro | |
| Geekom Mini IT8-GM08i5T | |
| Average Intel Core i5-8259U (62.7 - 76, n=5) | |
| GMK NucBox 2 | |
| Beelink SER4 | |
| Beelink GTI 11 | |
| Intel NUC11TNKi5 | |
| Beelink GTR5 | |
| Average of class Desktop (35.5 - 79.2, n=14, last 2 years) | |
| Intel NUC11PAQi7 | |
| R Benchmark 2.5 / Overall mean | |
| Geekom Mini IT8-GM08i5T | |
| GMK NucBox 2 | |
| Average Intel Core i5-8259U (0.738 - 0.818, n=5) | |
| Chuwi CoreBook X | |
| Chuwi CoreBook X Pro | |
| Beelink SER3 | |
| Intel NUC10i5FNK | |
| Beelink GTI 11 | |
| Intel NUC11TNKi5 | |
| Beelink SER4 | |
| Intel NUC11PAQi7 | |
| Beelink GTR5 | |
| Average of class Desktop (0.3307 - 0.4909, n=14, last 2 years) | |
Cinebench R15: CPU Single 64Bit | CPU Multi 64Bit
Blender: v2.79 BMW27 CPU
7-Zip 18.03: 7z b 4 -mmt1 | 7z b 4
Geekbench 5.5: Single-Core | Multi-Core
HWBOT x265 Benchmark v2.2: 4k Preset
LibreOffice : 20 Documents To PDF
R Benchmark 2.5: Overall mean
* ... smaller is better
System Performance
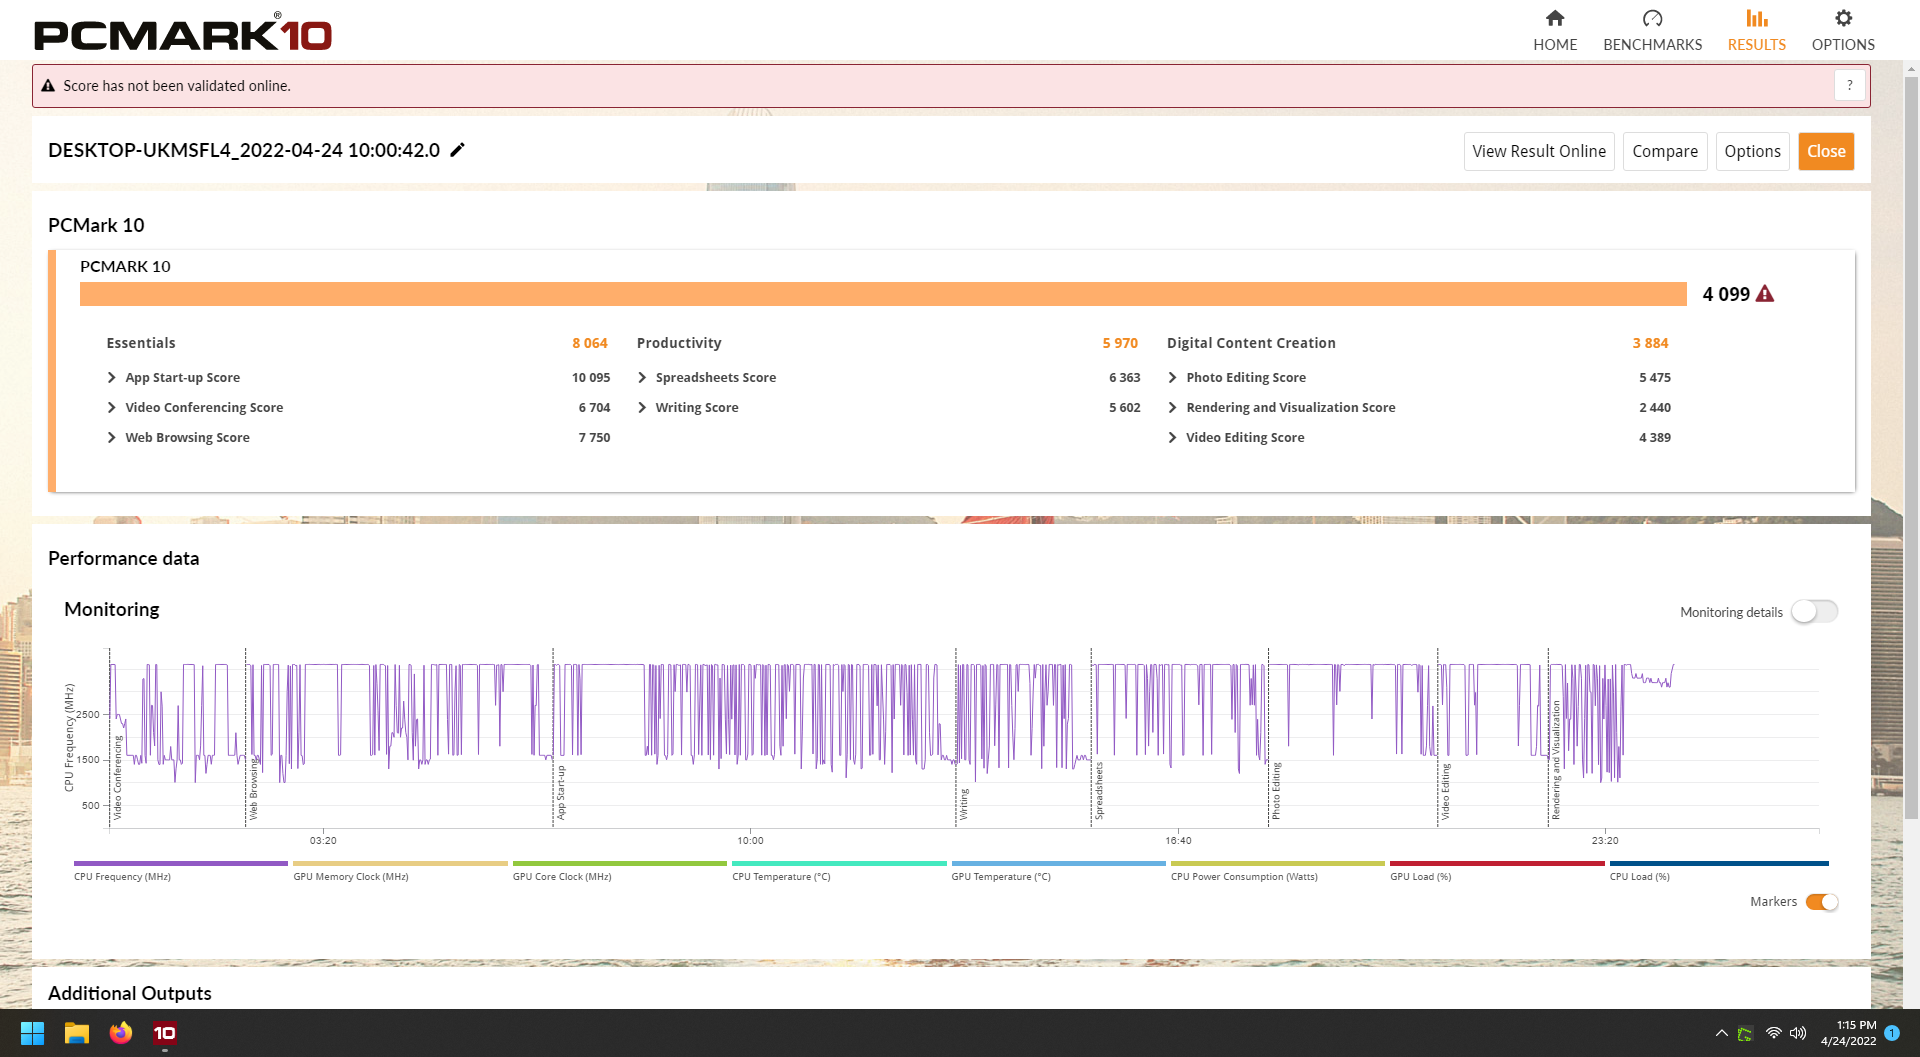
General system performance is adequate for most tasks. While it falls behind devices with newer chipsets, the Geekom Mini IT8 offers enough power for busy web browsing and involved office tasks. However, running multiple CPU-intensive tasks (such as running formulas in several large spreadsheets concurrently) may cause some slowdowns. The Geekom desktop noticeably lags in digital content creation, likely due to its weaker Intel Iris Plus Graphics 655 iGPU.
| PCMark 10 / Score | |
| Average of class Desktop (6558 - 10843, n=26, last 2 years) | |
| Intel Hades Canyon NUC8i7HVK | |
| Beelink SER4 | |
| Beelink GTI 11 | |
| Intel NUC11TNKi5 | |
| GMK NucBox 2 | |
| Geekom Mini IT8-GM08i5T | |
| Average Intel Core i5-8259U, Intel Iris Plus Graphics 655 (3284 - 4132, n=6) | |
| PCMark 10 / Essentials | |
| Average of class Desktop (9463 - 12947, n=26, last 2 years) | |
| Beelink GTI 11 | |
| Beelink SER4 | |
| Intel Hades Canyon NUC8i7HVK | |
| Intel NUC11TNKi5 | |
| GMK NucBox 2 | |
| Geekom Mini IT8-GM08i5T | |
| Average Intel Core i5-8259U, Intel Iris Plus Graphics 655 (7364 - 8351, n=6) | |
| PCMark 10 / Productivity | |
| Average of class Desktop (9088 - 12944, n=26, last 2 years) | |
| Beelink SER4 | |
| Intel Hades Canyon NUC8i7HVK | |
| Beelink GTI 11 | |
| GMK NucBox 2 | |
| Intel NUC11TNKi5 | |
| Geekom Mini IT8-GM08i5T | |
| Average Intel Core i5-8259U, Intel Iris Plus Graphics 655 (4390 - 6400, n=6) | |
| PCMark 10 / Digital Content Creation | |
| Average of class Desktop (6269 - 22653, n=26, last 2 years) | |
| Intel Hades Canyon NUC8i7HVK | |
| Beelink SER4 | |
| Beelink GTI 11 | |
| Intel NUC11TNKi5 | |
| Geekom Mini IT8-GM08i5T | |
| GMK NucBox 2 | |
| Average Intel Core i5-8259U, Intel Iris Plus Graphics 655 (2679 - 3902, n=6) | |
| PCMark 10 Score | 4099 points | |
Help | ||
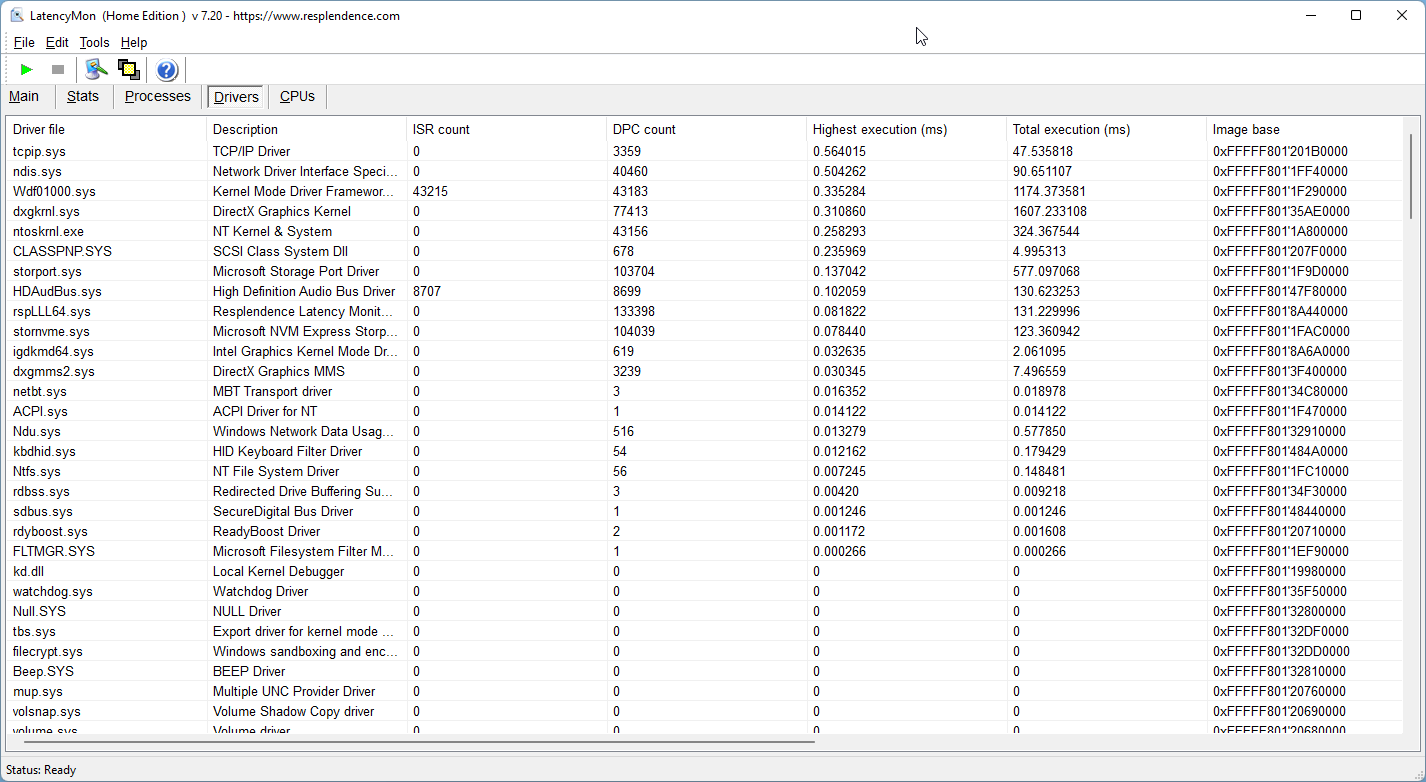
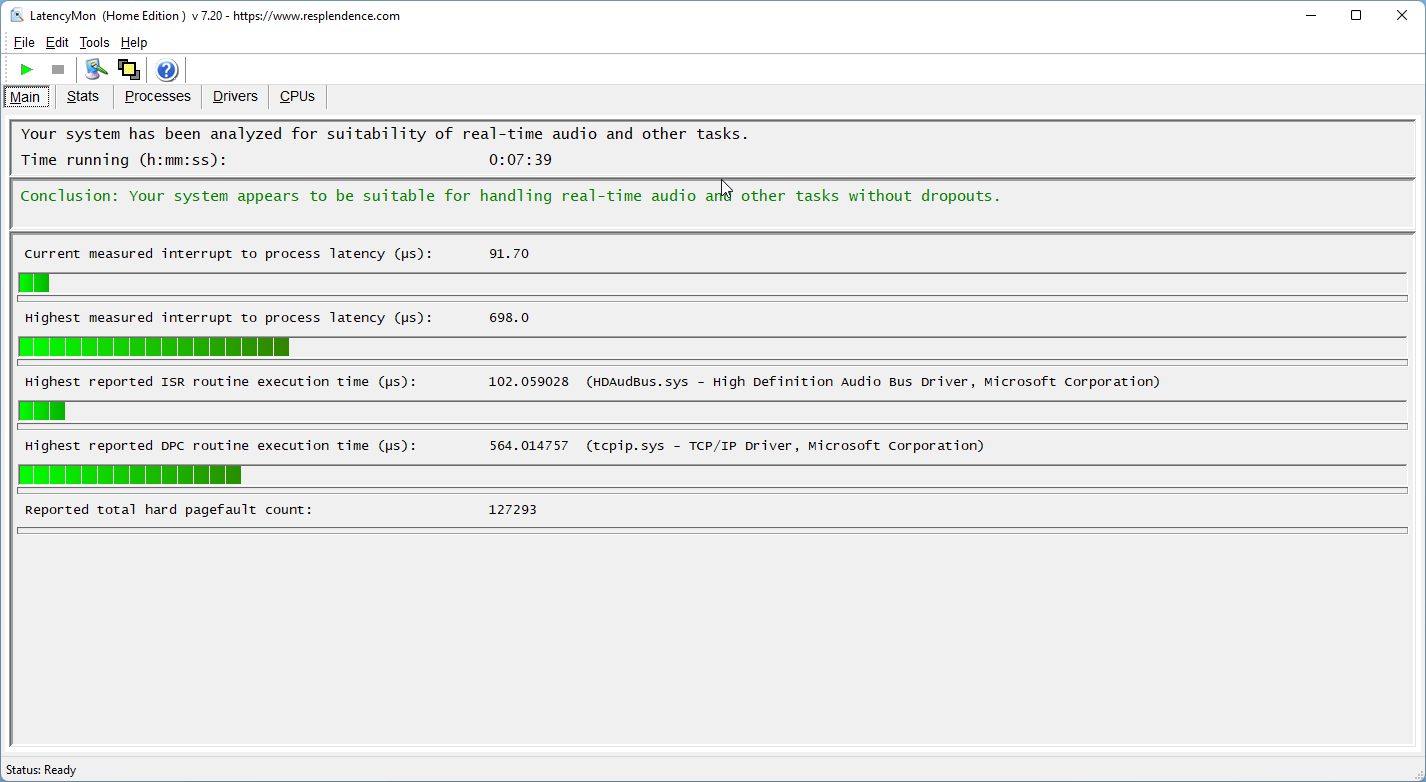
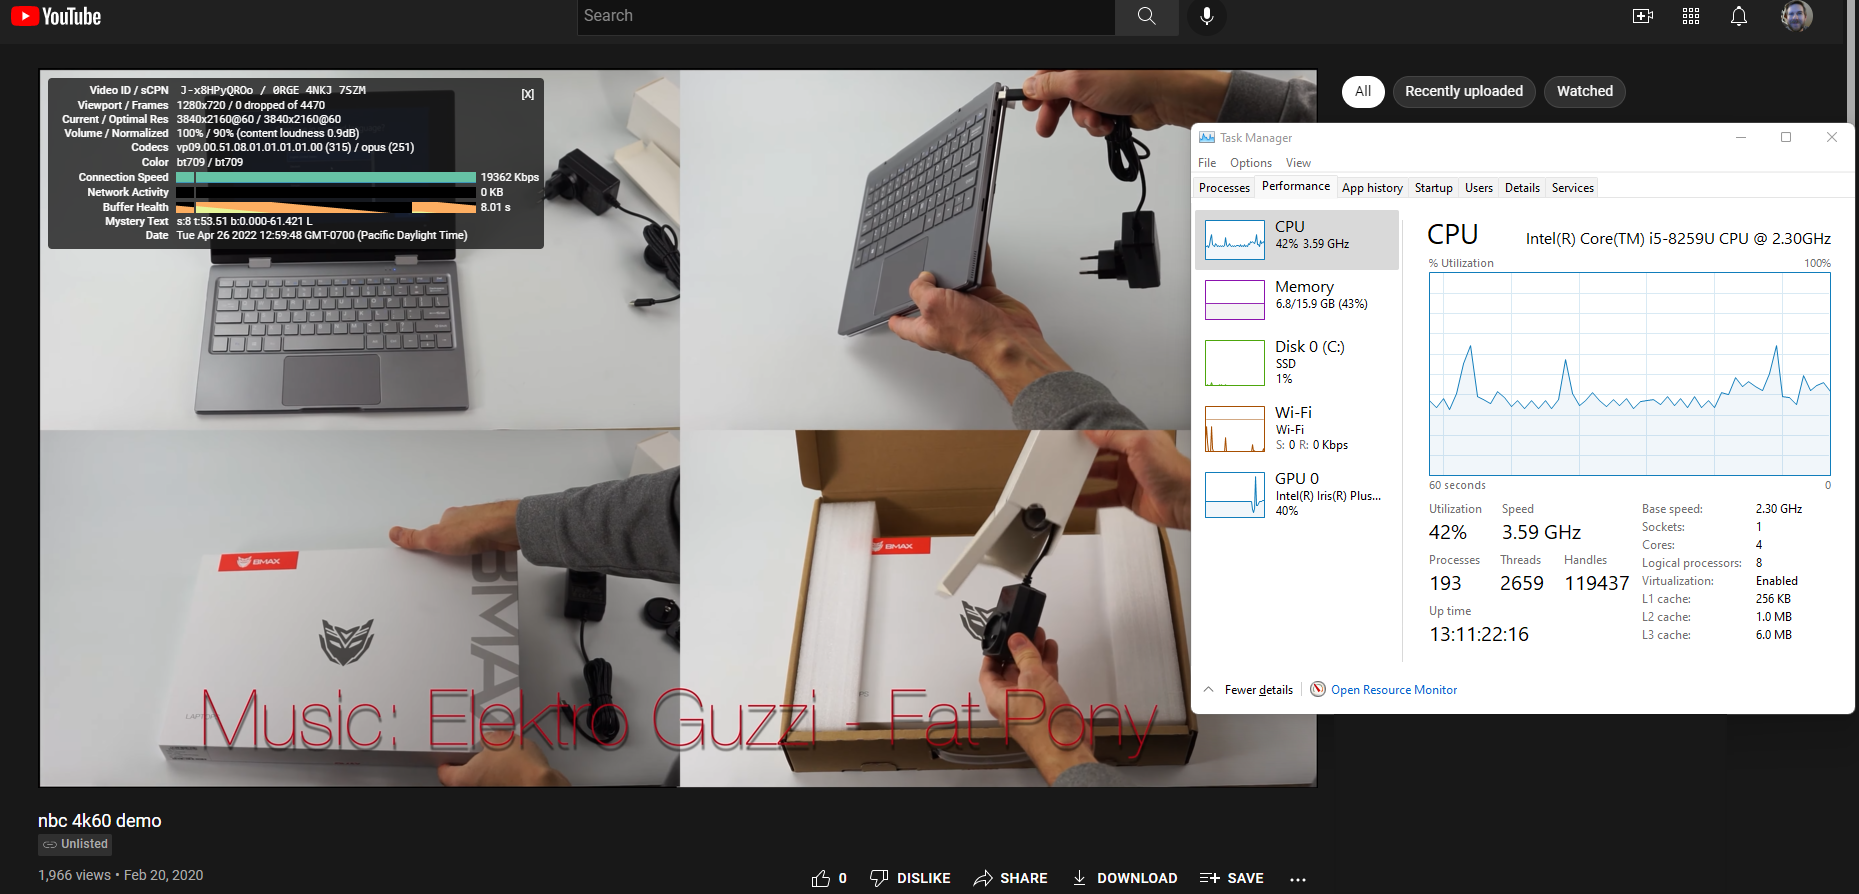
DPC Latency
The Geekom Mini IT8 appears suitable for rendering real-time audio. Per LatencyMon, there are no noticeable issues with DPC latency. Streaming 4K videos at 60 FPS is perfectly smooth with no dropped frames, as seen in our minute-long YouTube test.
| DPC Latencies / LatencyMon - interrupt to process latency (max), Web, Youtube, Prime95 | |
| Chuwi CoreBook X Pro | |
| Chuwi CoreBook X | |
| GMK NucBox 2 | |
| Geekom Mini IT8-GM08i5T | |
| Intel NUC11TNKi5 | |
| Beelink SER4 | |
| Beelink GTI 11 | |
* ... smaller is better
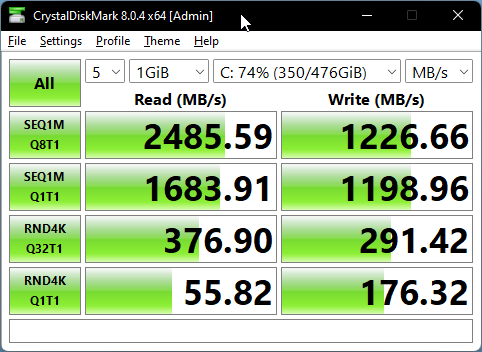
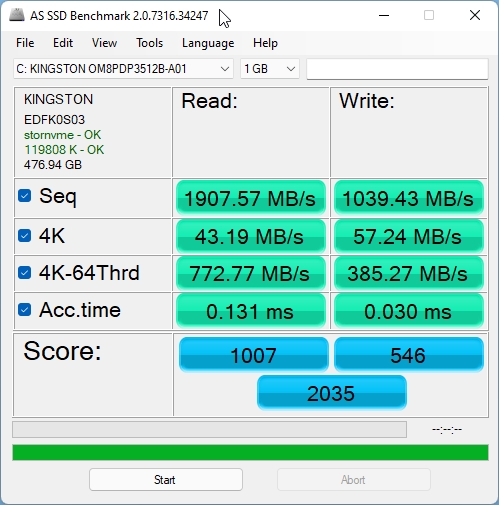
Storage Devices
The Geekom Mini IT8 ships with a 512 GB Kingston PCIe Gen 3 SSD. This drive is zippy and offers good read and write speeds. It also offers consistency in access times, as measured by our DiskSpd Read loop test. Since the drive is readily replaceable, users can easily swap out this SSD for one they prefer, although the device only supports up to PCIe Gen 3. The Geekom Mini IT8 has an empty bay for a 2.5-inch SATA III drive.
| Geekom Mini IT8-GM08i5T Kingston OM8PDP3512B-AI1 | Beelink SER4 Intel SSD 660p SSDPEKNW512G8 | Beelink GTI 11 Kingston SA2000M8500G | GMK NucBox 2 Netac S930E8/256GPN | Intel NUC11TNKi5 Transcend M.2 SSD 430S TS512GMTS430S | Intel Hades Canyon NUC8i7HVK Intel Optane 120 GB SSDPEK1W120GA | Average Kingston OM8PDP3512B-AI1 | Average of class Desktop | |
|---|---|---|---|---|---|---|---|---|
| CrystalDiskMark 5.2 / 6 | 32% | 81% | 39% | -34% | 35% | 30% | 303% | |
| Write 4K | 114.2 | 183.3 61% | 231.2 102% | 178.4 56% | 65.9 -42% | 133.7 17% | 176.8 ? 55% | 311 ? 172% |
| Read 4K | 46.92 | 62.2 33% | 66.1 41% | 61 30% | 24.27 -48% | 178.6 281% | 47.9 ? 2% | 182.7 ? 289% |
| Write Seq | 928.6 | 976 5% | 1942 109% | 1040 12% | 456.4 -51% | 608 -35% | 942 ? 1% | 5828 ? 528% |
| Read Seq | 838.3 | 1629 94% | 1739 107% | 1919 129% | 542 -35% | 1428 70% | 1424 ? 70% | 4333 ? 417% |
| Write 4K Q32T1 | 220.3 | 443.1 101% | 495.3 125% | 417.7 90% | 331.3 50% | 323.6 47% | 369 ? 67% | 689 ? 213% |
| Read 4K Q32T1 | 316.2 | 339 7% | 648 105% | 325.6 3% | 295 -7% | 282.3 -11% | 508 ? 61% | 880 ? 178% |
| Write Seq Q32T1 | 1227.2 | 979 -20% | 2055 67% | 1144 -7% | 506 -59% | 627 -49% | 1022 ? -17% | 6586 ? 437% |
| Read Seq Q32T1 | 2510.5 | 1837 -27% | 2235 -11% | 2379 -5% | 562 -78% | 1521 -39% | 2460 ? -2% | 7191 ? 186% |
| AS SSD | 11% | 68% | -65% | -92% | 46% | -13% | 363% | |
| Seq Read | 1907.57 | 1653 -13% | 2006 5% | 2069 8% | 527 -72% | 1379 -28% | 1910 ? 0% | 6423 ? 237% |
| Seq Write | 1039.43 | 869 -16% | 1904 83% | 1203 16% | 469 -55% | 553 -47% | 759 ? -27% | 5925 ? 470% |
| 4K Read | 43.19 | 56.4 31% | 60.9 41% | 41.66 -4% | 20.41 -53% | 127.9 196% | 38.8 ? -10% | 91.6 ? 112% |
| 4K Write | 57.24 | 163.7 186% | 203.7 256% | 136.9 139% | 42.52 -26% | 103.5 81% | 98.4 ? 72% | 230 ? 302% |
| 4K-64 Read | 772.77 | 321.8 -58% | 740 -4% | 366.3 -53% | 231.4 -70% | 1258 63% | 574 ? -26% | 3149 ? 307% |
| 4K-64 Write | 385.27 | 778 102% | 1092 183% | 340.5 -12% | 285.3 -26% | 556 44% | 580 ? 51% | 3721 ? 866% |
| Access Time Read * | 0.131 | 0.085 35% | 0.047 64% | 0.064 51% | 0.124 5% | 0.025 81% | 0.0965 ? 26% | 0.03813 ? 71% |
| Access Time Write * | 0.03 | 0.137 -357% | 0.083 -177% | 0.347 -1057% | 0.269 -797% | 0.033 -10% | 0.1128 ? -276% | 0.02188 ? 27% |
| Score Read | 1007 | 544 -46% | 1001 -1% | 615 -39% | 304 -70% | 1524 51% | 804 ? -20% | 3883 ? 286% |
| Score Write | 546 | 1028 88% | 1486 172% | 598 10% | 375 -31% | 714 31% | 754 ? 38% | 4544 ? 732% |
| Score Total | 2035 | 1833 -10% | 3013 48% | 1497 -26% | 839 -59% | 3023 49% | 1922 ? -6% | 10389 ? 411% |
| Copy ISO MB/s | 1018.16 | 2017 98% | 1714 68% | 1186 16% | 490.9 -52% | 1125 10% | 977 ? -4% | 4058 ? 299% |
| Copy Program MB/s | 378.31 | 274.7 -27% | 357 -6% | 428.6 13% | 415.9 10% | 342.4 -9% | 341 ? -10% | 1193 ? 215% |
| Copy Game MB/s | 322.02 | 756 135% | 1040 223% | 435.7 35% | 352.3 9% | 768 138% | 340 ? 6% | 2746 ? 753% |
| Total Average (Program / Settings) | 22% /
18% | 75% /
73% | -13% /
-27% | -63% /
-71% | 41% /
42% | 9% /
2% | 333% /
341% |
* ... smaller is better

Disk Throttling: DiskSpd Read Loop, Queue Depth 8
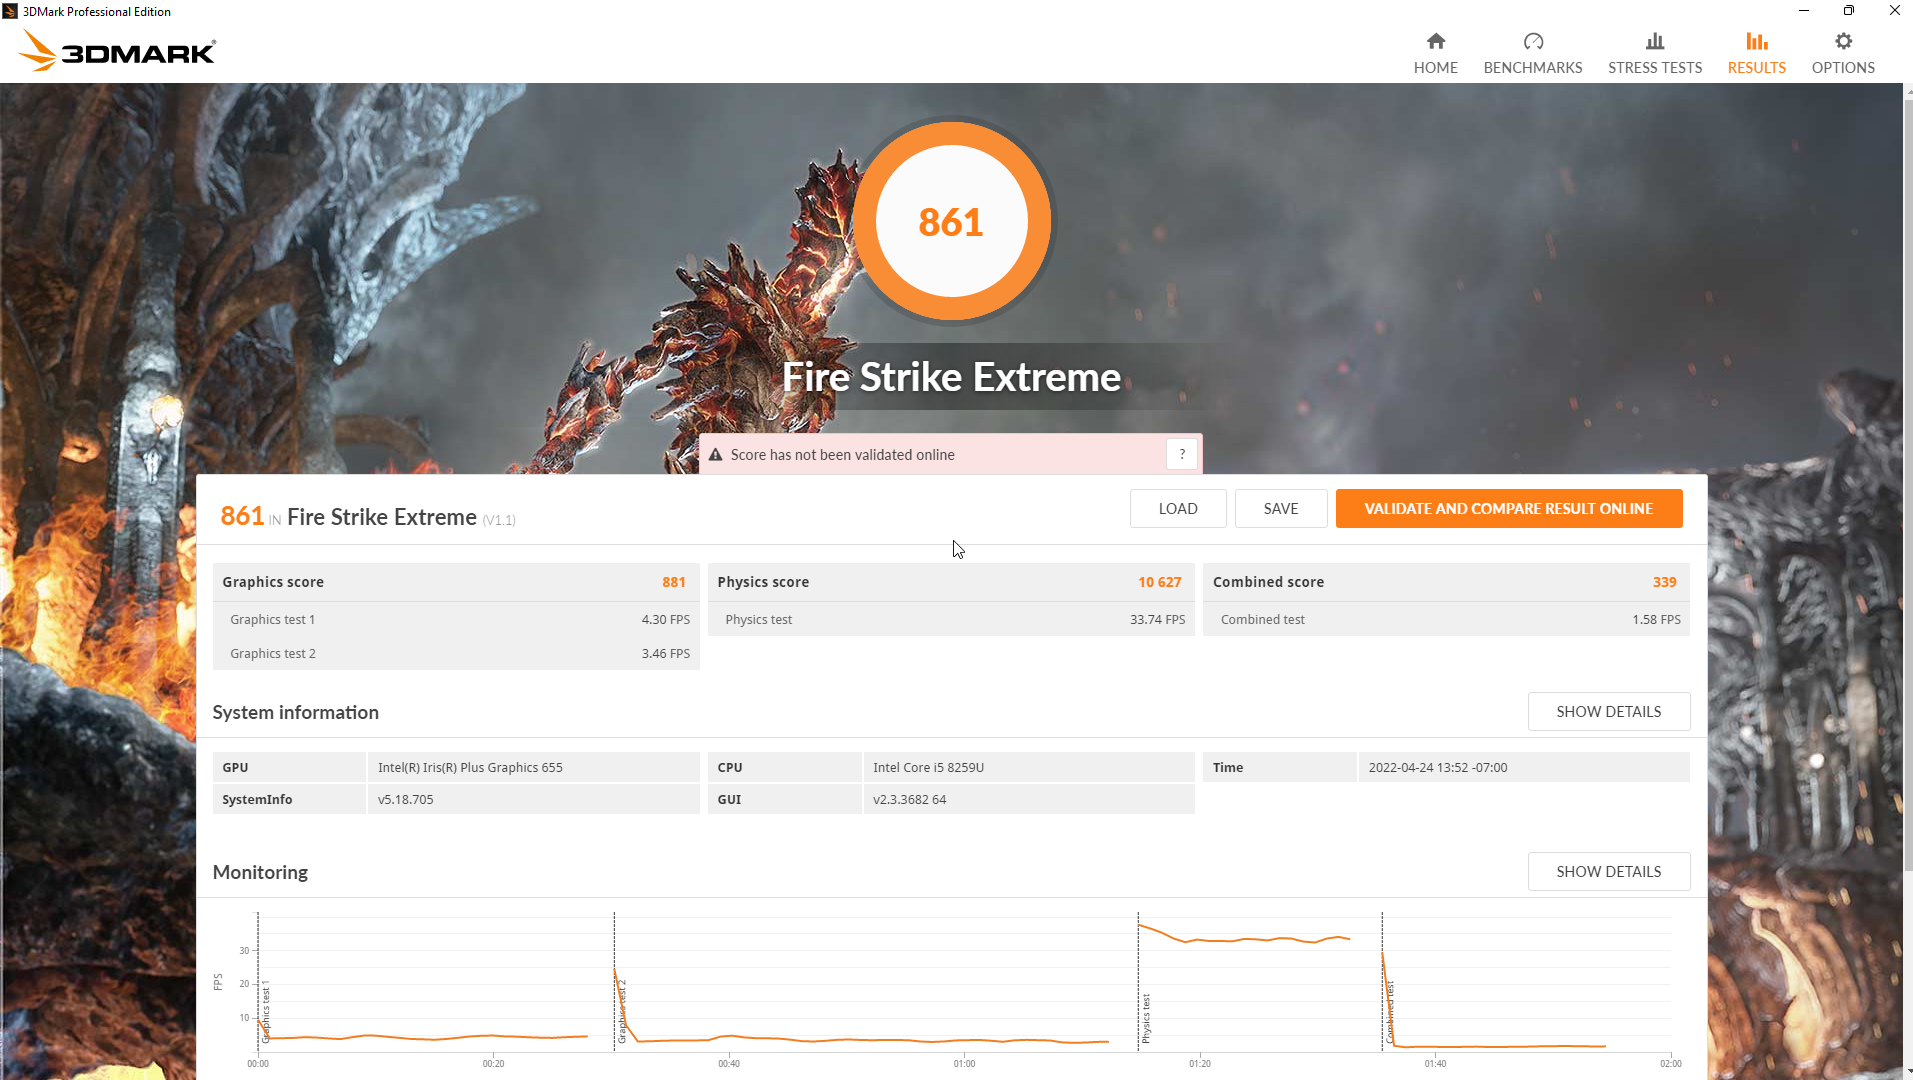
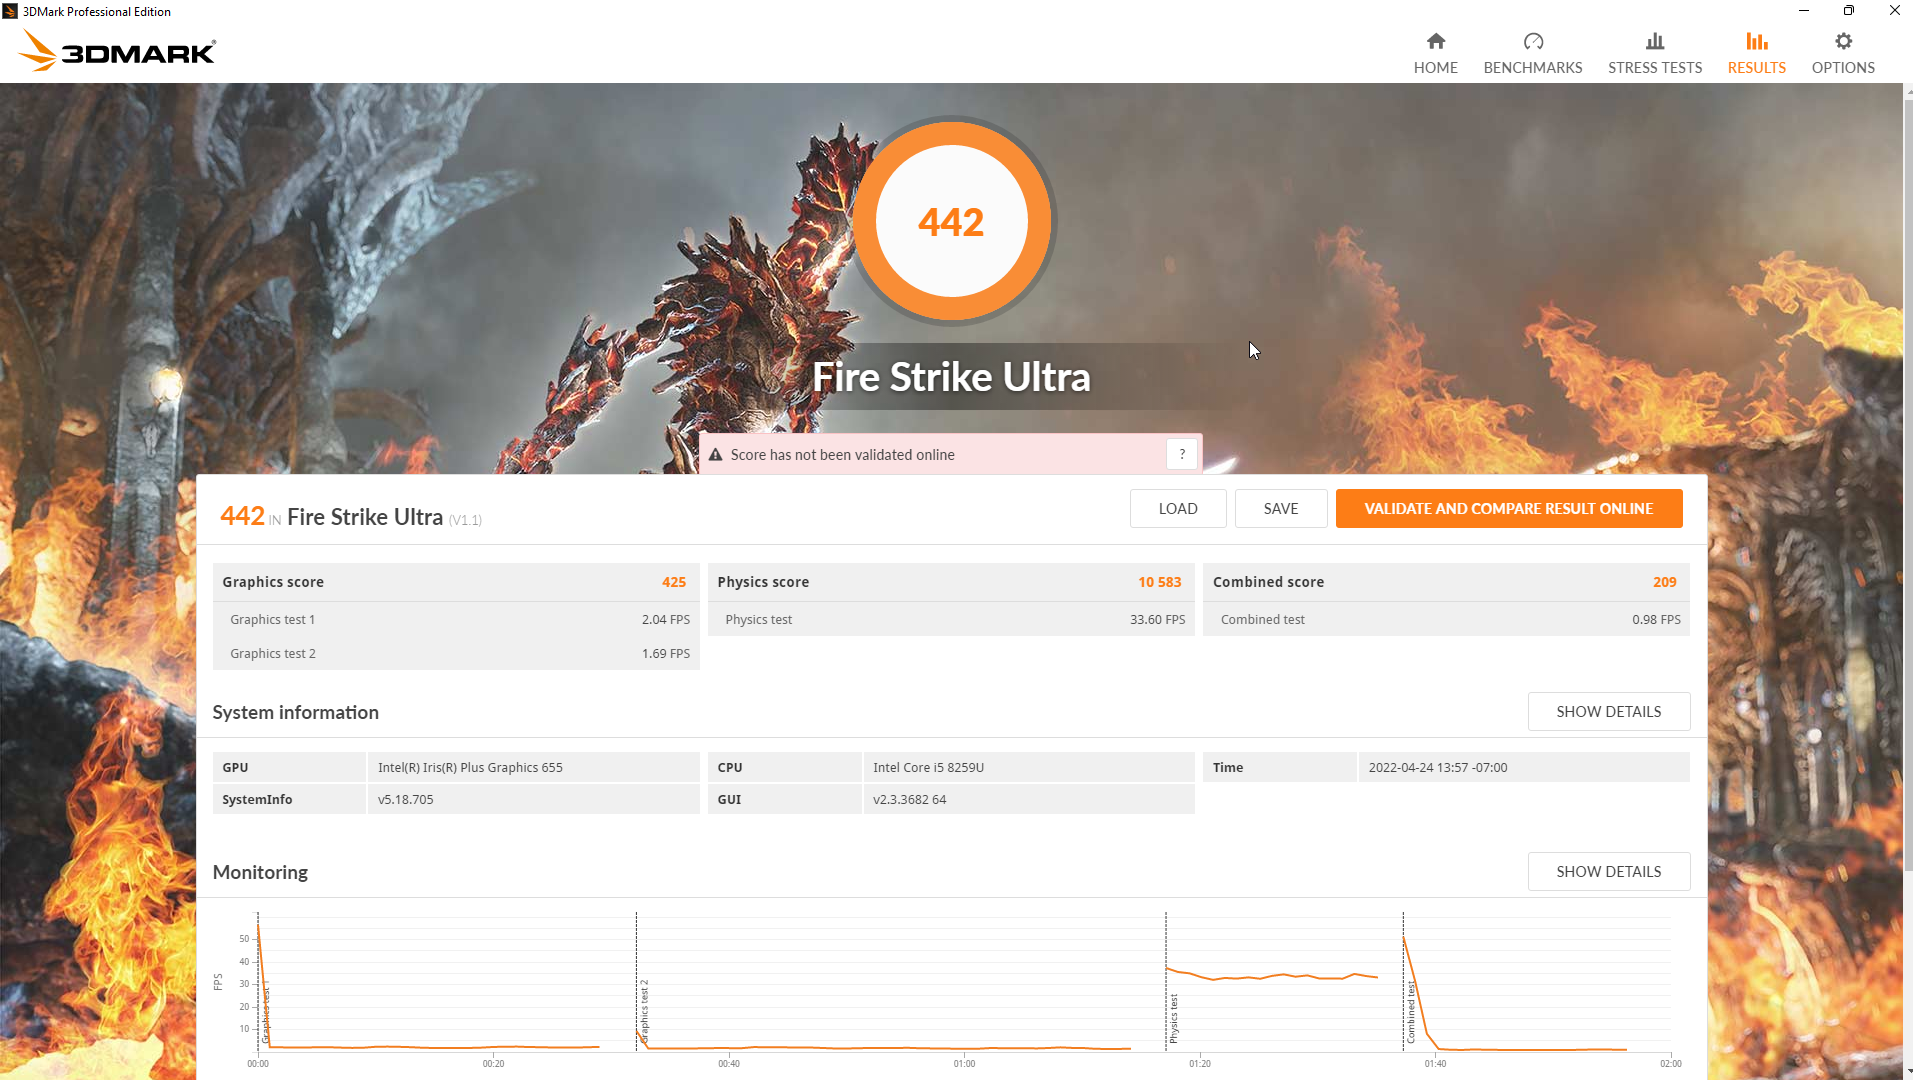
GPU Performance
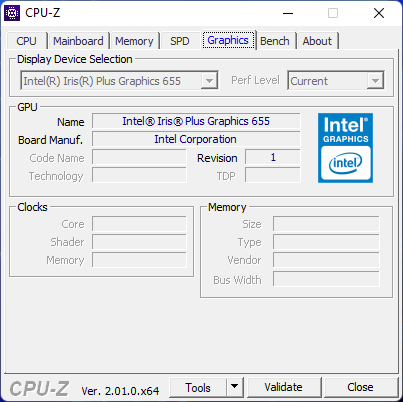
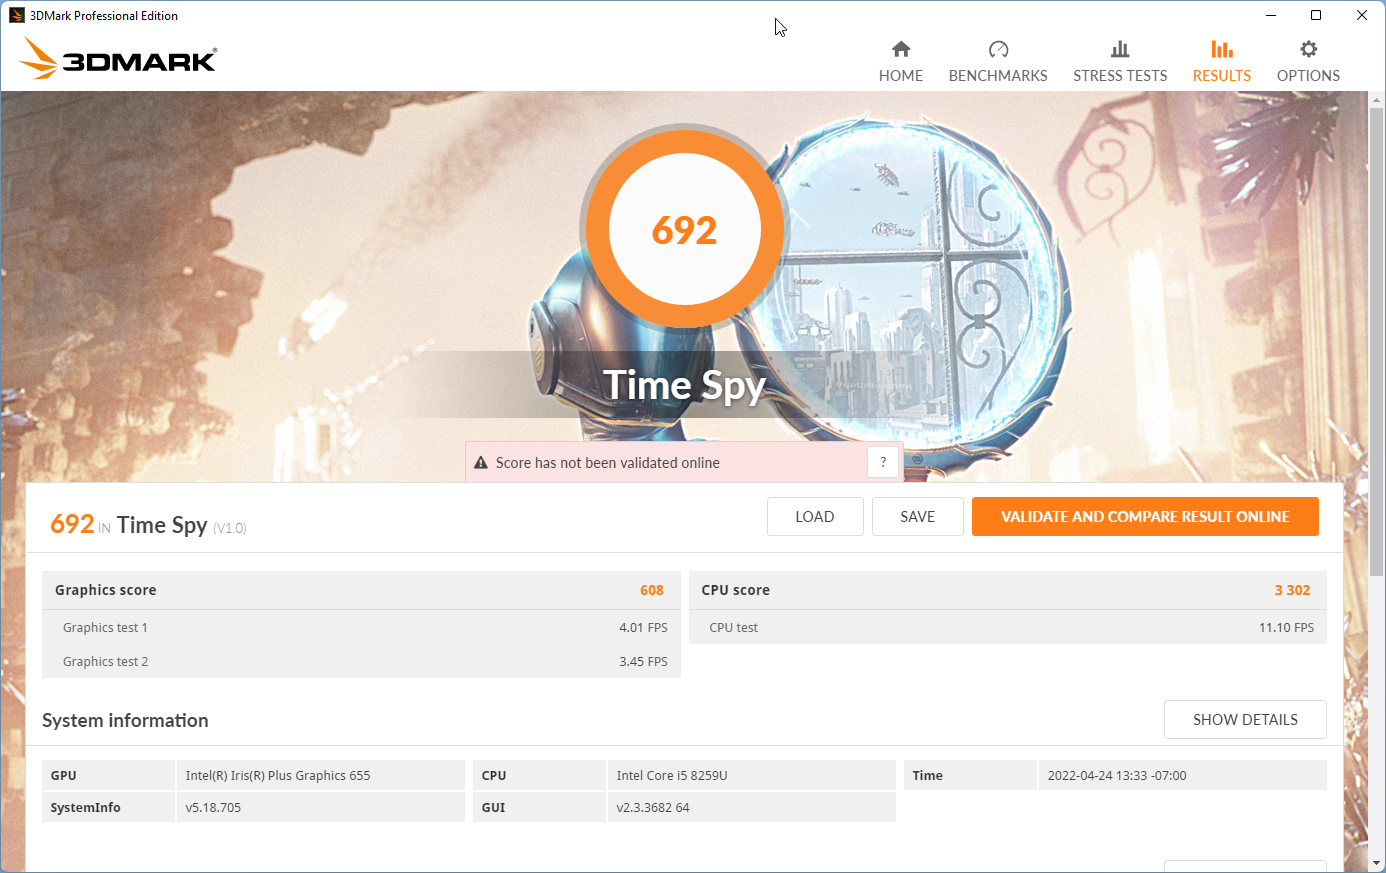
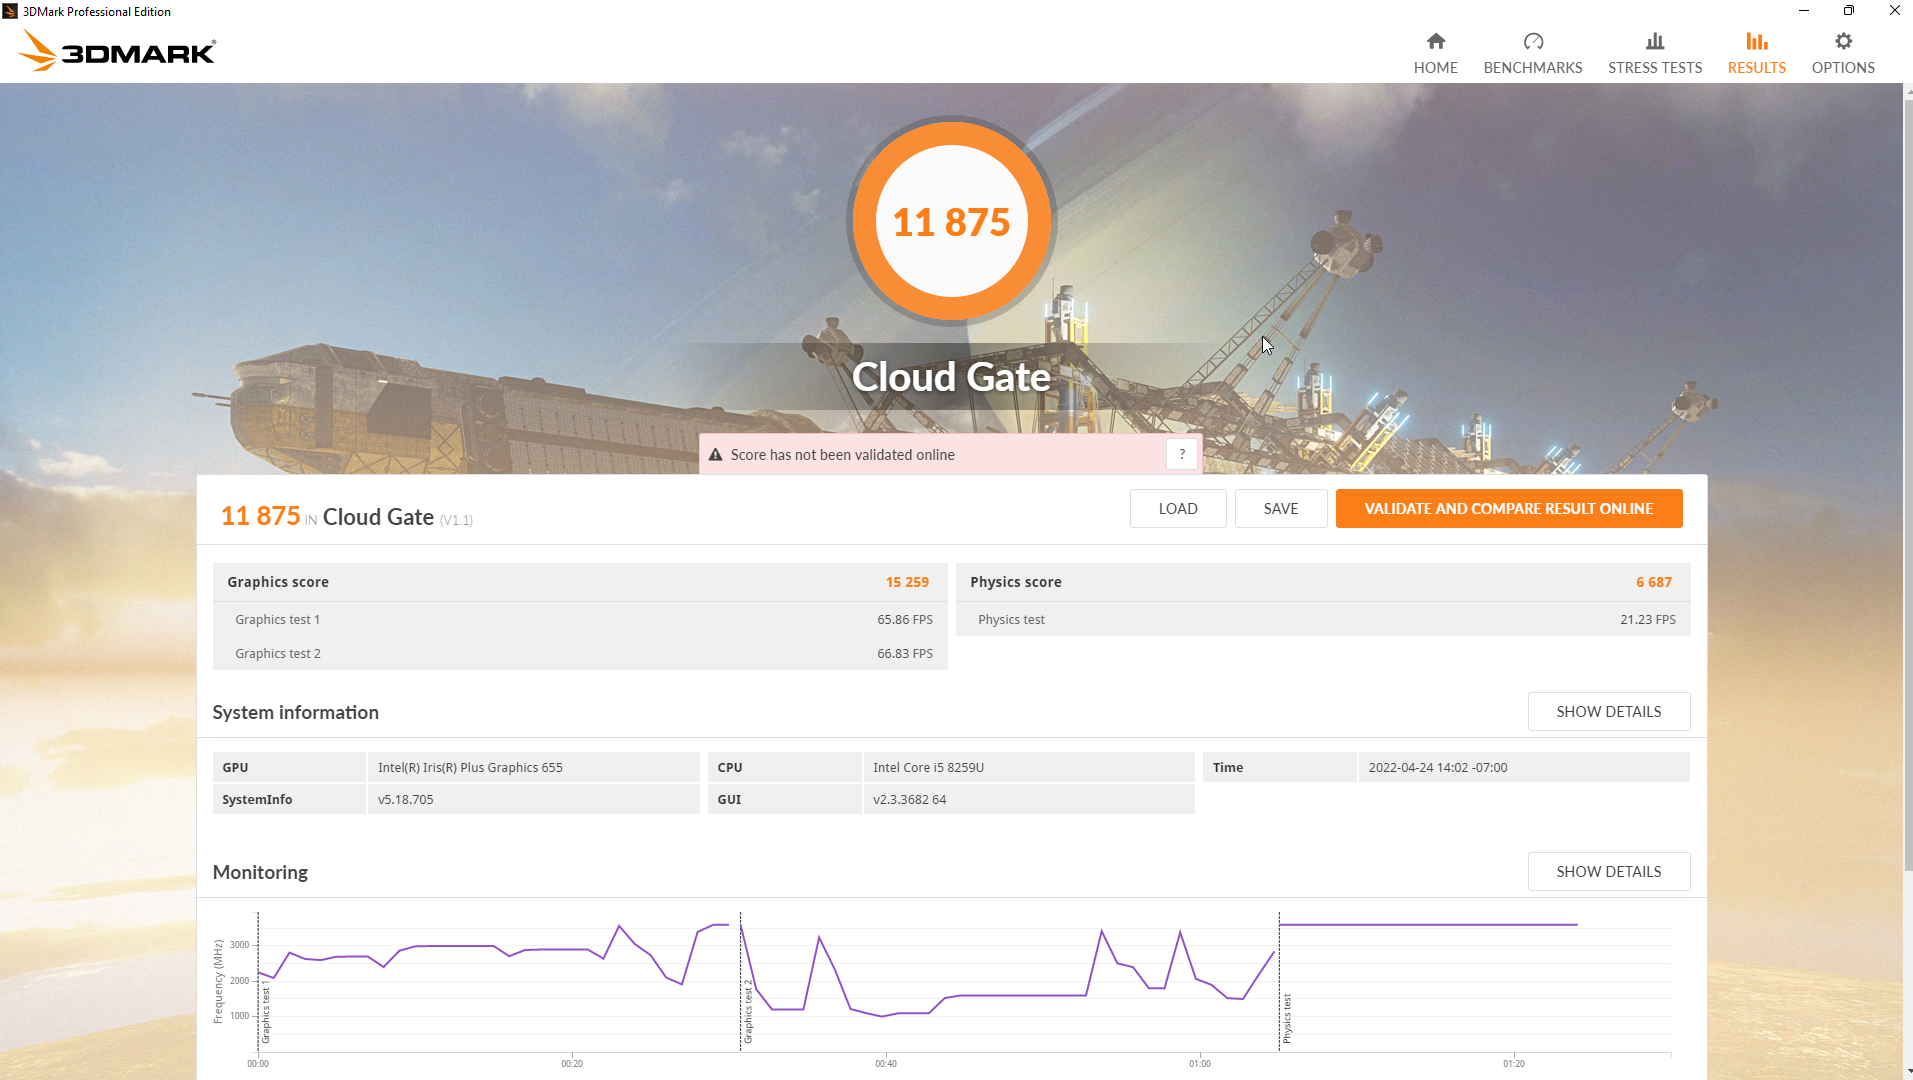
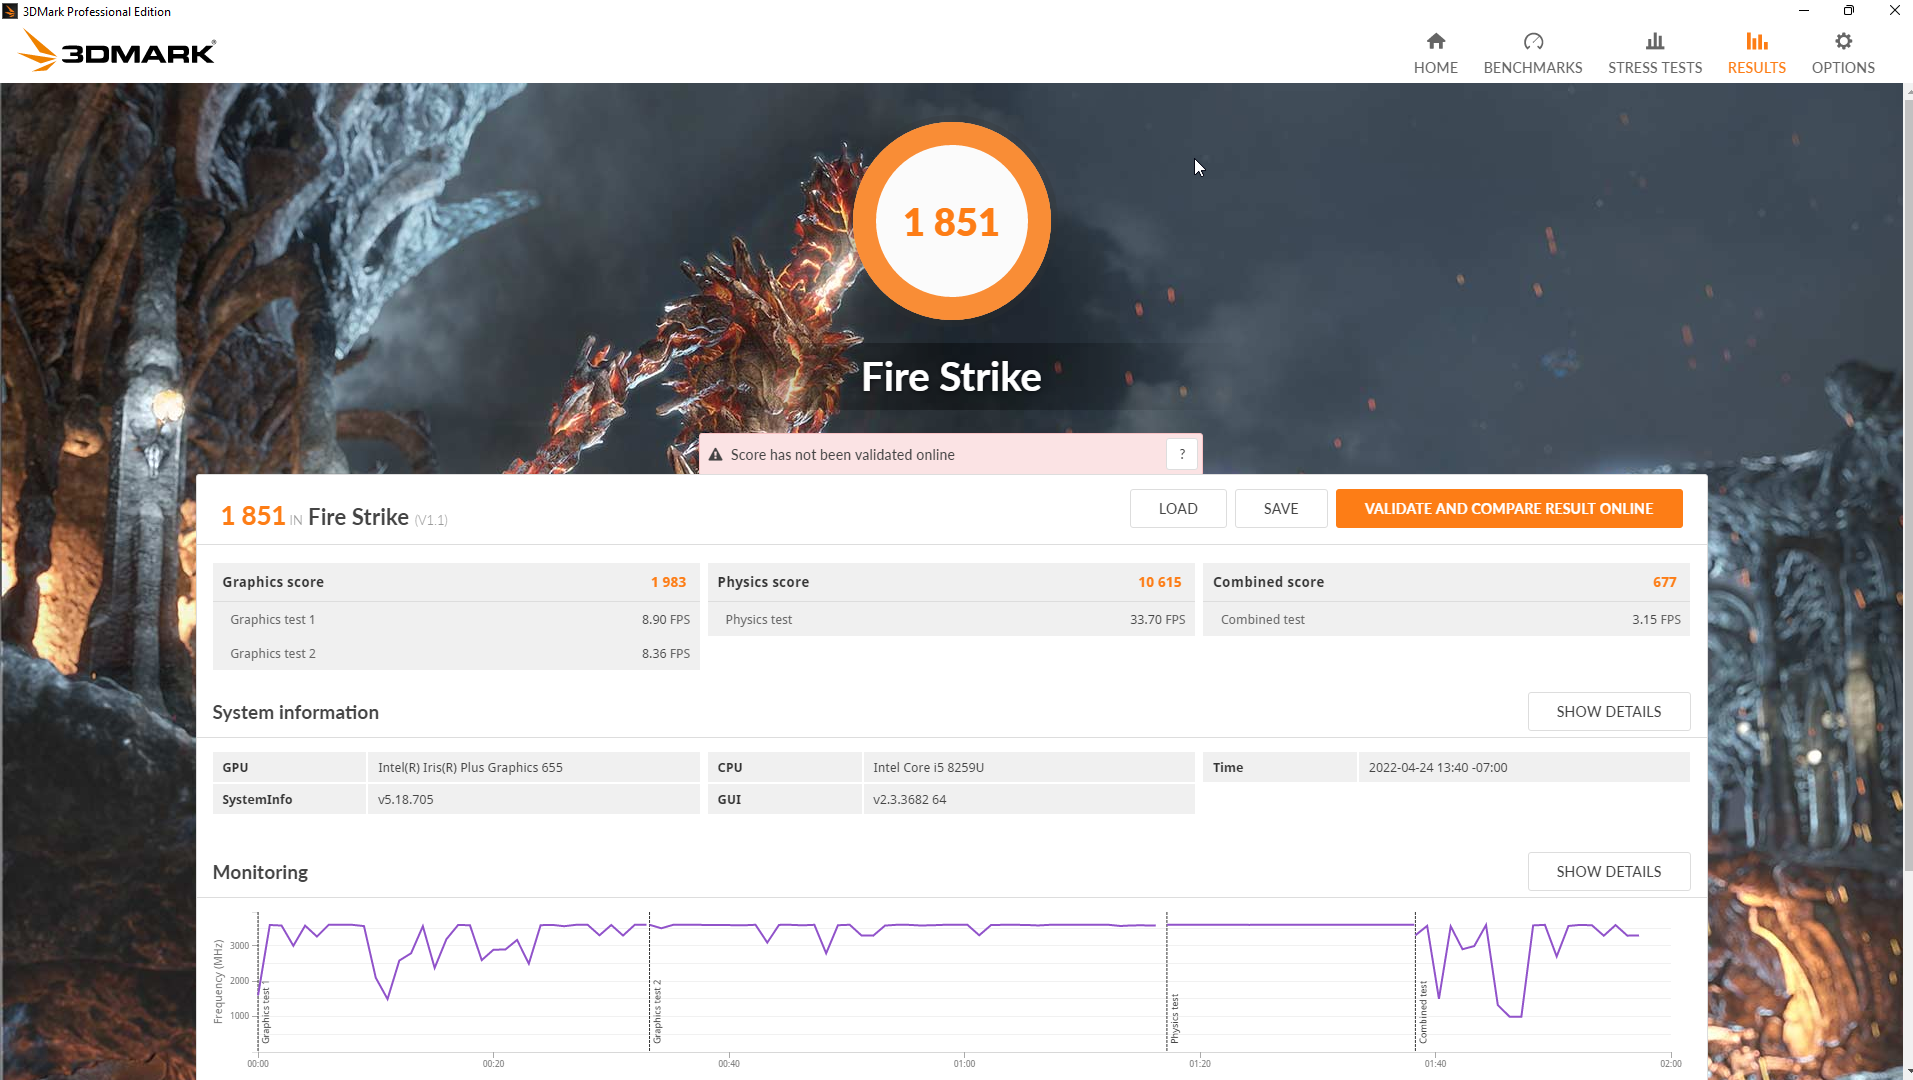
The integrated Intel Iris Plus Graphics 655 GPU offers a modest step up from most integrated graphics solutions, but its age is apparent when compared to Intel's newer Iris Xe iGPUs. It also trails AMD's Radeon RX Vega iGPUs, offering roughly half the performance in most benchmarks. While the Geekom Mini IT8 can handle streaming and multi-monitor support, users that have higher graphical demands (such as photo/video editing or 3D modeling) should look elsewhere.
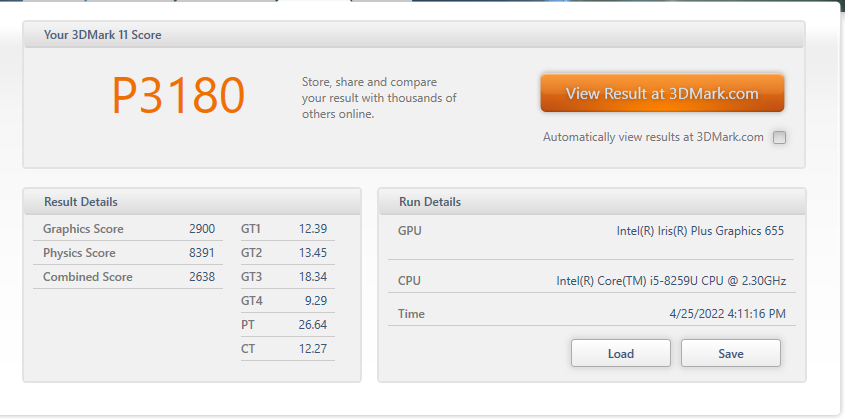
| 3DMark 11 Performance | 3180 points | |
| 3DMark Ice Storm Standard Score | 91026 points | |
| 3DMark Cloud Gate Standard Score | 11875 points | |
| 3DMark Fire Strike Score | 1851 points | |
| 3DMark Fire Strike Extreme Score | 861 points | |
| 3DMark Time Spy Score | 692 points | |
Help | ||
Gaming Performance
The Intel Iris Plus Graphics 655 is best suited for casual games. Lighter titles like Rocket League are playable at 60 FPS at FHD (1920x1080) and Low/Medium settings. Turning the graphics slider up drops framerates, but the Mini IT8 still manages above 30 FPS in most competitive titles.
Unfortunately, most modern AAA games are not playable, even at the lowest settings. The iGPU simply doesn't have the power to push those pixels. We also noticed some bizarre graphical glitches in some games (like Shadow of the Tomb Raider), and some games (like DOOM Eternal) failed to start without serious tinkering. We chalked this up to lackluster driver support, which has been known to plague Intel's integrated GPUs for years.
| Rocket League | |
| 1280x720 Performance | |
| Average Intel Iris Plus Graphics 655 (78 - 133.3, n=3) | |
| Geekom Mini IT8-GM08i5T | |
| 1920x1080 Performance | |
| Average Intel Iris Plus Graphics 655 (60 - 92, n=2) | |
| Geekom Mini IT8-GM08i5T | |
| 1920x1080 Quality AA:Medium FX | |
| Average Intel Iris Plus Graphics 655 (40.6 - 59.1, n=3) | |
| Geekom Mini IT8-GM08i5T | |
| 1920x1080 High Quality AA:High FX | |
| Intel Hades Canyon NUC8i7HVK | |
| Geekom Mini IT8-GM08i5T | |
| Average Intel Iris Plus Graphics 655 (32.7 - 38.8, n=3) | |
| low | med. | high | ultra | |
|---|---|---|---|---|
| Rocket League (2017) | 78 | 46 | 36 | |
| Final Fantasy XV Benchmark (2018) | 17 | |||
| Shadow of the Tomb Raider (2018) | 19 | 13 | 8 |
Emissions
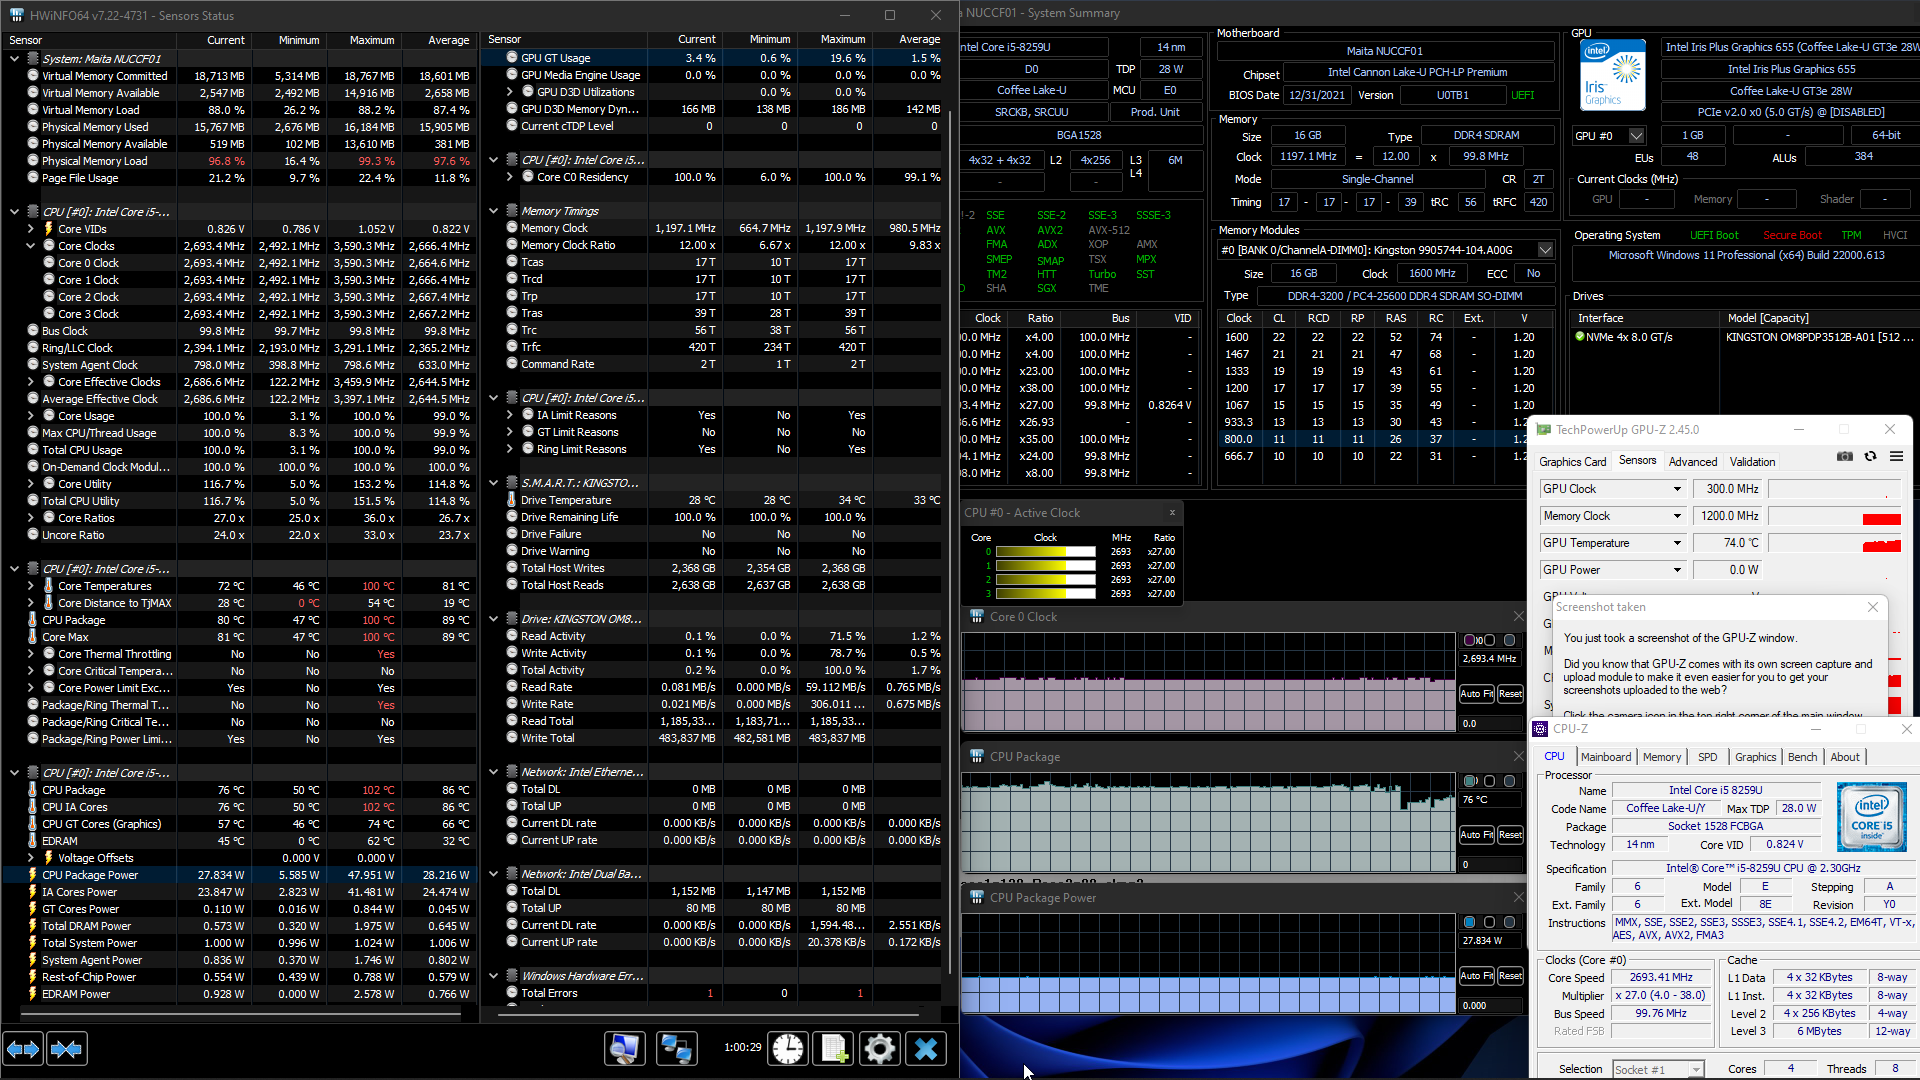
Stress test and temperatures
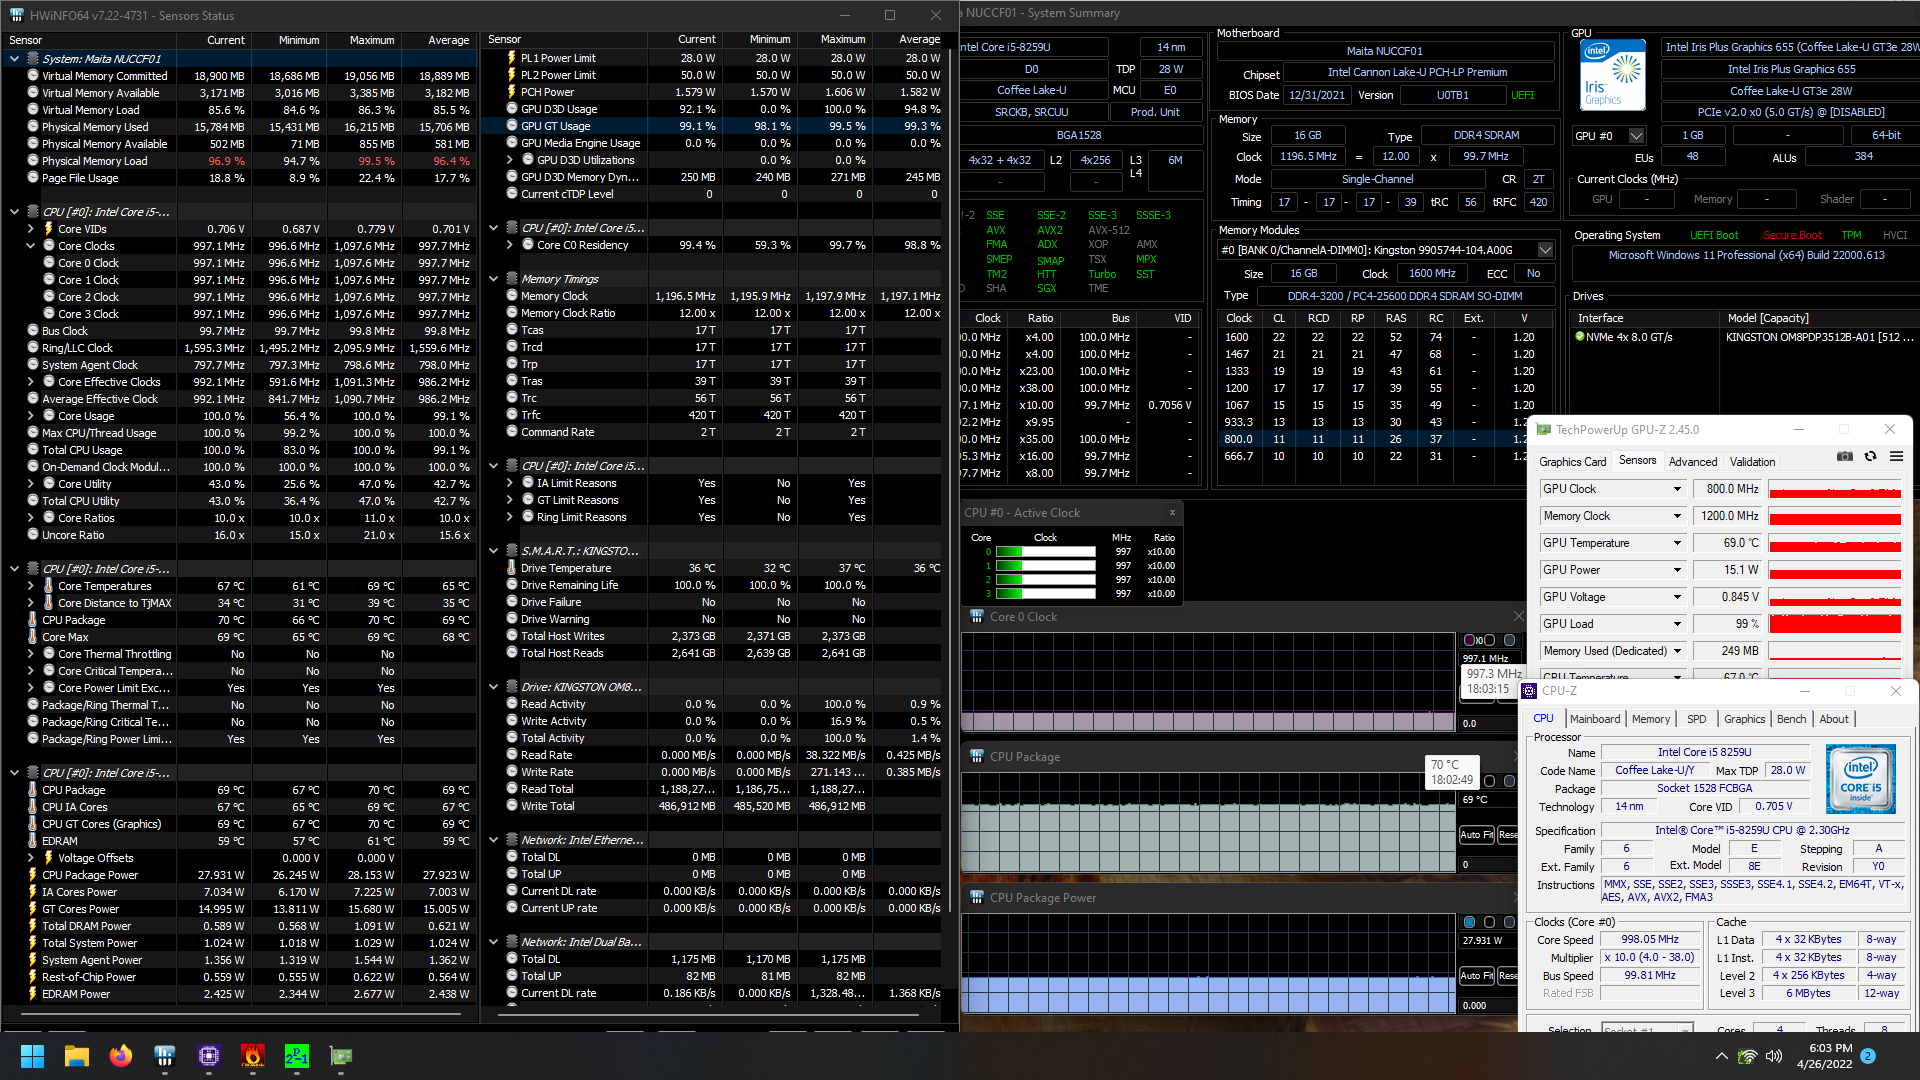
Under stress, the Geekom Mini IT8 experiences some throttling due to high temperatures on the CPU die. Running Prime95 for an hour sees the CPU briefly boost up to 3.6 GHz before settling back down to a fairly stable 2.7 GHz. However, temperatures on the CPU fluctuate around 85º C after a short spike up to 102º C. After an hour of running Furmark, the iGPU manages a steady 900 MHz while staying rock solid at 70º C.
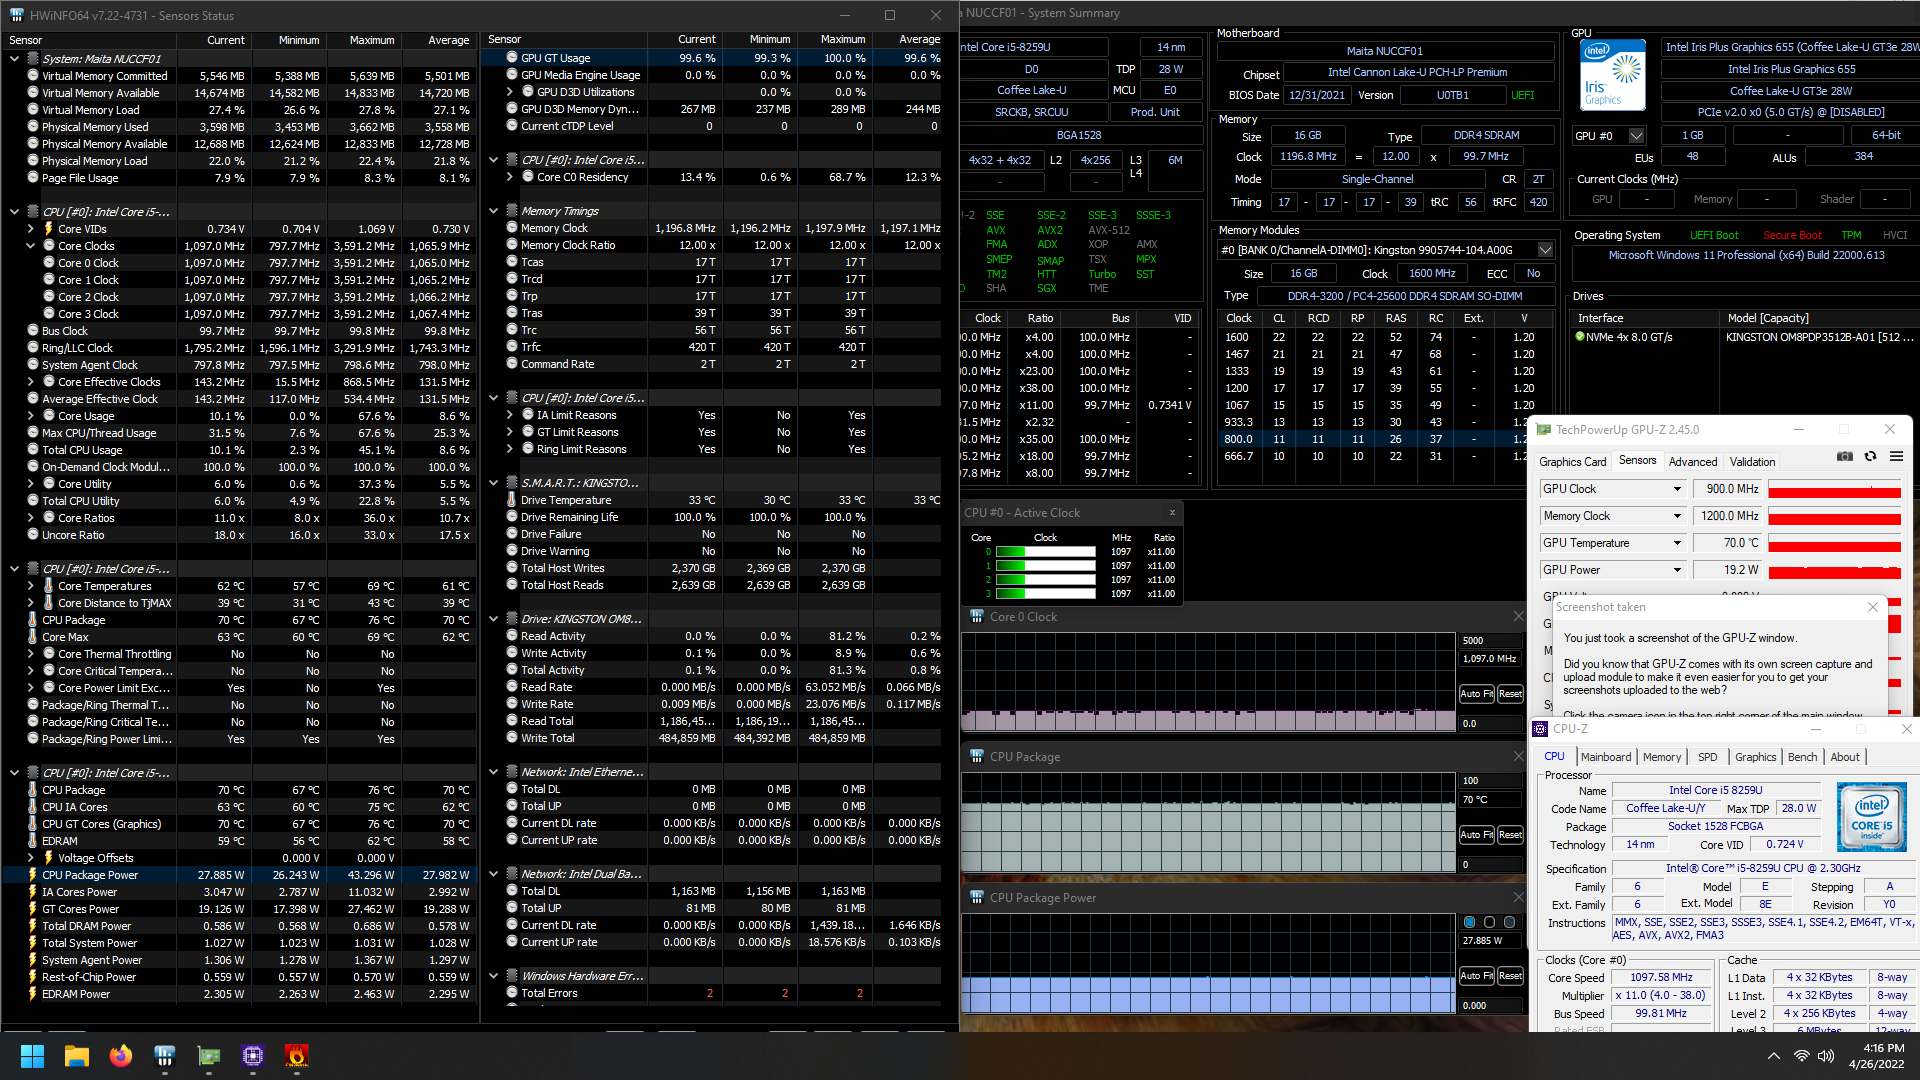
Running Prime 95 and Furmark concurrently slows the CPU to a crawl, causing it to throttle back to 1.0-1.1 GHz. The iGPU also pulls back slightly to 800 MHz. However, temperatures across the CPU package remain reasonable at 69º C. The CPU hits its rated TDP of 28 Watts during all three tests (although there are some short spikes to 48 and 43 Watts at the start of the Prime95 and Furmark, respectively).
During our stress tests, the case grew warm to the touch but never felt hot. This is likely due to the vented sides and vents on the back providing plenty of airflow through the chassis. So long as these remain unrestricted, external temperatures should not be concerning. There is a single fan that blends in with surrounding noise and largely goes unnoticed. It only ramps up under load, and even then it is hard to hear from a normal sitting distance.
Pros
Cons
Verdict
The Geekom Mini IT8 is a competent mini desktop that packs quite a few ports into its tiny chassis. While it's not the smallest desktop on the market, it has decent computing chops in a tiny case that's easily stowed out of sight.
Highlights include the suite of display connections (up to four 4K60 displays are supported, according to Geekom) and its quiet fan. The Core i5-8259U and Intel Iris Plus Graphics 655 make for a good combo for an office machine or media streaming HTPC. The bevy of 10 Gpbs USB ports opens the option for connecting lots of high-speed USB drives for media management.
However, the Coffee Lake CPU is four years old at this point, and it shows. Intel's Tiger Lake and Alder Lake chips offer noticeably better performance, and the Intel Xe Graphics iGPUs in the newer chipsets are miles beyond the now-ancient Intel Iris Plus Graphics 655 in terms of gaming and graphics work. Still, for USD $449 (for our reviewed unit), the Geekom Mini IT8 undercuts many of its competitors while offering a very similar experience.
All said, the Geekom Mini IT8 is best suited for those in search of a tiny office desktop that is neither seen nor heard. Users interested in a solid media streaming PC may also want to look at the Geekom Mini IT8.
Price and availability
The Geekom Mini IT8 is available at Amazon starting at USD $379 (Core i5-8259U, 8 GB RAM, 256 GB SSD). Our unit as reviewed (Core i5-8259U, 16 GB RAM, 512 GB SSD) is currently on sale for USD $449. Interested buyers can also purchase the Geekom Mini IT8 directly from Geekom for the same price.


Price comparison
