 Deutsch
 English
 Español
 Français
 Italiano
 Nederlands
 Polski
 Português
 Русский
 Türkçe
 Svenska
 Chinese
 Magyar
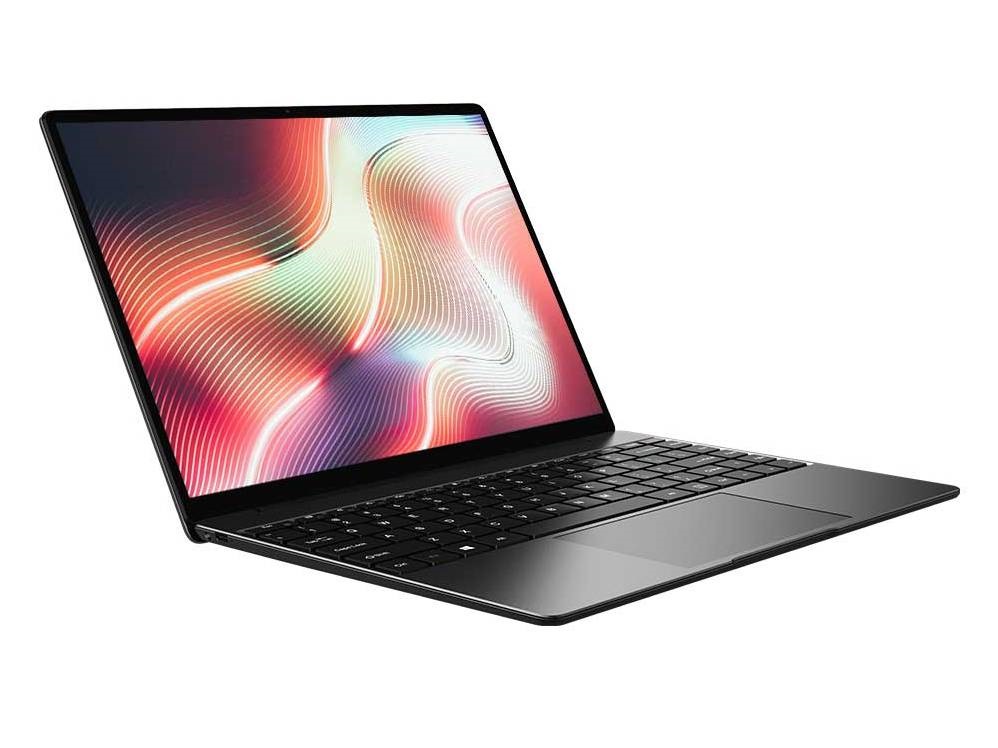
Chuwi CoreBook X Laptop Review: Like a Huawei MateBook, But Cheaper
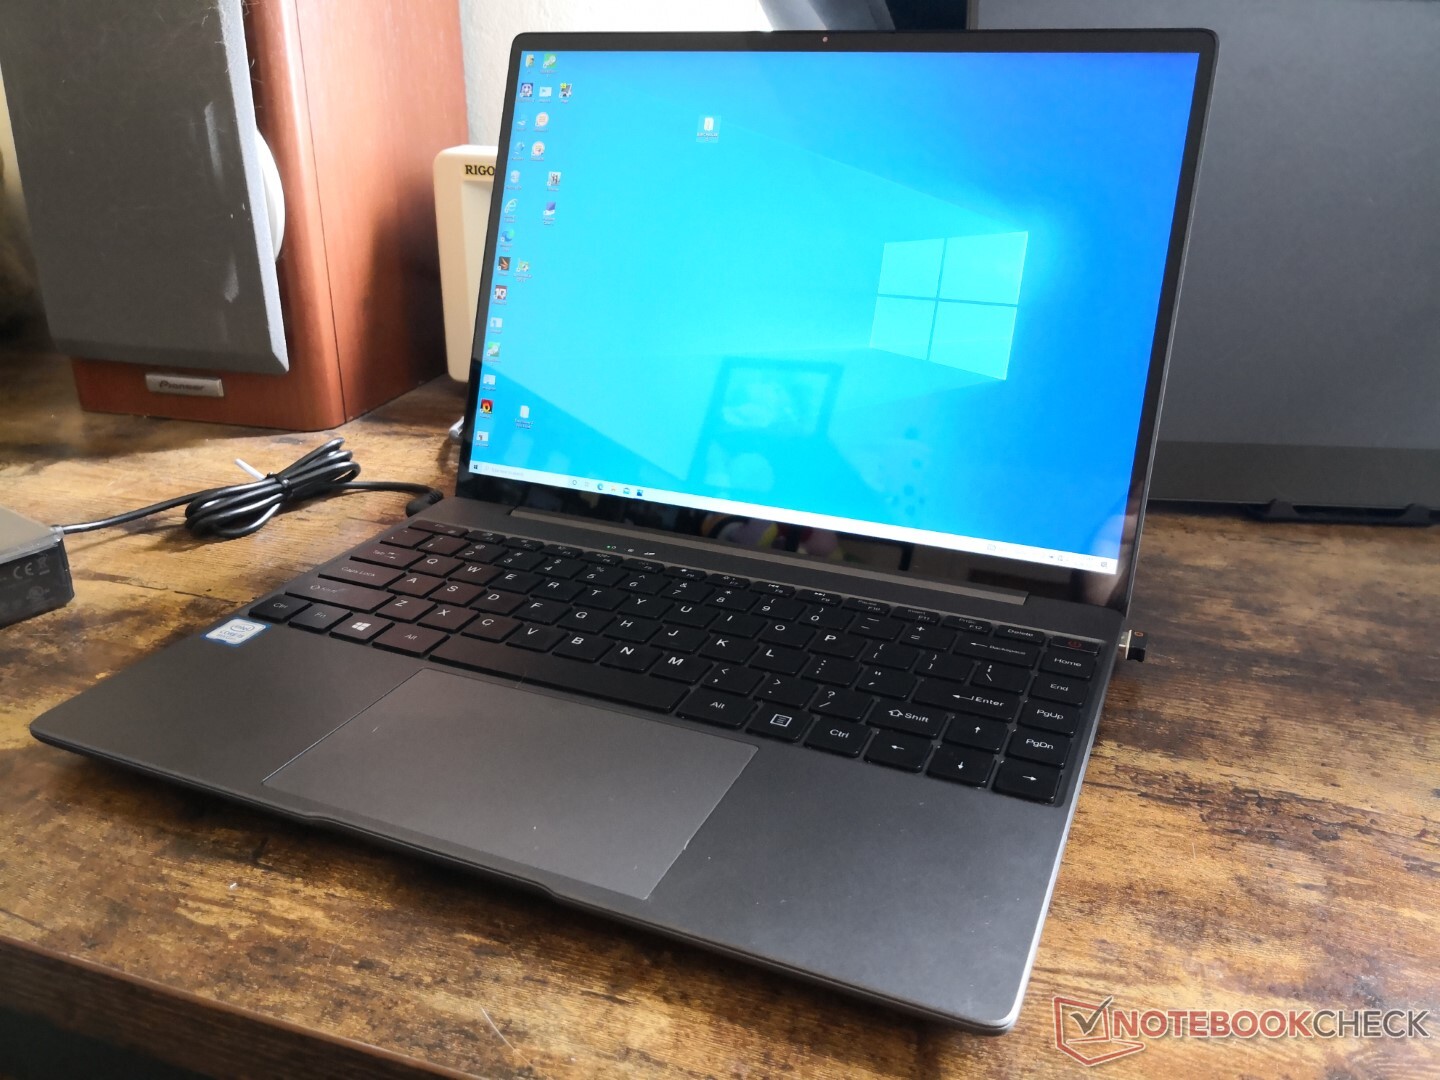
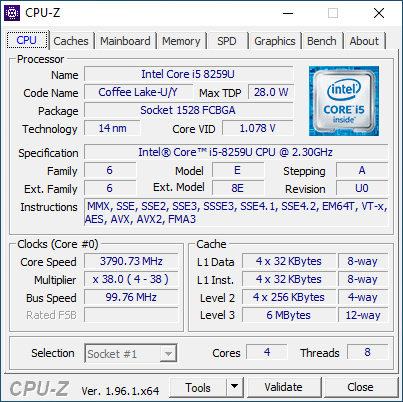
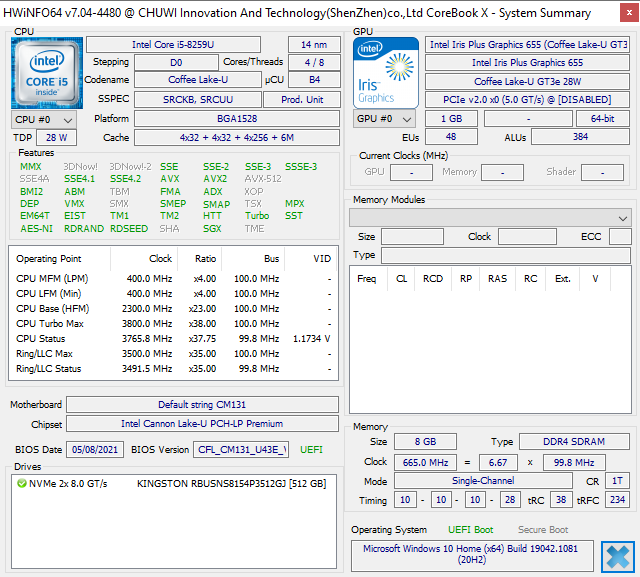
The CoreBook X is Chuwi's latest wallet-friendly laptop with a retail price of under $550 USD. Like most other models from the manufacturer, the CoreBook X prioritizes display quality and visual appeal by integrating a high resolution 3:2 2160 x 1440 display wrapped around a sleek metal alloy and plastic chassis. To keep costs under control, the system ships with slower components including a three-year old 8th generation Intel Core i5-8259U CPU instead of newer 10th gen or 11th gen parts.
Competitors in this space include other inexpensive multimedia laptops like the Honor MagicBook 14, Asus VivoBook 14, or Acer Swift 5. However, it's also clear that the CoreBook X is attempting to emulate pricier 3:2 laptops like the Huawei MateBook X Pro or the Microsoft Surface Laptop 4.
More Chuwi reviews:
potential competitors in comparison
Rating | Date | Model | Weight | Height | Size | Resolution | Best Price |
|---|---|---|---|---|---|---|---|
| 79 % | 07/2021 | Chuwi CoreBook X i5-8259U, Iris Plus Graphics 655 | 1.5 kg | 20.6 mm | 14.00" | 2160x1440 | |
| 80.4 % | 06/2021 | Infinix INBook X1 Pro i7-1065G7, Iris Plus Graphics G7 (Ice Lake 64 EU) | 1.5 kg | 16.3 mm | 14.00" | 1920x1080 | |
| 89.1 % | 06/2021 | SCHENKER Vision 14 i7-1165G7, Iris Xe G7 96EUs | 1 kg | 15.6 mm | 14.00" | 2880x1800 | |
| 84.9 % | 05/2021 | Honor Magicbook 14 i7-1165G7 i7-1165G7, Iris Xe G7 96EUs | 1.4 kg | 15.9 mm | 14.00" | 1920x1080 | |
| 88.3 % | 05/2021 | LG Gram 14Z90P-G.AA79G i7-1165G7, Iris Xe G7 96EUs | 967 g | 16.8 mm | 14.00" | 1920x1200 | |
| 85.2 % | 04/2021 | Acer Swift 5 SF514-55T-58DN i5-1135G7, Iris Xe G7 80EUs | 1 kg | 14.95 mm | 14.00" | 1920x1080 |
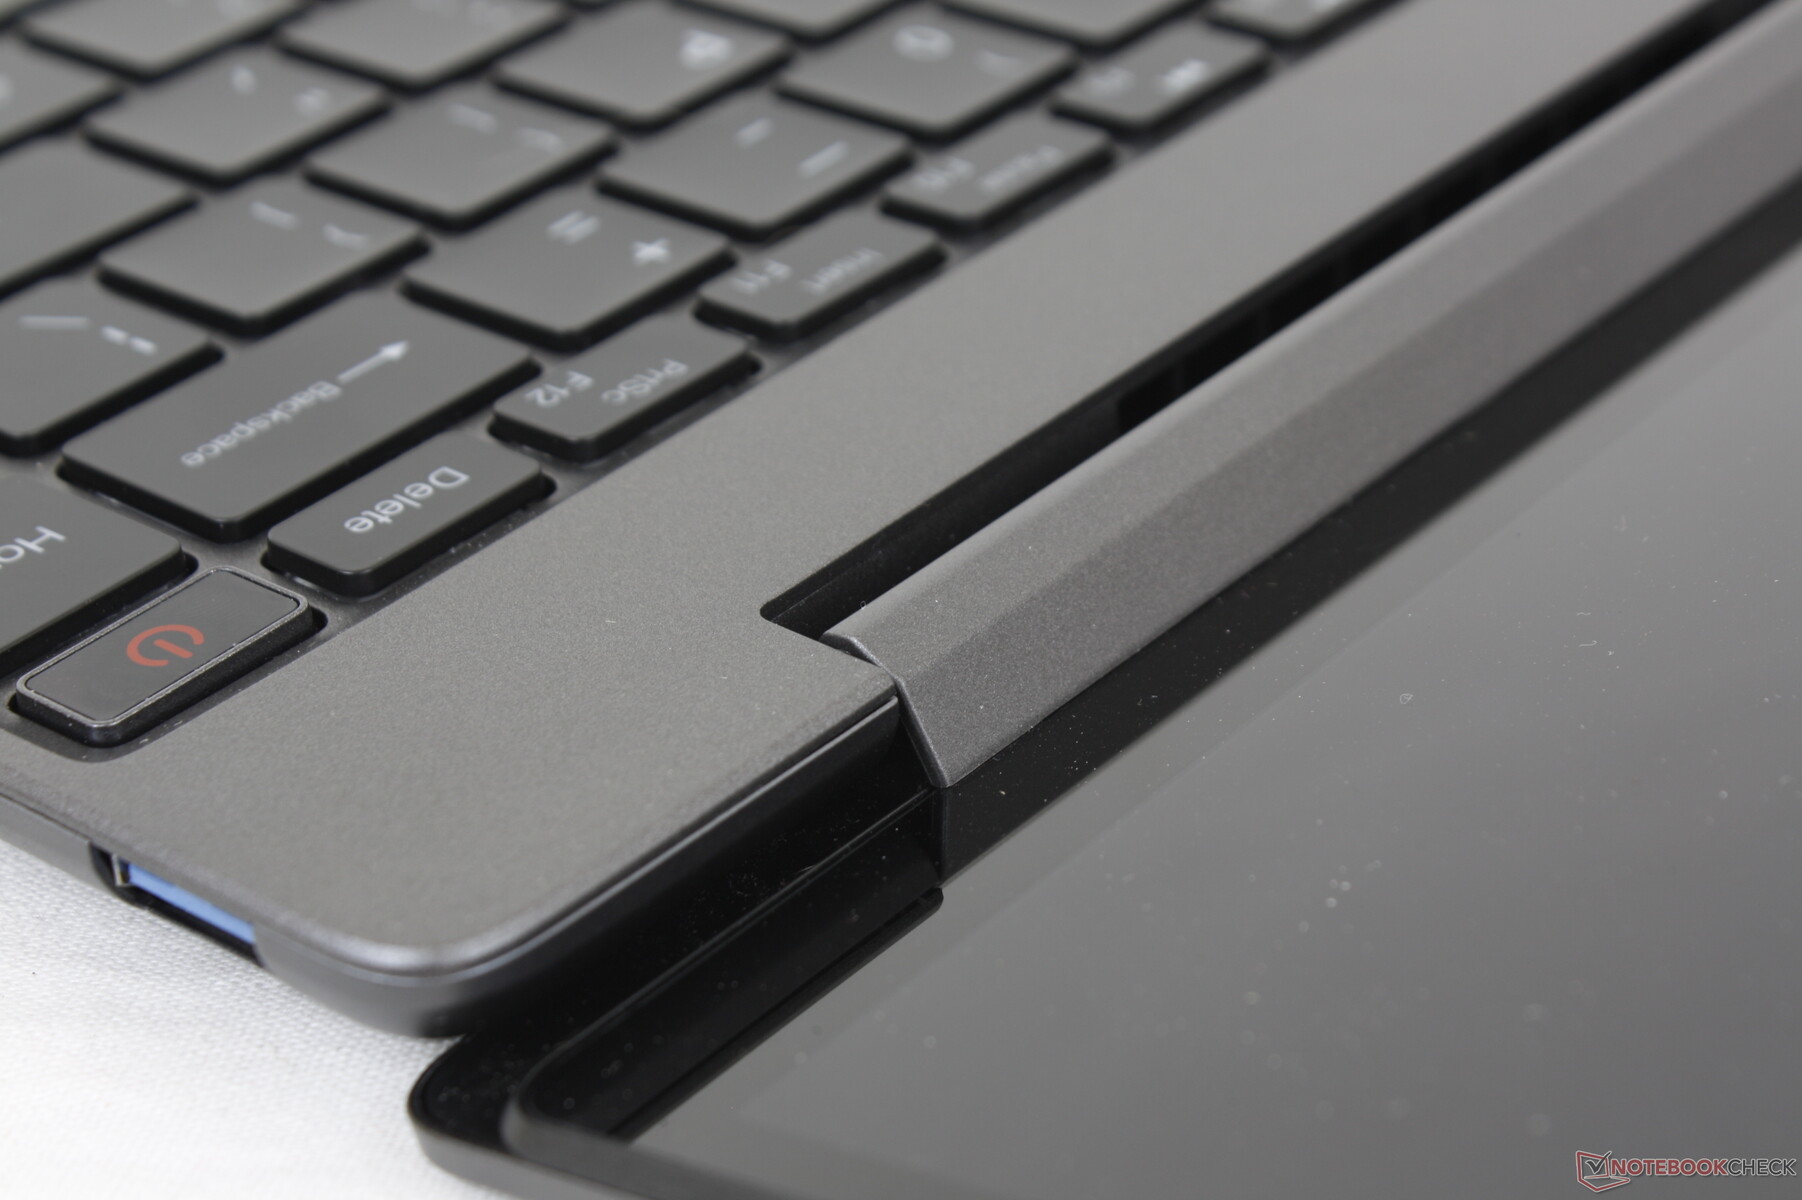
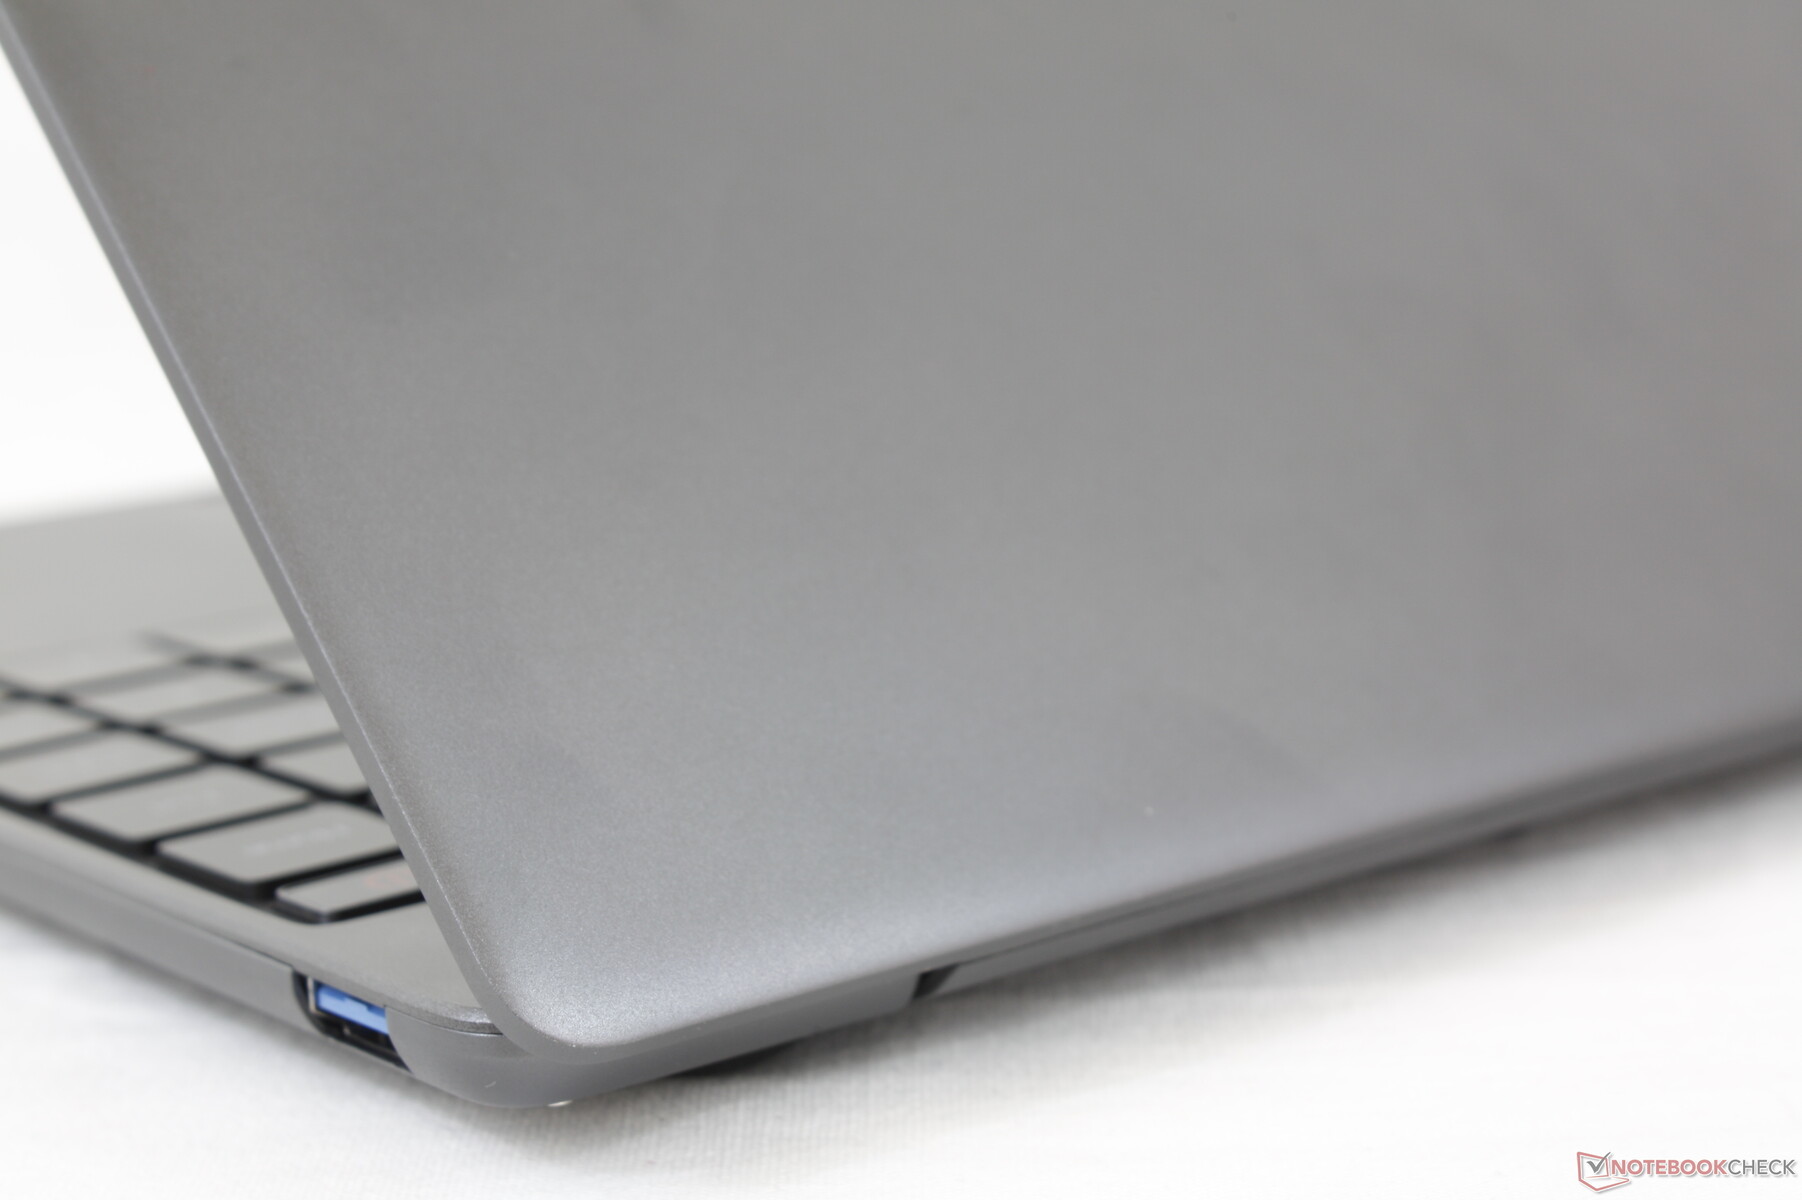
Case
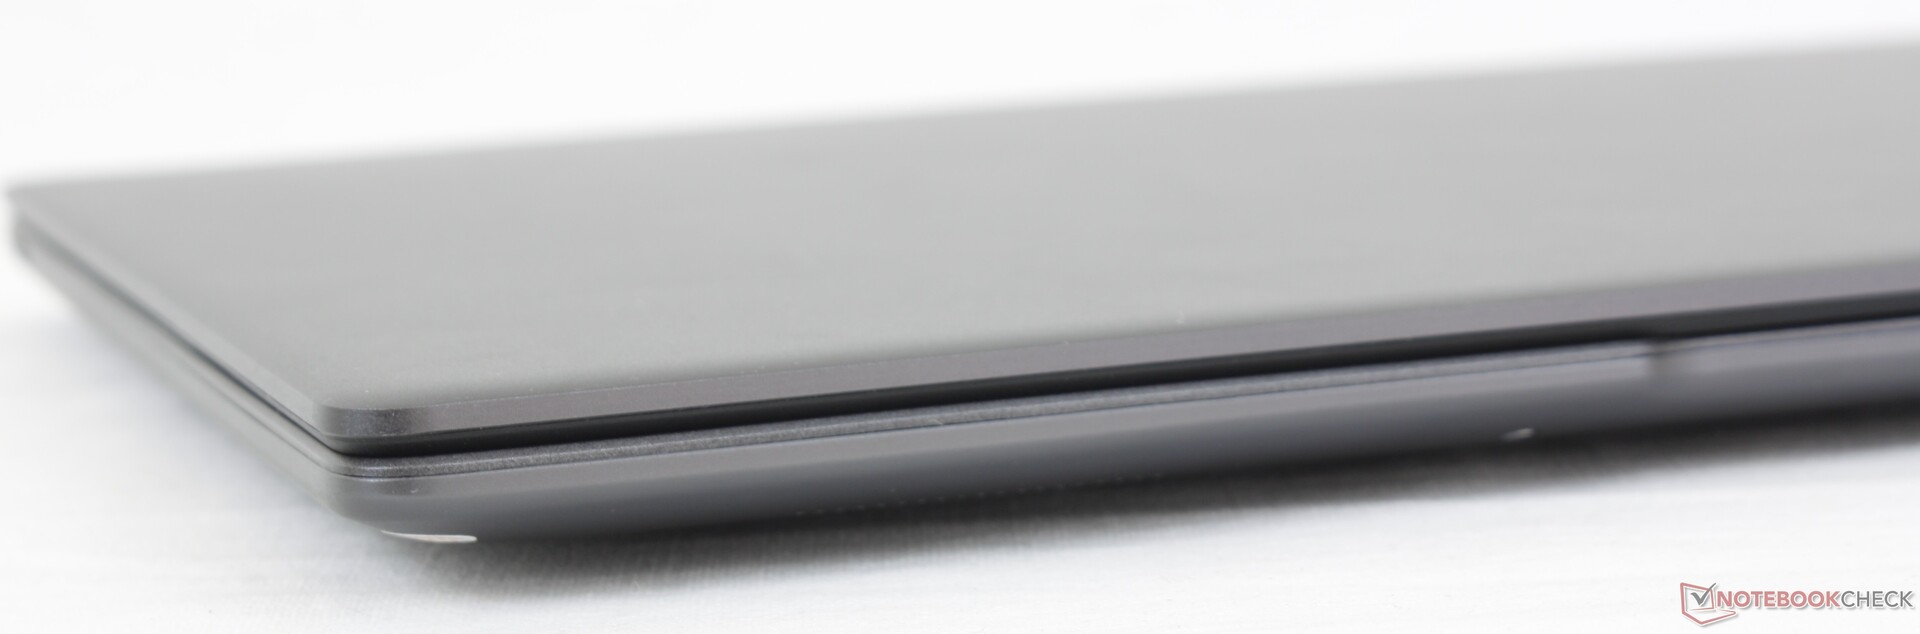
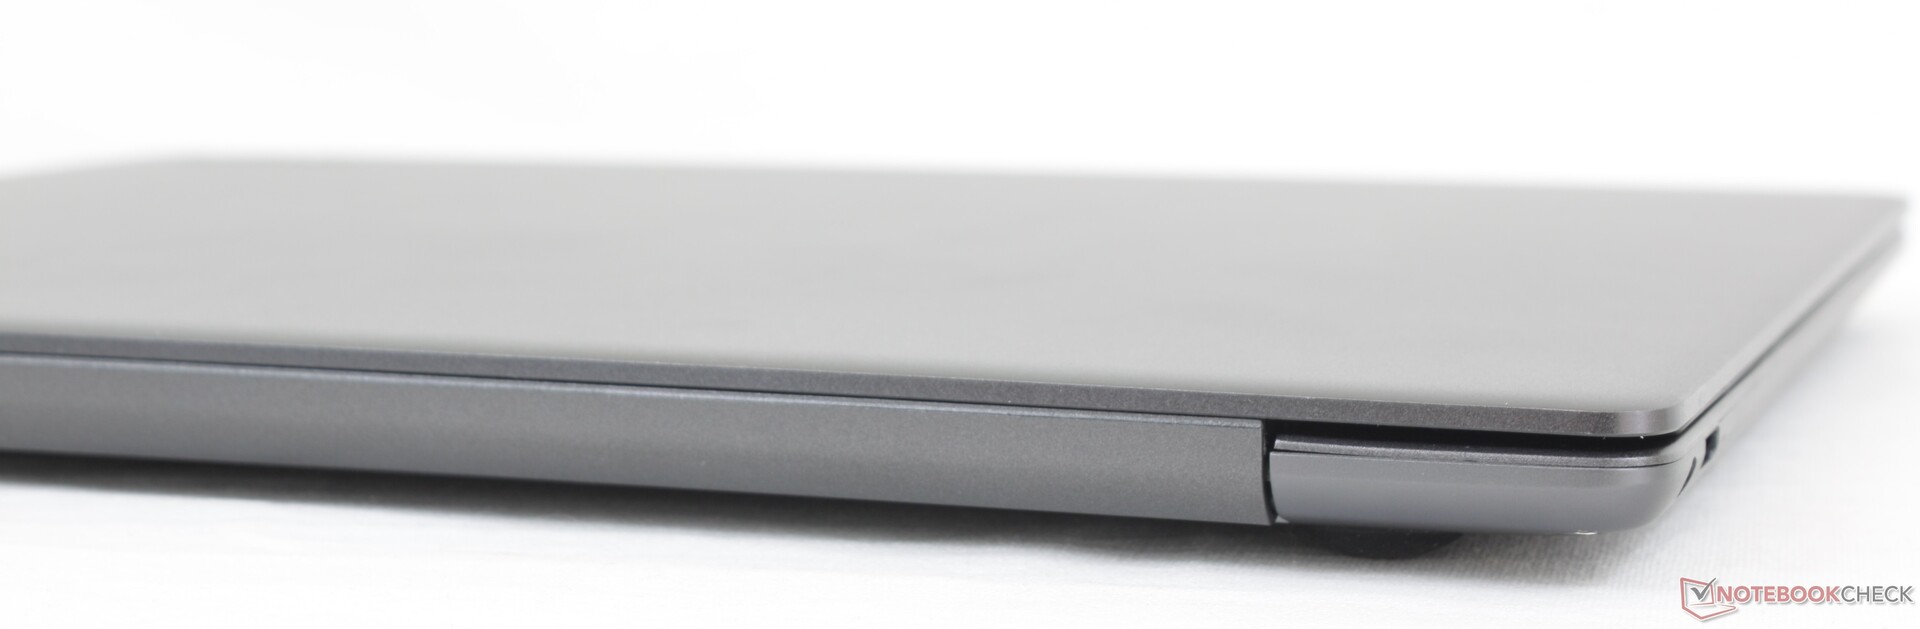
The chassis is similar to other Chuwi models like the LarkBook in that it is a combination of the same gray metal and plastic materials. Unfortunately, these materials only look good from afar as they feel weaker when held. Rigidity is nowhere near as firm as other metal laptops like the Dell XPS or HP Spectre, but it's still a step up when compared to cheaper plastic laptops like the Asus VivoBook or Acer Aspire 1 that are more in its price range.
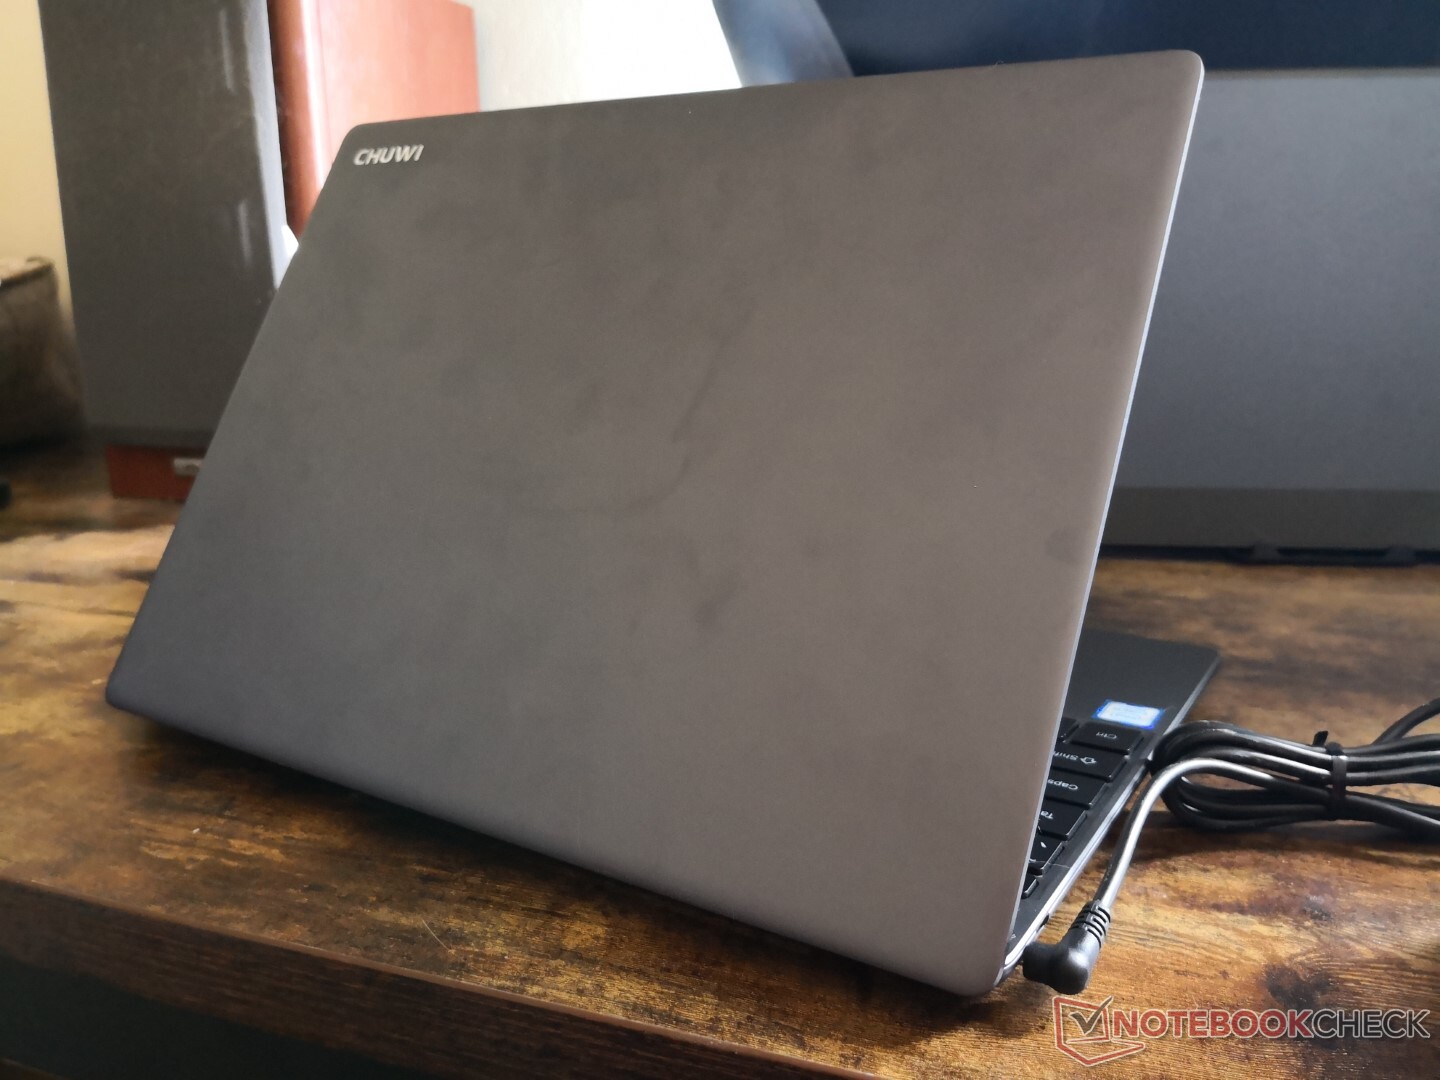
The system is thicker than many other 14-inch laptops by several millimeters. It's also noticeably heavier by a few hundred grams due to the larger 3:2 form factor.
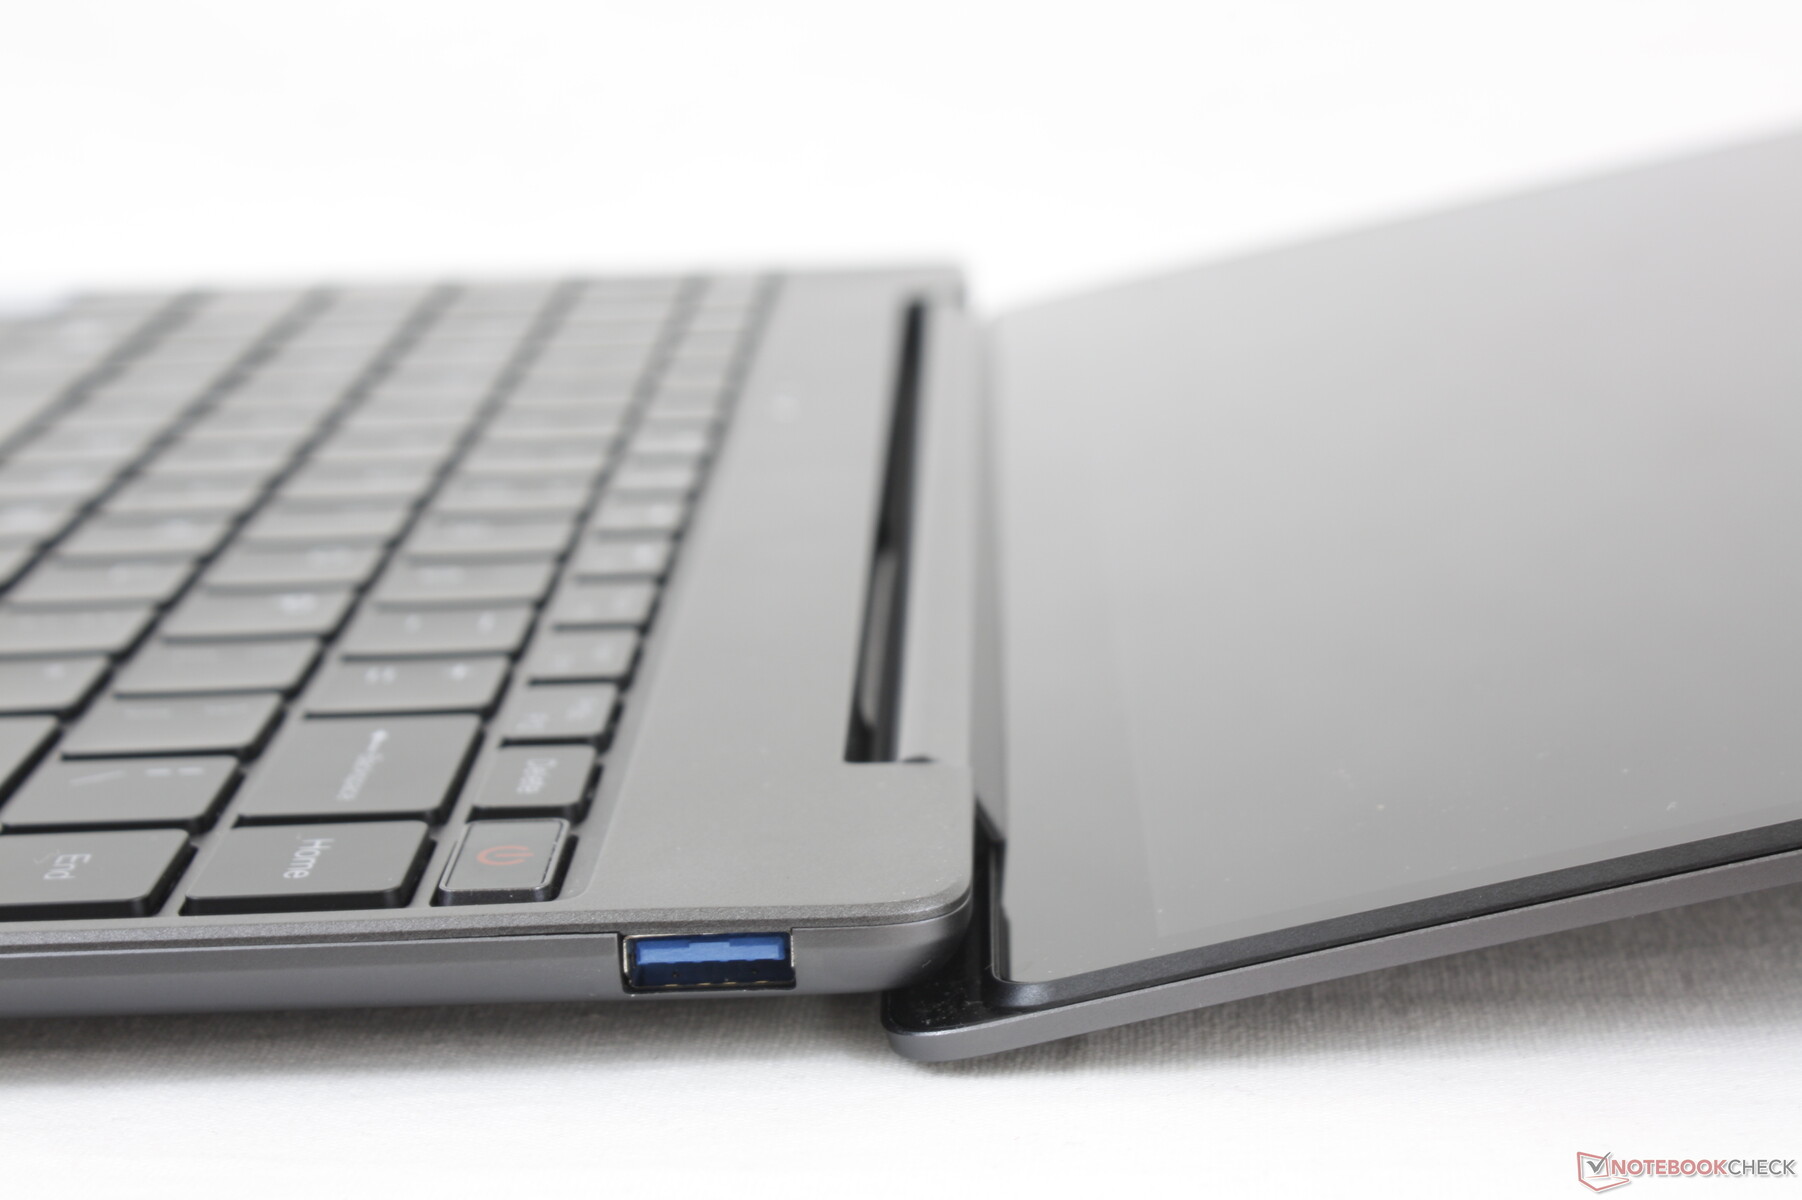
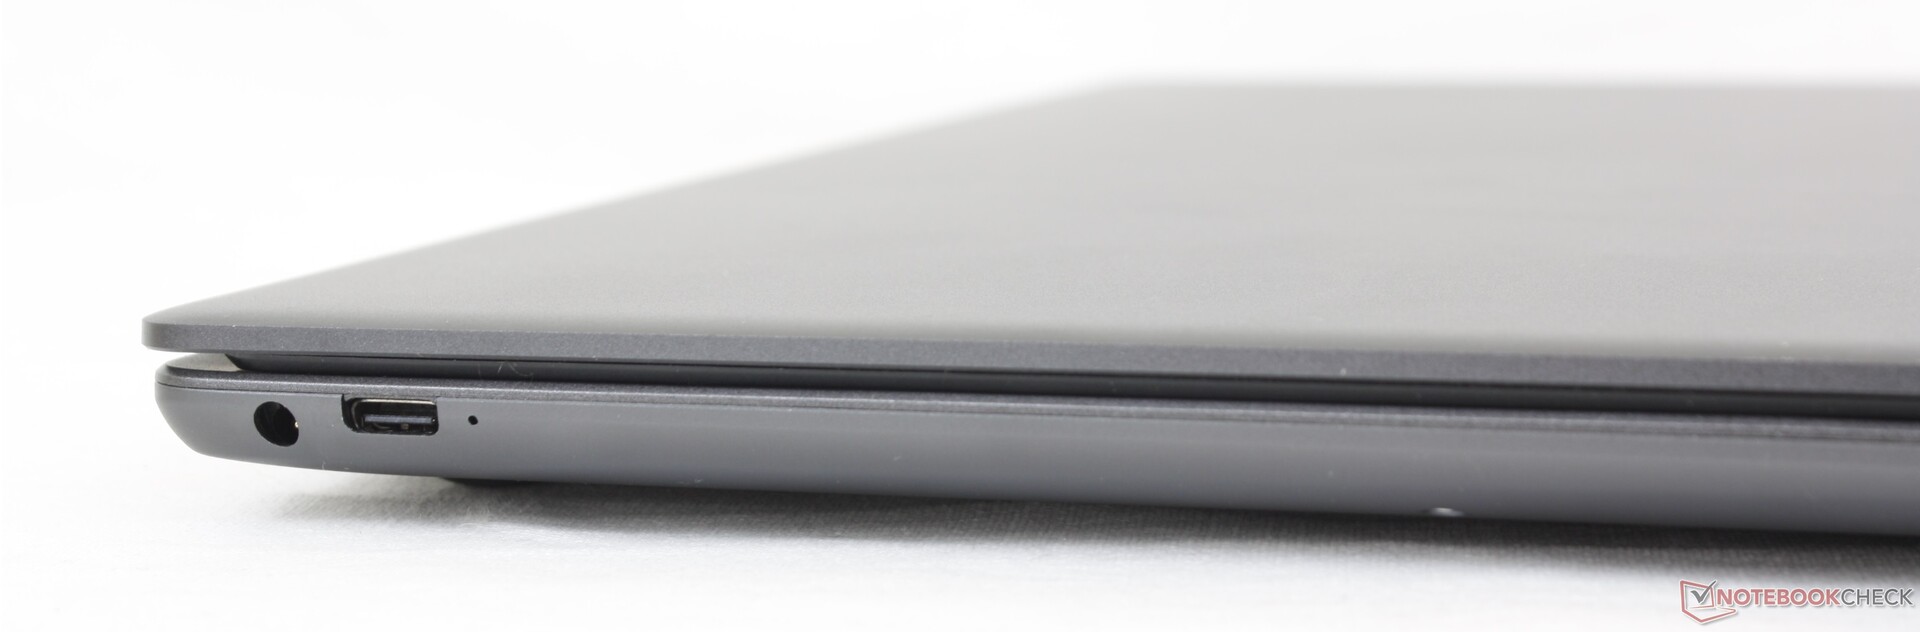
Connectivity
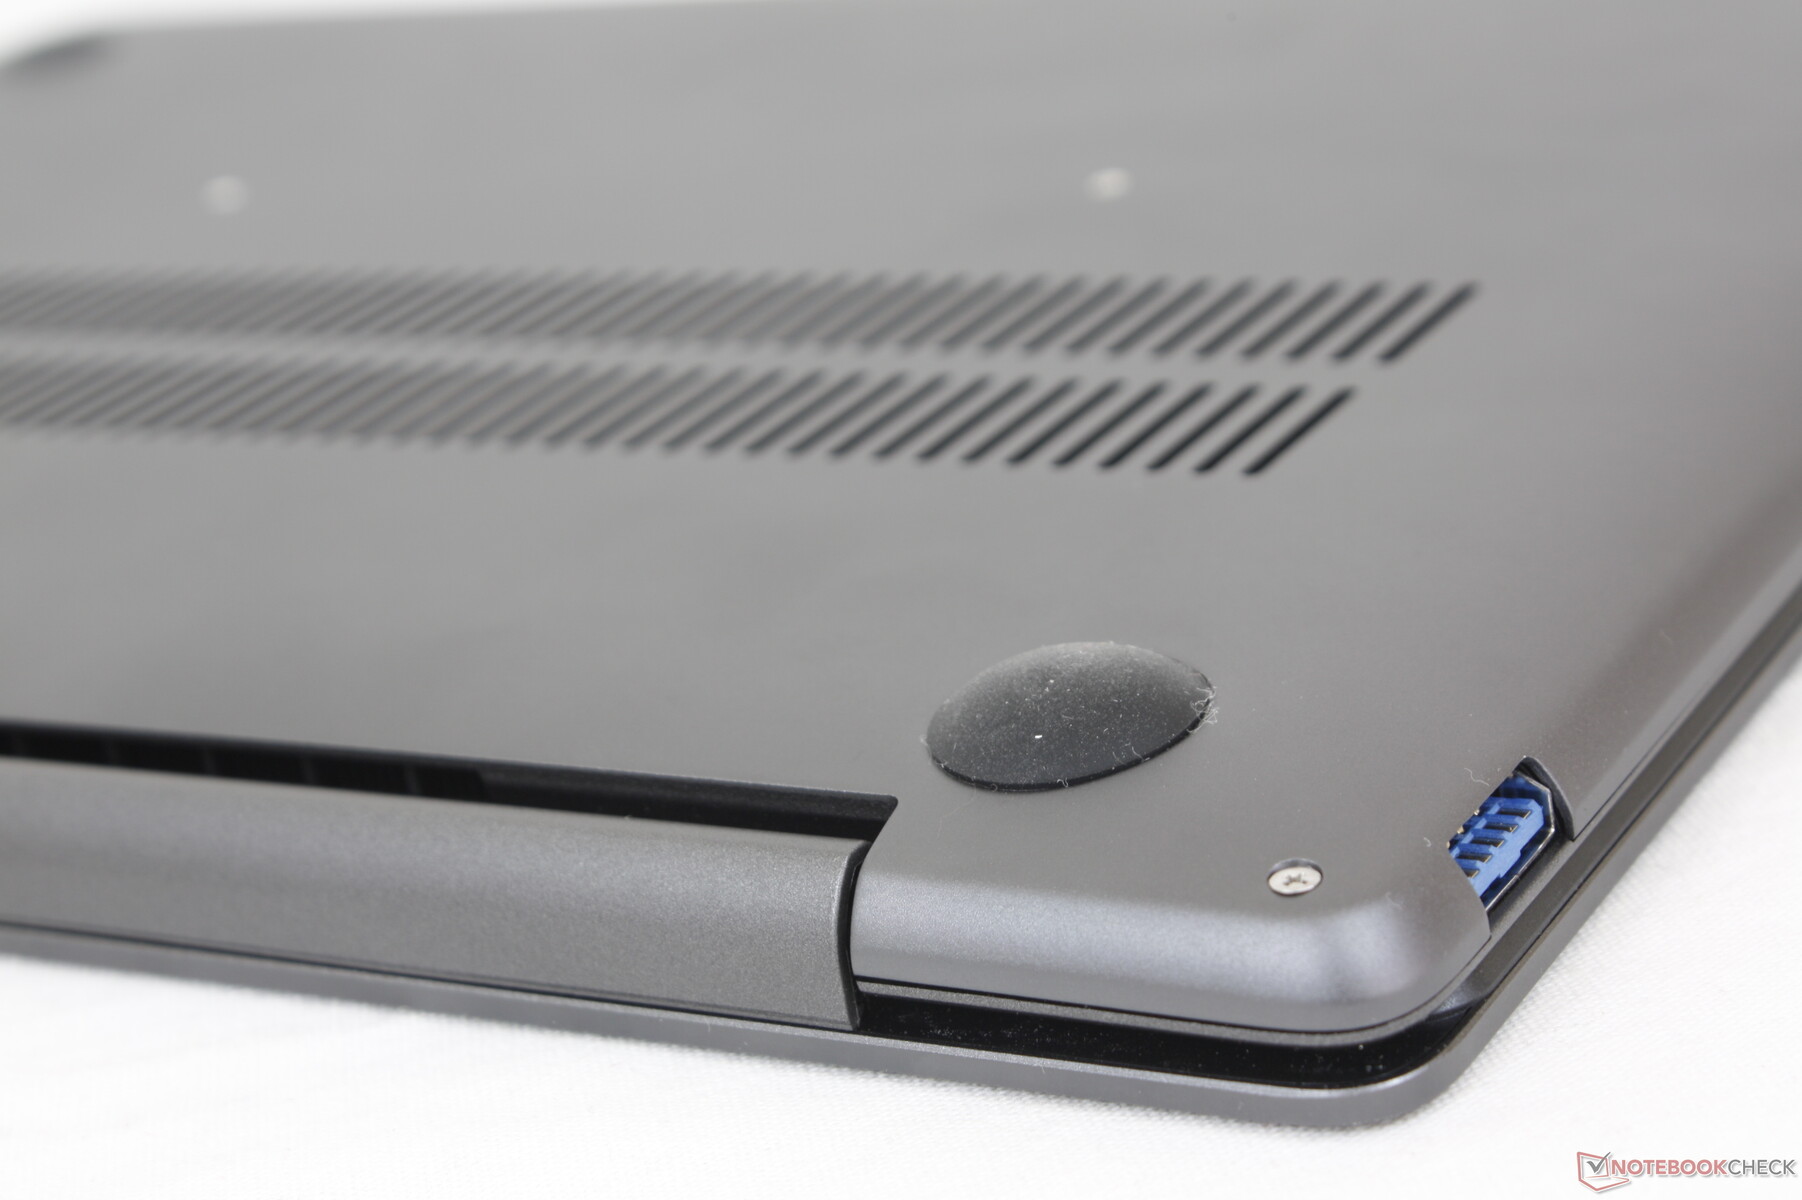
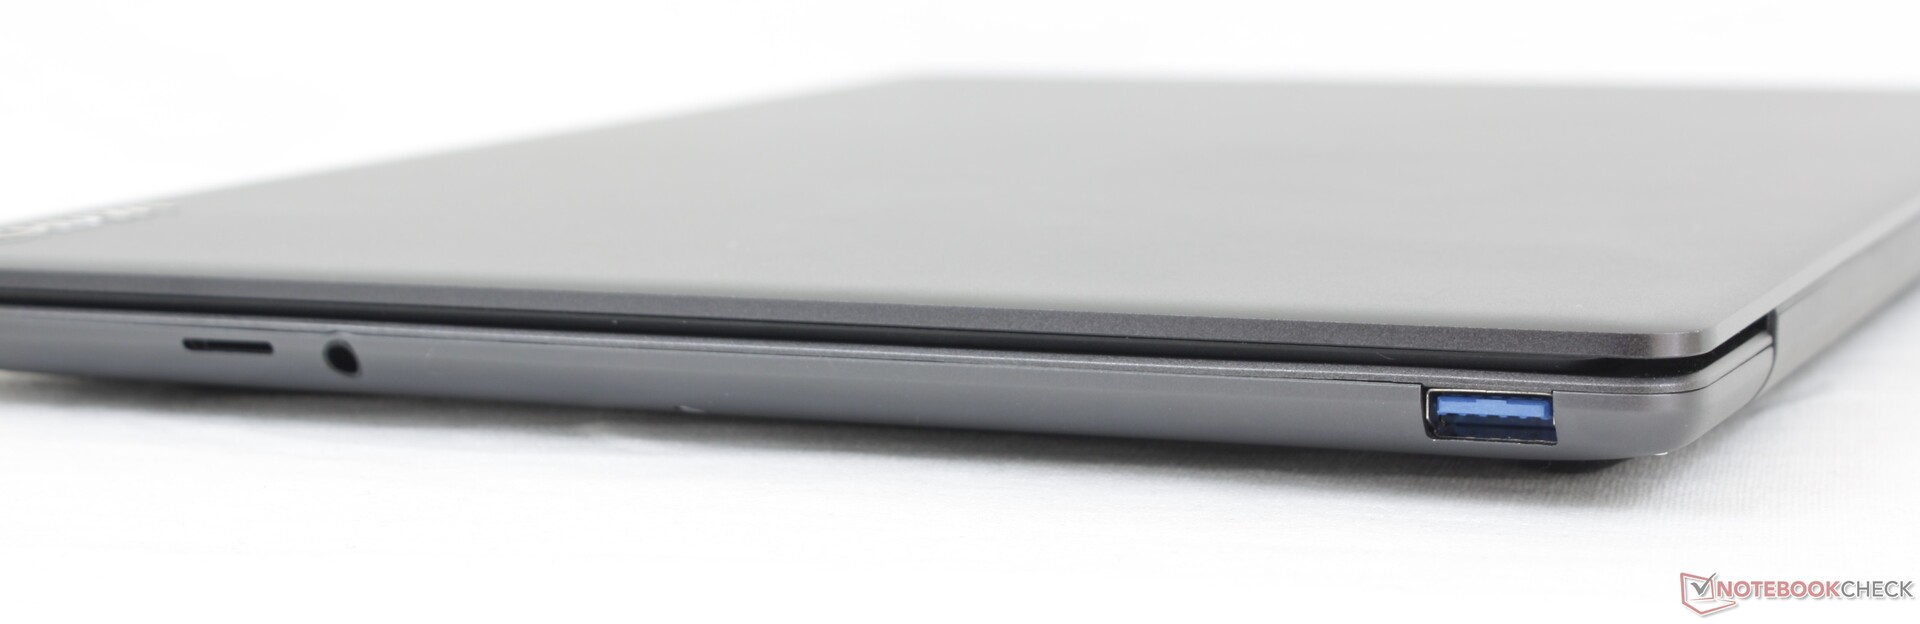
Although Chuwi advertises a USB-A port with 3.0 speeds, our real-world test with a USB 3.0 drive would only top out at about 40 to 60 MB/s to be closer to USB 2.0. Thankfully, the faster USB-C port on the other side supports both Power Delivery and DisplayPort for charging and docking purposes, respectively.
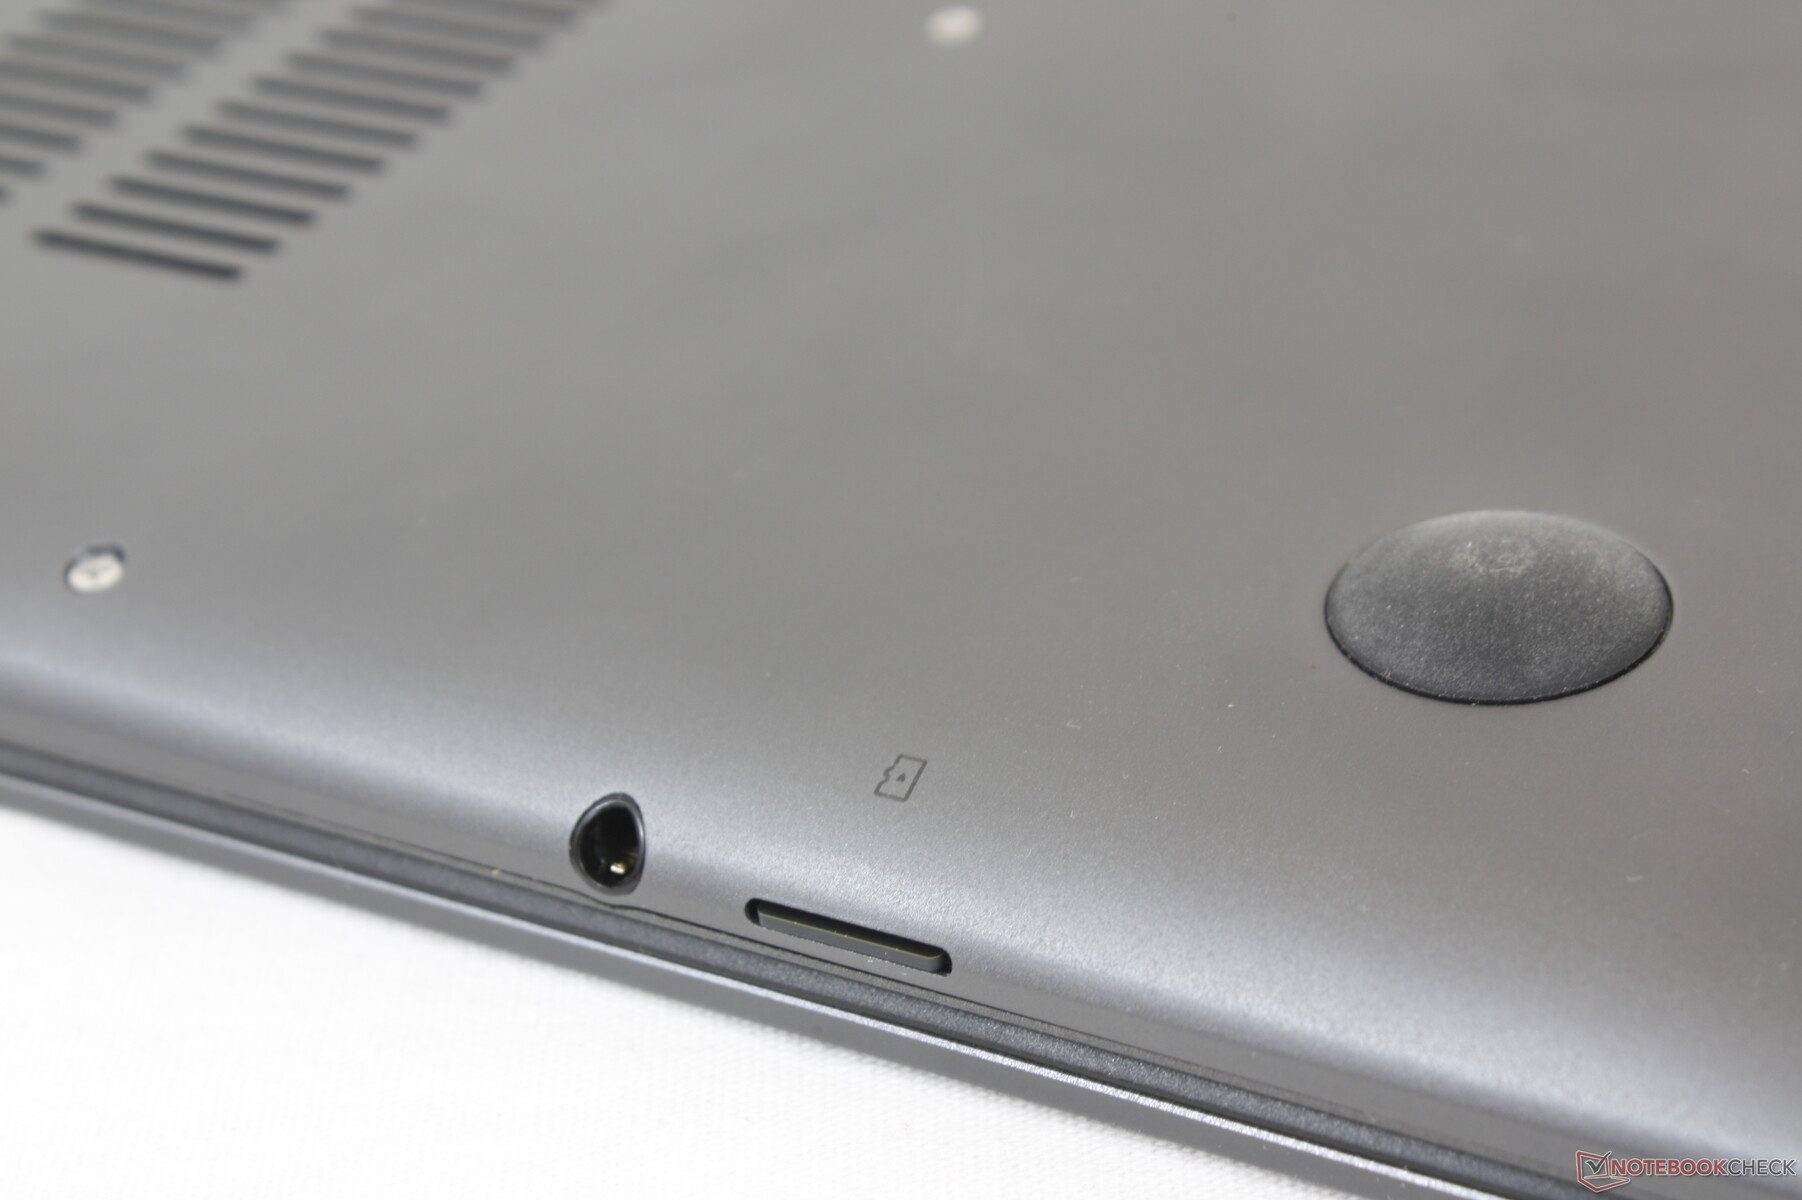
SD Card Reader
Moving 1 GB of photos from our UHS-II test card to desktop takes about 40 seconds to be on the slow side.
| SD Card Reader | |
| average JPG Copy Test (av. of 3 runs) | |
| SCHENKER Vision 14 (AV PRO V60) | |
| LG Gram 14Z90P-G.AA79G (Toshiba Exceria Pro M501 microSDXC 64GB) | |
| Chuwi CoreBook X (AV PRO V60) | |
| Infinix INBook X1 Pro (AV Pro V60) | |
| maximum AS SSD Seq Read Test (1GB) | |
| LG Gram 14Z90P-G.AA79G (Toshiba Exceria Pro M501 microSDXC 64GB) | |
| SCHENKER Vision 14 (AV PRO V60) | |
| Infinix INBook X1 Pro (AV Pro V60) | |
| Chuwi CoreBook X (AV PRO V60) | |
Communication
An Intel 7265 is included for 2x2 Wi-Fi 5 (802.11ac) and Bluetooth 4.2 compatibility. Transfer rates are stable enough for browsing and video streaming even if they are nowhere near as fast as the latest Intel AX200/201 Wi-Fi 6 modules and may occasionally dip.
Webcam
The webcam is very blurry even by laptop standards especially around the edges and corners. There is no shutter for privacy control.


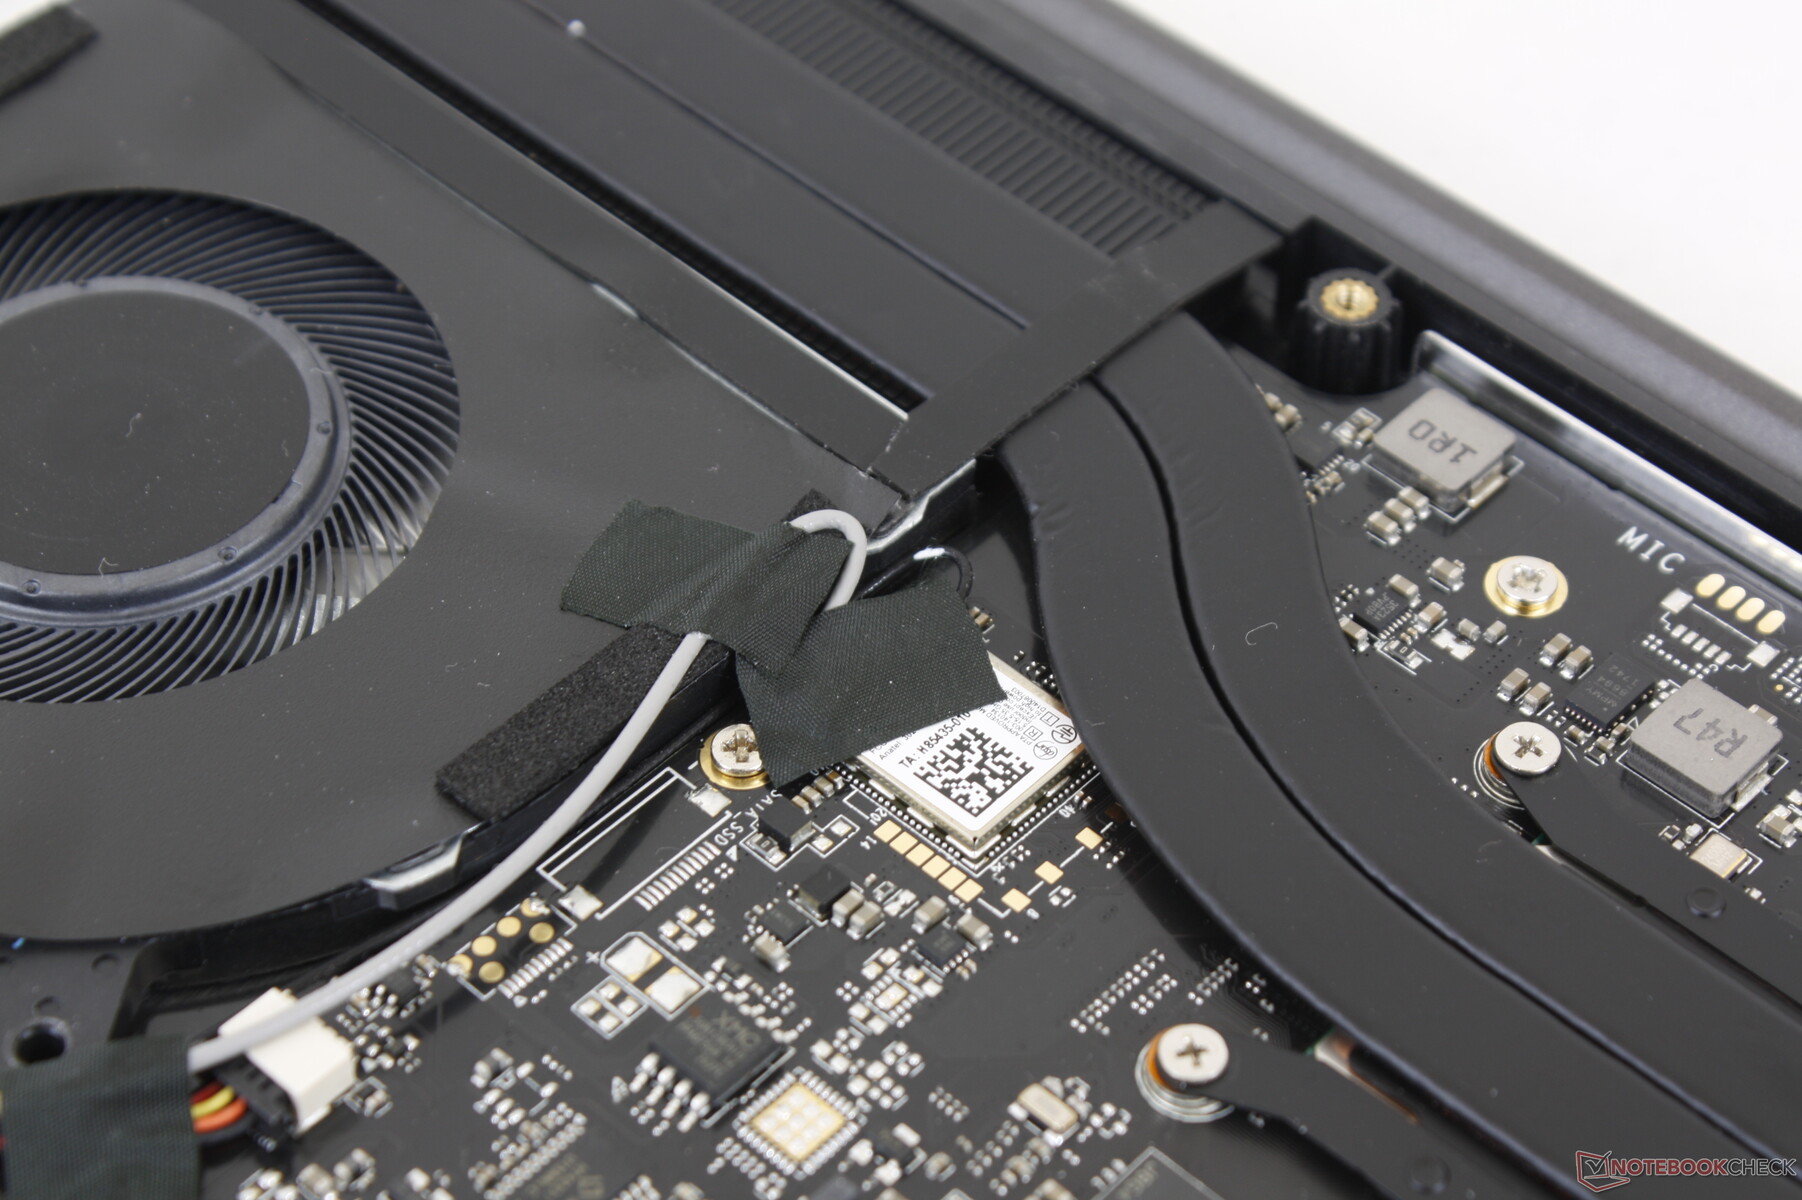
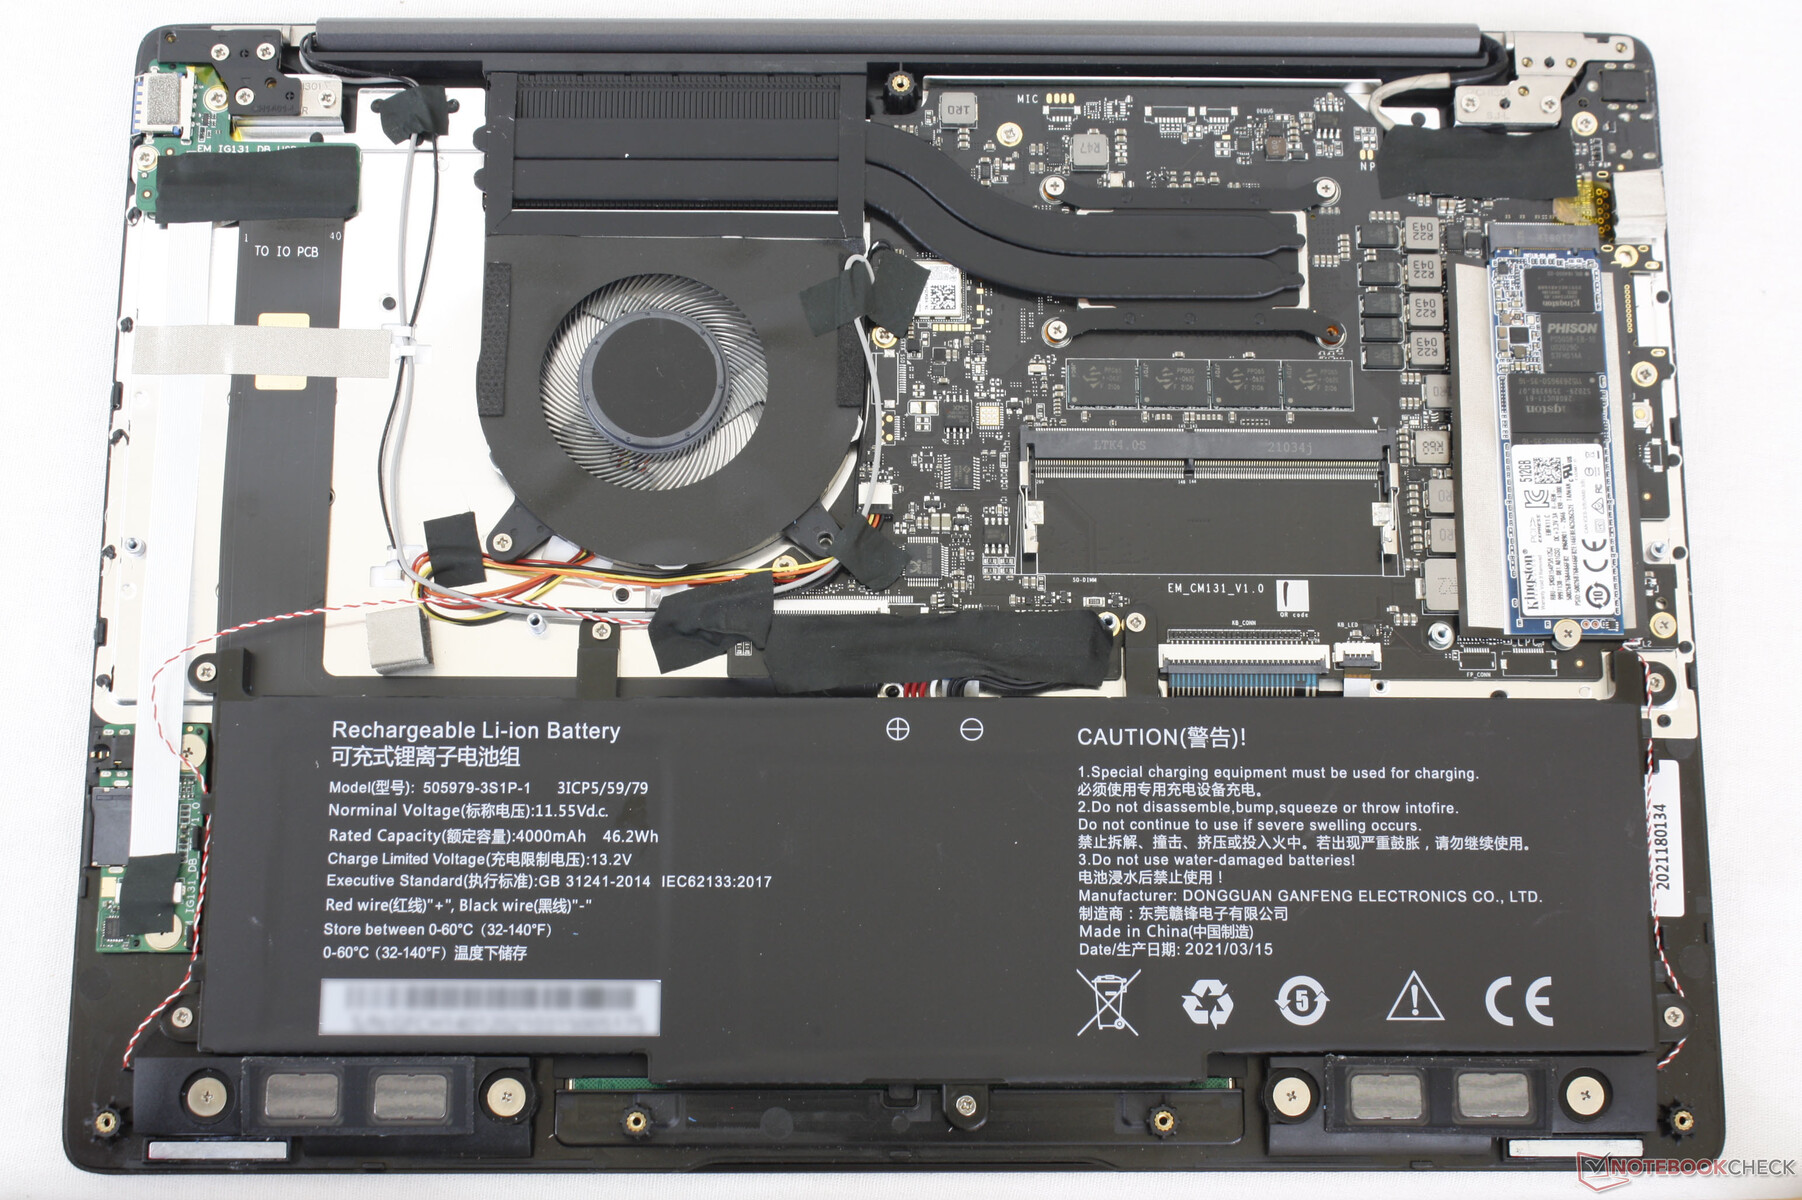
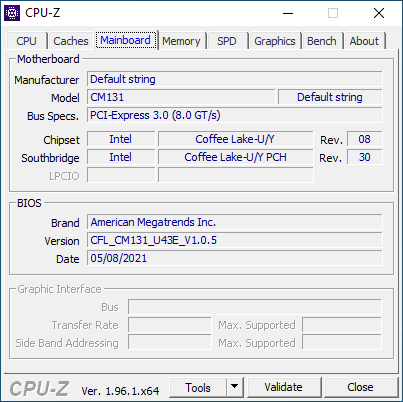
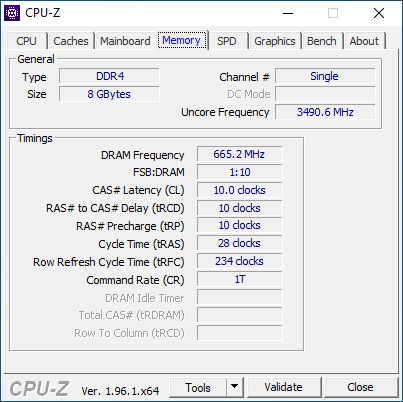
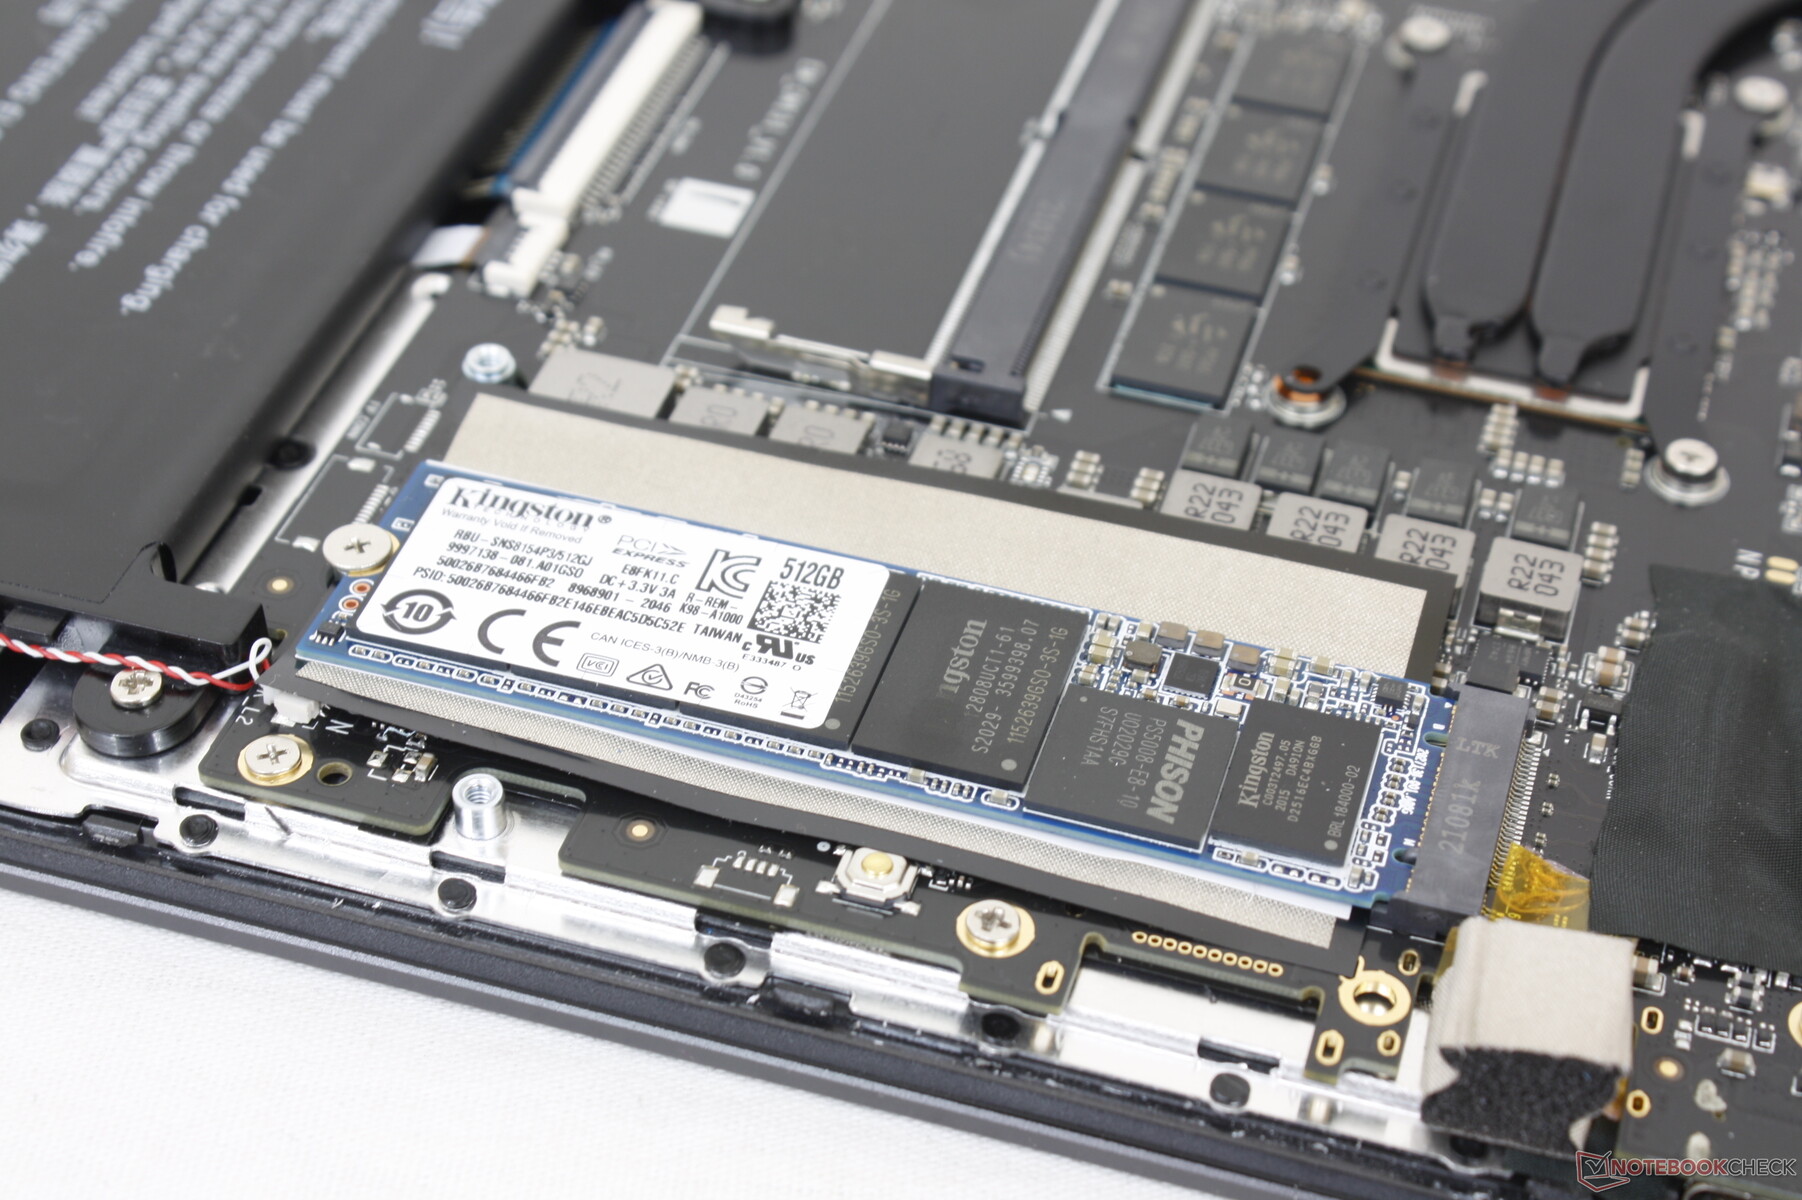
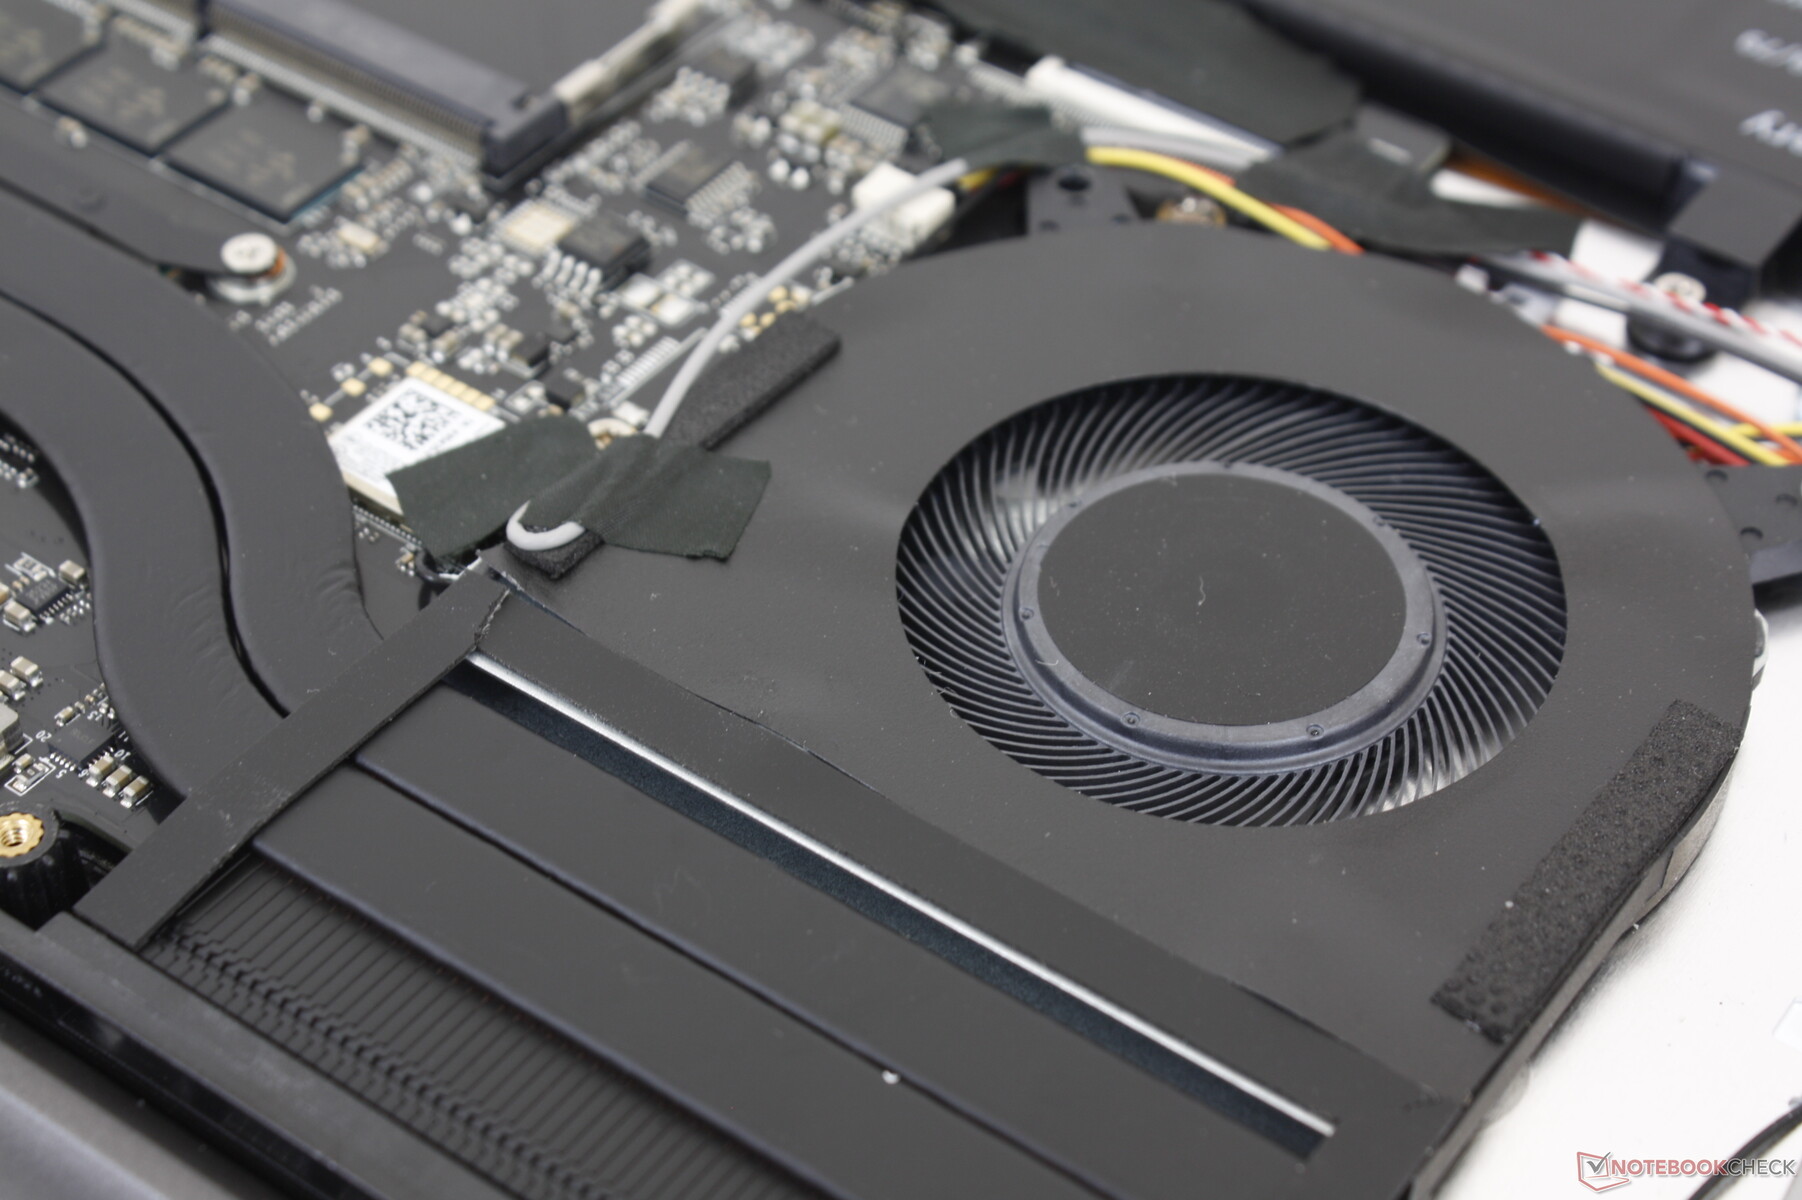
Maintenance
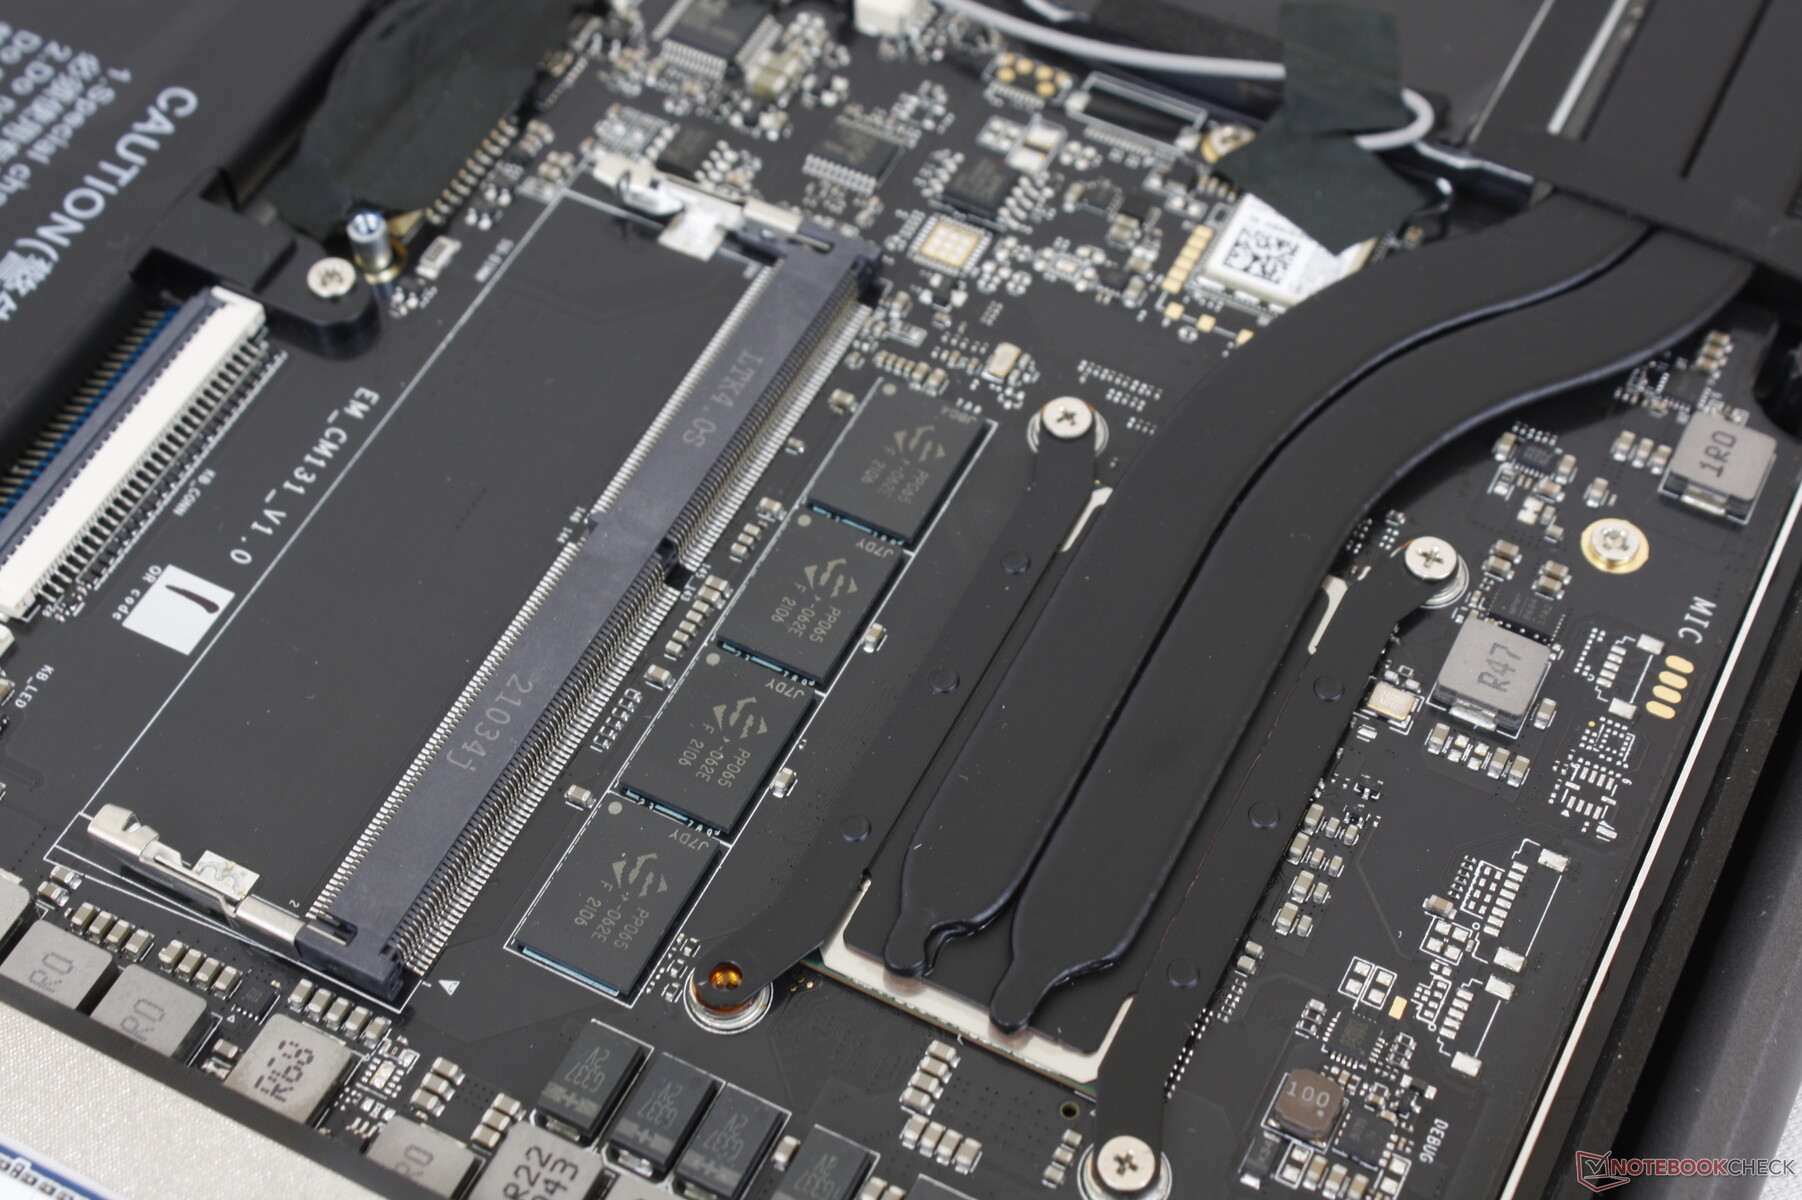
The bottom panel can be removed quite easily with just a Philips screwdriver. Its edges are sharp, however, and so users should take caution. Both RAM (1x SODIMM) and storage (1x M.2 2280) are upgradeable. There is 8 GB of soldered single-channel RAM by default.
Accessories and Warranty
There are no accessories in the box other than the AC adapter and small user guide. Claiming warranty may be difficult depending on region as users may have to ship overseas.
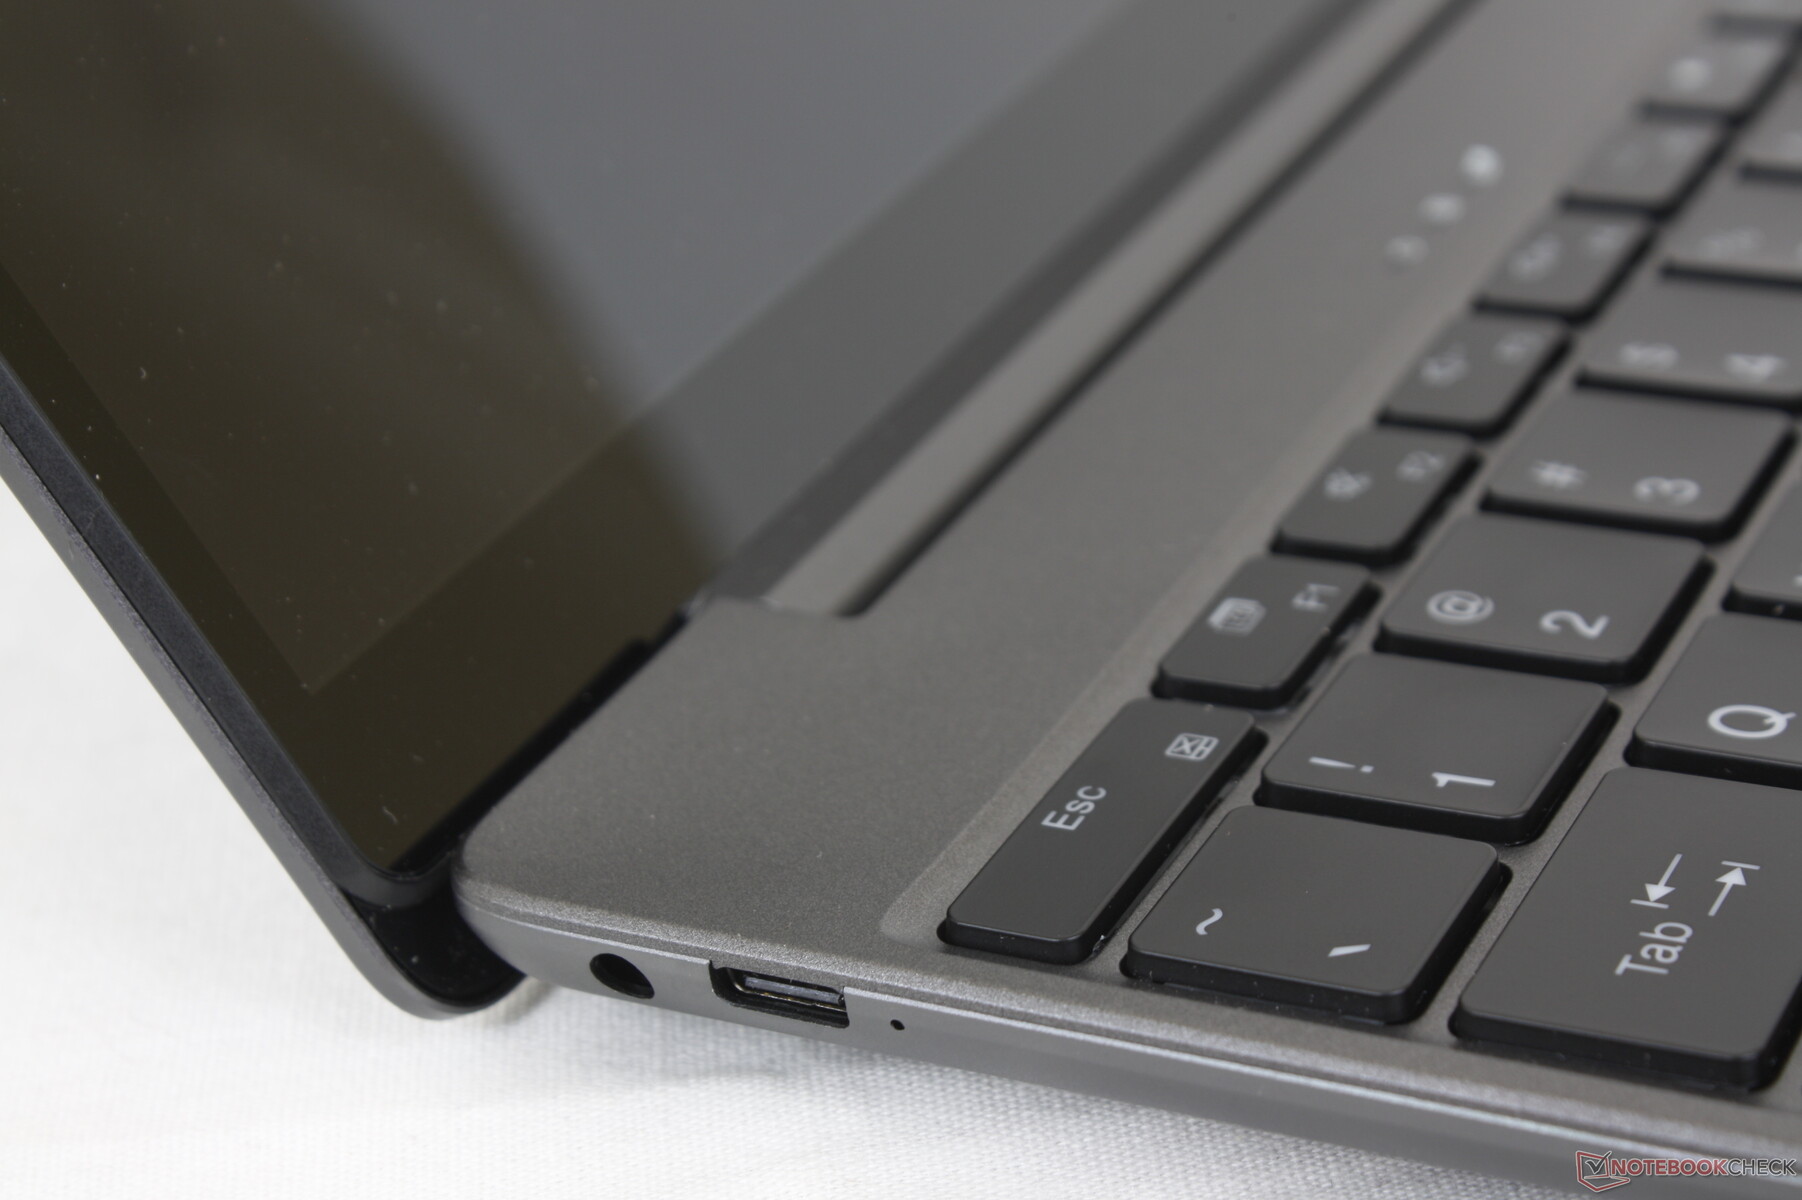
Input Devices
Keyboard
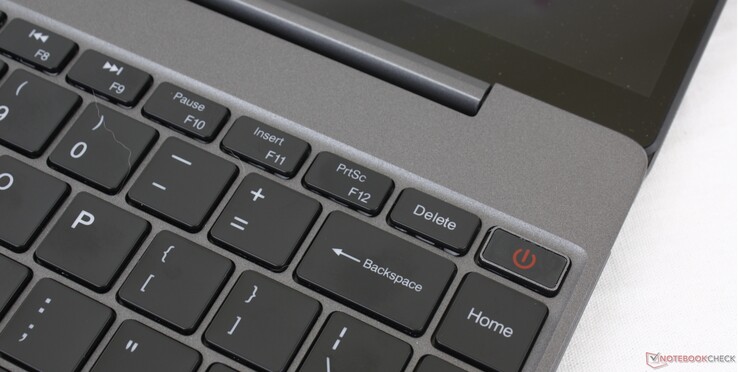
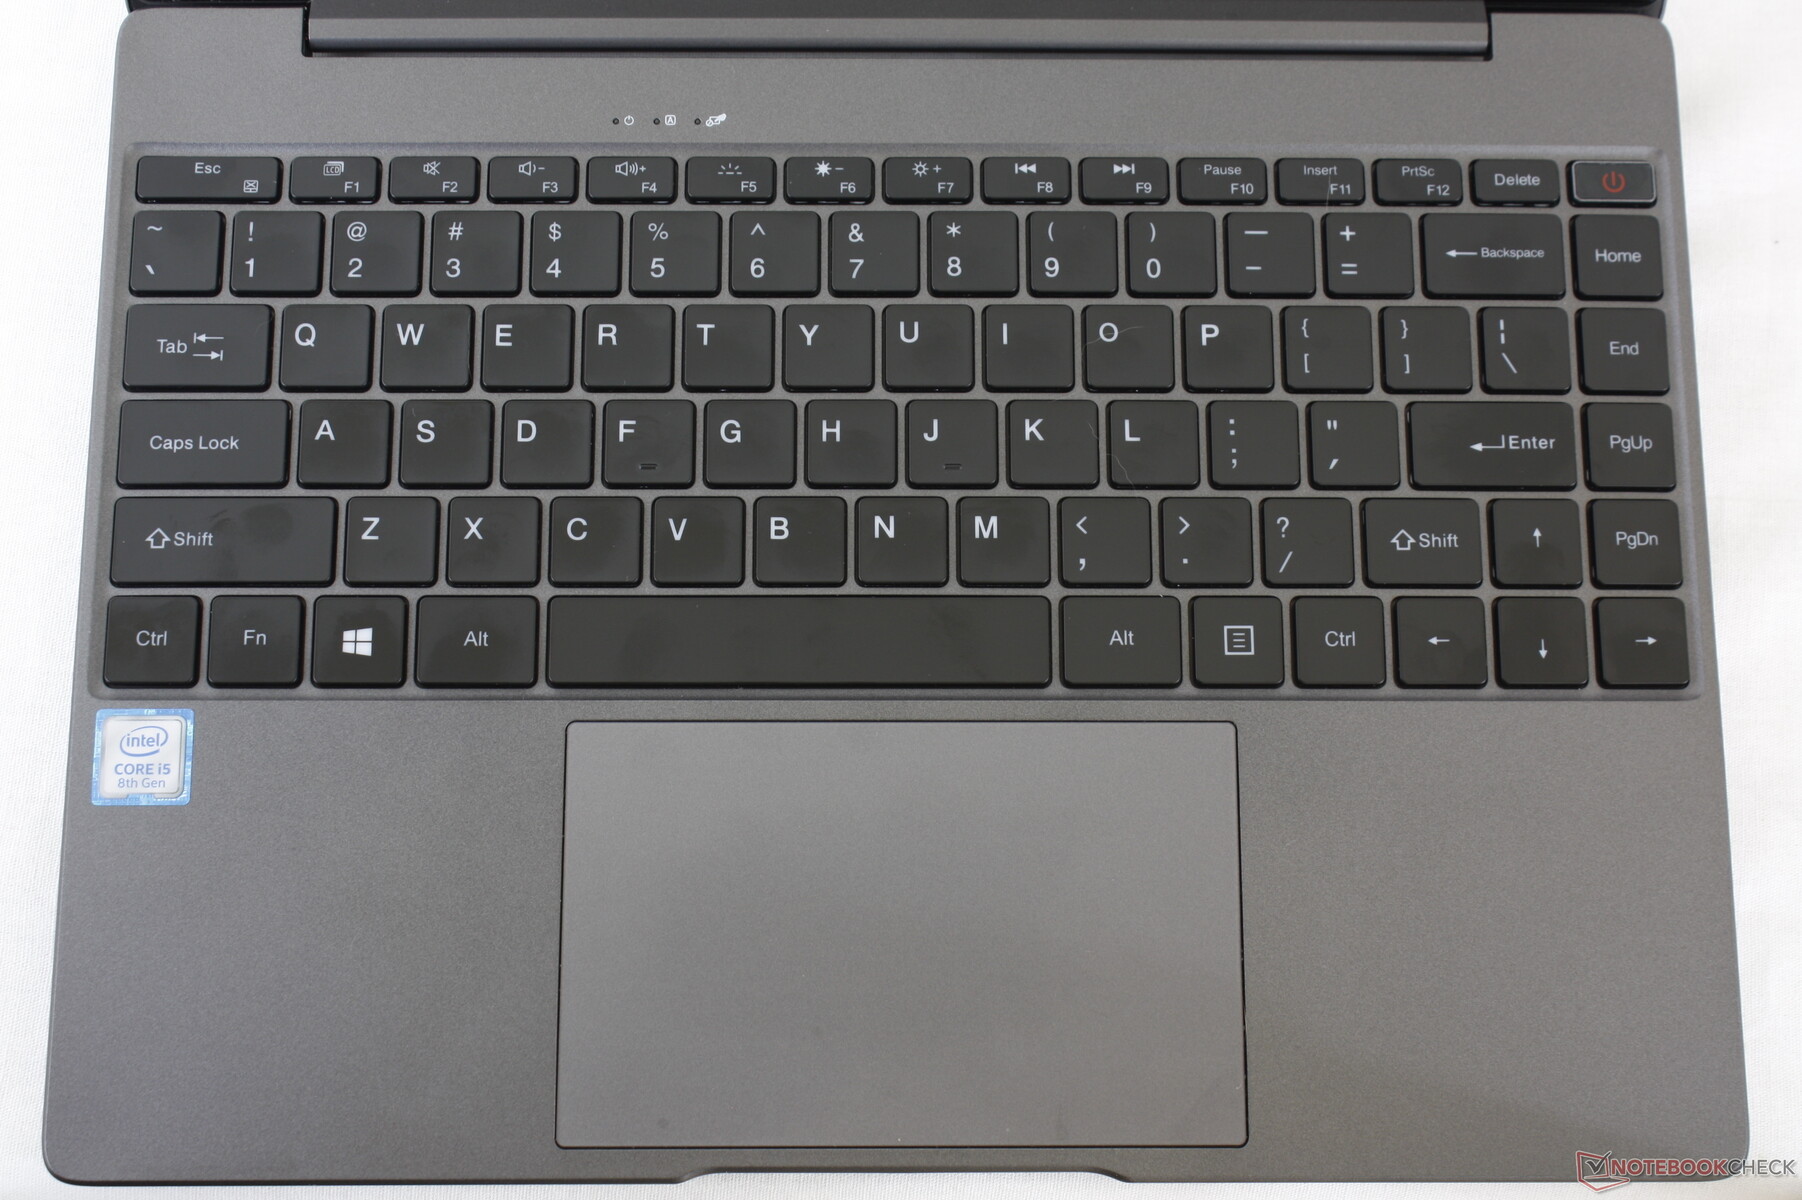
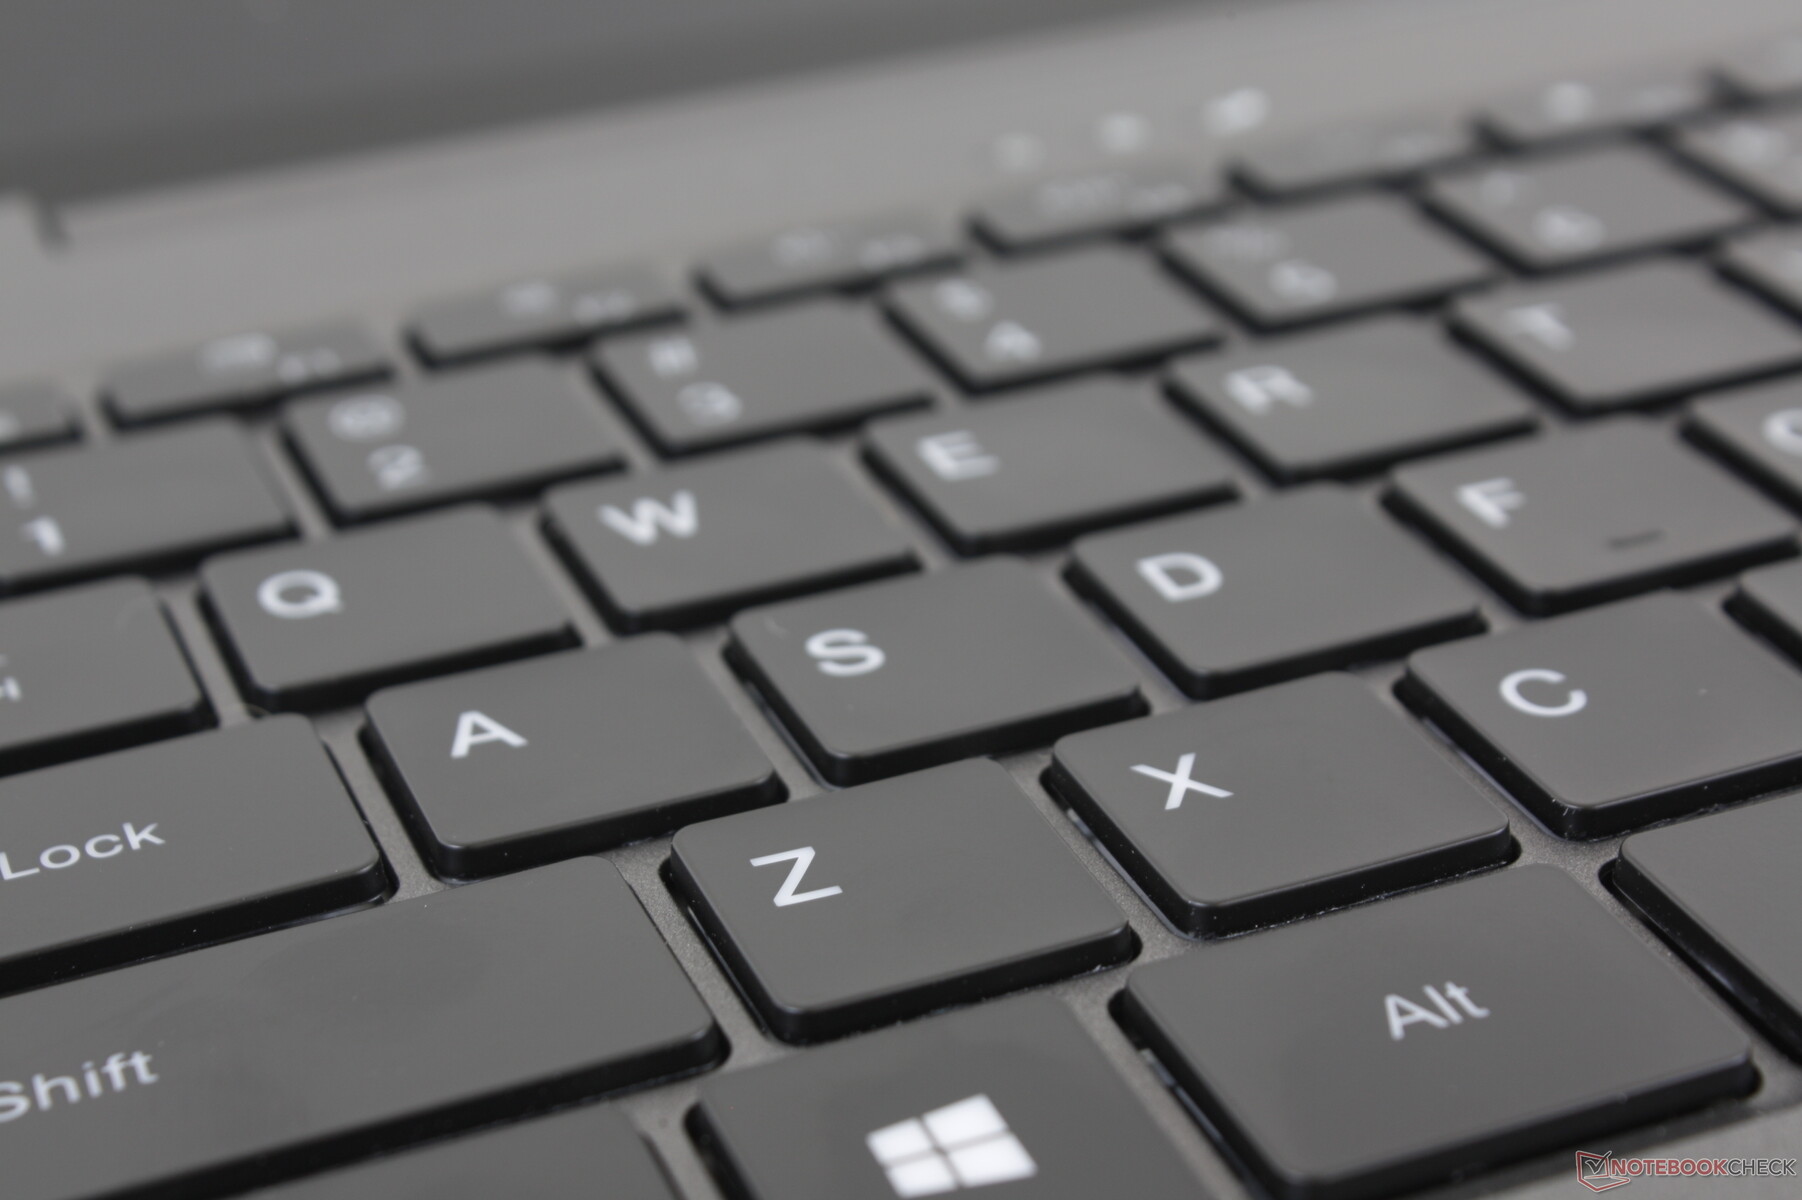
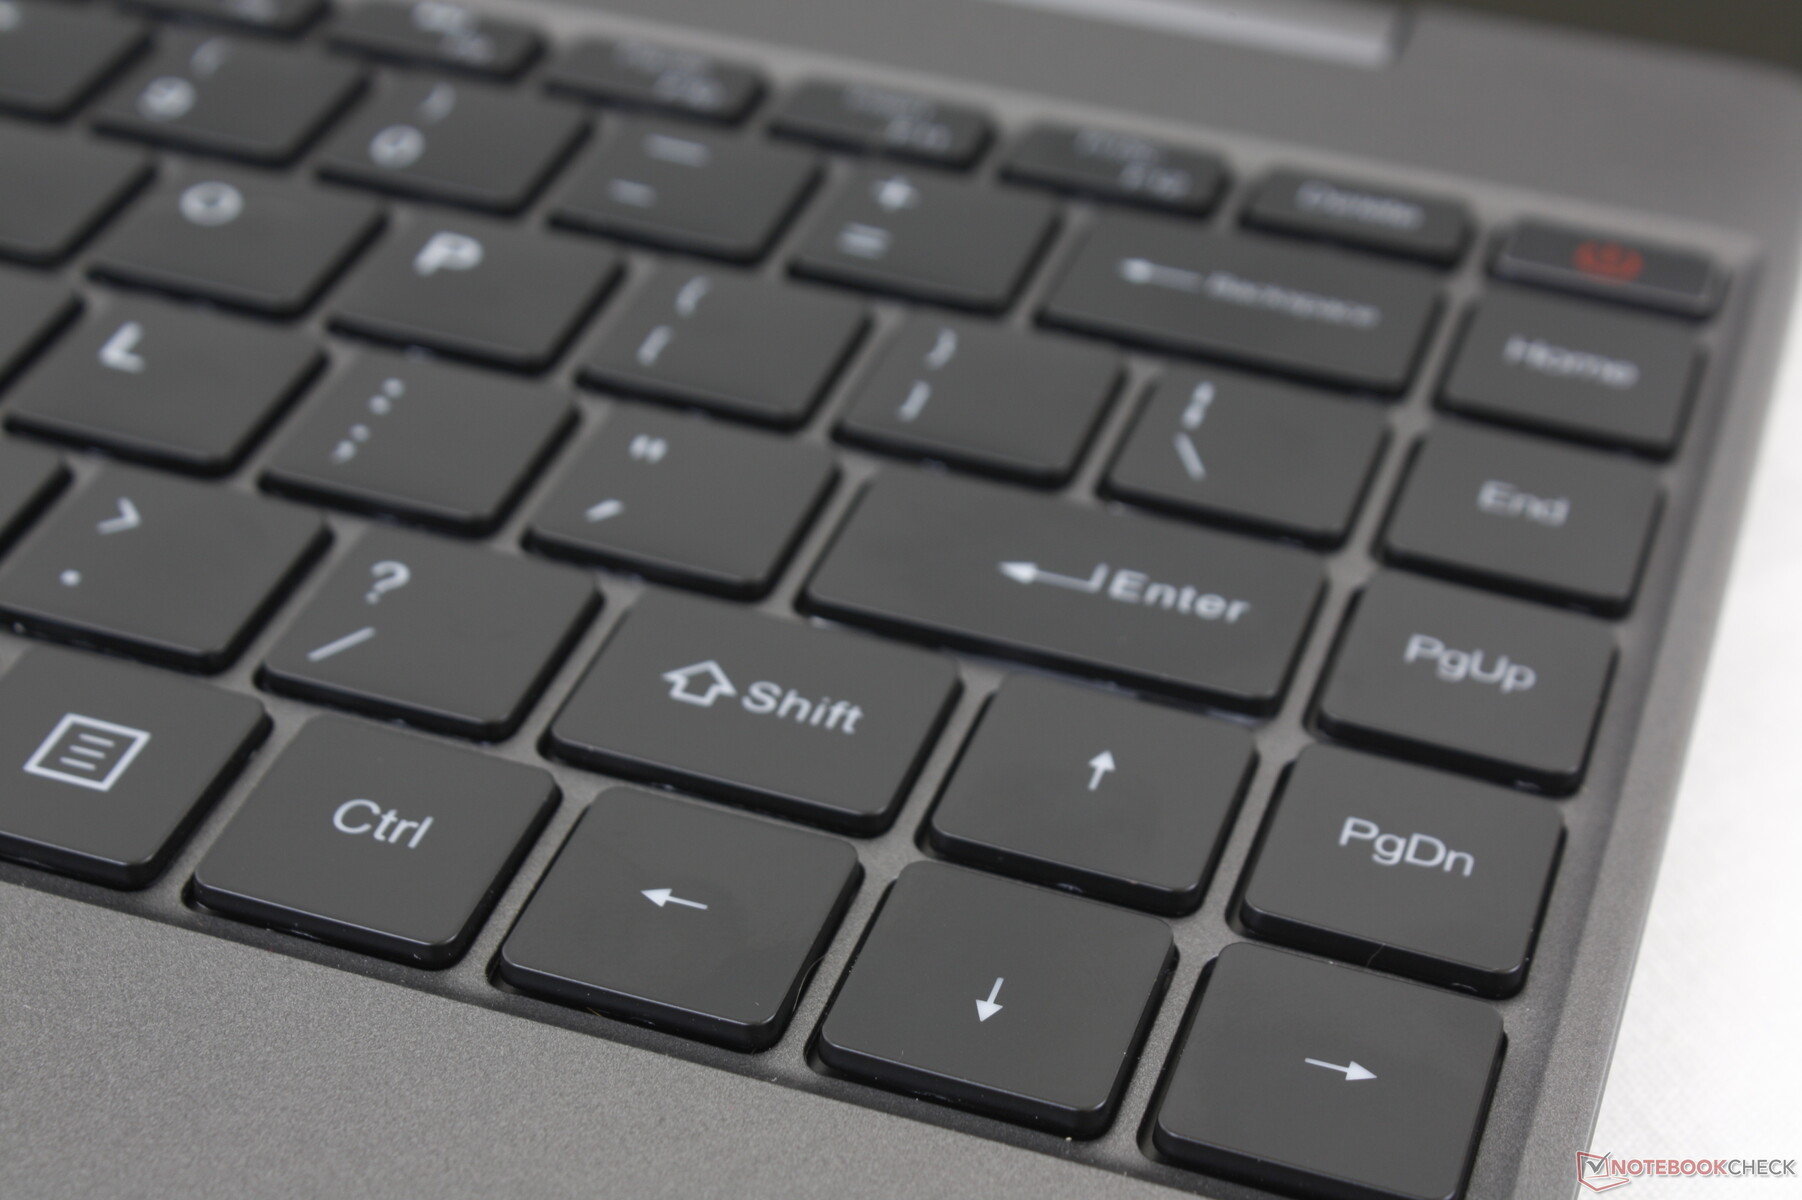
Key feedback is crisper and stronger than on most other Ultrabooks for a more satisfying typing experience. Keep in mind that the right Shift key is reduced in size to make room for the full-size arrow keys.
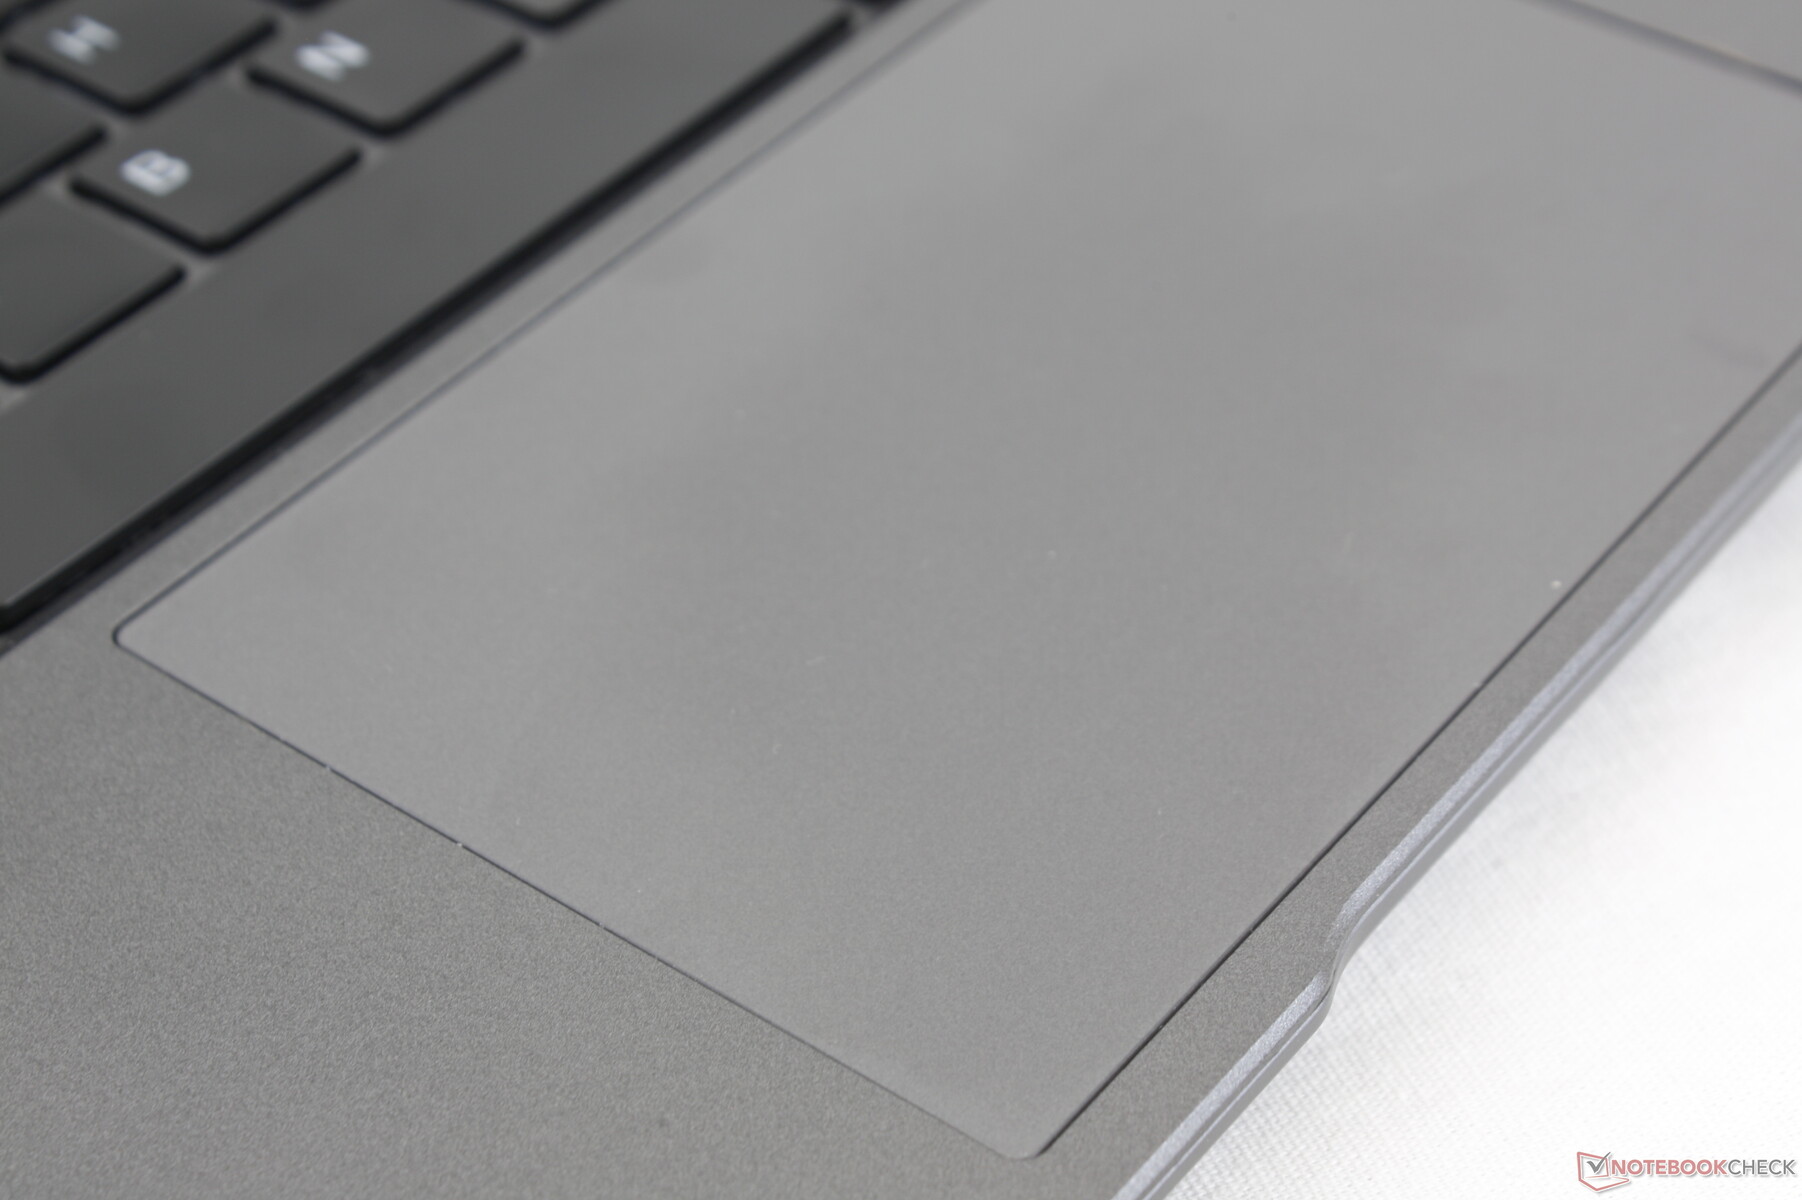
Touchpad
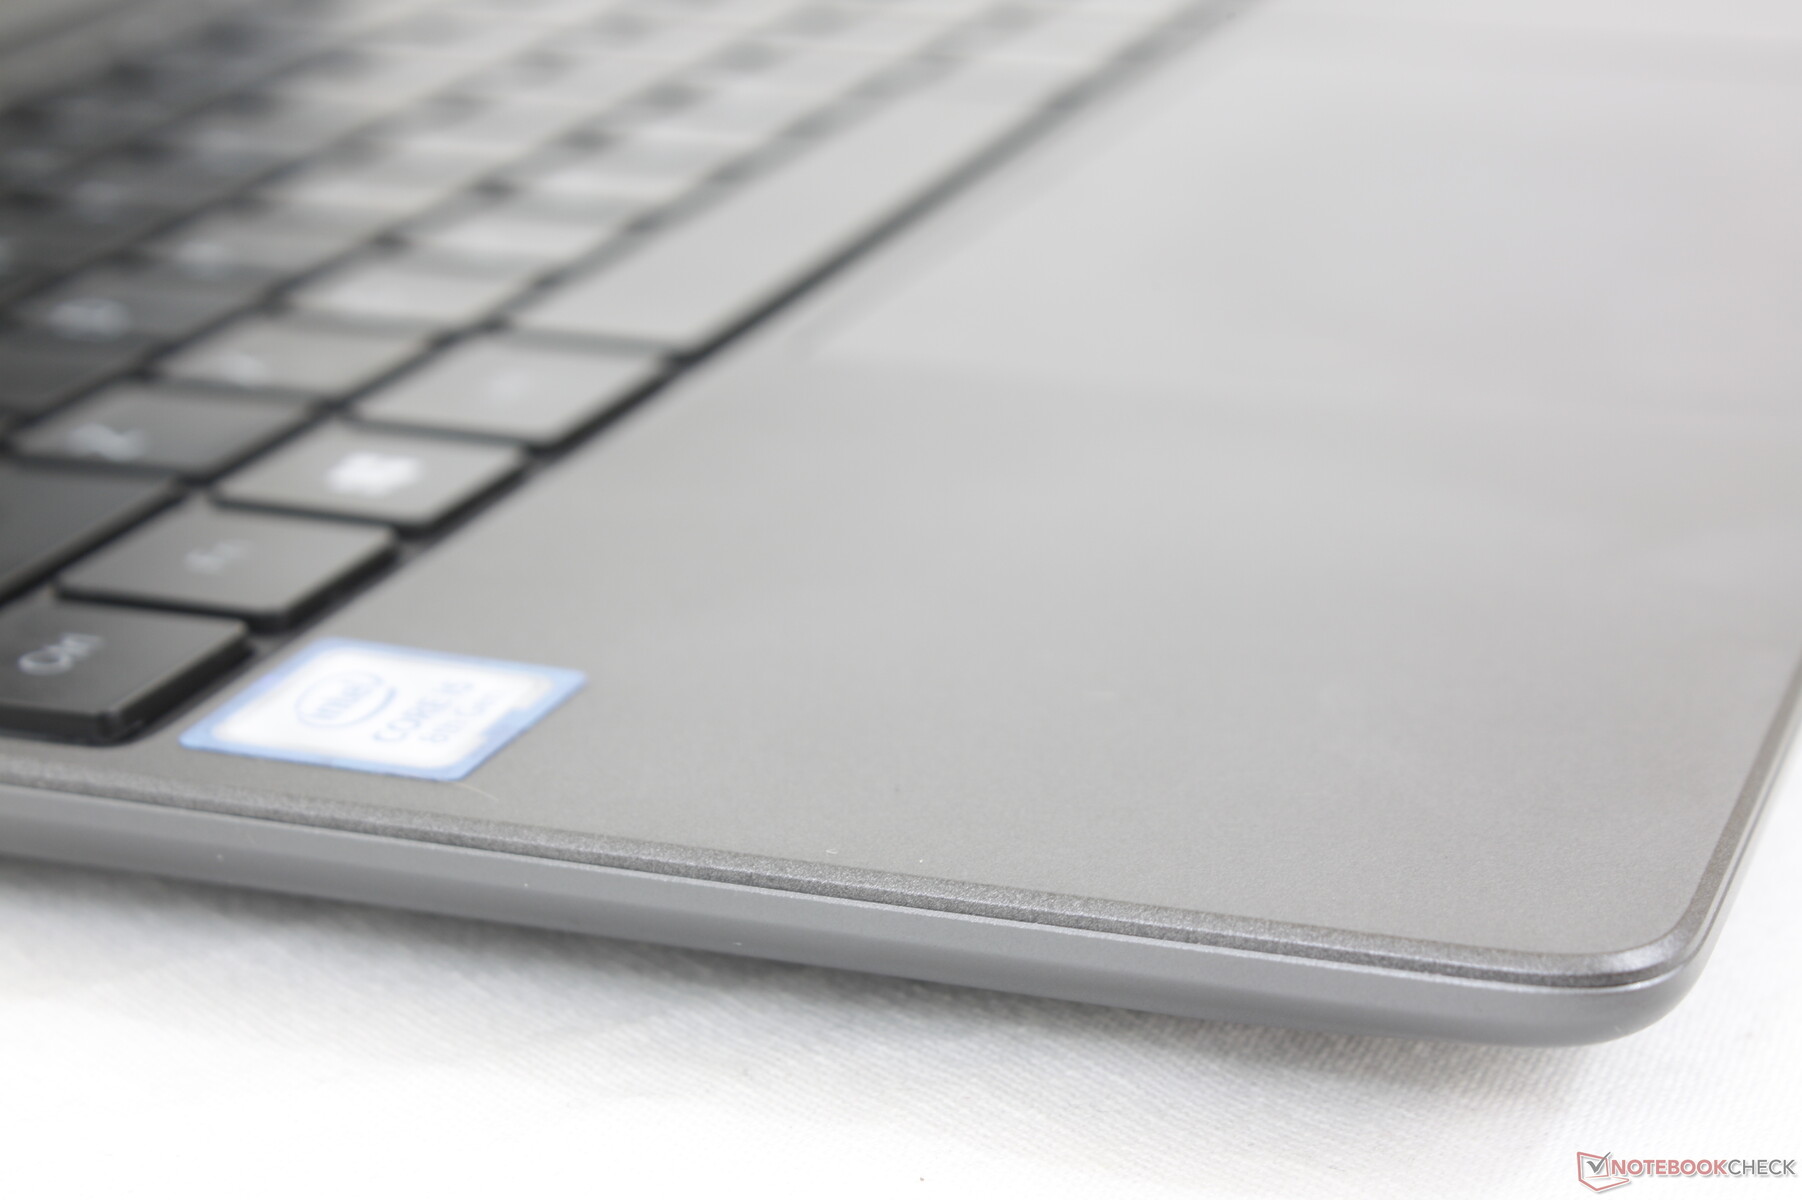
The clickpad is very roomy at 12 x 7.9 cm and it has both firmer and louder feedback than most other clickpads. The finger tends to stick a bit more when gliding across, however, and so the clickpad surface could have been smoother.
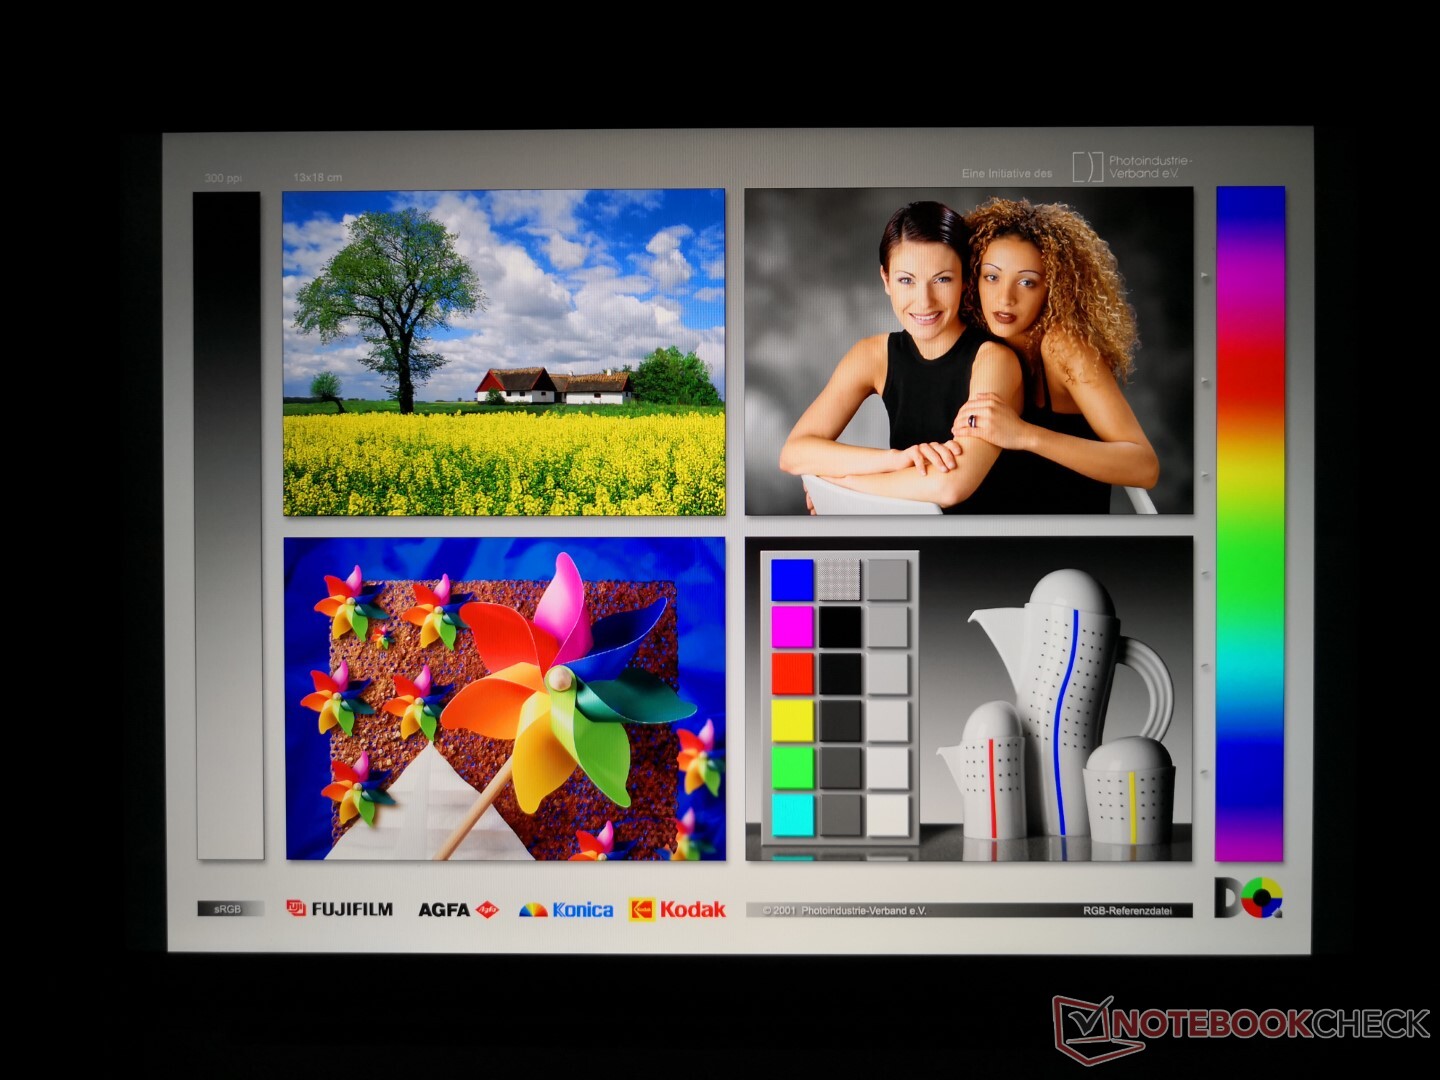
Display
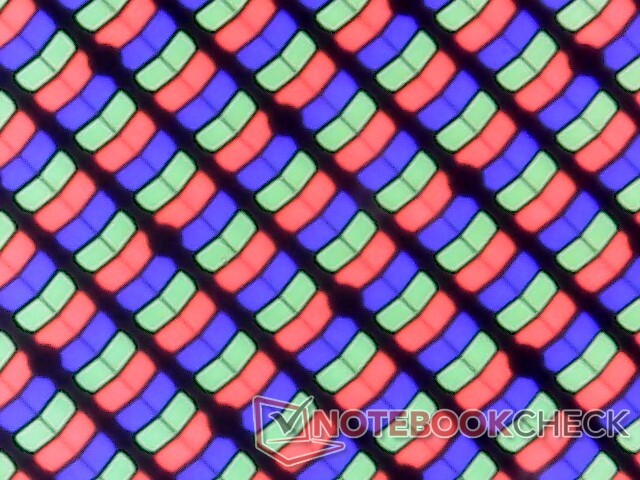
Chuwi is using the exact same P140ZKA-BZ1 IPS panel as found on the 2020 Huawei MateBook 14. This is a high quality panel with deeper contrast, brighter backlight, and wider colors than most other laptops in this budget price range including the new Infinix INBook X1.
| |||||||||||||||||||||||||
Brightness Distribution: 94 %
Center on Battery: 355.3 cd/m²
Contrast: 1045:1 (Black: 0.34 cd/m²)
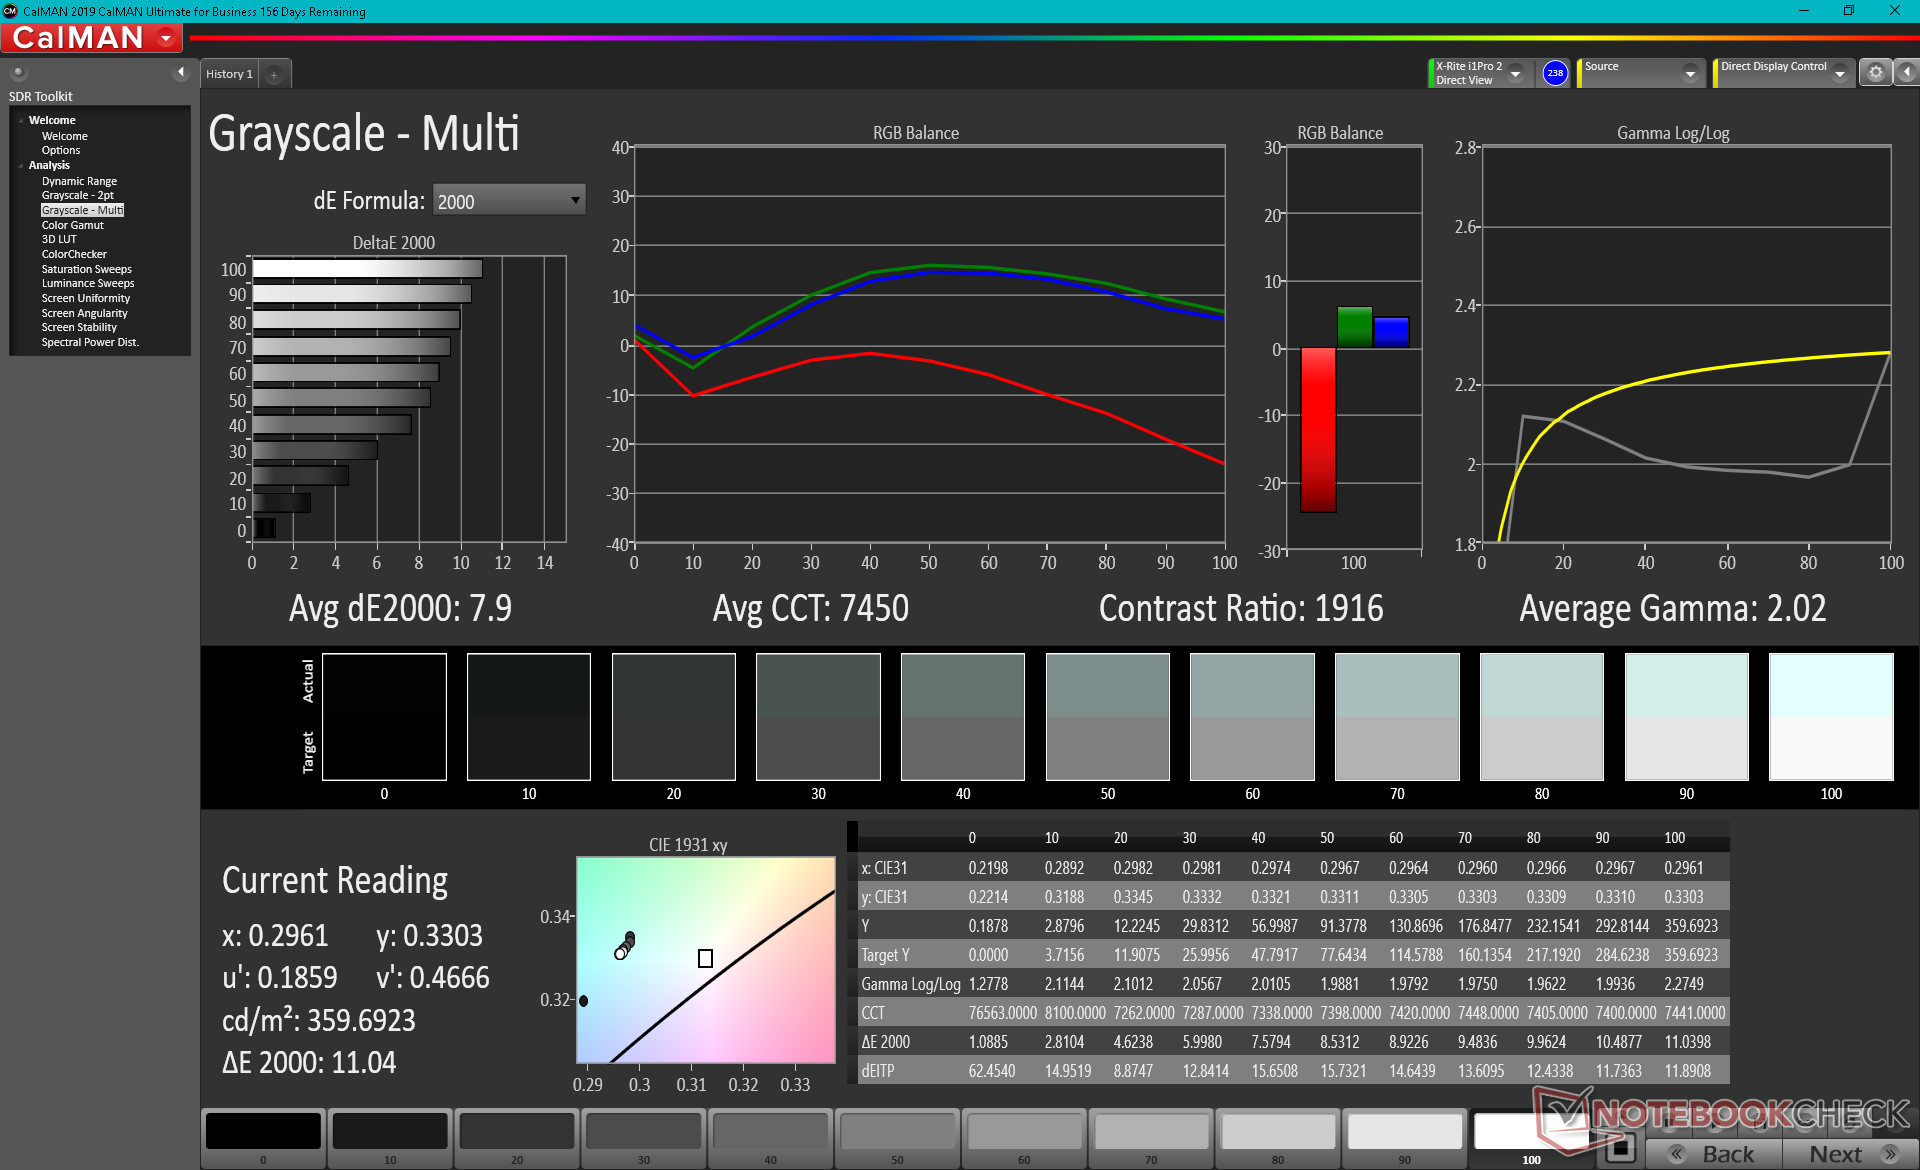
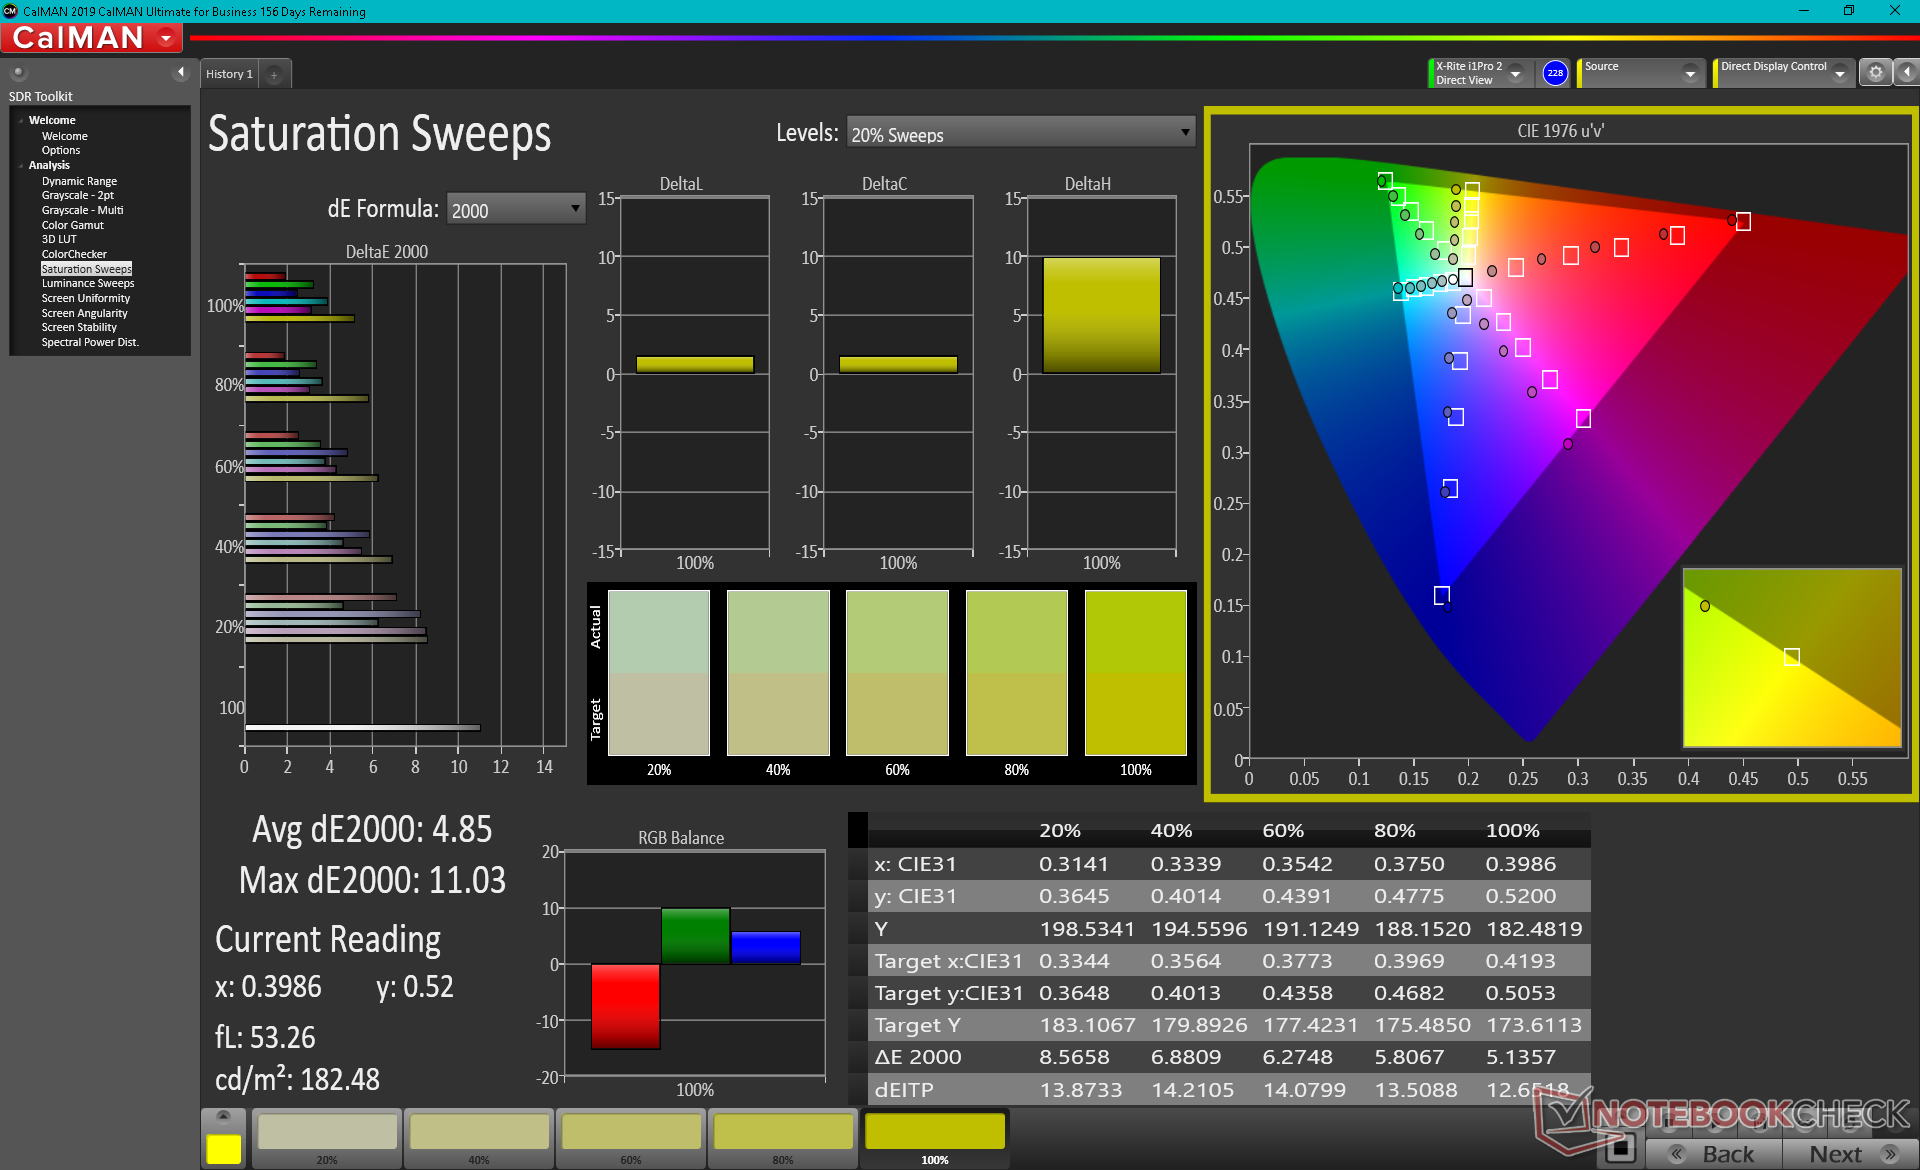
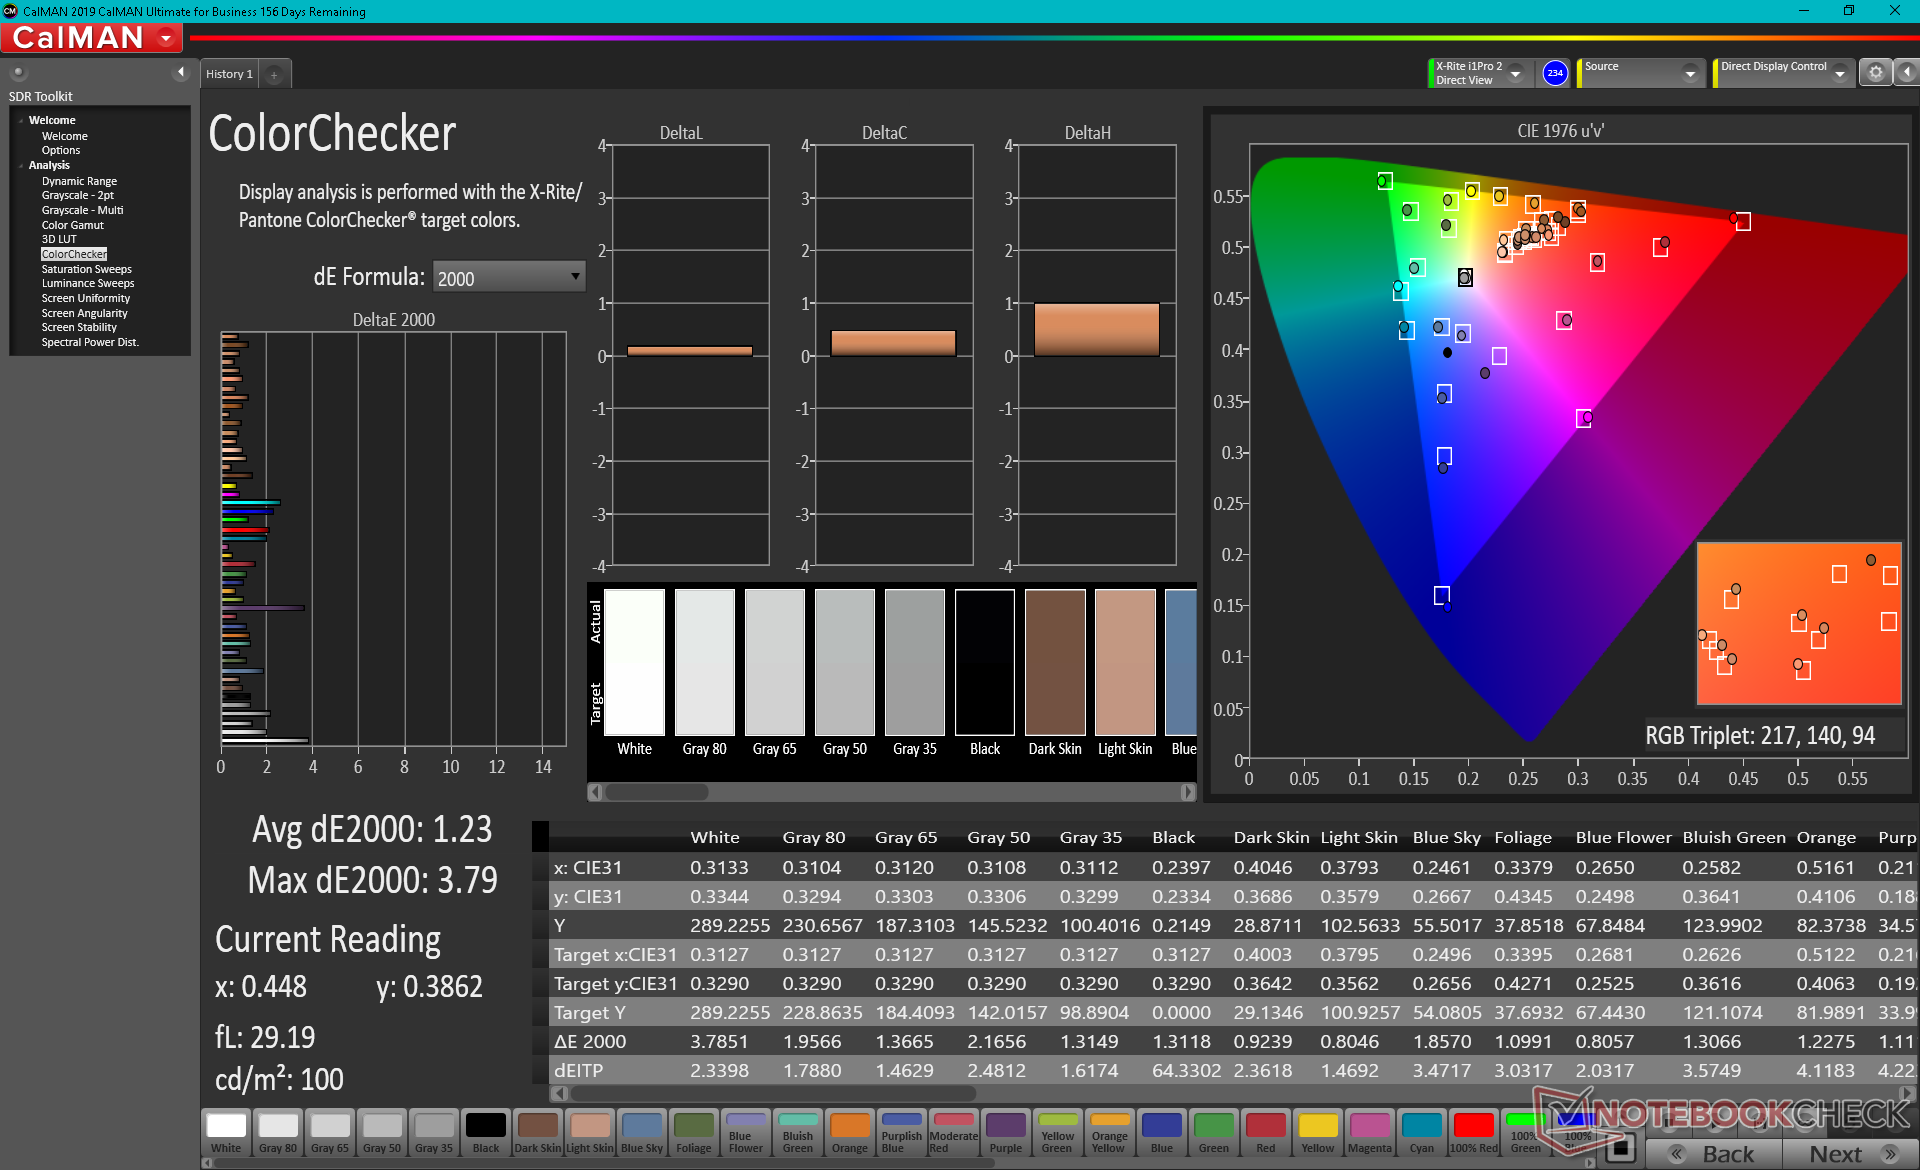
ΔE Color 6.2 | 0.5-29.43 Ø5, calibrated: 1.23
ΔE Greyscale 7.9 | 0.57-98 Ø5.3
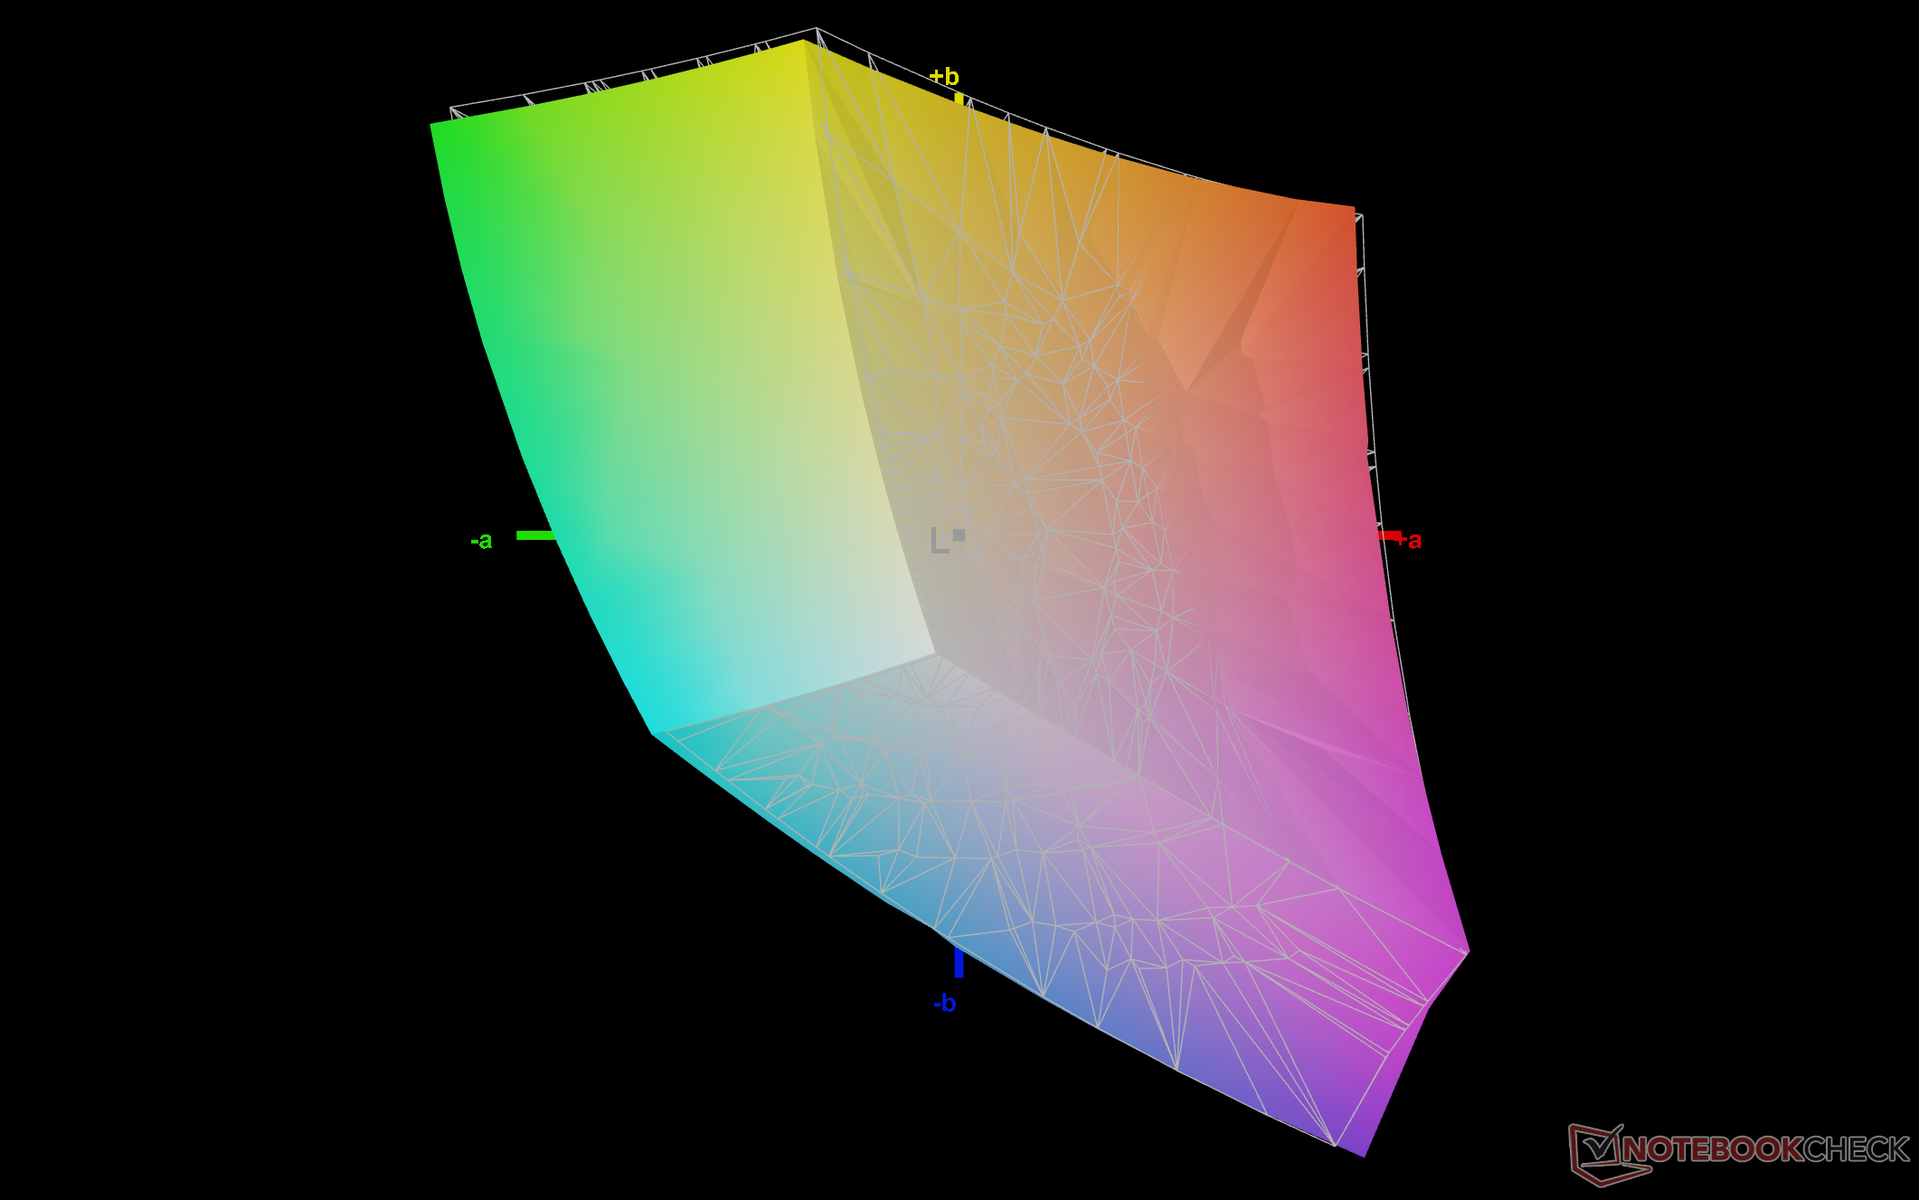
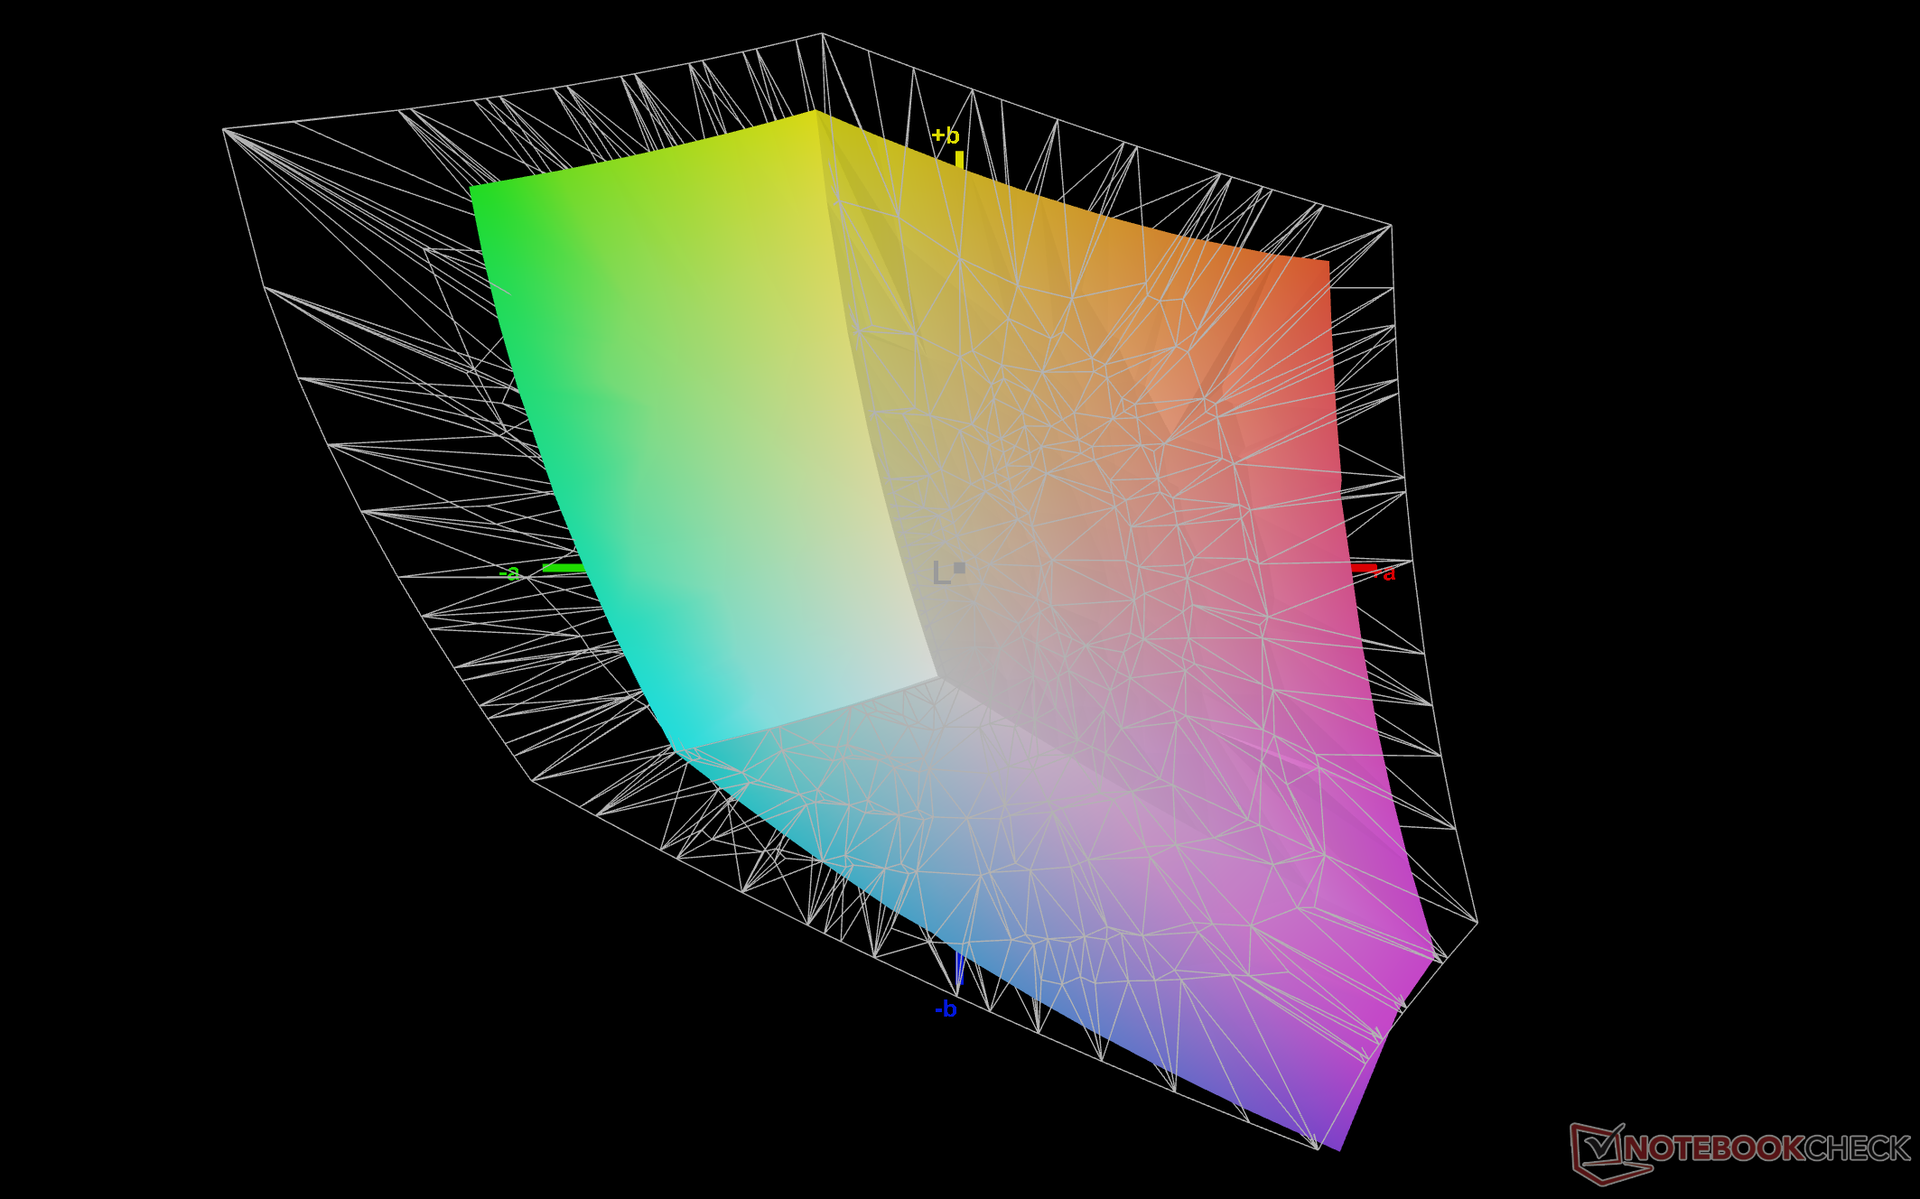
68.8% AdobeRGB 1998 (Argyll 2.2.0 3D)
98% sRGB (Argyll 2.2.0 3D)
67.2% Display P3 (Argyll 2.2.0 3D)
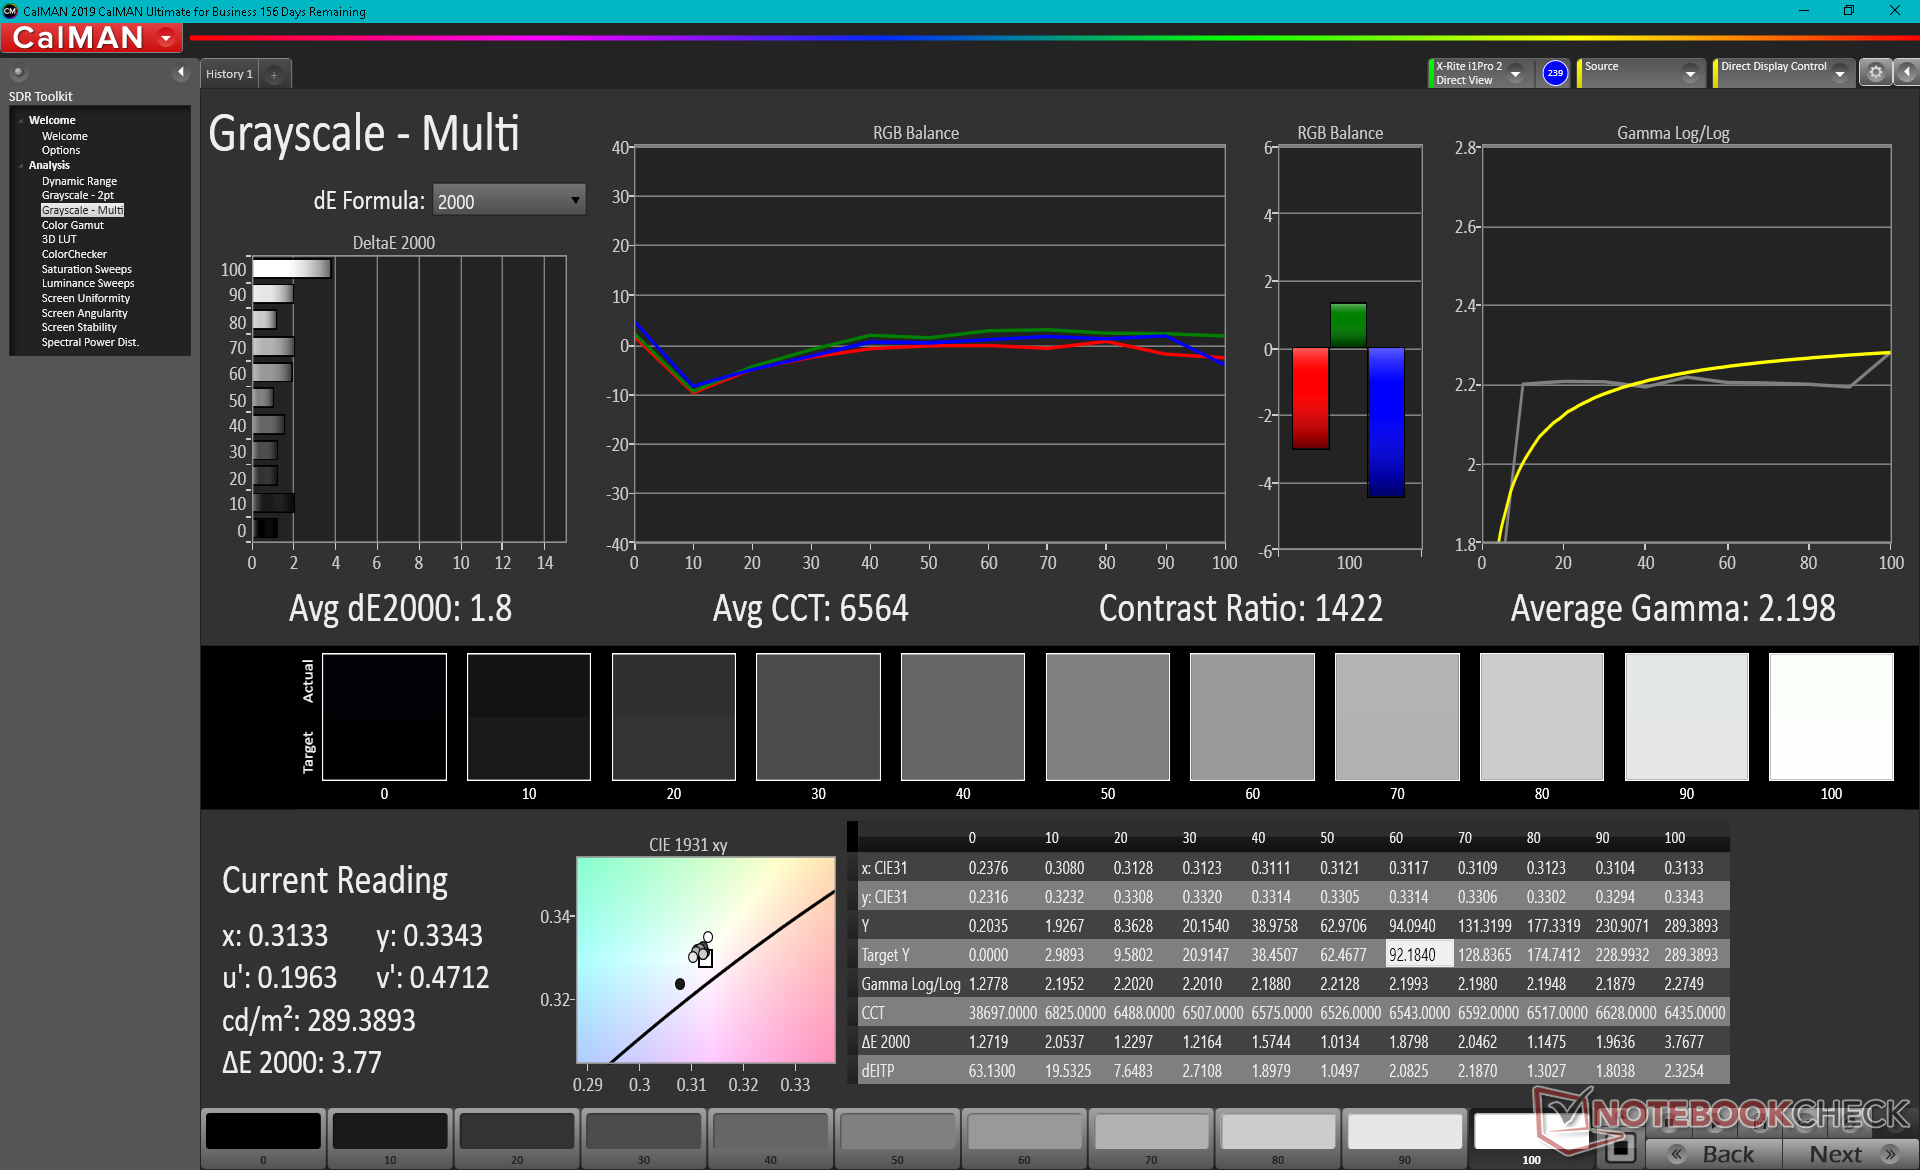
Gamma: 2.02
| Chuwi CoreBook X Chi Mei P140ZKA-BZ1, IPS, 14.00, 2160x1440 | Infinix INBook X1 Pro BOE NV140FHM-N62, IPS, 14.00, 1920x1080 | SCHENKER Vision 14 CSOT T3_MNE007ZA1_1, IPS, 14.00, 2880x1800 | Honor Magicbook 14 i7-1165G7 BOE092E, IPS, 14.00, 1920x1080 | LG Gram 14Z90P-G.AA79G LG Display LP140WU1-SPA1, IPS, 14.00, 1920x1200 | Acer Swift 5 SF514-55T-58DN AU Optronics AUO7490, IPS, 14.00, 1920x1080 | |
|---|---|---|---|---|---|---|
| Display | -7% | 8% | -3% | 24% | -0% | |
| Display P3 Coverage | 67.2 | 65.7 -2% | 75.4 12% | 64.8 -4% | 97.6 45% | 67 0% |
| sRGB Coverage | 98 | 86.6 -12% | 99 1% | 96.3 -2% | 99.9 2% | 98.3 0% |
| AdobeRGB 1998 Coverage | 68.8 | 63.3 -8% | 76.4 11% | 66.1 -4% | 85.3 24% | 68.3 -1% |
| Response Times | -46% | 17% | 21% | -6% | 33% | |
| Response Time Grey 50% / Grey 80% * | 36.4 ? | 43.2 ? -19% | 32.8 ? 10% | 31.2 ? 14% | 45 ? -24% | 30 ? 18% |
| Response Time Black / White * | 26.4 ? | 32 ? -21% | 20.4 ? 23% | 19.2 ? 27% | 23 ? 13% | 14 ? 47% |
| PWM Frequency | 10000 ? | 200 ? -98% | ||||
| Screen | -31% | 21% | 25% | 9% | 39% | |
| Brightness middle | 355.3 | 282 -21% | 390 10% | 341 -4% | 352 -1% | 404 14% |
| Brightness | 344 | 271 -21% | 387 13% | 313 -9% | 332 -3% | 377 10% |
| Brightness Distribution | 94 | 74 -21% | 94 0% | 87 -7% | 91 -3% | 79 -16% |
| Black Level * | 0.34 | 0.24 29% | 0.29 15% | 0.27 21% | 0.22 35% | 0.25 26% |
| Contrast | 1045 | 1175 12% | 1345 29% | 1263 21% | 1600 53% | 1616 55% |
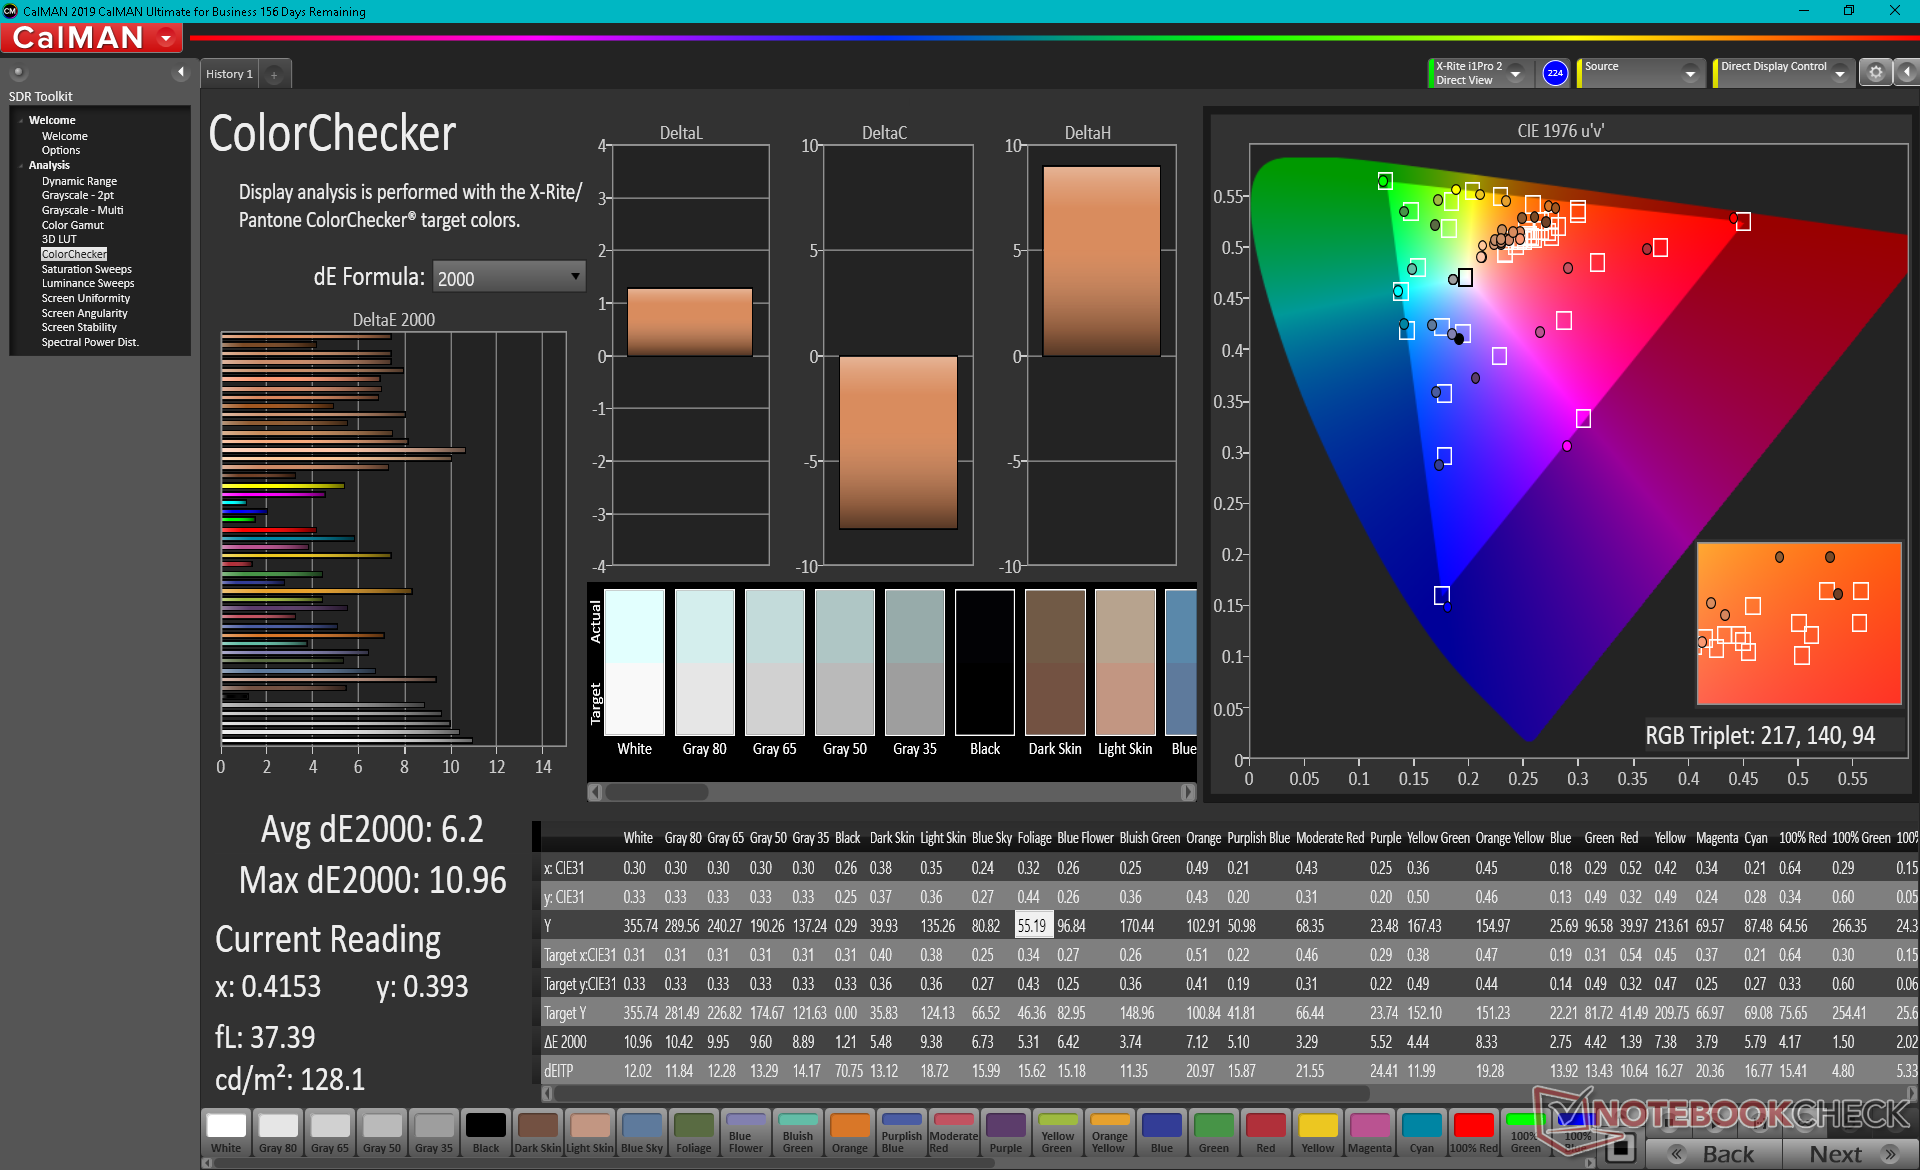
| Colorchecker dE 2000 * | 6.2 | 6.1 2% | 2.8 55% | 1.76 72% | 2.89 53% | 1.47 76% |
| Colorchecker dE 2000 max. * | 10.96 | 14.05 -28% | 4.4 60% | 4.85 56% | 4.66 57% | 2.6 76% |
| Colorchecker dE 2000 calibrated * | 1.23 | 3.94 -220% | 1.8 -46% | 1.01 18% | 2.7 -120% | 0.84 32% |
| Greyscale dE 2000 * | 7.9 | 8.7 -10% | 3.5 56% | 3.3 58% | 6.9 13% | 1.7 78% |
| Gamma | 2.02 109% | 2.14 103% | 2.24 98% | 2.26 97% | 2.34 94% | 2.35 94% |
| CCT | 7450 87% | 8672 75% | 6174 105% | 7233 90% | 7904 82% | 6662 98% |
| Color Space (Percent of AdobeRGB 1998) | 76.4 | 66 | 76 | 63 | ||
| Color Space (Percent of sRGB) | 99 | 89 | 100 | 98 | ||
| Total Average (Program / Settings) | -28% /
-29% | 15% /
18% | 14% /
18% | 9% /
10% | 24% /
30% |
* ... smaller is better
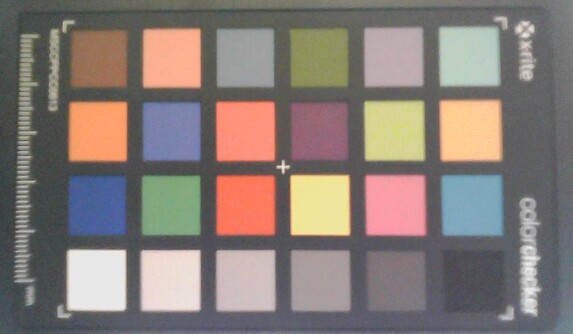
Color space covers all of the sRGB standard which is very impressive for such a cheap laptop. The displays on Chuwi laptops are typically of higher quality than the rest of the laptop and the CoreBook X continues this trend.
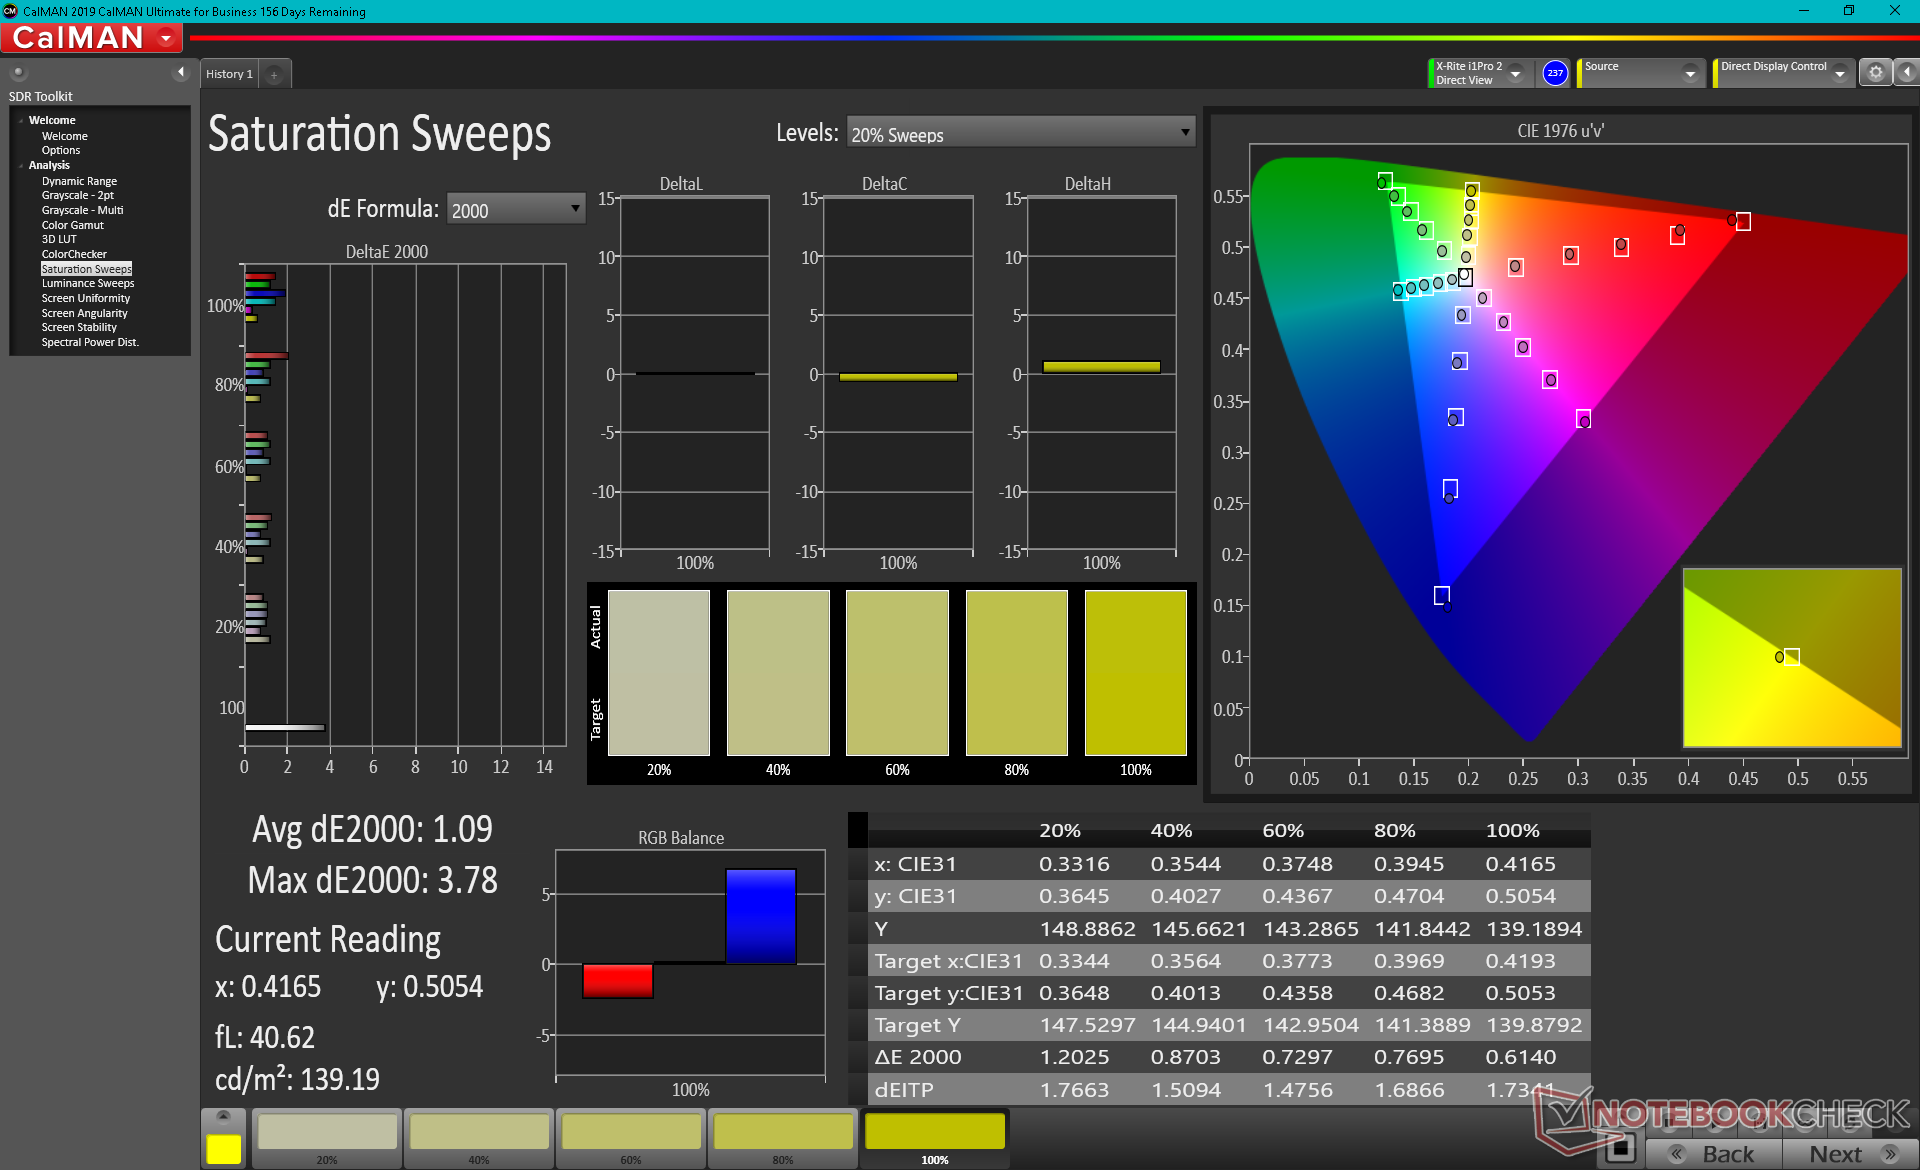
X-Rite colorimeter measurements reveal a very poorly calibrated display out of the box in spite of the impressive color coverage mentioned above. In short, the manufacturer sourced high quality panels from Chi Mei but it didn't have the resources to calibrate each one at factory. We highly recommend calibrating the panel or applying our ICC profile above to get the most out of the display. Grayscale and color deltaE values would improve significantly as shown by our CalMAN results below.
Display Response Times
| ↔ Response Time Black to White | ||
|---|---|---|
| 26.4 ms ... rise ↗ and fall ↘ combined | ↗ 13.2 ms rise | 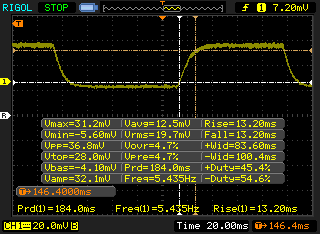 |
| ↘ 13.2 ms fall | ||
| The screen shows relatively slow response rates in our tests and may be too slow for gamers. In comparison, all tested devices range from 0.1 (minimum) to 240 (maximum) ms. » 61 % of all devices are better. This means that the measured response time is worse than the average of all tested devices (21.5 ms). | ||
| ↔ Response Time 50% Grey to 80% Grey | ||
| 36.4 ms ... rise ↗ and fall ↘ combined | ↗ 18.4 ms rise | 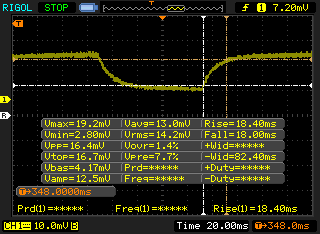 |
| ↘ 18 ms fall | ||
| The screen shows slow response rates in our tests and will be unsatisfactory for gamers. In comparison, all tested devices range from 0.2 (minimum) to 636 (maximum) ms. » 46 % of all devices are better. This means that the measured response time is similar to the average of all tested devices (33.7 ms). | ||
Screen Flickering / PWM (Pulse-Width Modulation)
| Screen flickering / PWM detected | 10000 Hz | ≤ 99 % brightness setting | 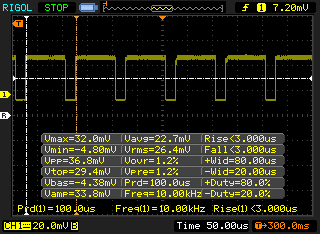 |
The display backlight flickers at 10000 Hz (worst case, e.g., utilizing PWM) Flickering detected at a brightness setting of 99 % and below. There should be no flickering or PWM above this brightness setting. The frequency of 10000 Hz is quite high, so most users sensitive to PWM should not notice any flickering. In comparison: 53 % of all tested devices do not use PWM to dim the display. If PWM was detected, an average of 17900 (minimum: 5 - maximum: 3846000) Hz was measured. | |||
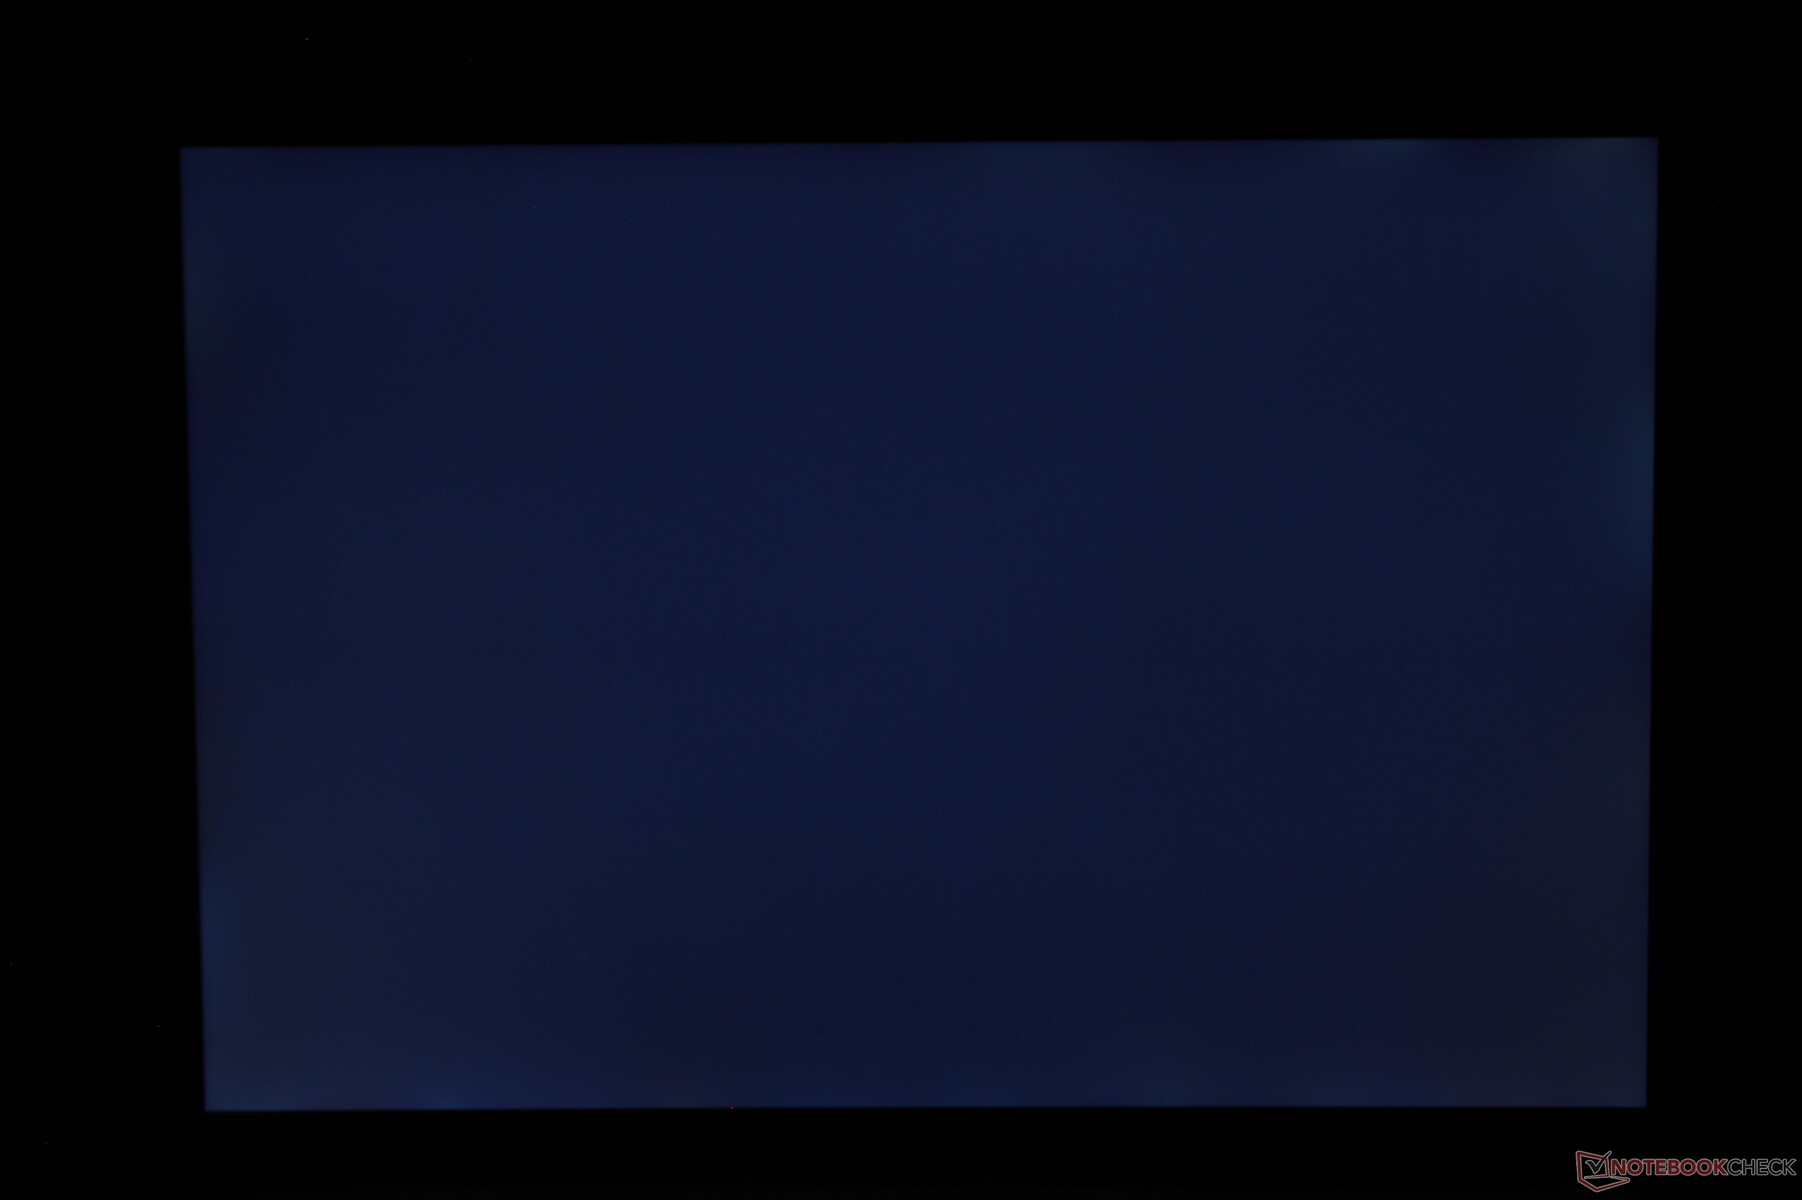
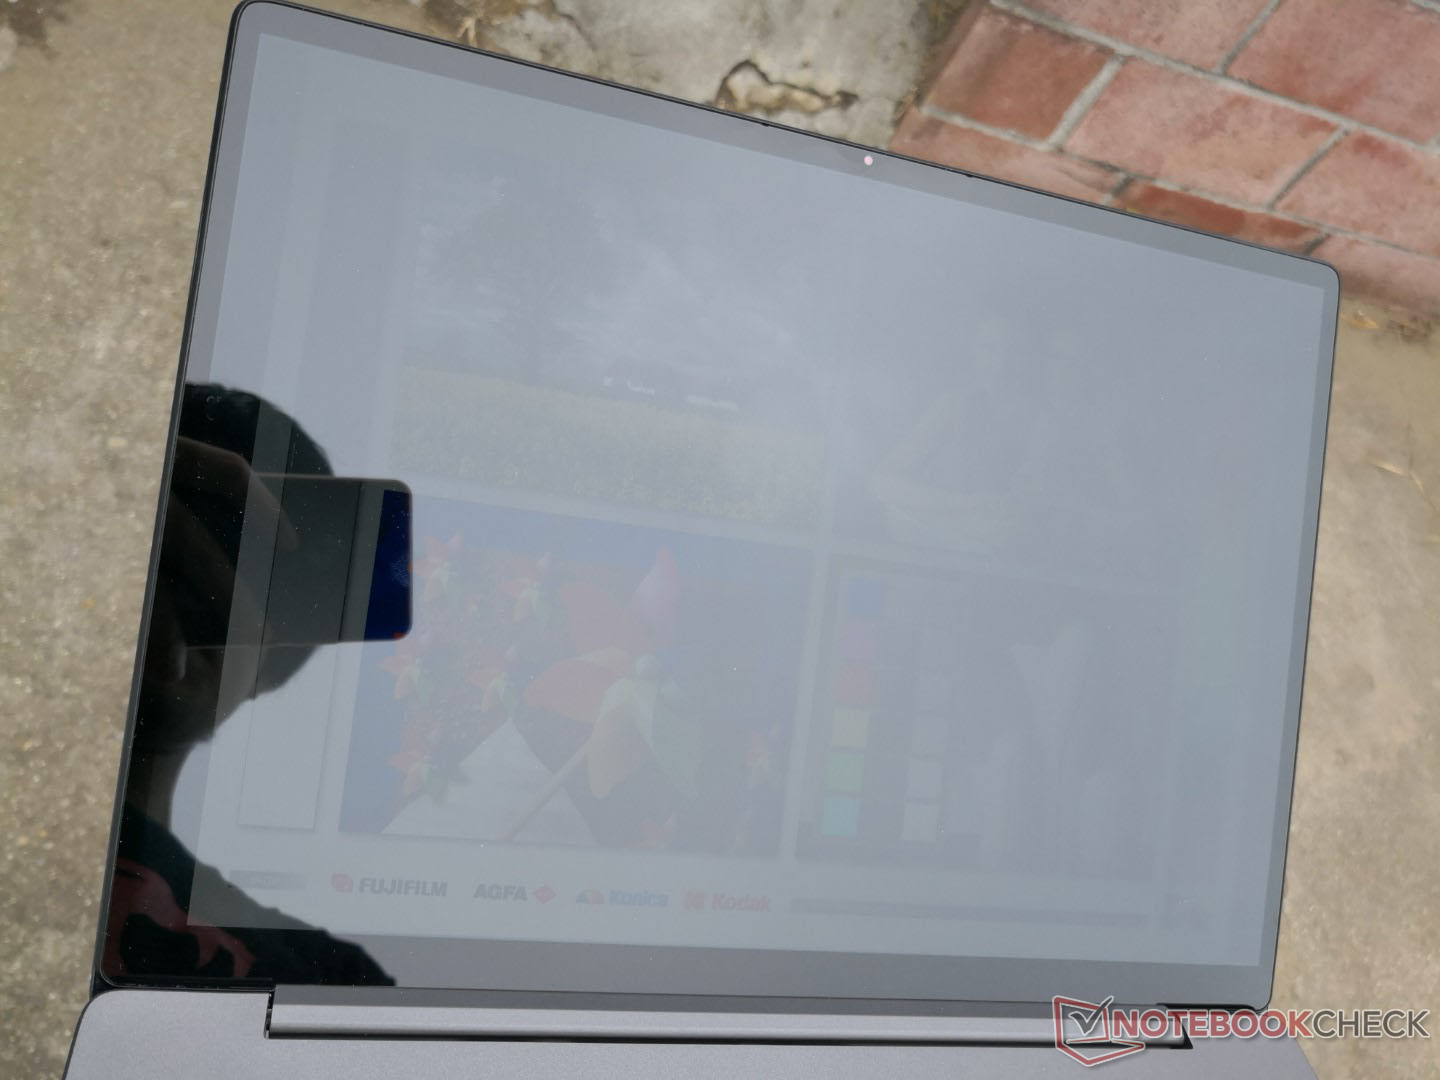
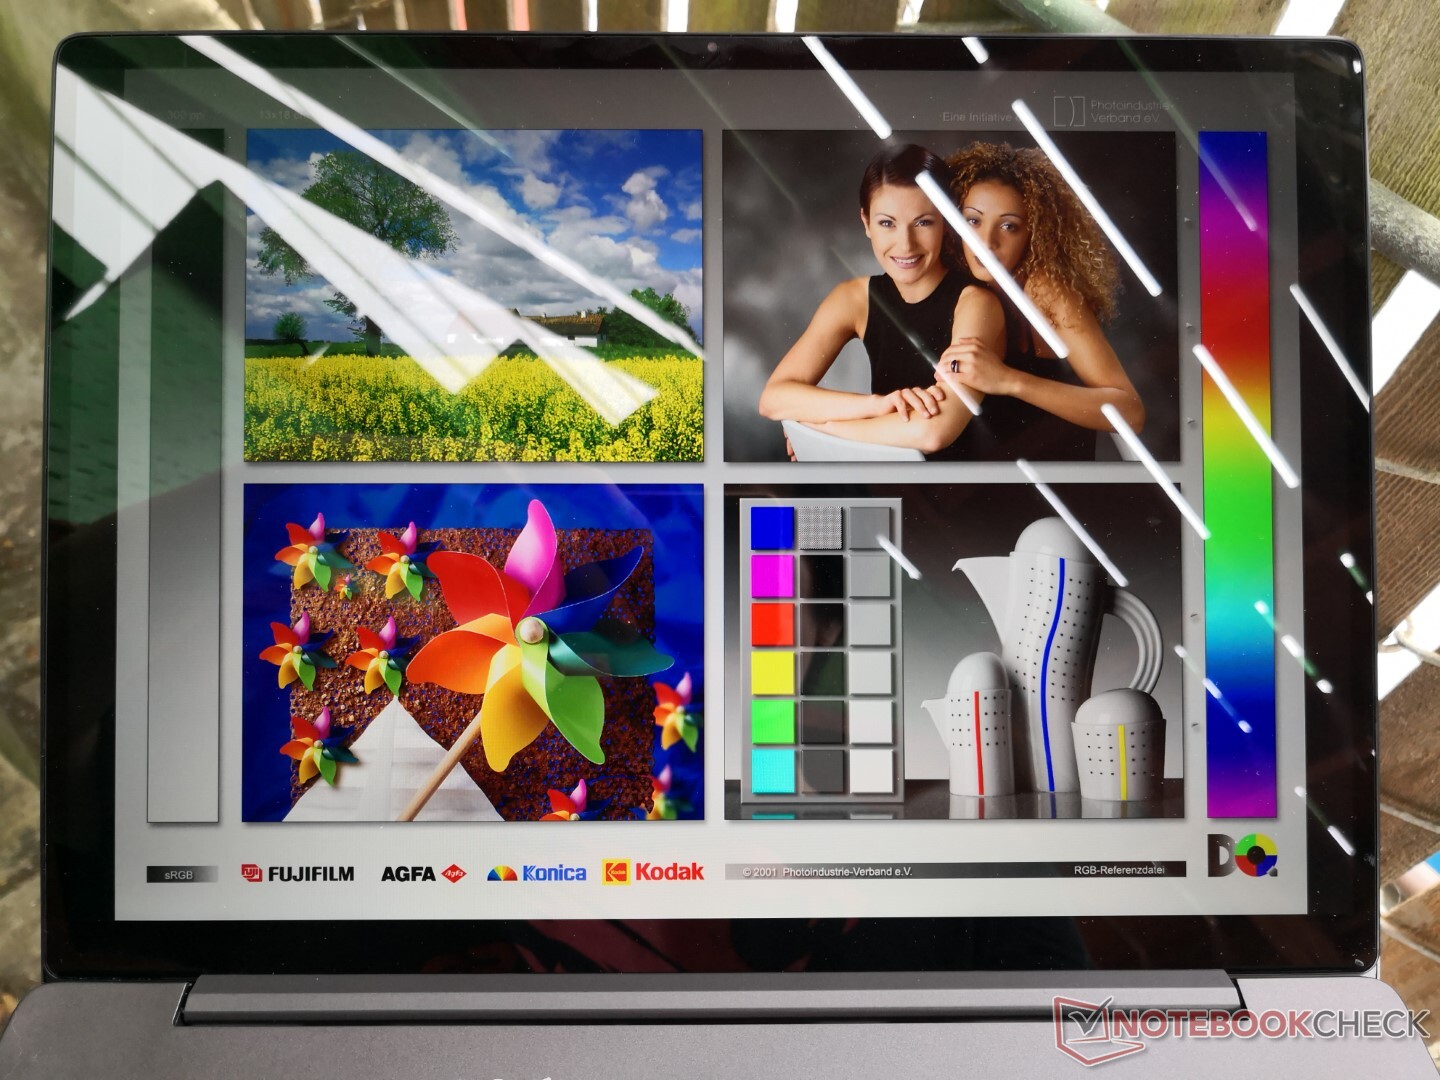
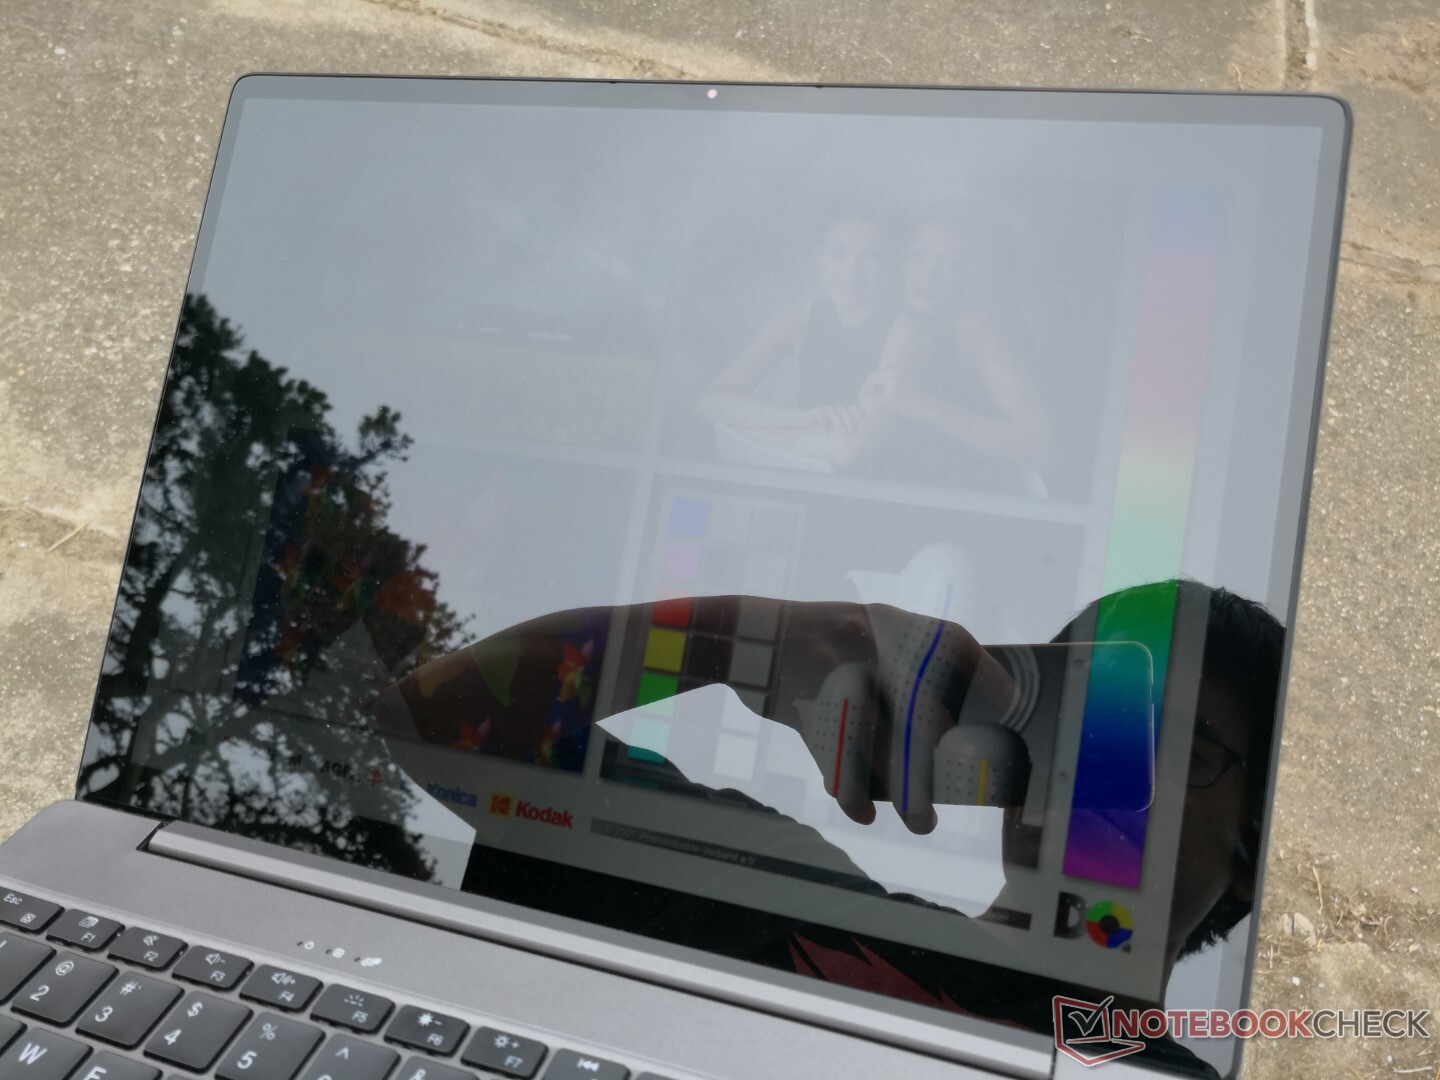
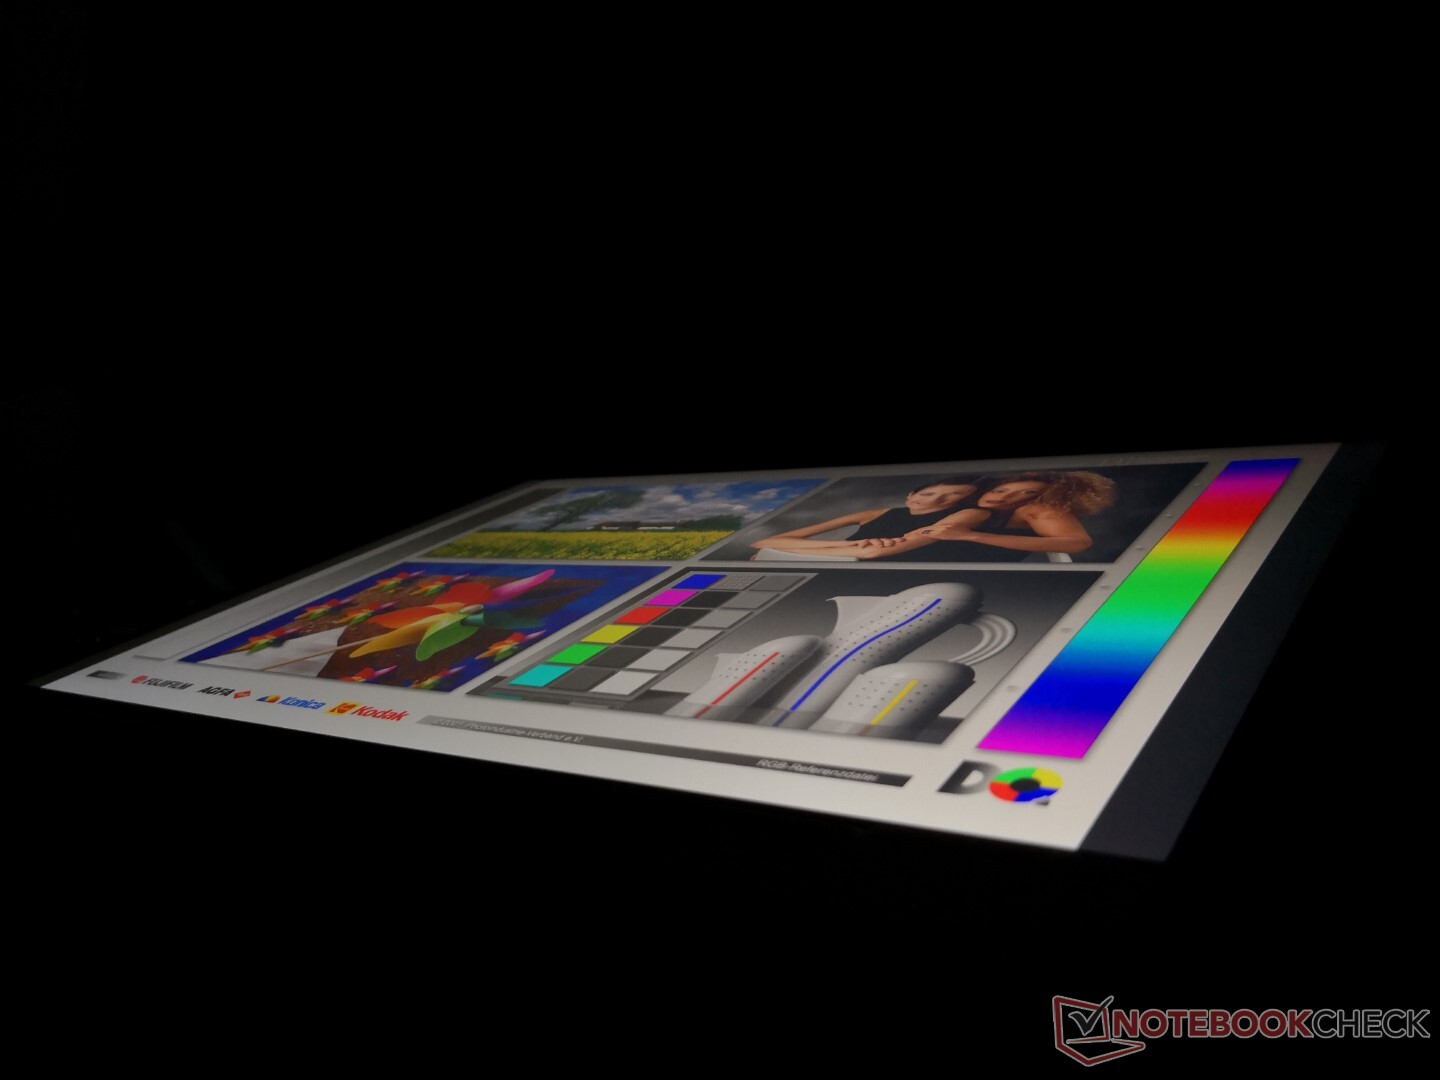
Outdoor visibility is limited since the glossy screen contributes to the heavy glare. The backlight, while far from dim when indoors, just isn't bright enough to overcome outdoor ambient lighting.
Performance
Processor
CPU performance is a just a few percentage points behind the average laptop in our database equipped with the same Core i5-8259U CPU including Apple's 2018 MacBook Pro 13. In general, performance is most similar to the Core i5-8265U while being significantly faster than any Core i3, Celeron, or Atom solution which usually come with fewer cores and threads.
Cinebench R23: Multi Core | Single Core
Cinebench R15: CPU Multi 64Bit | CPU Single 64Bit
Blender: v2.79 BMW27 CPU
7-Zip 18.03: 7z b 4 -mmt1 | 7z b 4
Geekbench 5.5: Single-Core | Multi-Core
HWBOT x265 Benchmark v2.2: 4k Preset
LibreOffice : 20 Documents To PDF
R Benchmark 2.5: Overall mean
| Cinebench R23 / Multi Core | |
| Lenovo Yoga Slim 7 14ARE05 82A20008GE | |
| Infinix INBook X1 Pro | |
| LG Gram 14Z90P-G.AA79G | |
| Acer Spin 3 SP314-54N-56S5 | |
| Average Intel Core i5-8259U (3592 - 4025, n=5) | |
| Chuwi CoreBook X | |
| Cinebench R23 / Single Core | |
| LG Gram 14Z90P-G.AA79G | |
| Lenovo Yoga Slim 7 14ARE05 82A20008GE | |
| Infinix INBook X1 Pro | |
| Acer Spin 3 SP314-54N-56S5 | |
| Chuwi CoreBook X | |
| Average Intel Core i5-8259U (959 - 991, n=4) | |
Cinebench R23: Multi Core | Single Core
Cinebench R15: CPU Multi 64Bit | CPU Single 64Bit
Blender: v2.79 BMW27 CPU
7-Zip 18.03: 7z b 4 -mmt1 | 7z b 4
Geekbench 5.5: Single-Core | Multi-Core
HWBOT x265 Benchmark v2.2: 4k Preset
LibreOffice : 20 Documents To PDF
R Benchmark 2.5: Overall mean
* ... smaller is better
System Performance
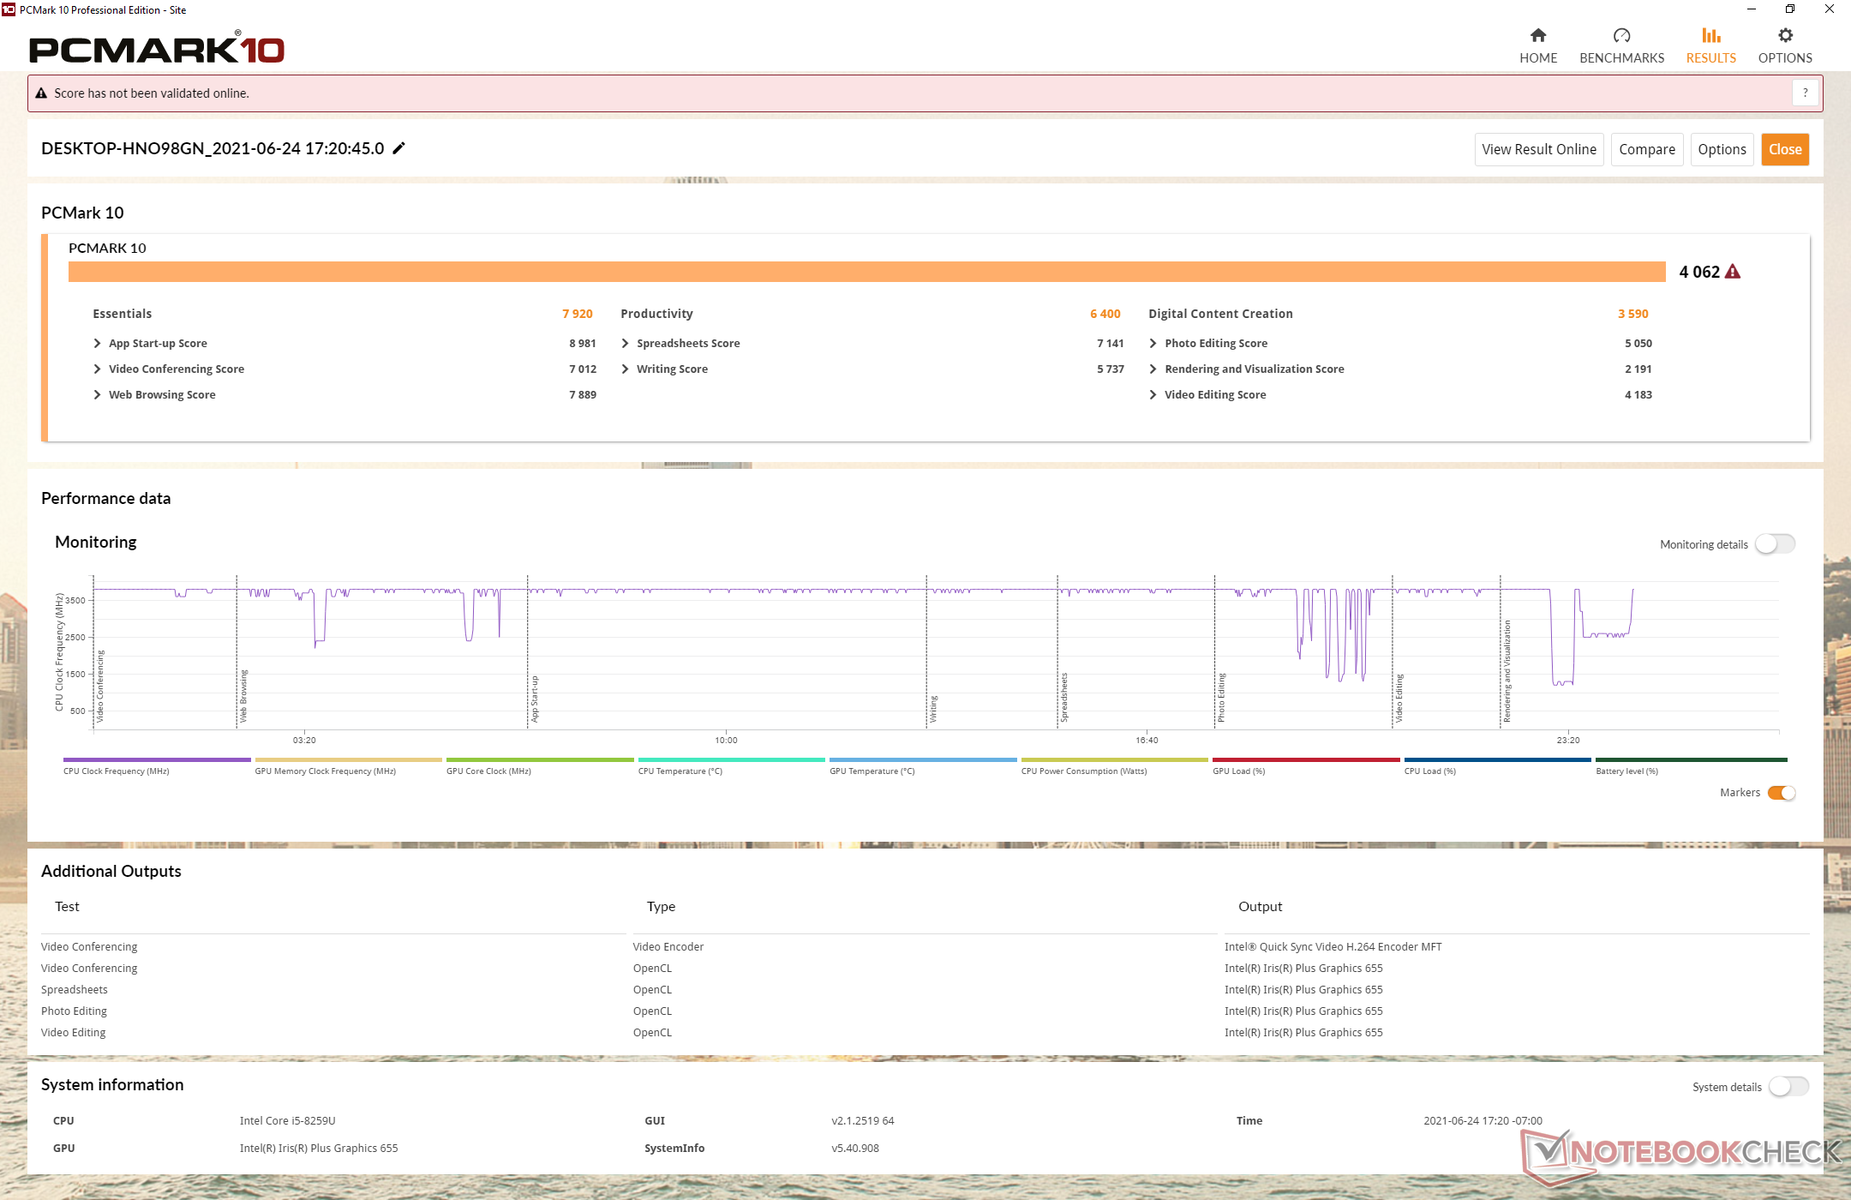
PCMark scores are consistently below laptops with newer 10th gen or 11th gen Intel CPUs especially in Digital Content Creation where Iris Xe can flex its muscles against the now-outdated Iris Plus 655 series.
| PCMark 10 / Score | |
| SCHENKER Vision 14 | |
| Honor Magicbook 14 i7-1165G7 | |
| LG Gram 14Z90P-G.AA79G | |
| Acer Swift 5 SF514-55T-58DN | |
| Infinix INBook X1 Pro | |
| Chuwi CoreBook X | |
| Average Intel Core i5-8259U, Intel Iris Plus Graphics 655 (3284 - 4132, n=6) | |
| PCMark 10 / Essentials | |
| SCHENKER Vision 14 | |
| LG Gram 14Z90P-G.AA79G | |
| Honor Magicbook 14 i7-1165G7 | |
| Acer Swift 5 SF514-55T-58DN | |
| Infinix INBook X1 Pro | |
| Average Intel Core i5-8259U, Intel Iris Plus Graphics 655 (7364 - 8351, n=6) | |
| Chuwi CoreBook X | |
| PCMark 10 / Productivity | |
| LG Gram 14Z90P-G.AA79G | |
| SCHENKER Vision 14 | |
| Honor Magicbook 14 i7-1165G7 | |
| Acer Swift 5 SF514-55T-58DN | |
| Chuwi CoreBook X | |
| Infinix INBook X1 Pro | |
| Average Intel Core i5-8259U, Intel Iris Plus Graphics 655 (4390 - 6400, n=6) | |
| PCMark 10 / Digital Content Creation | |
| SCHENKER Vision 14 | |
| Honor Magicbook 14 i7-1165G7 | |
| Acer Swift 5 SF514-55T-58DN | |
| LG Gram 14Z90P-G.AA79G | |
| Infinix INBook X1 Pro | |
| Chuwi CoreBook X | |
| Average Intel Core i5-8259U, Intel Iris Plus Graphics 655 (2679 - 3902, n=6) | |
| PCMark 10 Score | 4062 points | |
Help | ||
DPC Latency
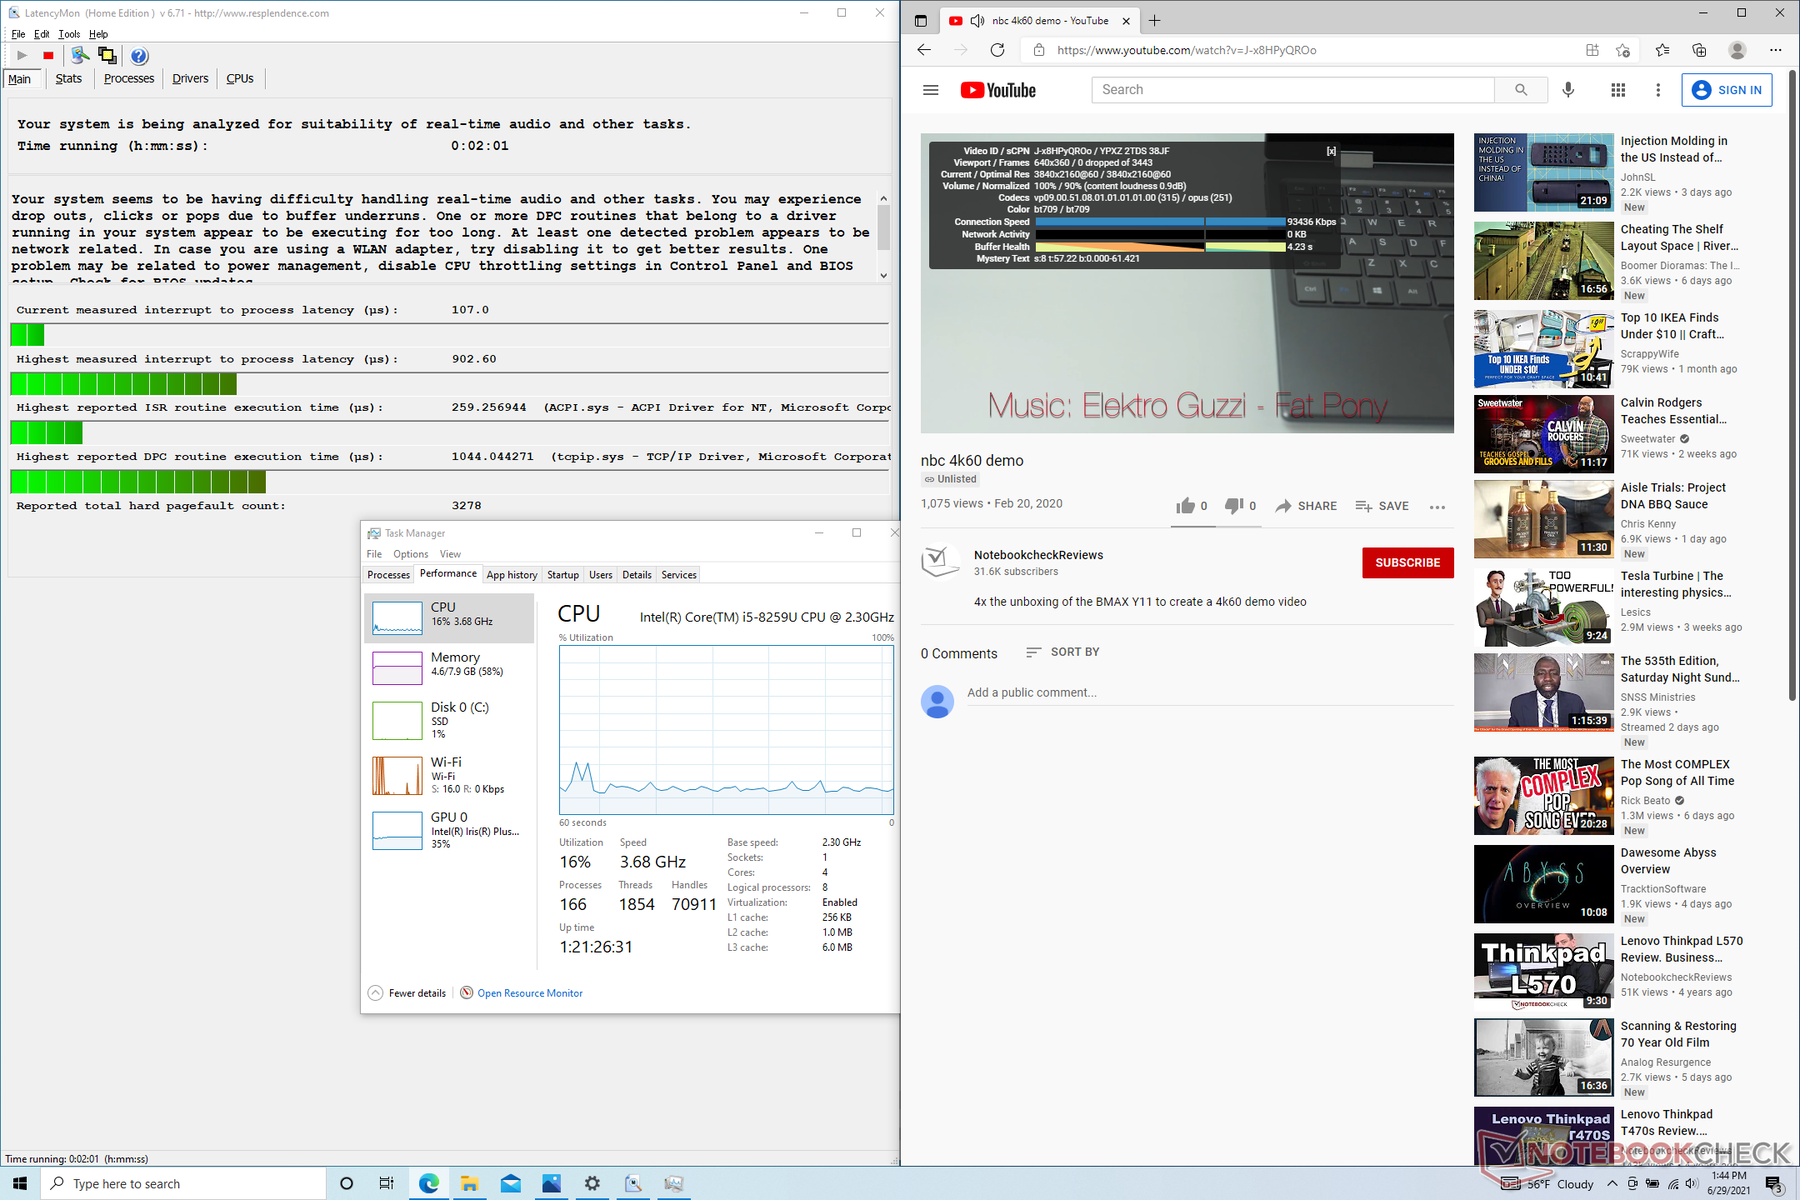
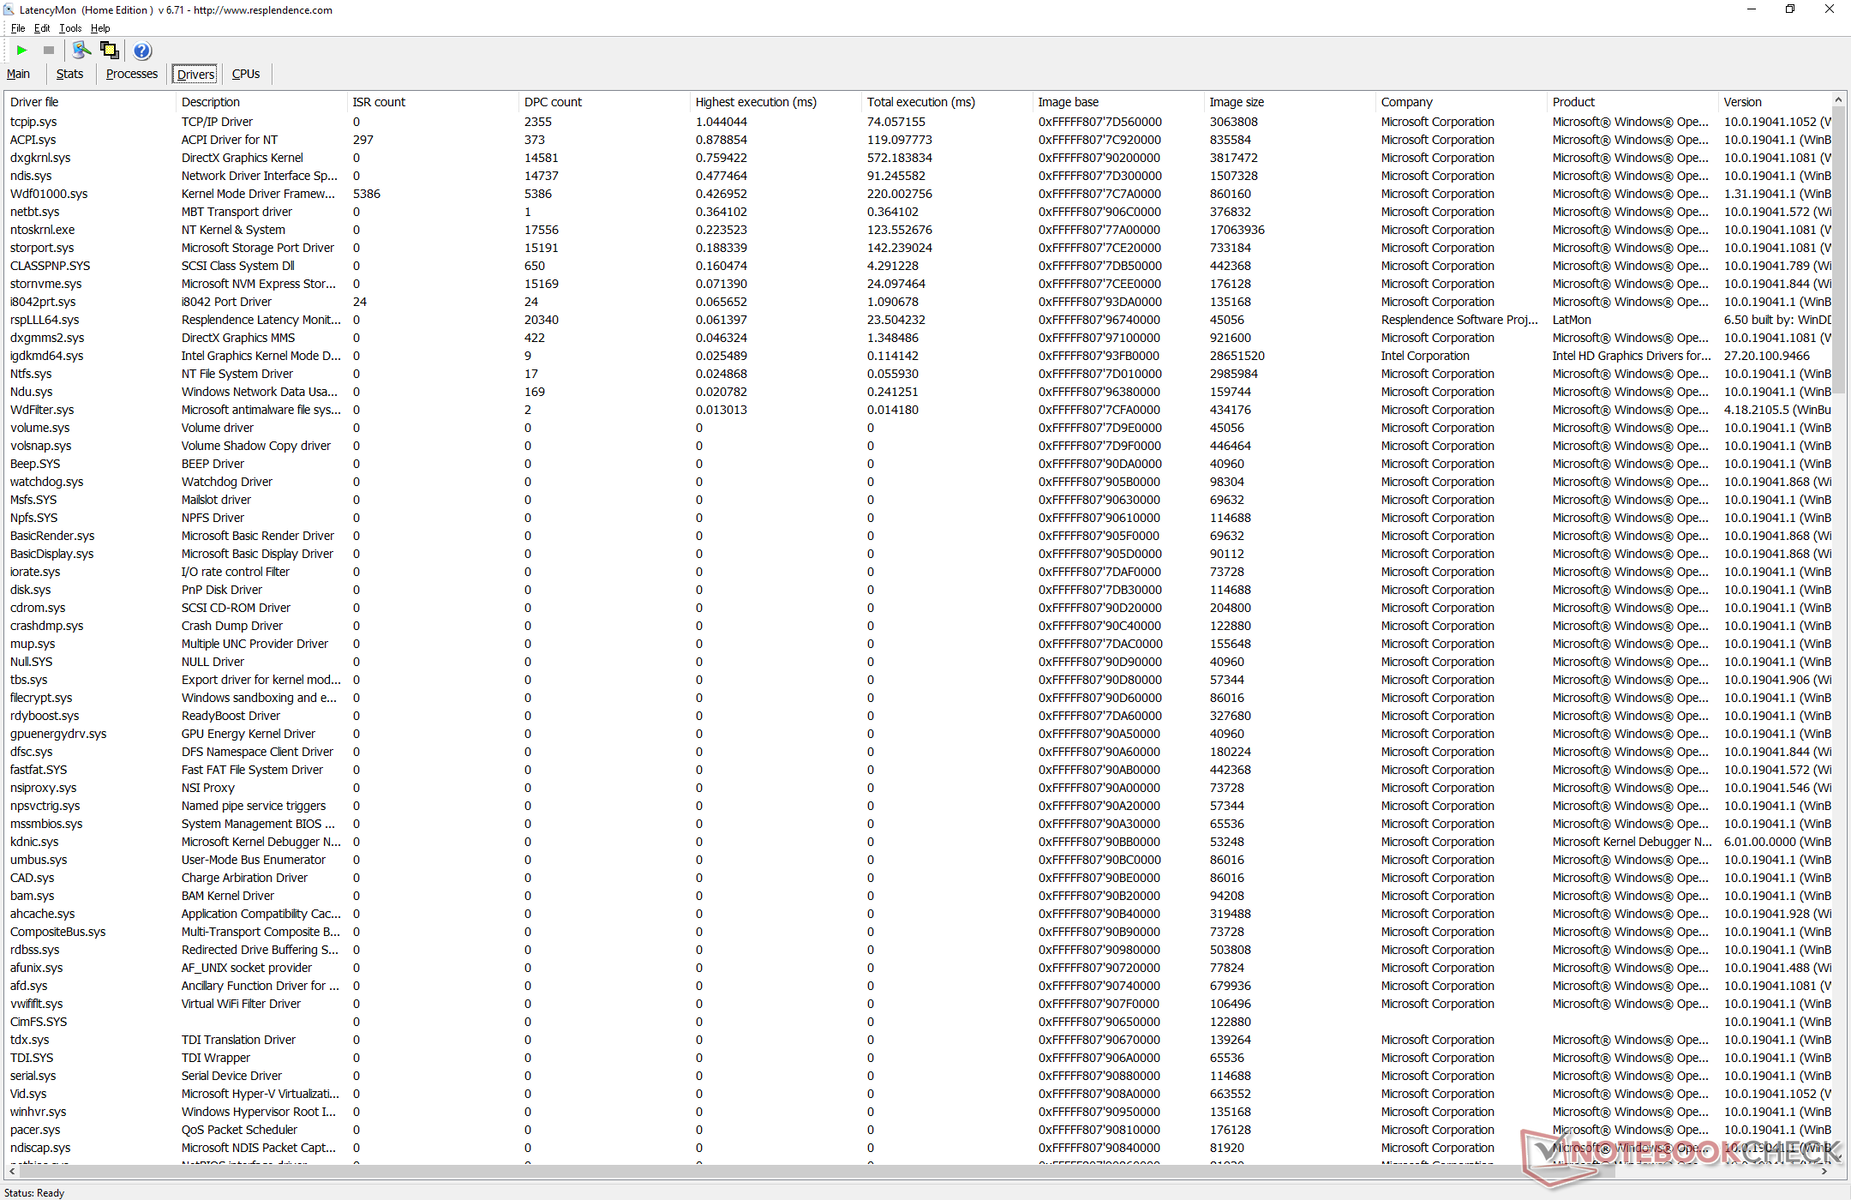
LatencyMon reveals DPC latency issues when opening multiple browser tabs on our homepage. 4K video playback at 60 FPS is otherwise smooth and without any dropped frames.
| DPC Latencies / LatencyMon - interrupt to process latency (max), Web, Youtube, Prime95 | |
| LG Gram 14Z90P-G.AA79G | |
| Chuwi CoreBook X | |
| SCHENKER Vision 14 | |
| Infinix INBook X1 Pro | |
| Honor Magicbook 14 i7-1165G7 | |
| Acer Swift 5 SF514-55T-58DN | |
* ... smaller is better
Storage Devices
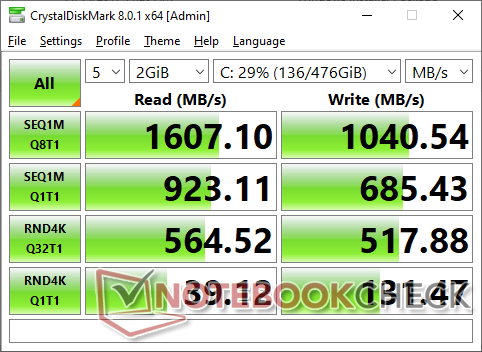
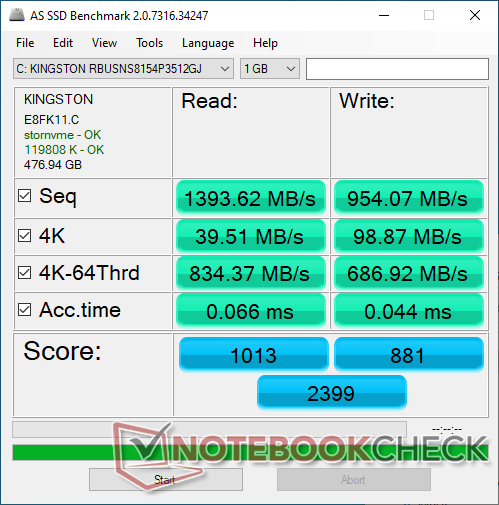
Our unit shipped with a 512 GB Kingston RBUSNS8154P3512GJ which is a budget PCIe 3 NVMe SSD. Read rates top out at 1600 MB/s compared to over twice that on the Western Digital SN730 or SK Hynix PC601. For the target budget user and undemanding applications, however, this is still a very fast drive.
| Chuwi CoreBook X Kingston RBUSNS8154P3512GJ | Infinix INBook X1 Pro Phison C-E80T512G4-P3D3B3E13 | SCHENKER Vision 14 Samsung SSD 980 Pro 1TB MZ-V8P1T0BW | Honor Magicbook 14 i7-1165G7 WDC PC SN730 SDBPNTY-512G | LG Gram 14Z90P-G.AA79G SK Hynix PC601 1TB HFS001TD9TNG | Acer Swift 5 SF514-55T-58DN SK Hynix BC511 HFM512GDJTNI | |
|---|---|---|---|---|---|---|
| AS SSD | 14% | 165% | 92% | 70% | 13% | |
| Seq Read | 1393 | 2135 53% | 4899 252% | 3021 117% | 2975 114% | 1405 1% |
| Seq Write | 954 | 1776 86% | 3952 314% | 2341 145% | 1261 32% | 1011 6% |
| 4K Read | 39.51 | 28.88 -27% | 83.8 112% | 47.9 21% | 49.97 26% | 53.7 36% |
| 4K Write | 98.9 | 147.9 50% | 205 107% | 186.7 89% | 168.4 70% | 122.7 24% |
| 4K-64 Read | 834 | 712 -15% | 2938 252% | 1472 76% | 1539 85% | 803 -4% |
| 4K-64 Write | 687 | 643 -6% | 2077 202% | 1829 166% | 1517 121% | 810 18% |
| Access Time Read * | 0.066 | 0.052 21% | 0.025 62% | 0.06 9% | 0.036 45% | |
| Access Time Write * | 0.044 | 0.092 -109% | 0.02 55% | 0.021 52% | 0.026 41% | 0.032 27% |
| Score Read | 1013 | 954 -6% | 3512 247% | 1822 80% | 1886 86% | 997 -2% |
| Score Write | 881 | 968 10% | 2677 204% | 2249 155% | 1811 106% | 1034 17% |
| Score Total | 2399 | 2395 0% | 7939 231% | 4973 107% | 4579 91% | 2536 6% |
| Copy ISO MB/s | 983 | 1296 32% | 2100 114% | 1510 54% | ||
| Copy Program MB/s | 643 | 900 40% | 994 55% | 950 48% | ||
| Copy Game MB/s | 920 | 1588 73% | 1859 102% | 1470 60% | ||
| CrystalDiskMark 5.2 / 6 | 72% | 249% | 120% | 103% | 17% | |
| Write 4K | 130.5 | 228.3 75% | 240 84% | 223.7 71% | 198.9 52% | 77.8 -40% |
| Read 4K | 38.72 | 60.7 57% | 90.9 135% | 51.2 32% | 55.9 44% | 46.98 21% |
| Write Seq | 709 | 1895 167% | 4236 497% | 2579 264% | 2441 244% | 1054 49% |
| Read Seq | 717 | 1573 119% | 4101 472% | 2553 256% | 1939 170% | 1137 59% |
| Write 4K Q32T1 | 510 | 476.6 -7% | 662 30% | 671 32% | 631 24% | 474.5 -7% |
| Read 4K Q32T1 | 554 | 592 7% | 720 30% | 761 37% | 704 27% | 601 8% |
| Write Seq Q32T1 | 1037 | 2136 106% | 5222 404% | 2721 162% | 2566 147% | 1062 2% |
| Read Seq Q32T1 | 1609 | 2413 50% | 7102 341% | 3358 109% | 3451 114% | 2309 44% |
| Total Average (Program / Settings) | 43% /
35% | 207% /
196% | 106% /
104% | 87% /
82% | 15% /
15% |
* ... smaller is better

Disk Throttling: DiskSpd Read Loop, Queue Depth 8
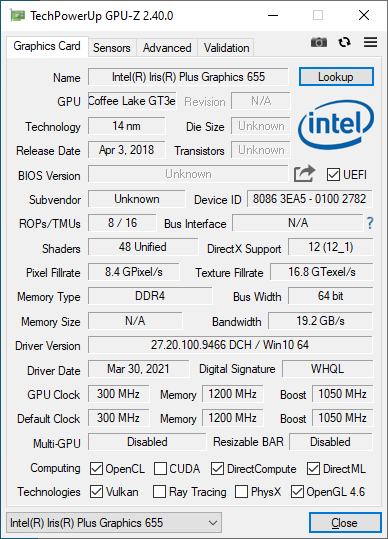
GPU Performance
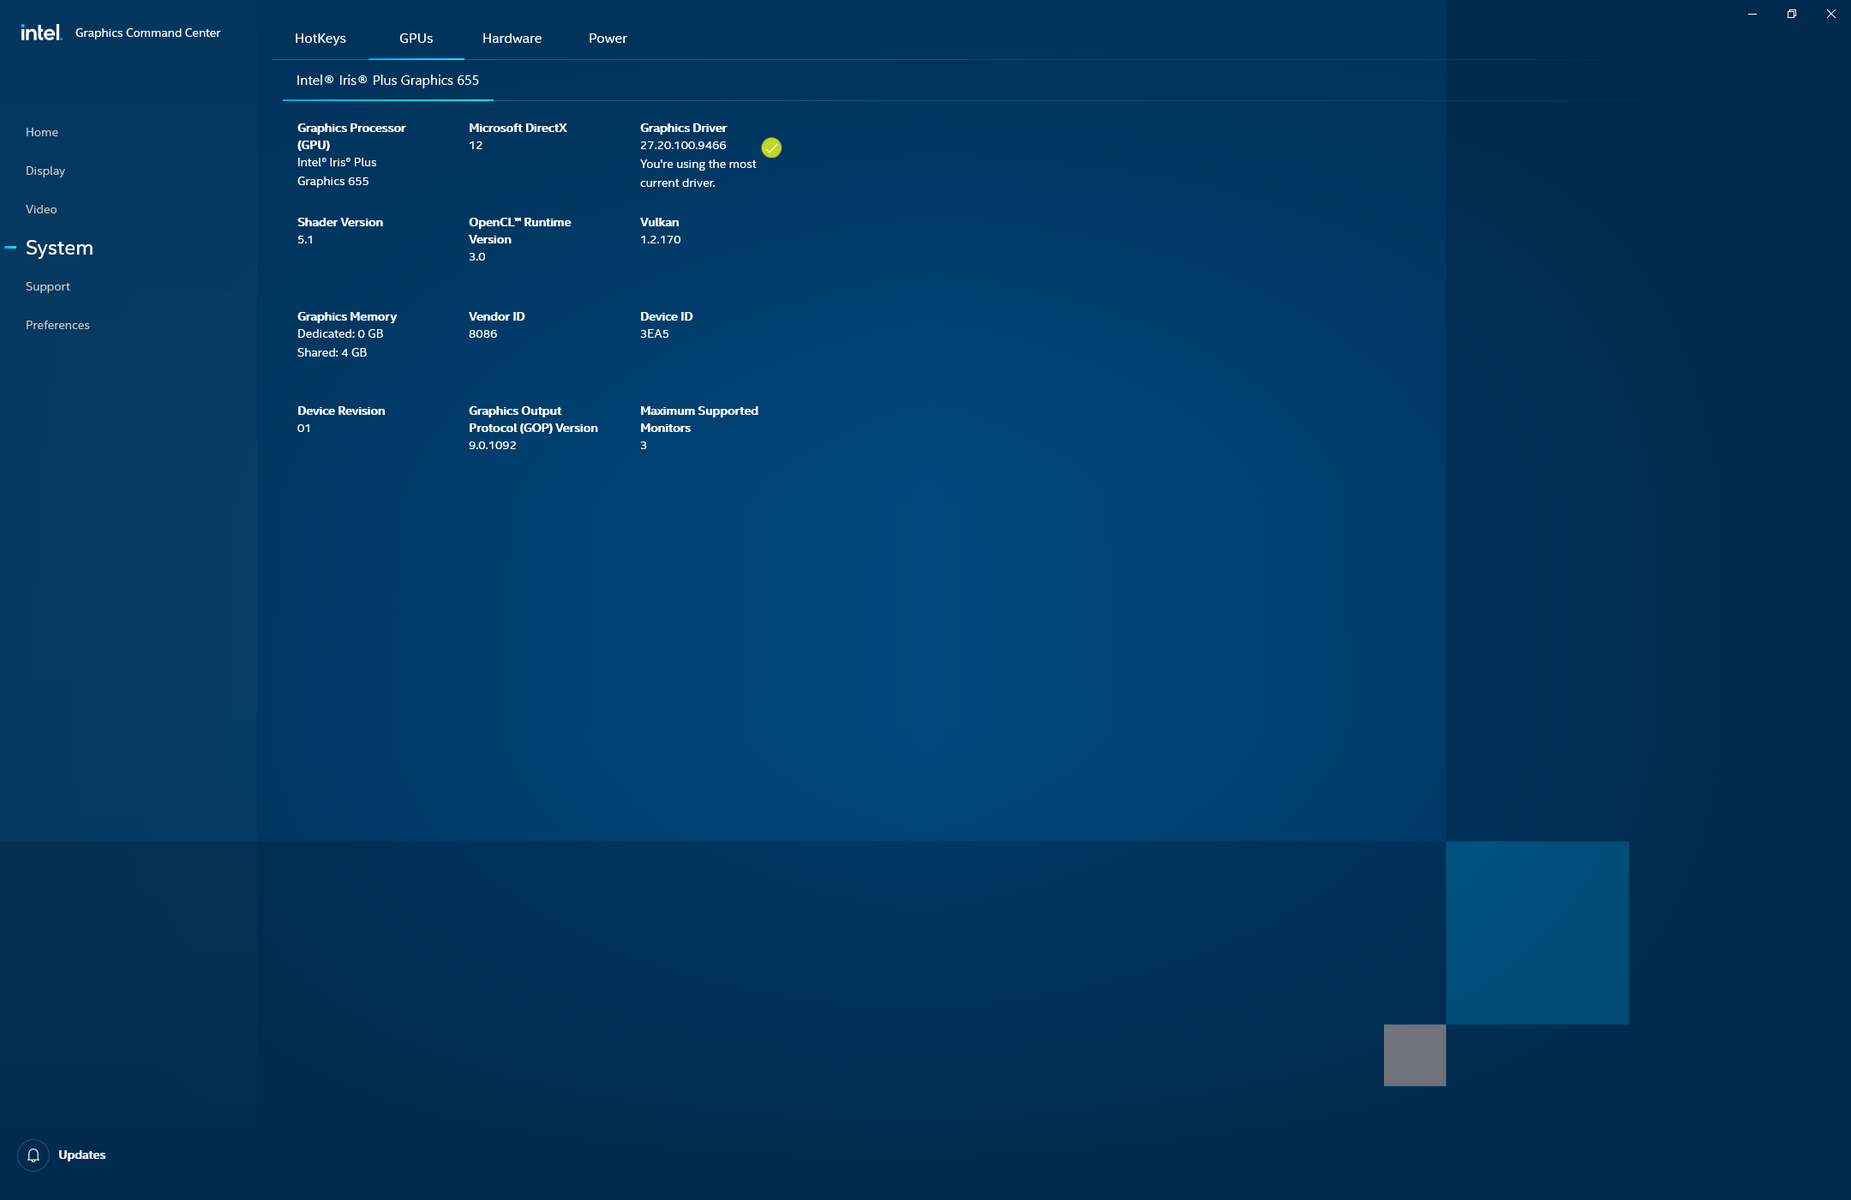
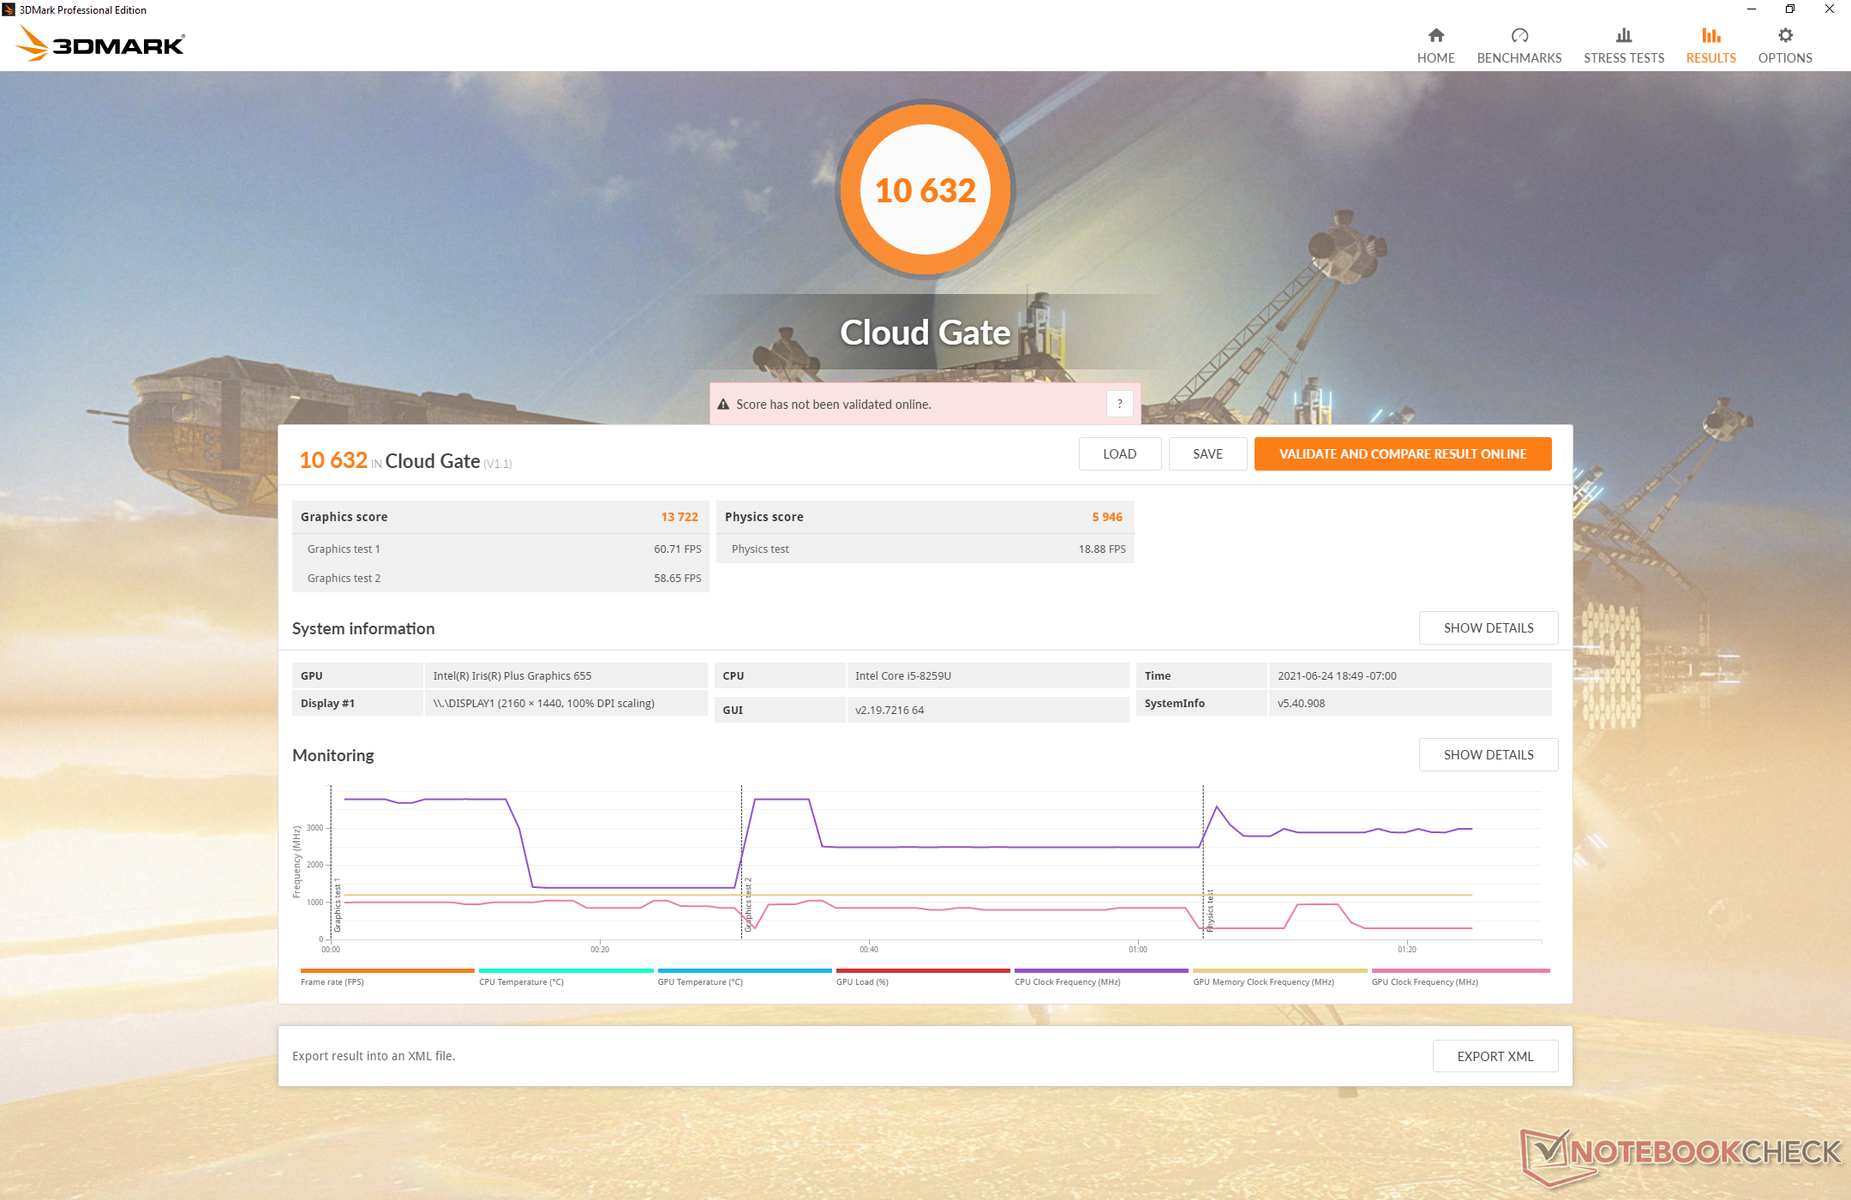
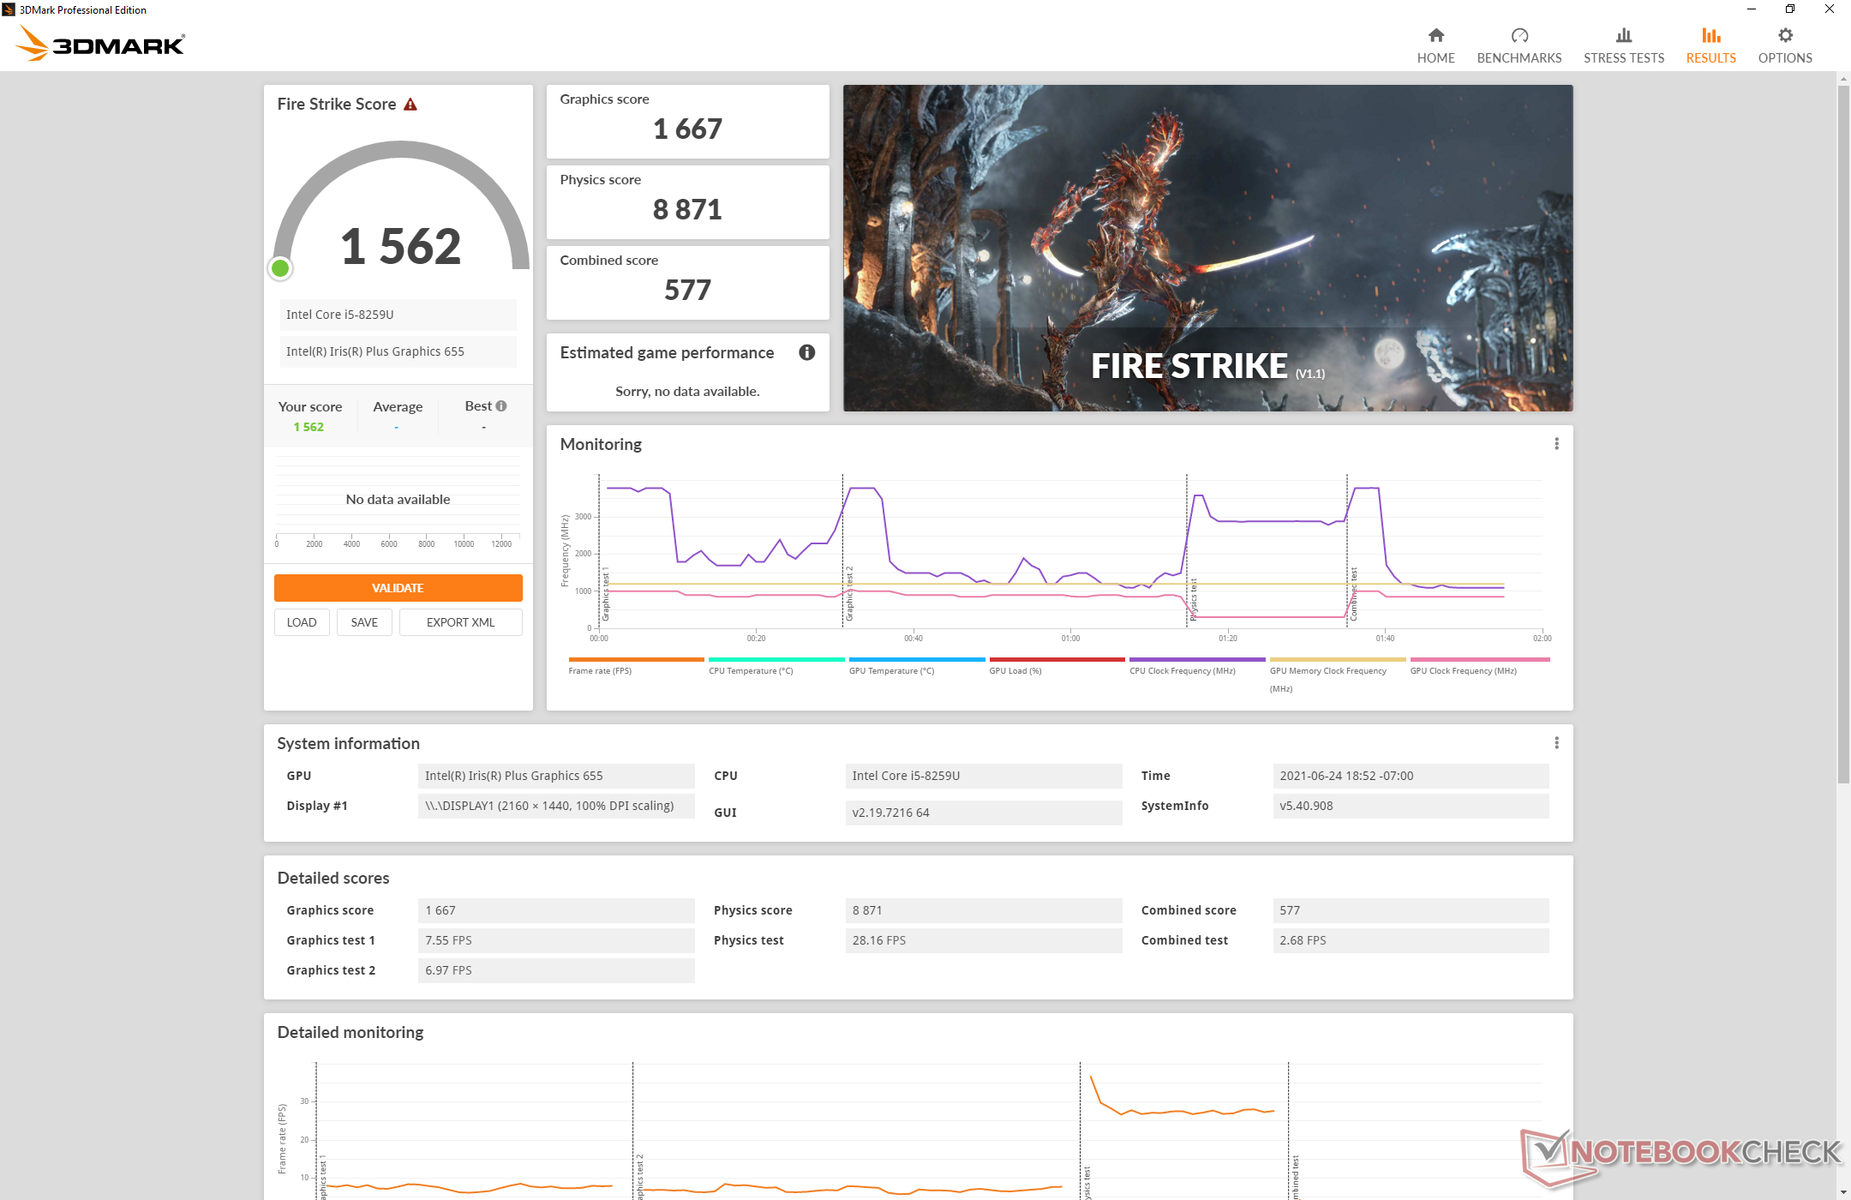
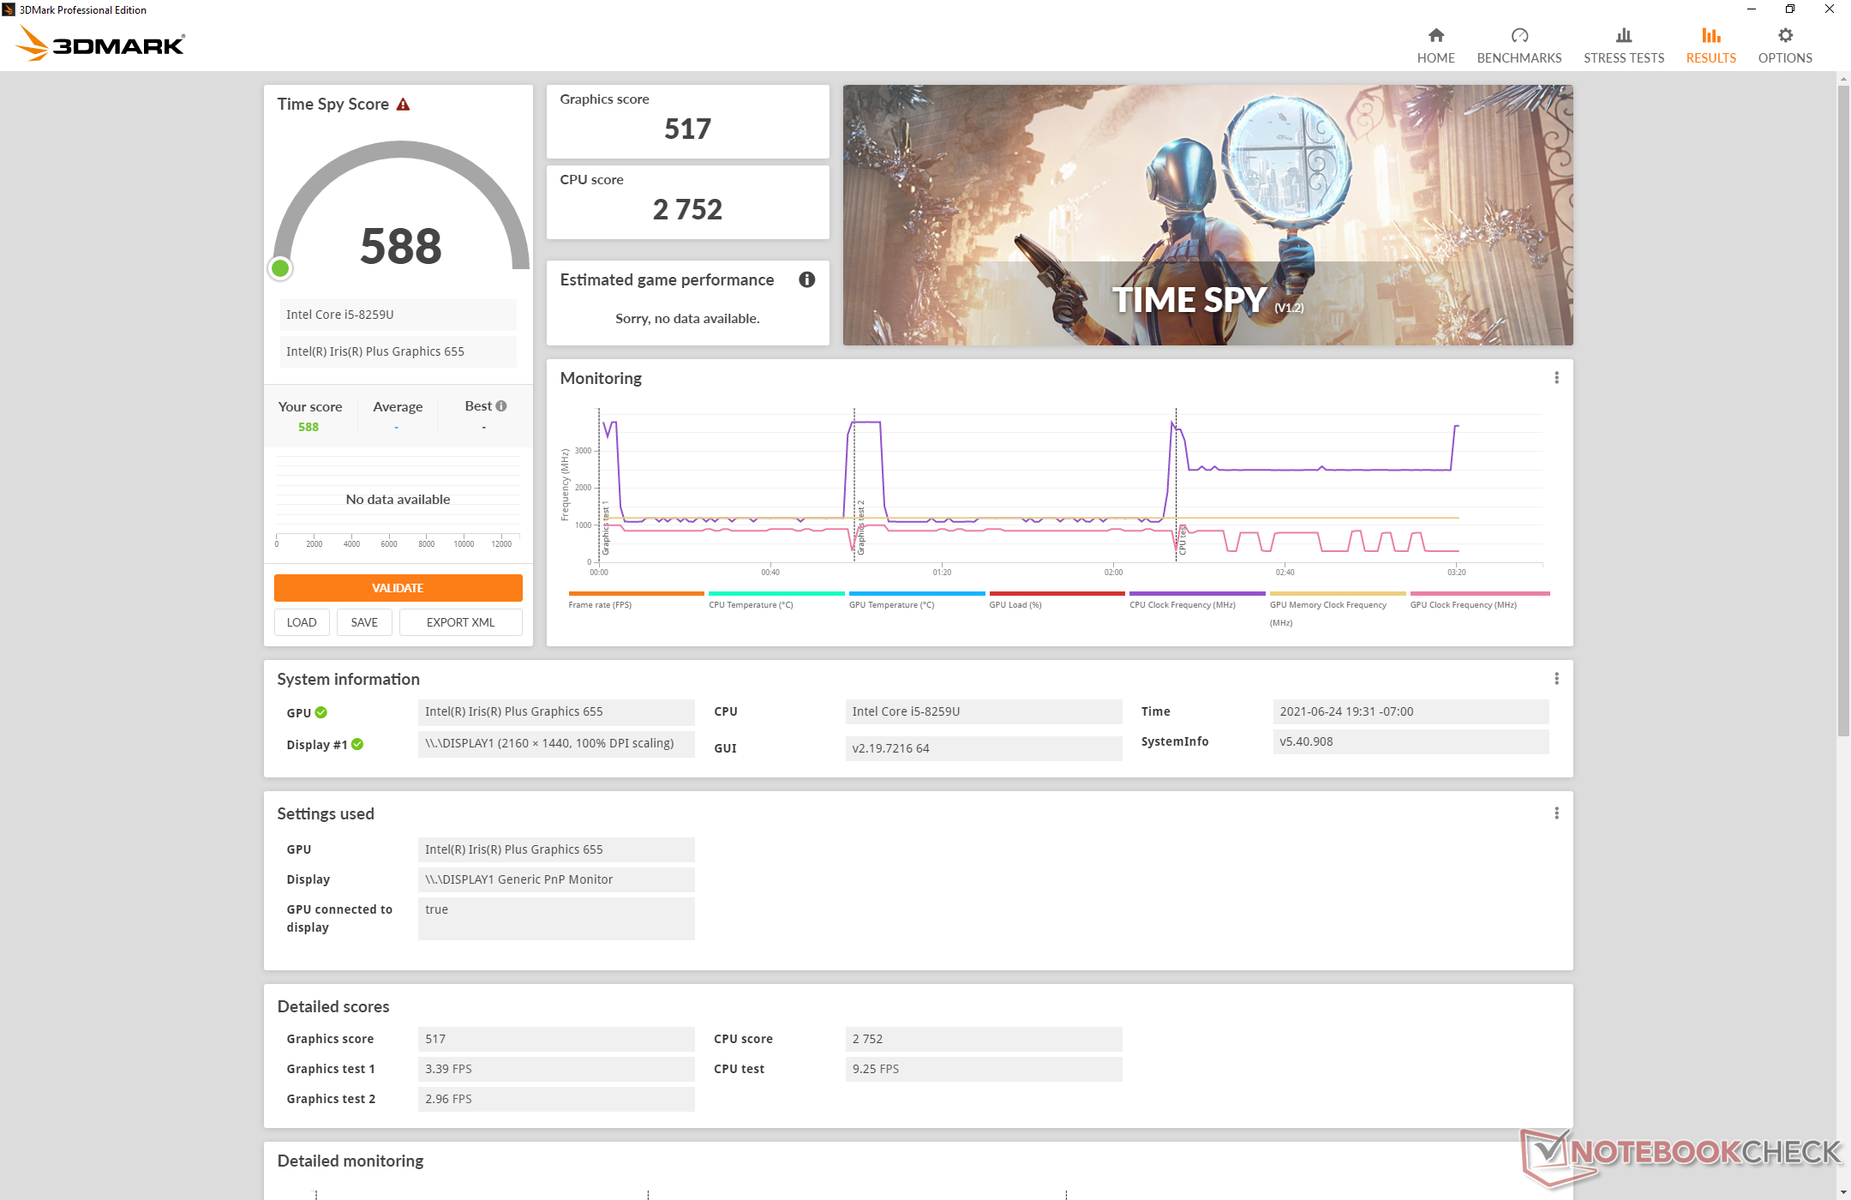
Graphics performance according to 3DMark is slower than the average Iris Plus 655 in our database by about 10 to 15 percent. We attribute the poorer results to the limited 8 GB of single-channel RAM compared to the more common dual-channel 16 GB. Upgrading to a newer Iris Plus G7 Ice Lake platform could net users a 50 to 60 percent boost in GPU power.
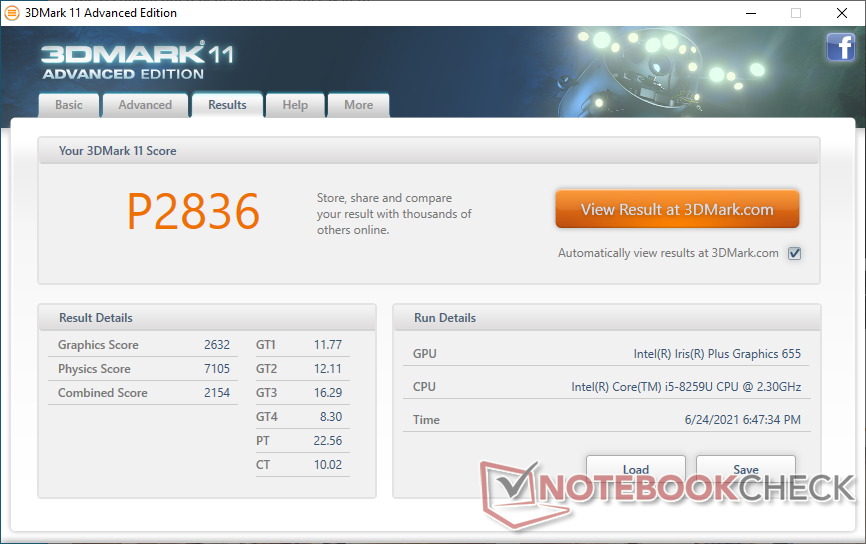
| 3DMark 11 Performance | 2836 points | |
| 3DMark Cloud Gate Standard Score | 10632 points | |
| 3DMark Fire Strike Score | 1562 points | |
| 3DMark Time Spy Score | 588 points | |
Help | ||
Witcher 3 FPS Chart
| low | med. | high | ultra | |
| The Witcher 3 (2015) | 24.7 | 14.6 | 10.9 | 5.6 |
| Dota 2 Reborn (2015) | 92.6 | 57 | 27.8 | 24.5 |
| Final Fantasy XV Benchmark (2018) | 15.6 | 7.88 | 5.25 | |
| X-Plane 11.11 (2018) | 21.2 | 15.3 | 13.4 |
Emissions
System Noise
The internal fan will idle when idling on desktop, but even the slightest actions like web browsing, launching applications, or video streaming will pulse the fan to as high as 31.1 dB(A) against a background of 24.9 dB(A).
We can notice heavy coil whine or electronic noise from our test unit which is an indication of cheap or low quality components. The high-pitched noise is loud enough to aggravate sensitive users.
| Chuwi CoreBook X Iris Plus Graphics 655, i5-8259U, Kingston RBUSNS8154P3512GJ | Infinix INBook X1 Pro Iris Plus Graphics G7 (Ice Lake 64 EU), i7-1065G7, Phison C-E80T512G4-P3D3B3E13 | SCHENKER Vision 14 Iris Xe G7 96EUs, i7-1165G7, Samsung SSD 980 Pro 1TB MZ-V8P1T0BW | Honor Magicbook 14 i7-1165G7 Iris Xe G7 96EUs, i7-1165G7, WDC PC SN730 SDBPNTY-512G | LG Gram 14Z90P-G.AA79G Iris Xe G7 96EUs, i7-1165G7, SK Hynix PC601 1TB HFS001TD9TNG | Acer Swift 5 SF514-55T-58DN Iris Xe G7 80EUs, i5-1135G7, SK Hynix BC511 HFM512GDJTNI | |
|---|---|---|---|---|---|---|
| Noise | 7% | -2% | -1% | 6% | 5% | |
| off / environment * | 24.9 | 24.6 1% | 25 -0% | 24 4% | 26 -4% | 25 -0% |
| Idle Minimum * | 25.5 | 25.1 2% | 25 2% | 24 6% | 26 -2% | 25 2% |
| Idle Average * | 25.5 | 25.1 2% | 25 2% | 25 2% | 26 -2% | 25 2% |
| Idle Maximum * | 29.1 | 25.1 14% | 26.9 8% | 28 4% | 26 11% | 25 14% |
| Load Average * | 36.8 | 32.7 11% | 38.6 -5% | 36 2% | 30.5 17% | 34.7 6% |
| Witcher 3 ultra * | 37.2 | 33.4 10% | 41.2 -11% | |||
| Load Maximum * | 37.1 | 33.4 10% | 41.2 -11% | 46 -24% | 30.5 18% | 34 8% |
* ... smaller is better
Noise Level
| Idle |
| 25.5 / 25.5 / 29.1 dB(A) |
| Load |
| 36.8 / 37.1 dB(A) |
 | ||
30 dB silent 40 dB(A) audible 50 dB(A) loud |
||
min: | ||
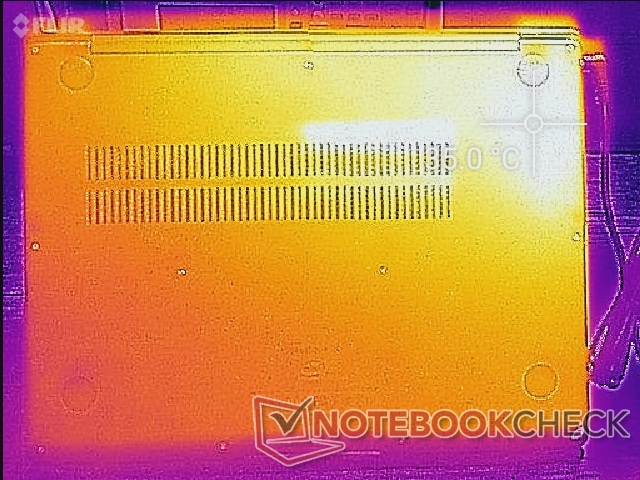
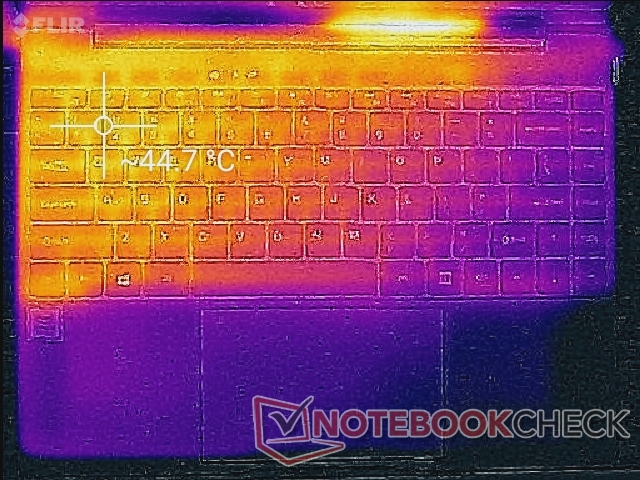
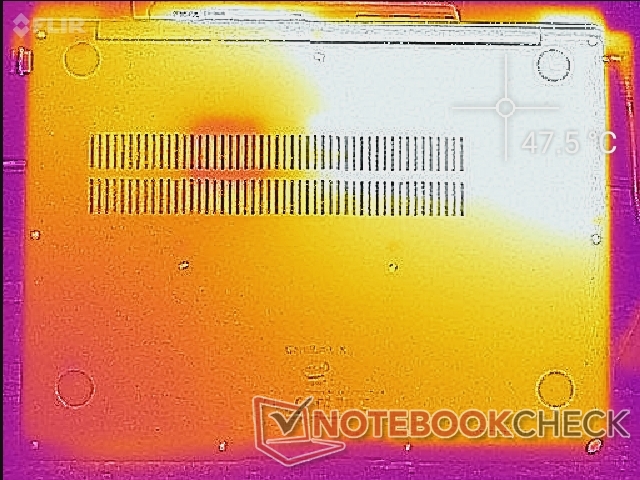
Temperature
Surface temperatures will always be warmer on the left half than the right half due to how the cooling solution is positioned within. Hot spots can become as warm as 47 C compared to just 34 C on the cooler side of the chassis. The temperature difference is noticeable when running higher loads.
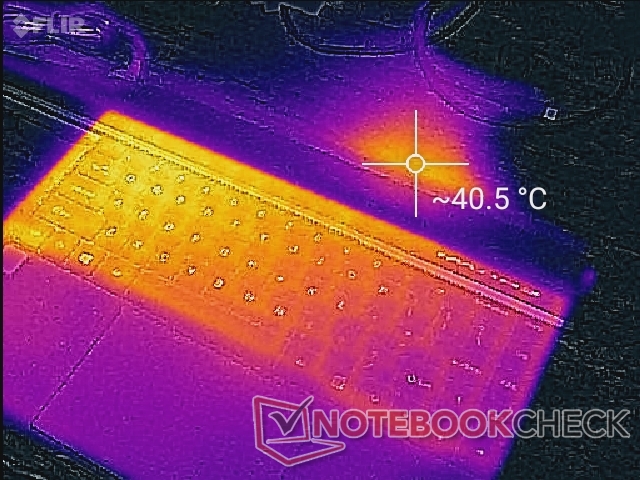
(±) The maximum temperature on the upper side is 44.4 °C / 112 F, compared to the average of 35.9 °C / 97 F, ranging from 21.4 to 59 °C for the class Subnotebook.
(-) The bottom heats up to a maximum of 47.6 °C / 118 F, compared to the average of 39.4 °C / 103 F
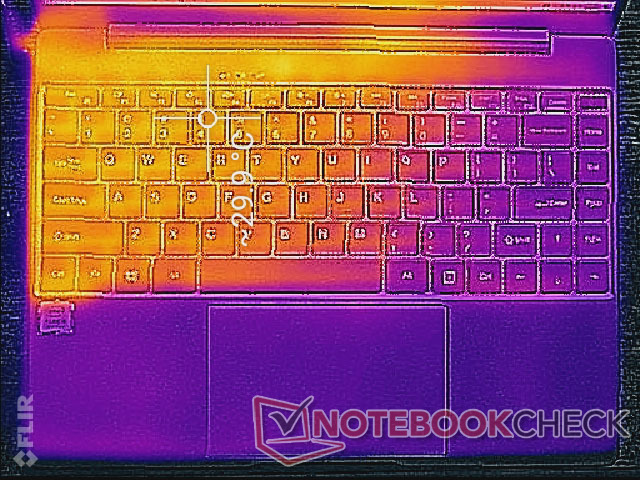
(+) In idle usage, the average temperature for the upper side is 27.4 °C / 81 F, compared to the device average of 30.7 °C / 87 F.
(+) The palmrests and touchpad are reaching skin temperature as a maximum (32.4 °C / 90.3 F) and are therefore not hot.
(-) The average temperature of the palmrest area of similar devices was 28.3 °C / 82.9 F (-4.1 °C / -7.4 F).
Stress Test
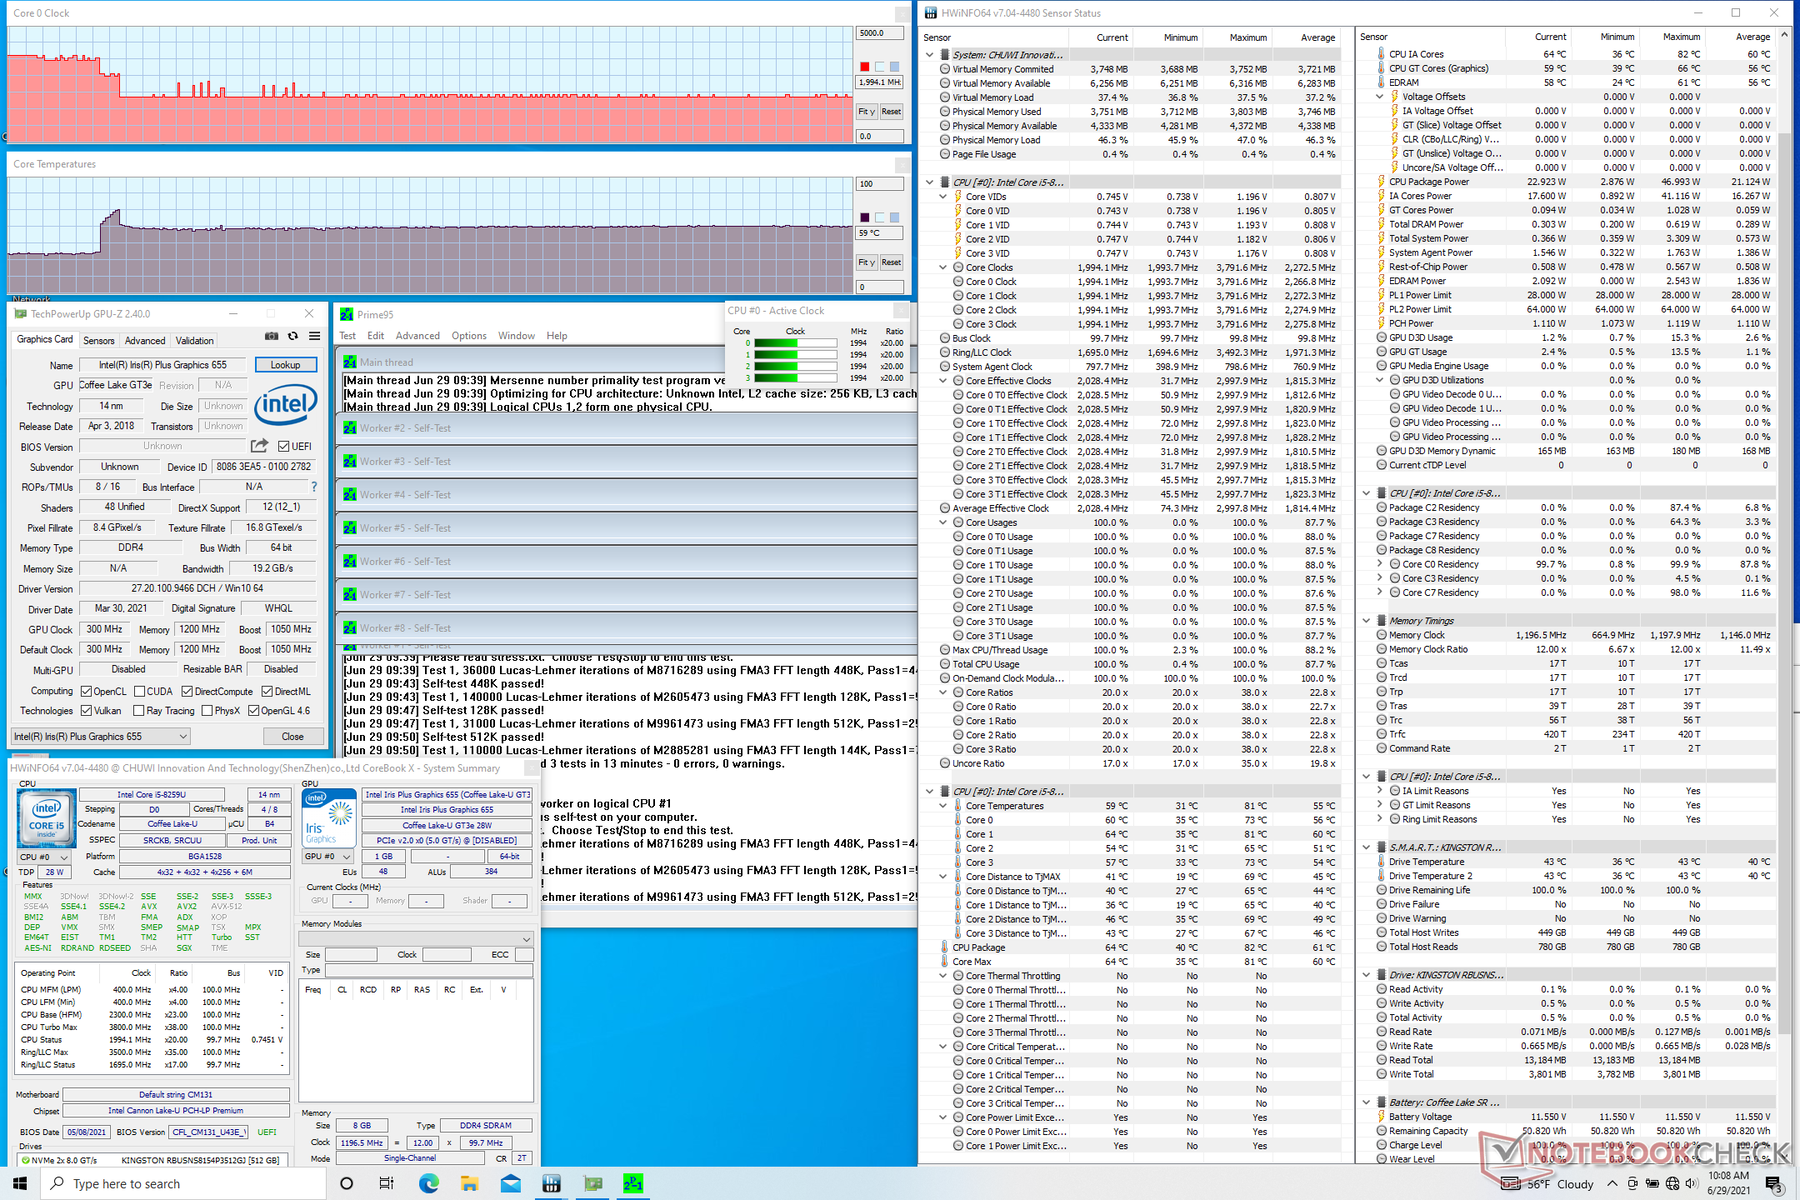
When stressed with Prime95, the CPU would boost to 3 GHz until hitting 82 C approximately 15 seconds later. Thereafter, clock rates and temperature would fall and stabilize at 2 GHz and 64 C, respectively.
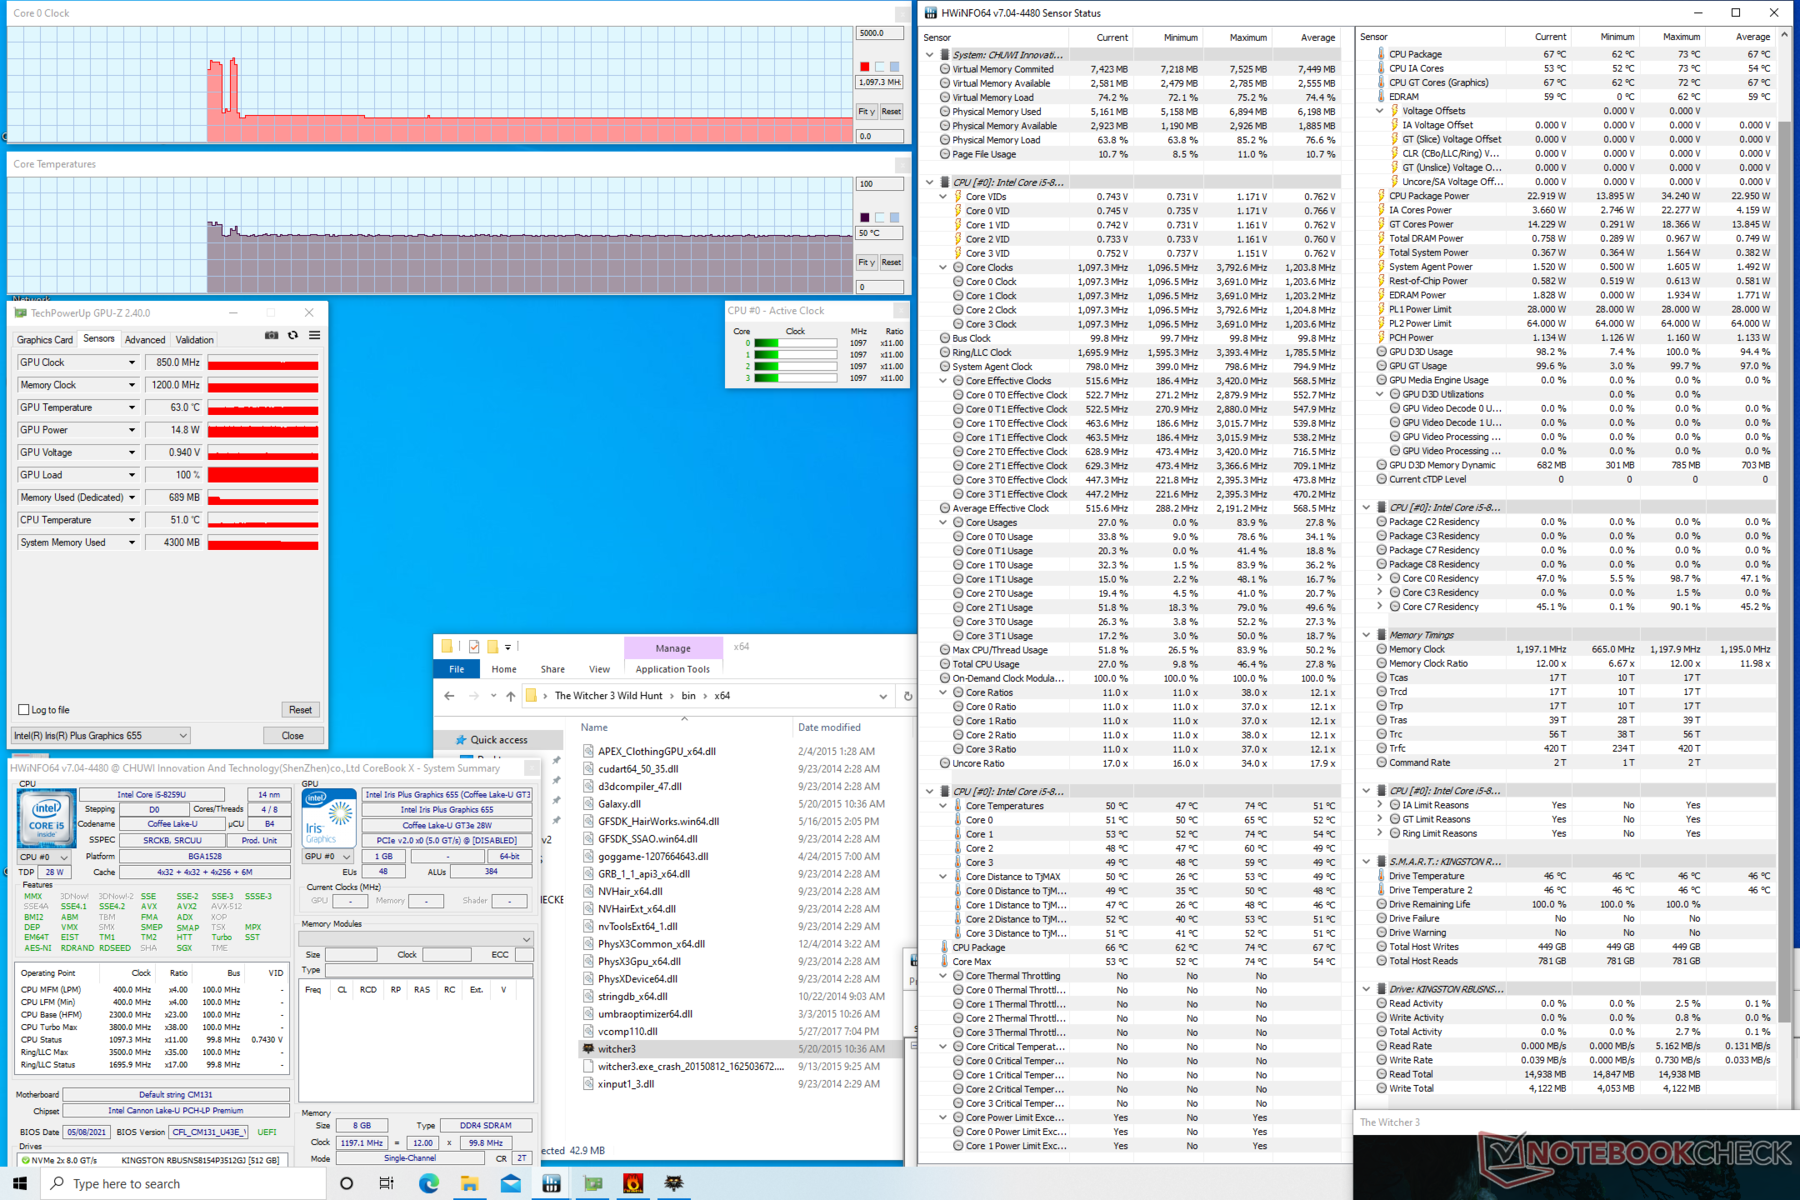
If running Witcher 3 to represent real-world gaming loads, GPU clock rate would stabilize at the 850 to 900 MHz range and at a GPU power draw of just under 15 W according to GPU-Z.
Running on battery power will limit graphics performance. A 3DMark 11 test on batteries would return Physics and Graphics scores of 7447 and 1345 points, respectively, compared to 7105 and 2632 points when on mains.
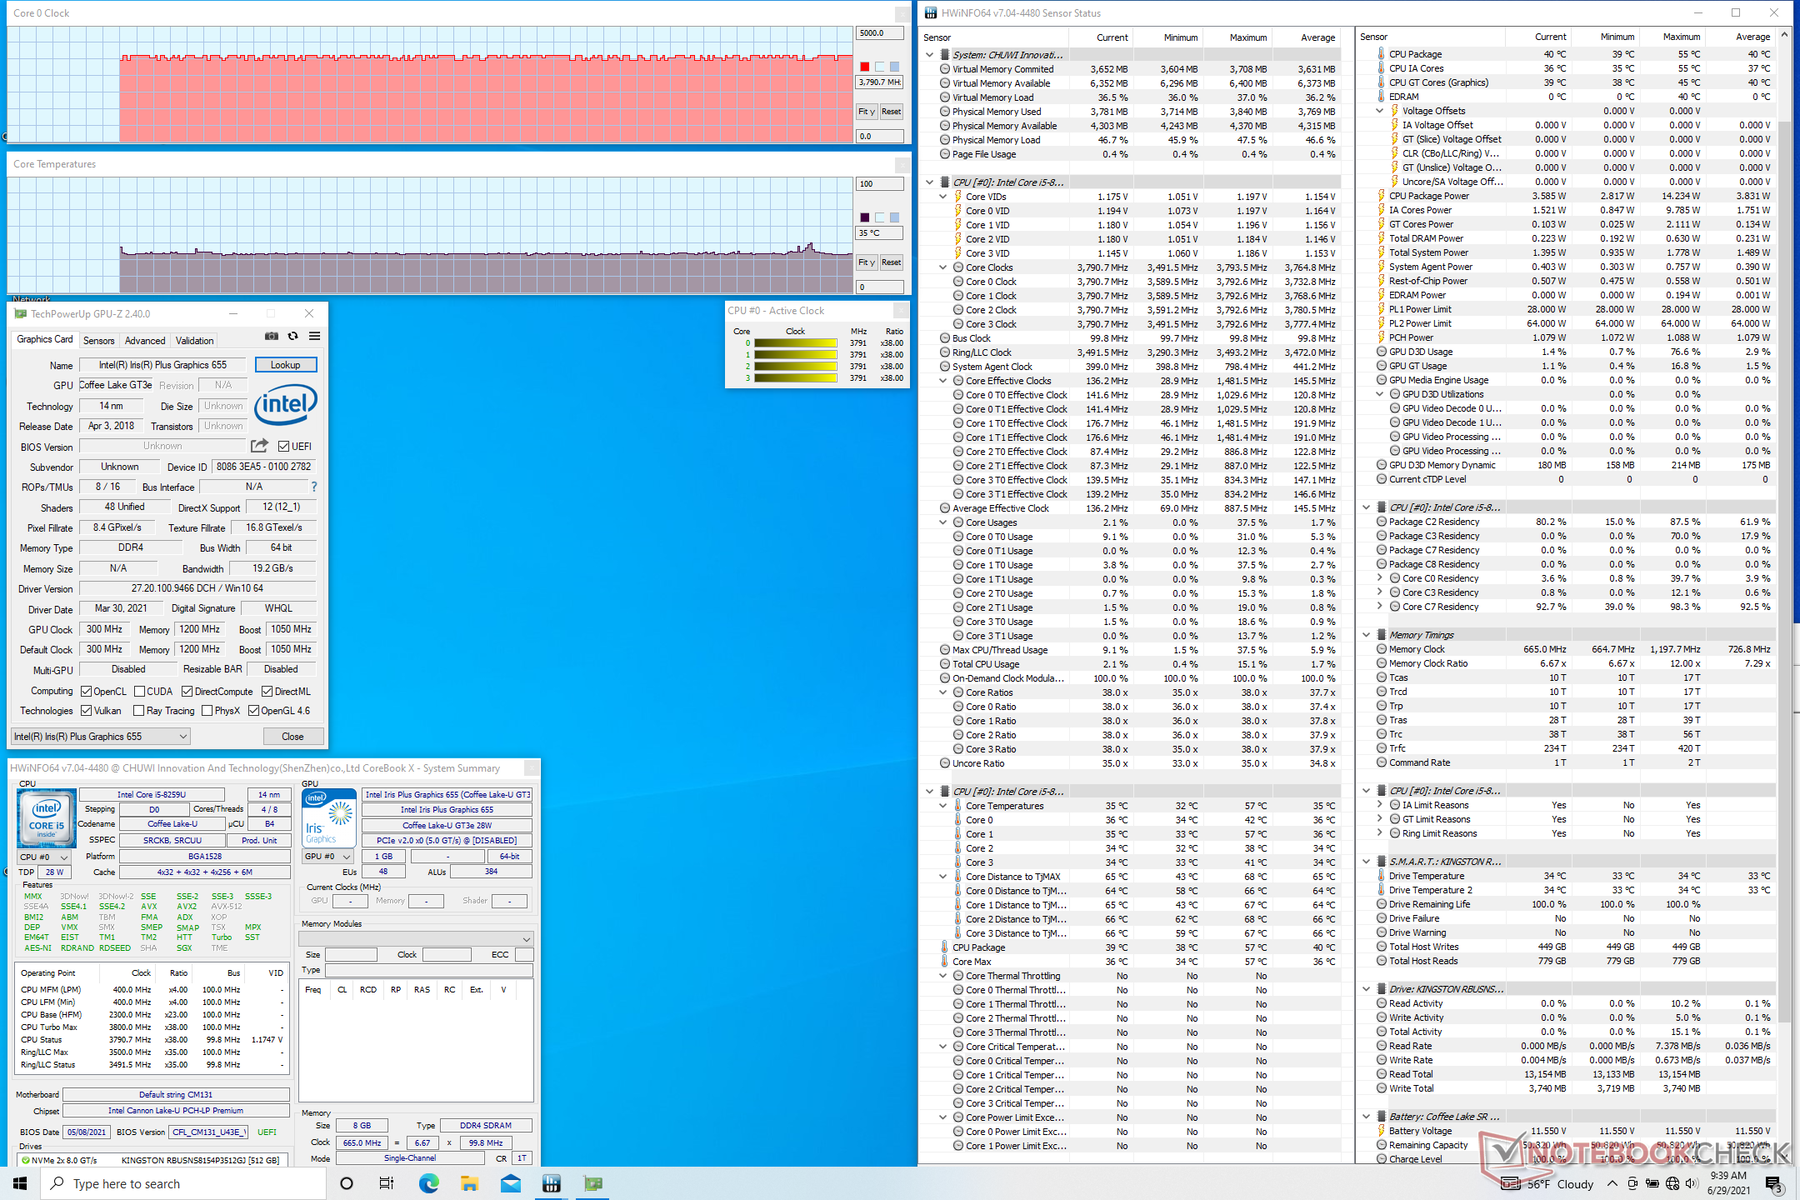
| CPU Clock (GHz) | GPU Clock (MHz) | Average CPU Temperature (°C) | |
| System Idle | -- | -- | 39 |
| Prime95 Stress | 2.0 | -- | 64 |
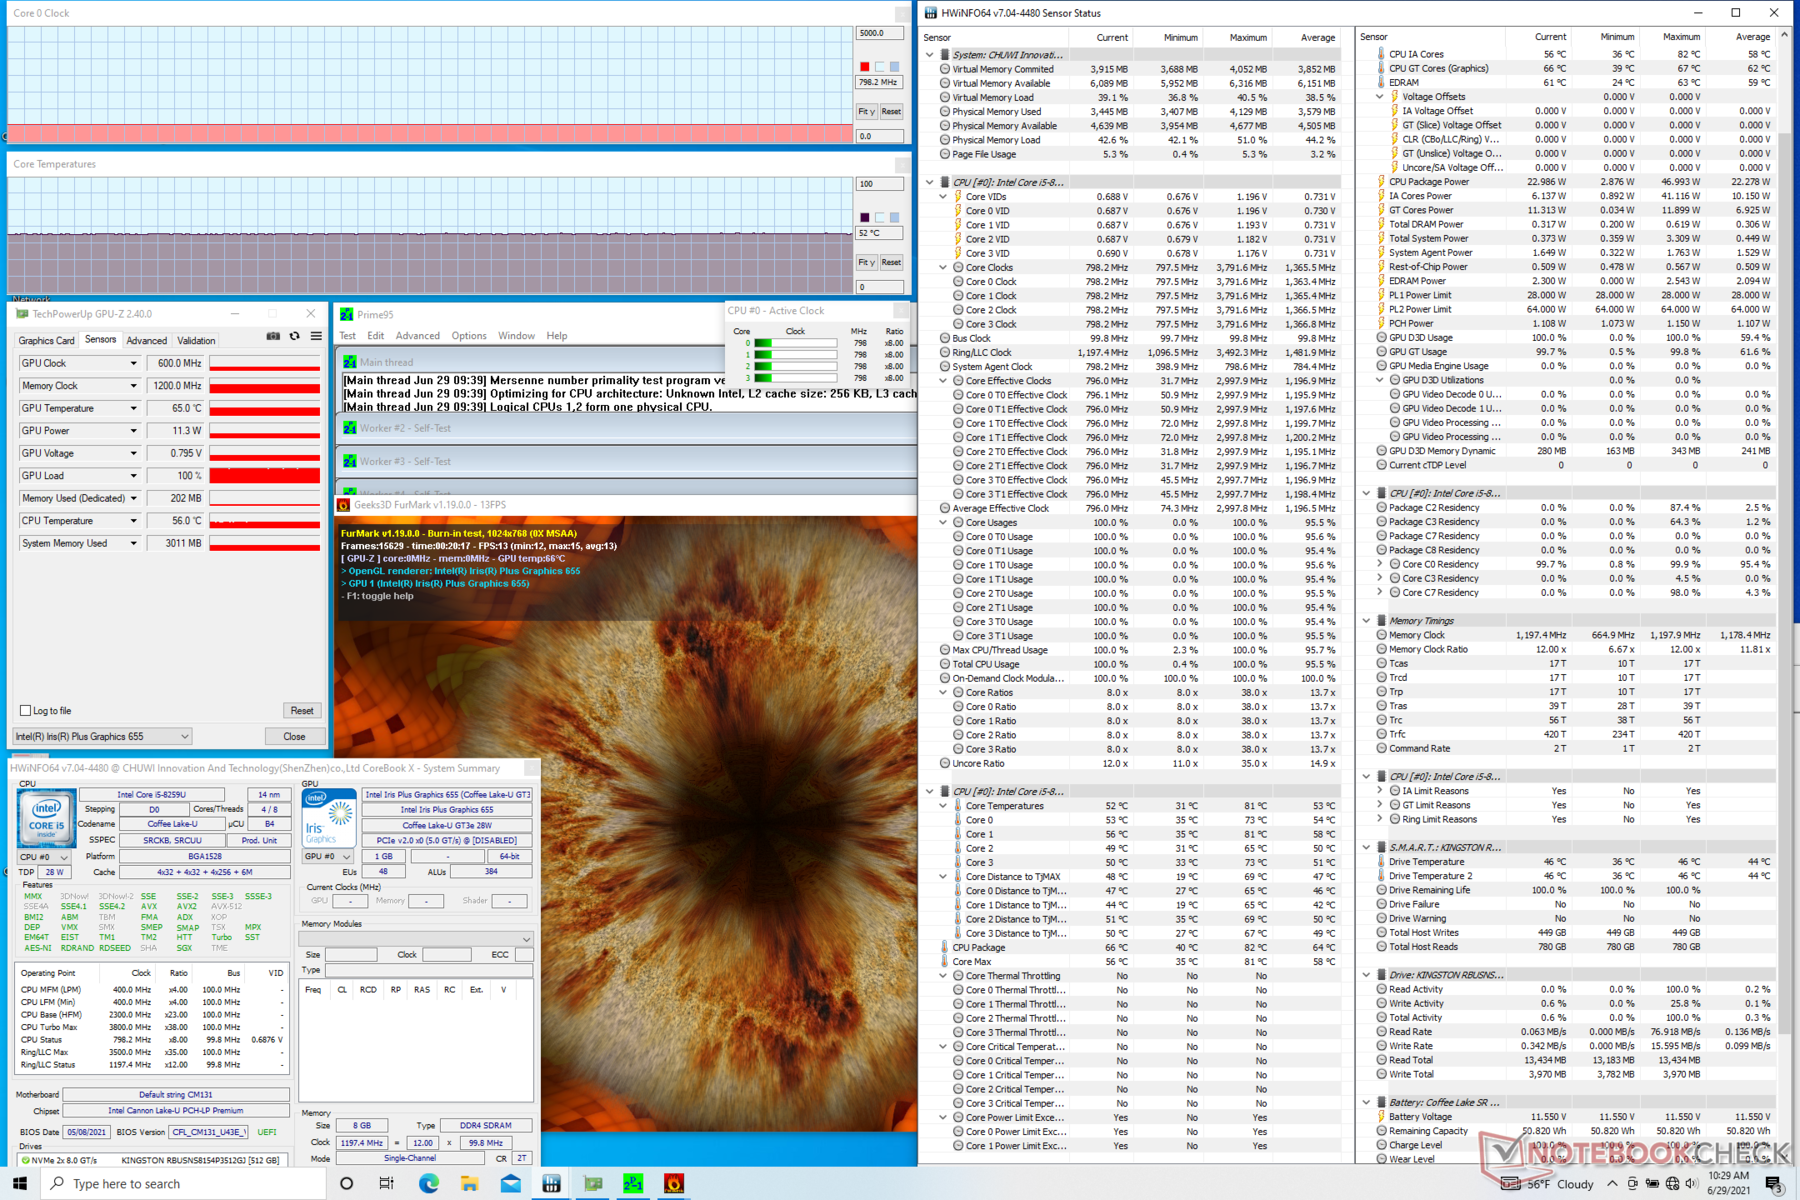
| Prime95 + FurMark Stress | 0.8 | -- | 66 |
| Witcher 3 Stress | 1.1 | 950 | 66 |
Speakers


Chuwi CoreBook X audio analysis
(+) | speakers can play relatively loud (83.4 dB)
Bass 100 - 315 Hz
(-) | nearly no bass - on average 22.2% lower than median
(±) | linearity of bass is average (7.6% delta to prev. frequency)
Mids 400 - 2000 Hz
(±) | higher mids - on average 8.7% higher than median
(±) | linearity of mids is average (8.3% delta to prev. frequency)
Highs 2 - 16 kHz
(±) | higher highs - on average 7.9% higher than median
(+) | highs are linear (5.7% delta to prev. frequency)
Overall 100 - 16.000 Hz
(±) | linearity of overall sound is average (24.5% difference to median)
Compared to same class
» 79% of all tested devices in this class were better, 4% similar, 16% worse
» The best had a delta of 5%, average was 19%, worst was 53%
Compared to all devices tested
» 70% of all tested devices were better, 6% similar, 23% worse
» The best had a delta of 4%, average was 25%, worst was 134%
Apple MacBook 12 (Early 2016) 1.1 GHz audio analysis
(+) | speakers can play relatively loud (83.6 dB)
Bass 100 - 315 Hz
(±) | reduced bass - on average 11.3% lower than median
(±) | linearity of bass is average (14.2% delta to prev. frequency)
Mids 400 - 2000 Hz
(+) | balanced mids - only 2.4% away from median
(+) | mids are linear (5.5% delta to prev. frequency)
Highs 2 - 16 kHz
(+) | balanced highs - only 2% away from median
(+) | highs are linear (4.5% delta to prev. frequency)
Overall 100 - 16.000 Hz
(+) | overall sound is linear (10.2% difference to median)
Compared to same class
» 5% of all tested devices in this class were better, 2% similar, 93% worse
» The best had a delta of 5%, average was 19%, worst was 53%
Compared to all devices tested
» 3% of all tested devices were better, 1% similar, 96% worse
» The best had a delta of 4%, average was 25%, worst was 134%
Energy Management
Power Consumption
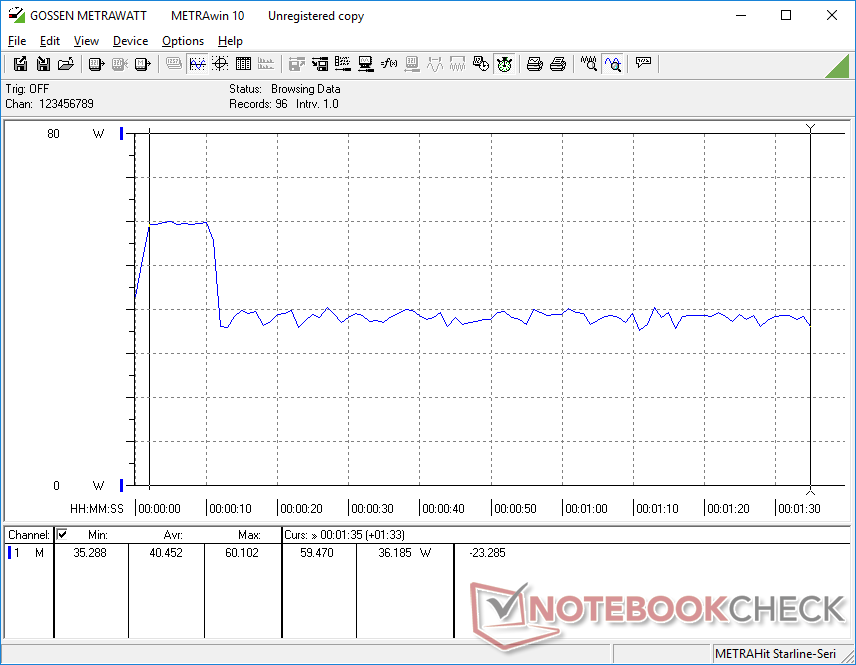
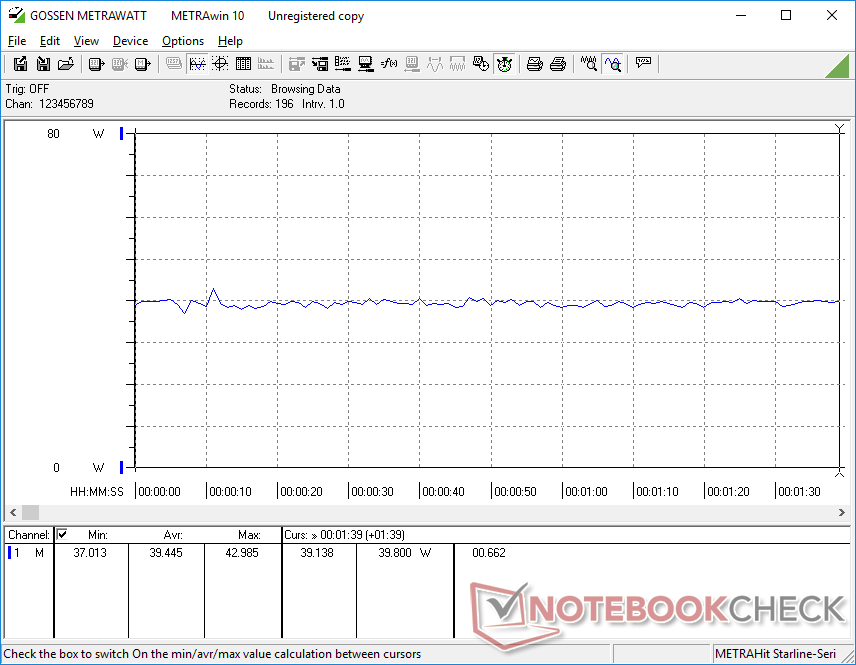
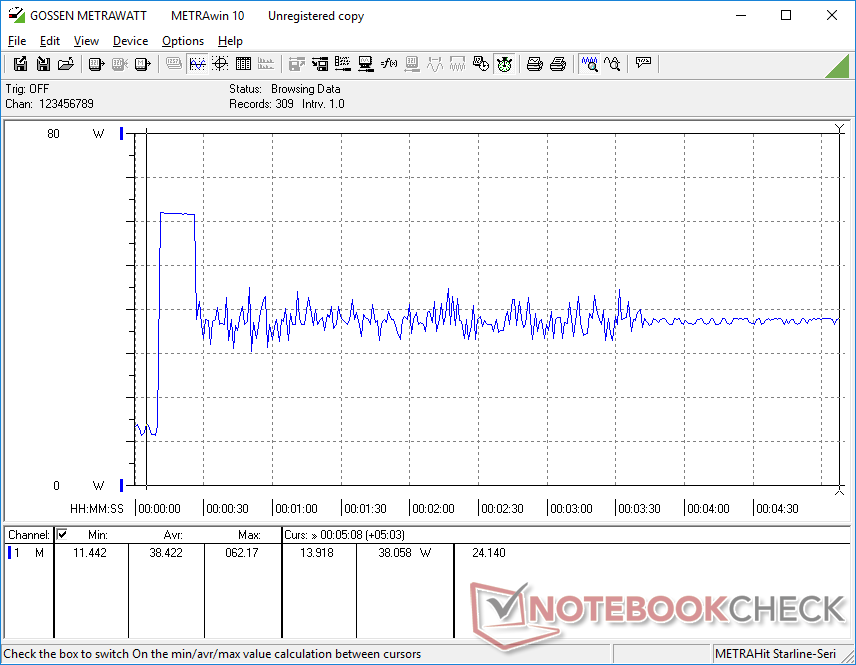
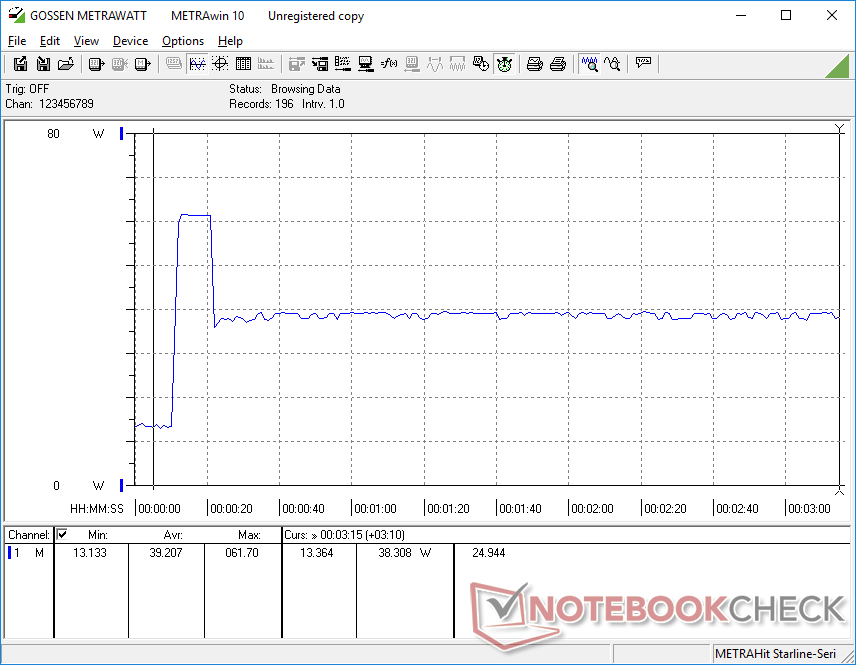
Idling on desktop at the lowest brightness setting would consume just 6.2 W while the maximum brightness setting would demand around 4.5 W more. Medium loads would consume about 40 W to be similar to many 11th gen Tiger Lake-U laptops even though performance is much slower on our Chuwi. Intel has made great strides in performance-per-watt since the launch of the Core i5-8259U back in 2018.
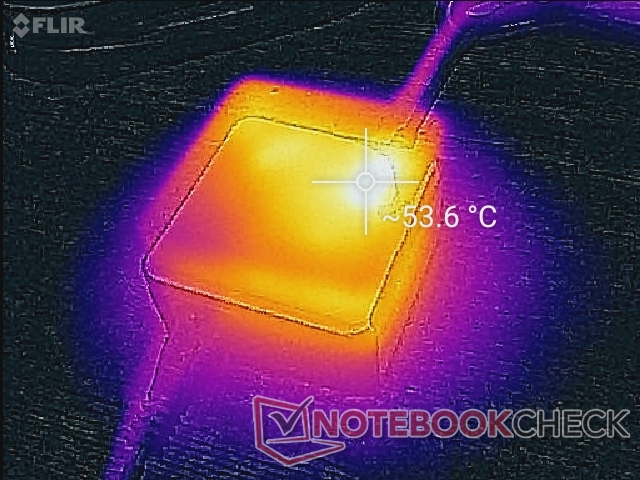
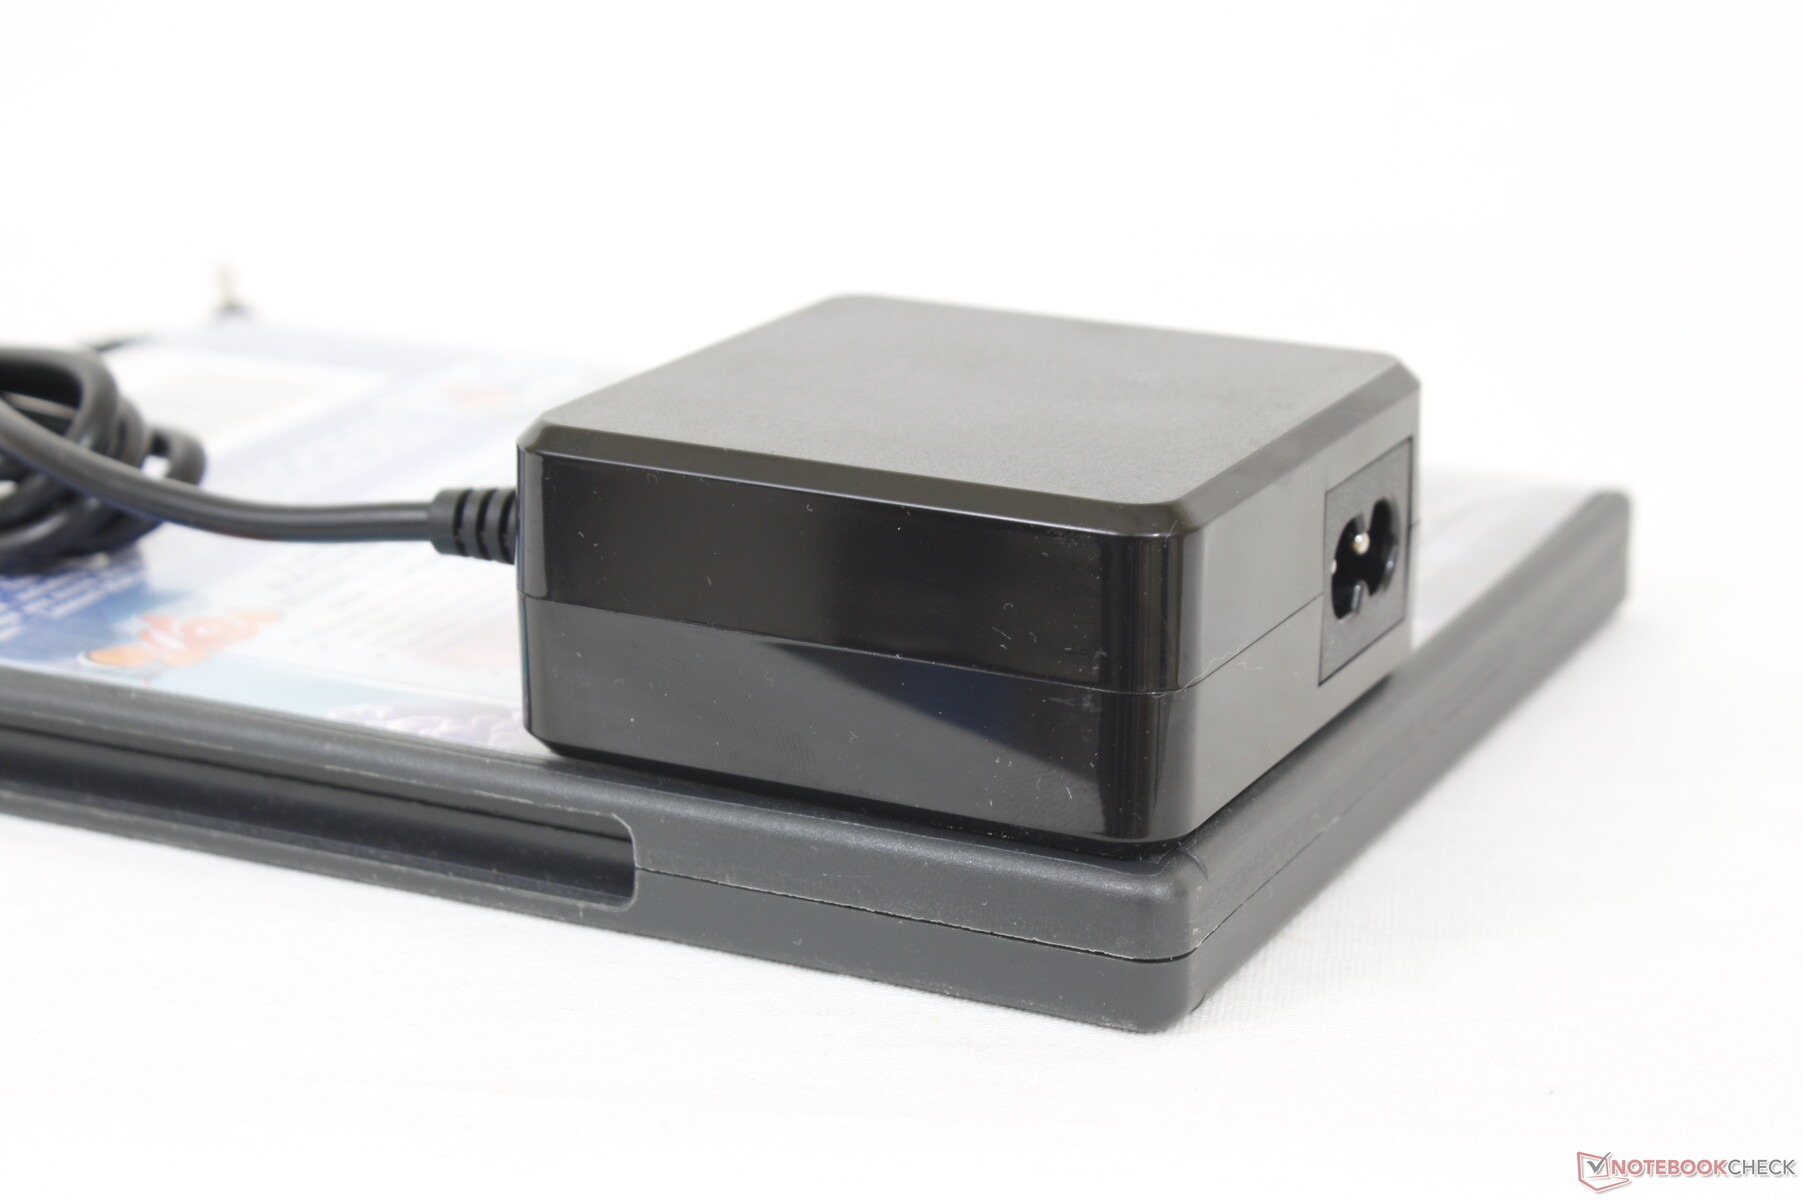
We're able to measure a maximum consumption of 40.5 W from the small (~6.4 x 6.4 x 3.0 cm) 65 W AC adapter. This rate is temporary as shown by the graphs below due to the limited Turbo Boost of the system.
| Off / Standby | |
| Idle | |
| Load |
|
| Chuwi CoreBook X i5-8259U, Iris Plus Graphics 655, Kingston RBUSNS8154P3512GJ, IPS, 2160x1440, 14.00 | Infinix INBook X1 Pro i7-1065G7, Iris Plus Graphics G7 (Ice Lake 64 EU), Phison C-E80T512G4-P3D3B3E13, IPS, 1920x1080, 14.00 | SCHENKER Vision 14 i7-1165G7, Iris Xe G7 96EUs, Samsung SSD 980 Pro 1TB MZ-V8P1T0BW, IPS, 2880x1800, 14.00 | Honor Magicbook 14 i7-1165G7 i7-1165G7, Iris Xe G7 96EUs, WDC PC SN730 SDBPNTY-512G, IPS, 1920x1080, 14.00 | LG Gram 14Z90P-G.AA79G i7-1165G7, Iris Xe G7 96EUs, SK Hynix PC601 1TB HFS001TD9TNG, IPS, 1920x1200, 14.00 | Acer Swift 5 SF514-55T-58DN i5-1135G7, Iris Xe G7 80EUs, SK Hynix BC511 HFM512GDJTNI, IPS, 1920x1080, 14.00 | |
|---|---|---|---|---|---|---|
| Power Consumption | -12% | -30% | 8% | 32% | 18% | |
| Idle Minimum * | 6.2 | 5 19% | 9.8 -58% | 4 35% | 2.5 60% | 2.4 61% |
| Idle Average * | 10.7 | 11.5 -7% | 12.5 -17% | 6 44% | 5.3 50% | 3.5 67% |
| Idle Maximum * | 12.5 | 12 4% | 13.7 -10% | 10 20% | 9.5 24% | 6.6 47% |
| Load Average * | 40.5 | 48.7 -20% | 39.3 3% | 34 16% | 26.2 35% | 47 -16% |
| Witcher 3 ultra * | 39.4 | 46.4 -18% | 44.8 -14% | |||
| Load Maximum * | 39.2 | 58.8 -50% | 72.8 -86% | 68 -73% | 42.8 -9% | 67.2 -71% |
* ... smaller is better
Power Consumption Witcher 3
Battery Life
Runtimes are slightly below average at approximately 6.5 hours of real-world WLAN use. Even so, this will likely be more than enough for most users.
Charging from empty to full capacity takes about 2 hours. The system can also be recharged via USB-C.
| Chuwi CoreBook X i5-8259U, Iris Plus Graphics 655, 46.2 Wh | Infinix INBook X1 Pro i7-1065G7, Iris Plus Graphics G7 (Ice Lake 64 EU), 55 Wh | SCHENKER Vision 14 i7-1165G7, Iris Xe G7 96EUs, 53 Wh | Honor Magicbook 14 i7-1165G7 i7-1165G7, Iris Xe G7 96EUs, 56 Wh | LG Gram 14Z90P-G.AA79G i7-1165G7, Iris Xe G7 96EUs, 72 Wh | Acer Swift 5 SF514-55T-58DN i5-1135G7, Iris Xe G7 80EUs, 56 Wh | |
|---|---|---|---|---|---|---|
| Battery Runtime | 27% | -8% | 45% | 114% | 99% | |
| WiFi v1.3 | 400 | 508 27% | 366 -8% | 580 45% | 854 114% | 794 99% |
| Load | 107 | 219 | 96 | |||
| Reader / Idle | 2925 |
Pros
Cons
Verdict
The Chuwi CoreBook X is impressive at first glance. Its glossy display is crisp and with full sRGB color coverage while its firm keyboard keys and large clickpad are satisfying to use. The easily expandable RAM and M.2 storage are also worth noting and the Core U-series CPU is significantly faster than the usual Atom or Celeron as found on most other ultra-cheap laptops. For only about $500 USD, it rivals pricier models like the Honor MagicBook 14 or Acer Swift 5 SF514 very well especially in terms of display quality.
Its specifications and display are a huge bargain for the price. However, don't be surprised if you run into some QA issues after a few months of use.
There are a few cut corners that buyers ought to keep in mind. The first is longevity as the system doesn't feel like it's built to last. The hinges in particular are weak, coil whine is annoyingly loud, and the fan pulses very frequently for an ULV laptop. Our experiences with past Chuwi devices don't inspire much confidence on how the CoreBook X will hold up one or two years down the line.
Price and availability
Our exact configuration can currently be found on Amazon for $499 USD when on sale. The system is also available via the official Chuwi online store.
Chuwi CoreBook X
-
07/01/2021 v7
Allen Ngo


Pricecompare
