Apple MacBook Pro 13 2020 Laptop Review: The entry-level Pro also gets the M1 performance boost
While the new MacBook Air is now exclusively powered by Apple's own ARM silicon, we still get two completely different models of the more expensive MacBook Pro 13. Apple still offers the version with four Thunderbolt ports and Intel CPUs (28W) in the higher price range starting from $1799, and the previous entry-level MBP 13 with two Thunderbolt ports and the slower Intel CPUs (15W) is now equipped with the Apple M1 chip. The price of the new MBP 13 M1 starts at $1299 ($1199 in the education store).
We will obviously compare the new MacBook Pro 13 with the more expensive model (4x Thunderbolt), but also the MacBook Air M1 we have already reviewed. The Air did get more improvements, so we want to find out if the less expensive MacBook Air might even be the better choice.
possible competitors in comparison
Rating | Date | Model | Weight | Height | Size | Resolution | Price |
|---|---|---|---|---|---|---|---|
| 91.1 % v7 (old) | 12 / 2020 | Apple MacBook Pro 13 Late 2020 M1 Entry (8 / 256 GB) M1, M1 8-Core GPU | 1.4 kg | 15.6 mm | 13.30" | 2560x1600 | |
| 92.1 % v7 (old) | 06 / 2020 | Apple MacBook Pro 13 2020 2GHz i5 10th-Gen i5-1038NG7, Iris Plus Graphics G7 (Ice Lake 64 EU) | 1.4 kg | 15.6 mm | 13.30" | 2560x1600 | |
| 90.6 % v7 (old) | 02 / 2020 | Apple MacBook Pro 13 2019 2TB3 i5-8257U, Iris Plus Graphics 645 | 1.4 kg | 14.9 mm | 13.30" | 2560x1600 | |
| 91.1 % v7 (old) | 12 / 2020 | Apple MacBook Air 2020 M1 Entry M1, M1 7-Core GPU | 1.3 kg | 16.1 mm | 13.30" | 2560x1600 | |
| 88.1 % v7 (old) | 10 / 2020 | Dell XPS 13 9310 Core i7 FHD i7-1165G7, Iris Xe G7 96EUs | 1.3 kg | 14.8 mm | 13.40" | 1920x1200 | |
| 87.4 % v7 (old) | 06 / 2020 | Huawei MateBook X Pro 2020 i7 i7-10510U, GeForce MX250 | 1.3 kg | 14.6 mm | 13.90" | 3000x2000 | |
| 86.6 % v7 (old) | 12 / 2020 | Razer Book 13 FHD i7-1165G7, Iris Xe G7 96EUs | 1.4 kg | 15.15 mm | 13.40" | 1920x1200 |
Case - No visible differences
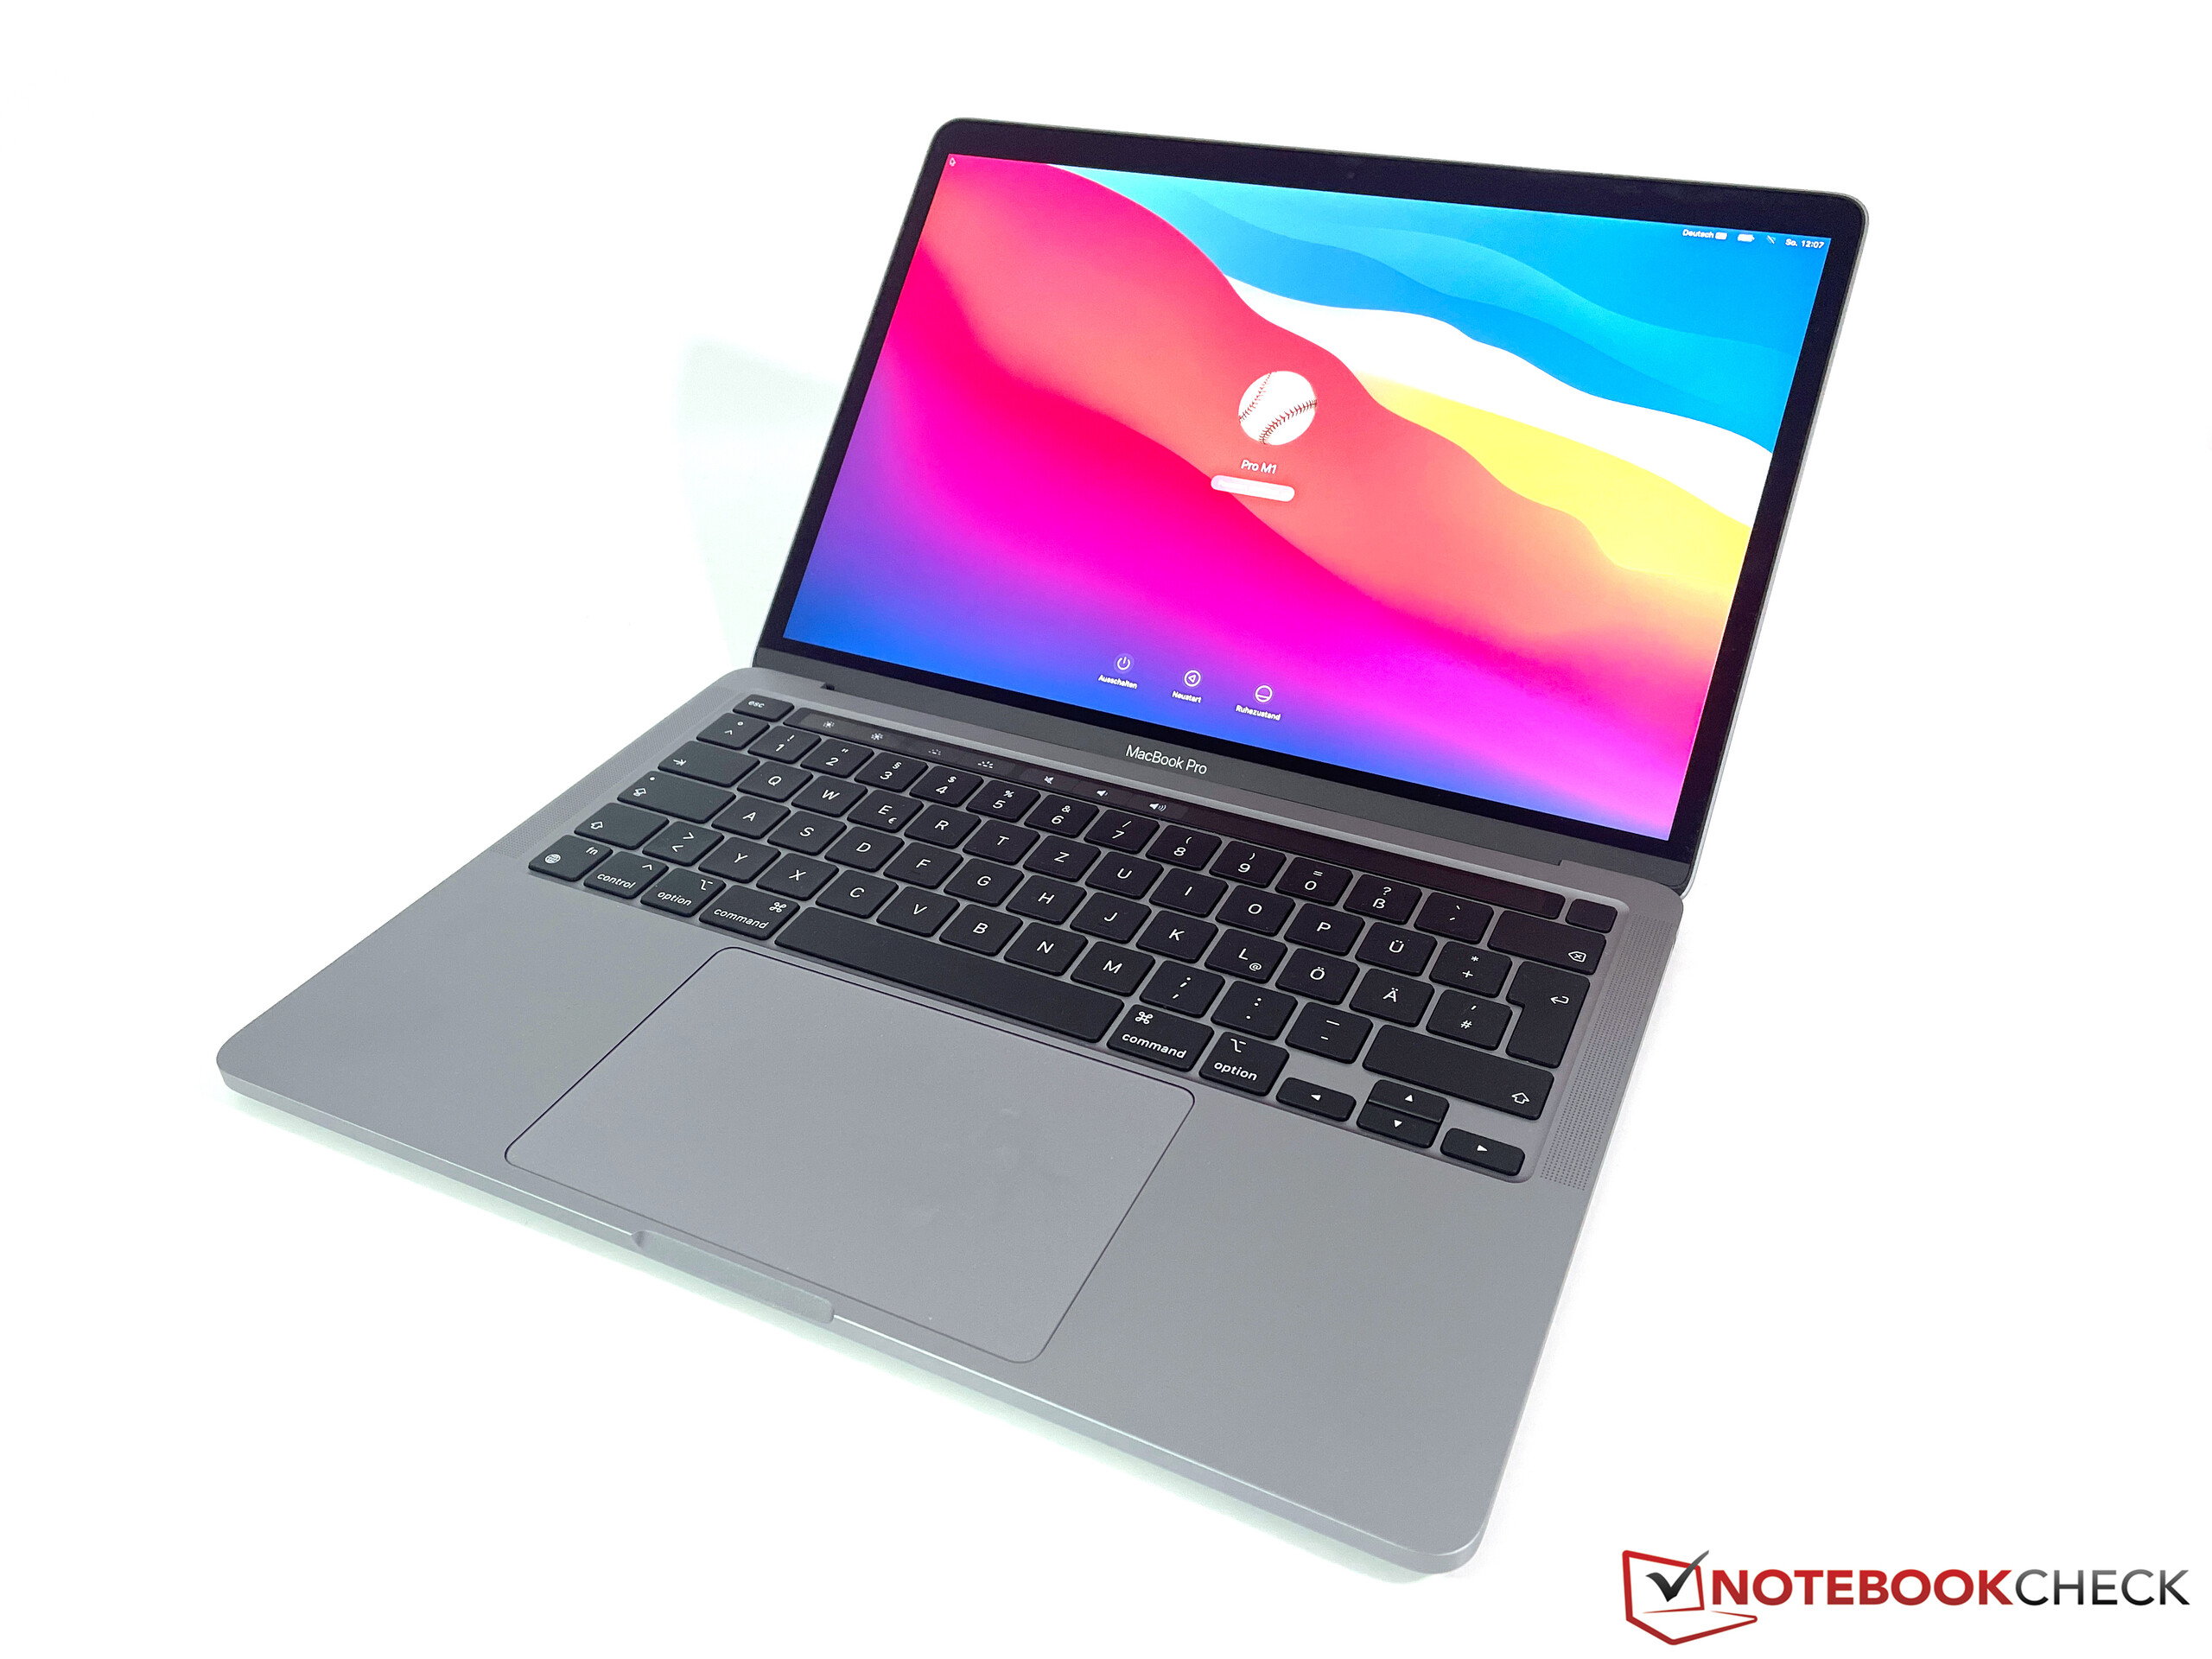
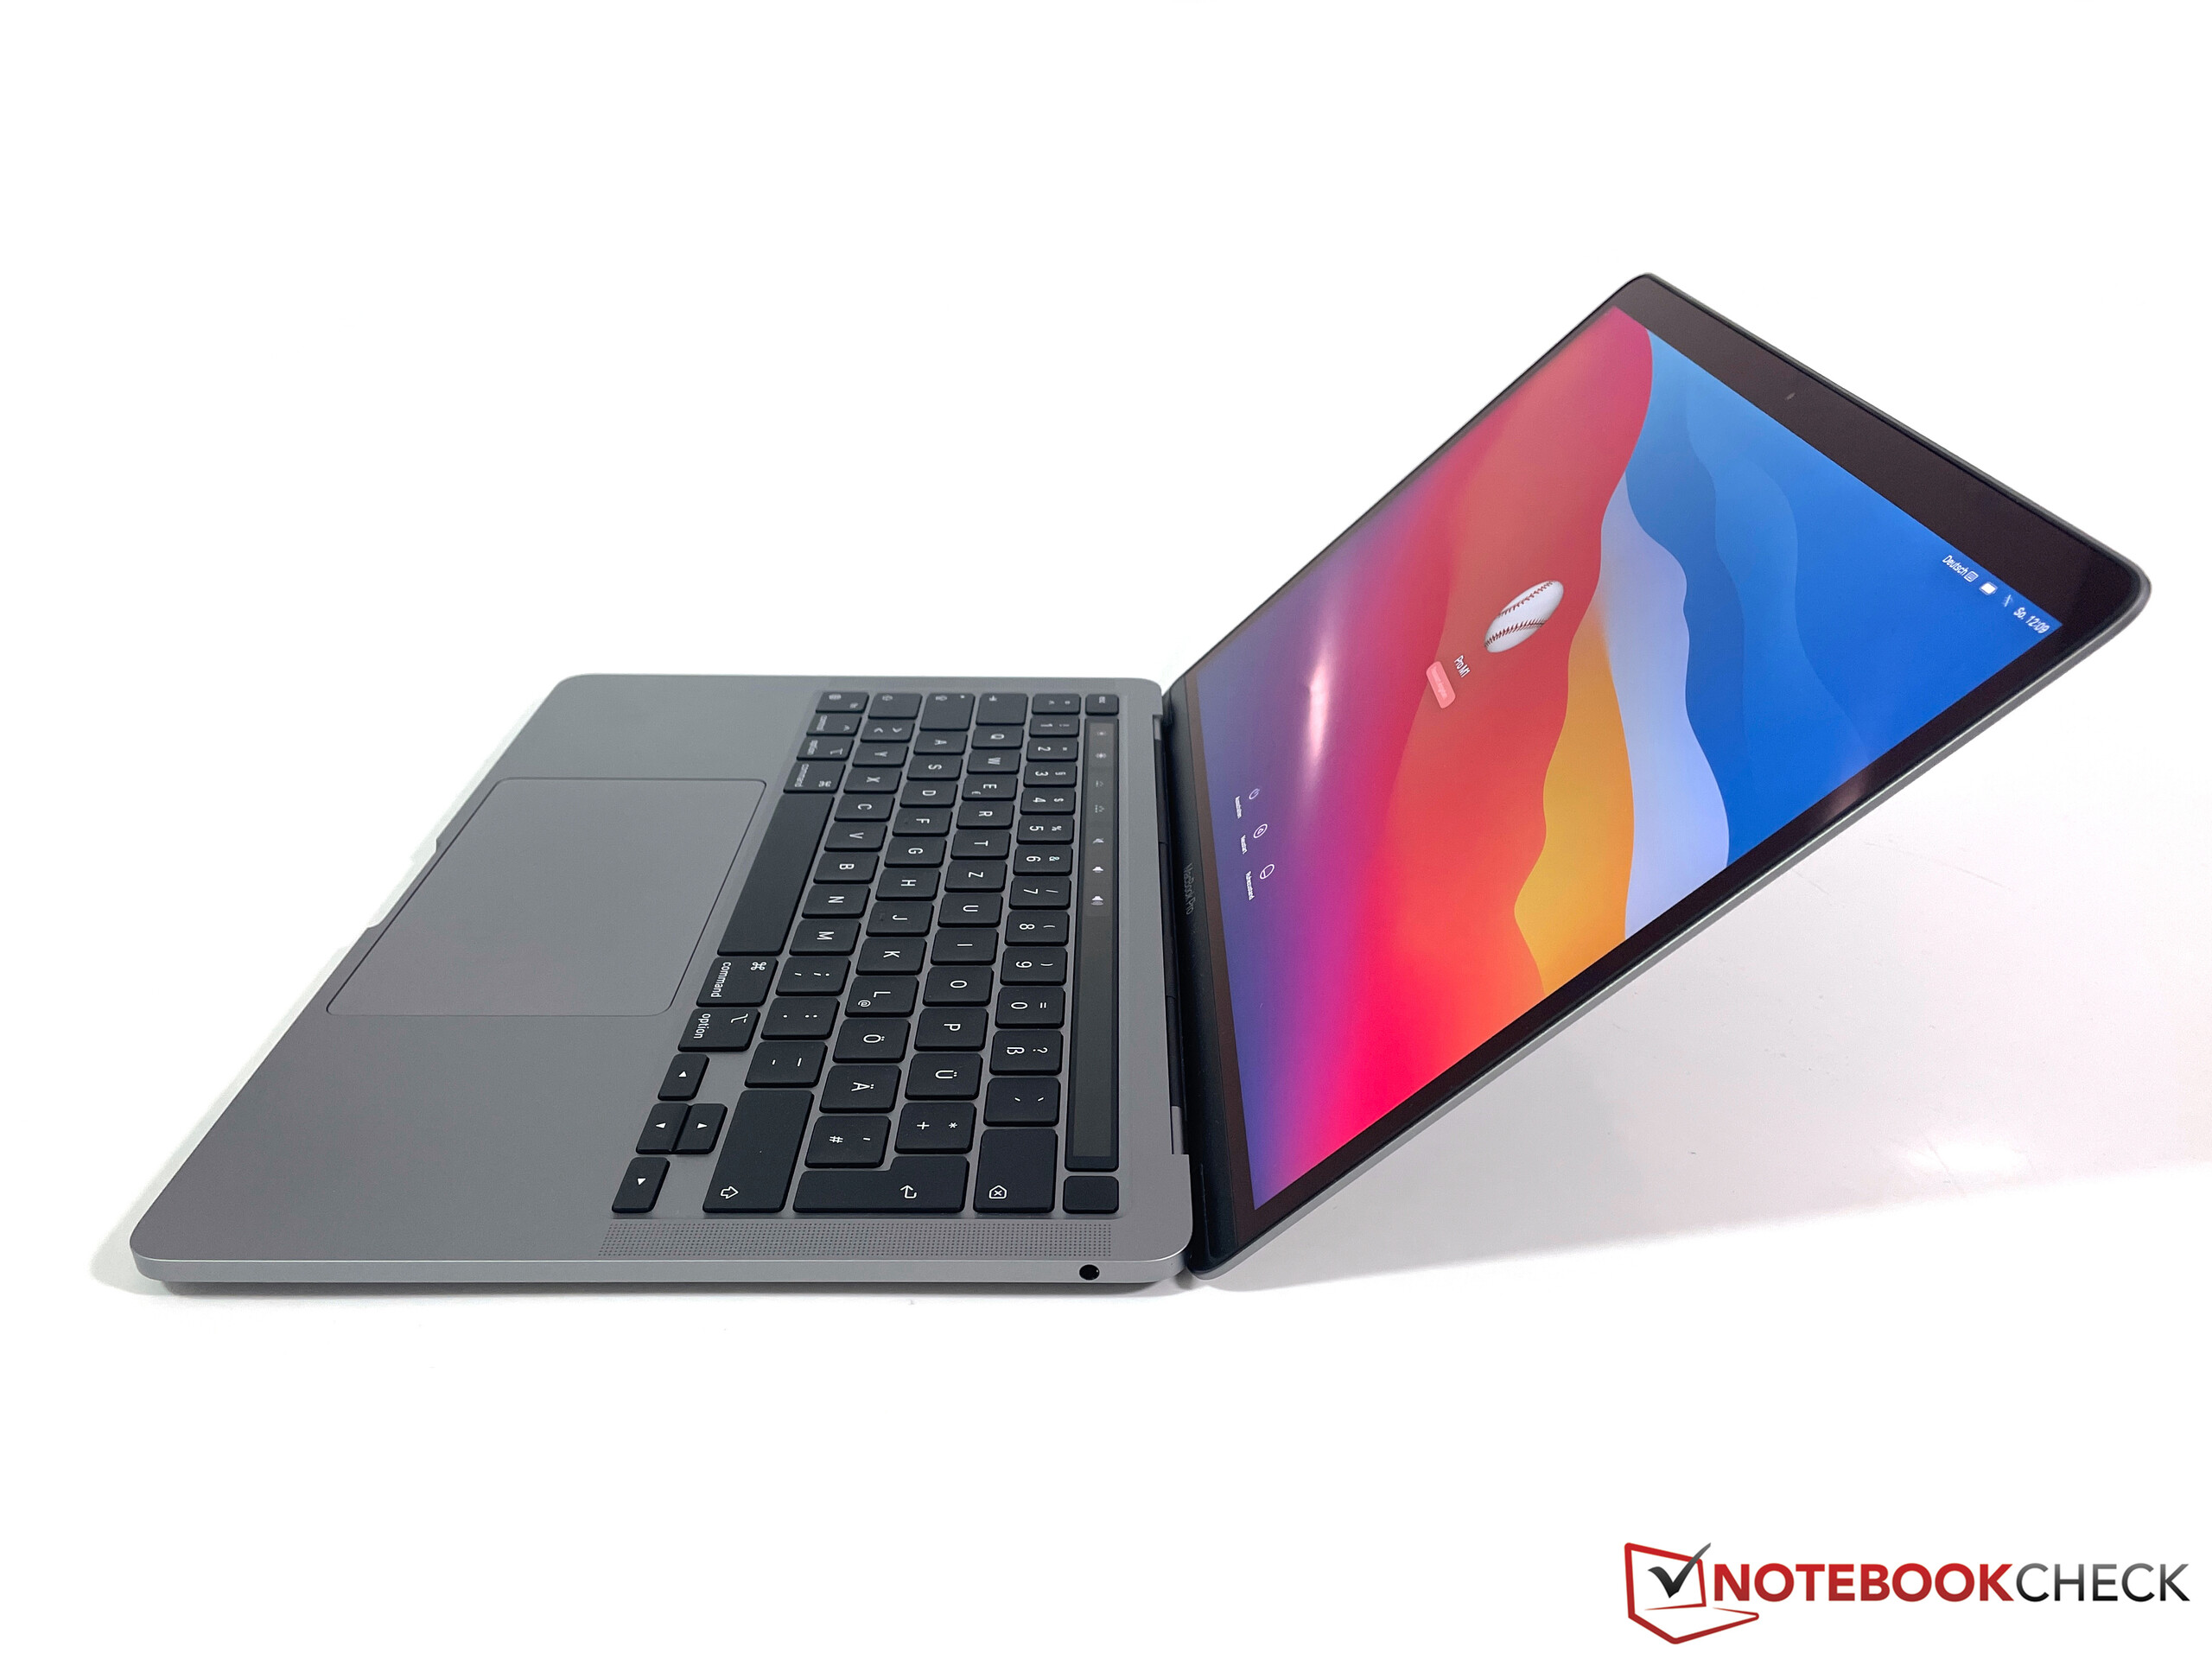
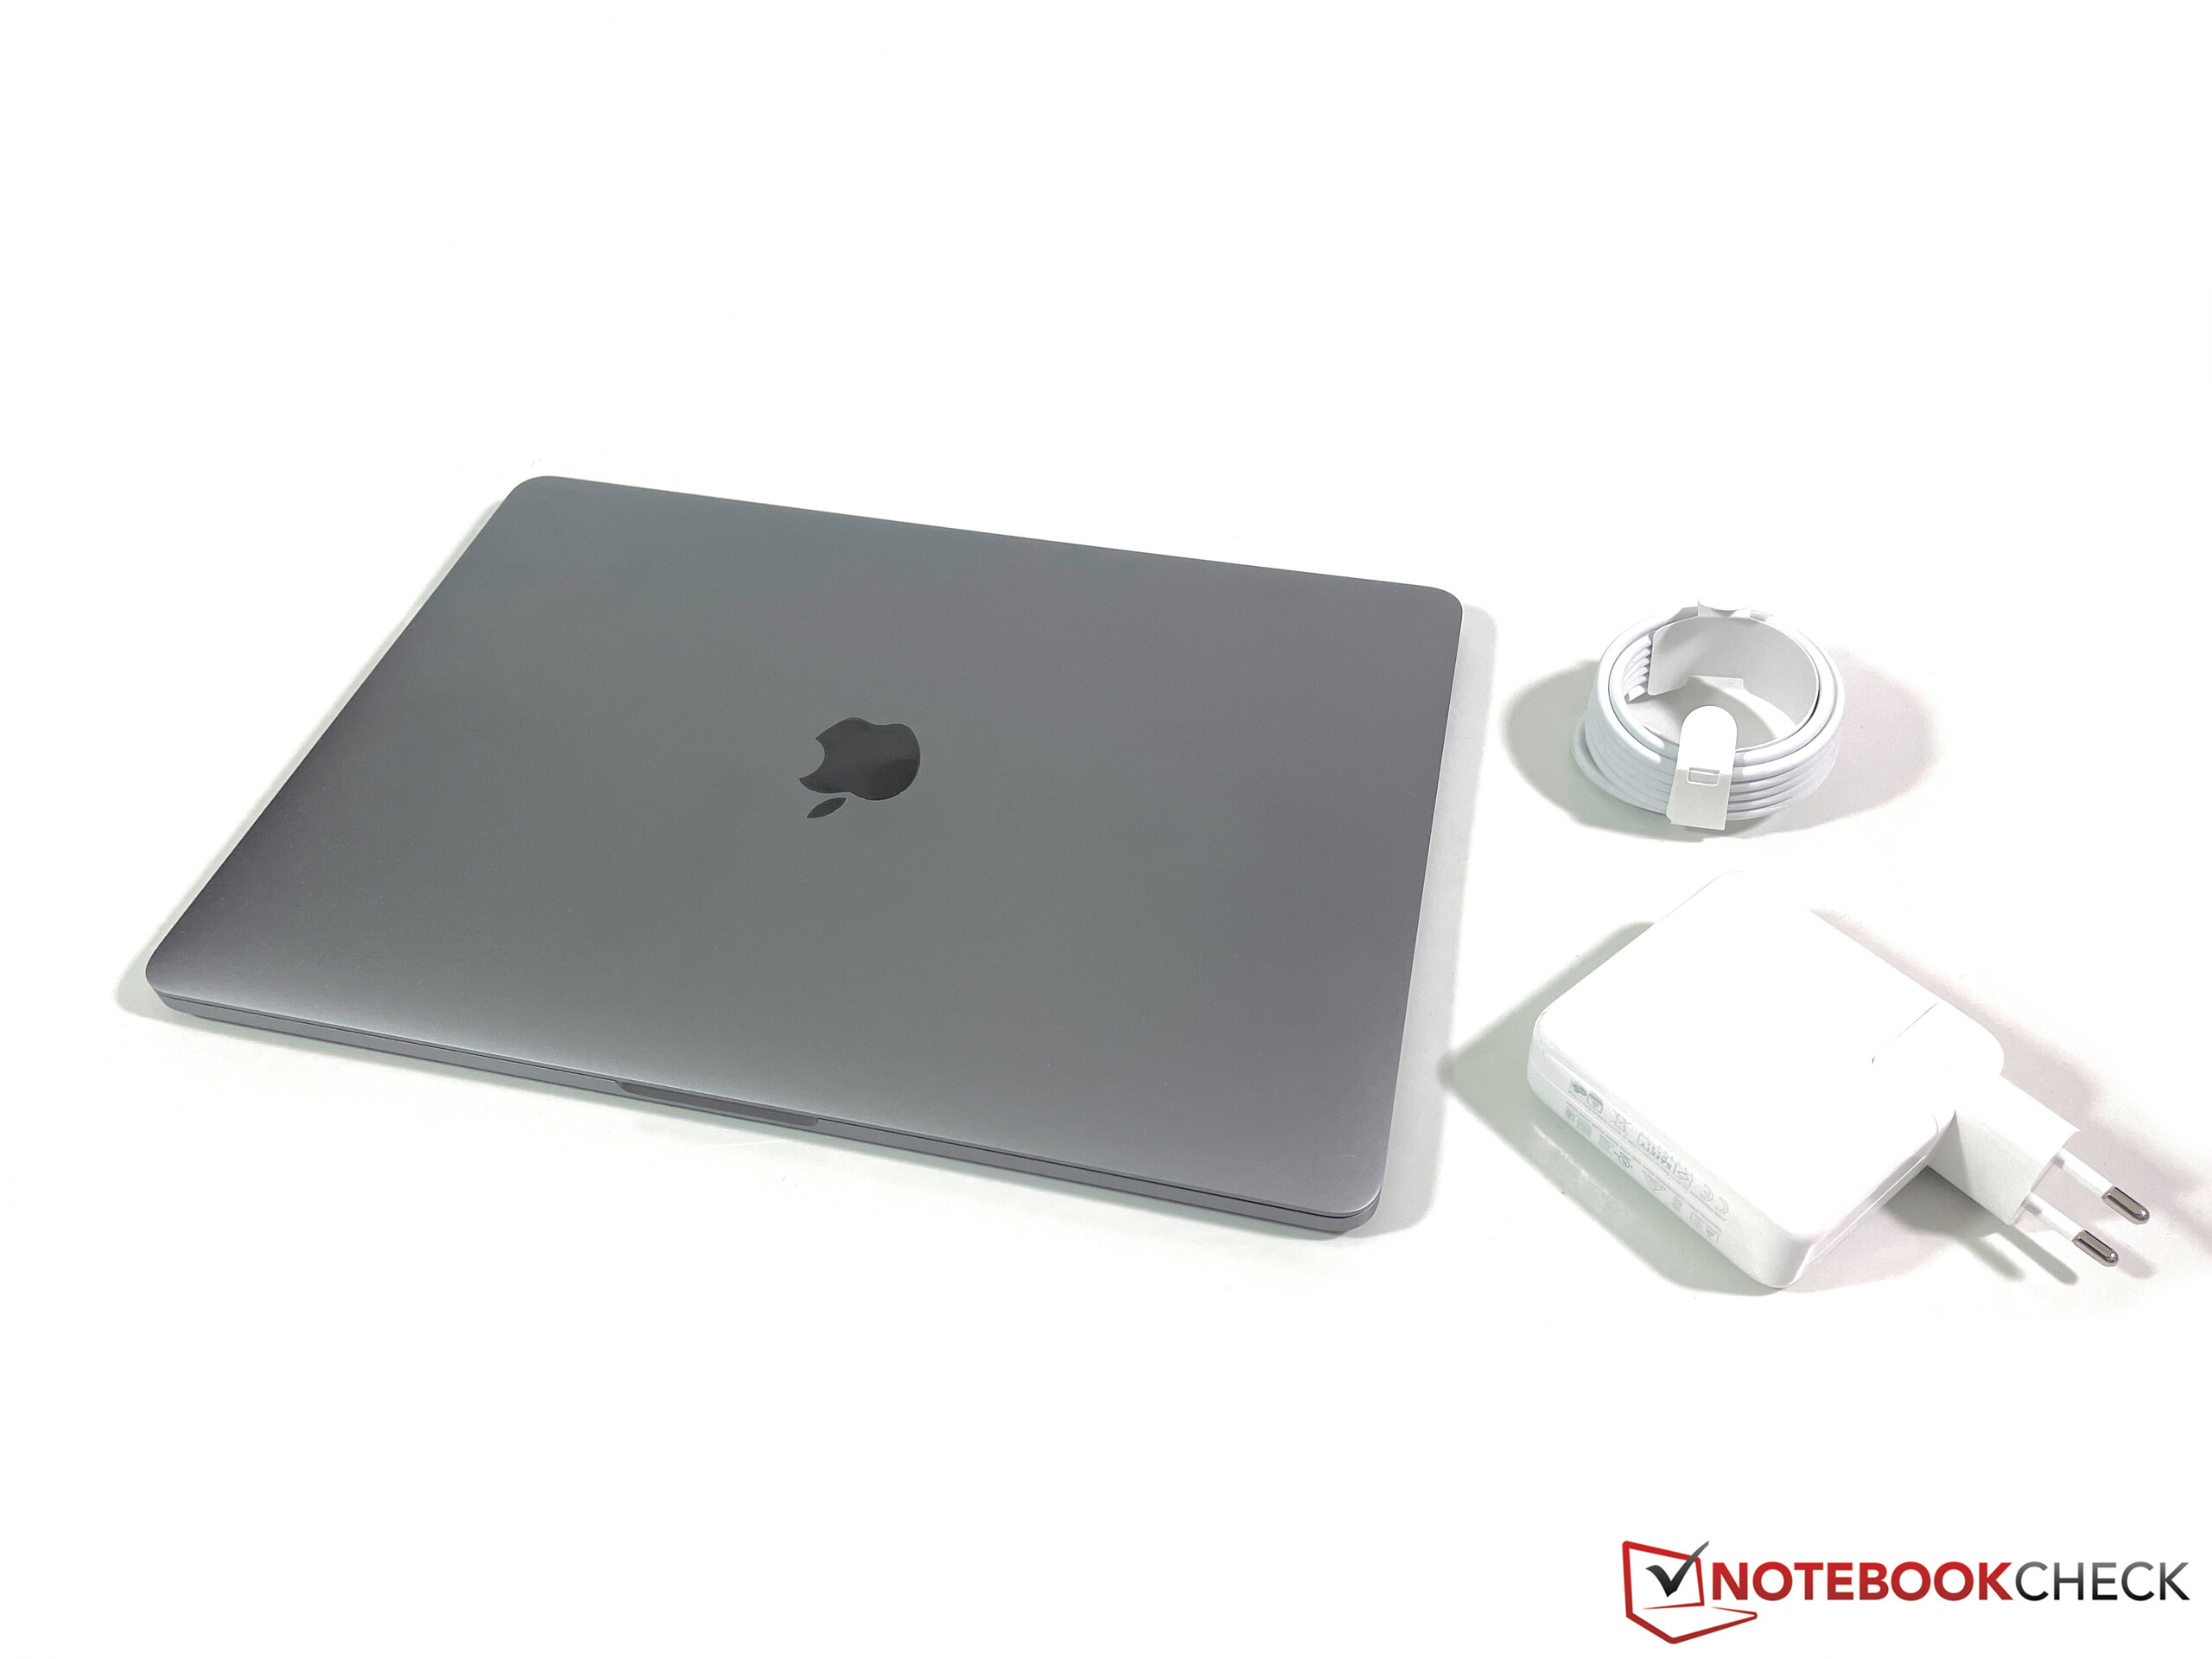
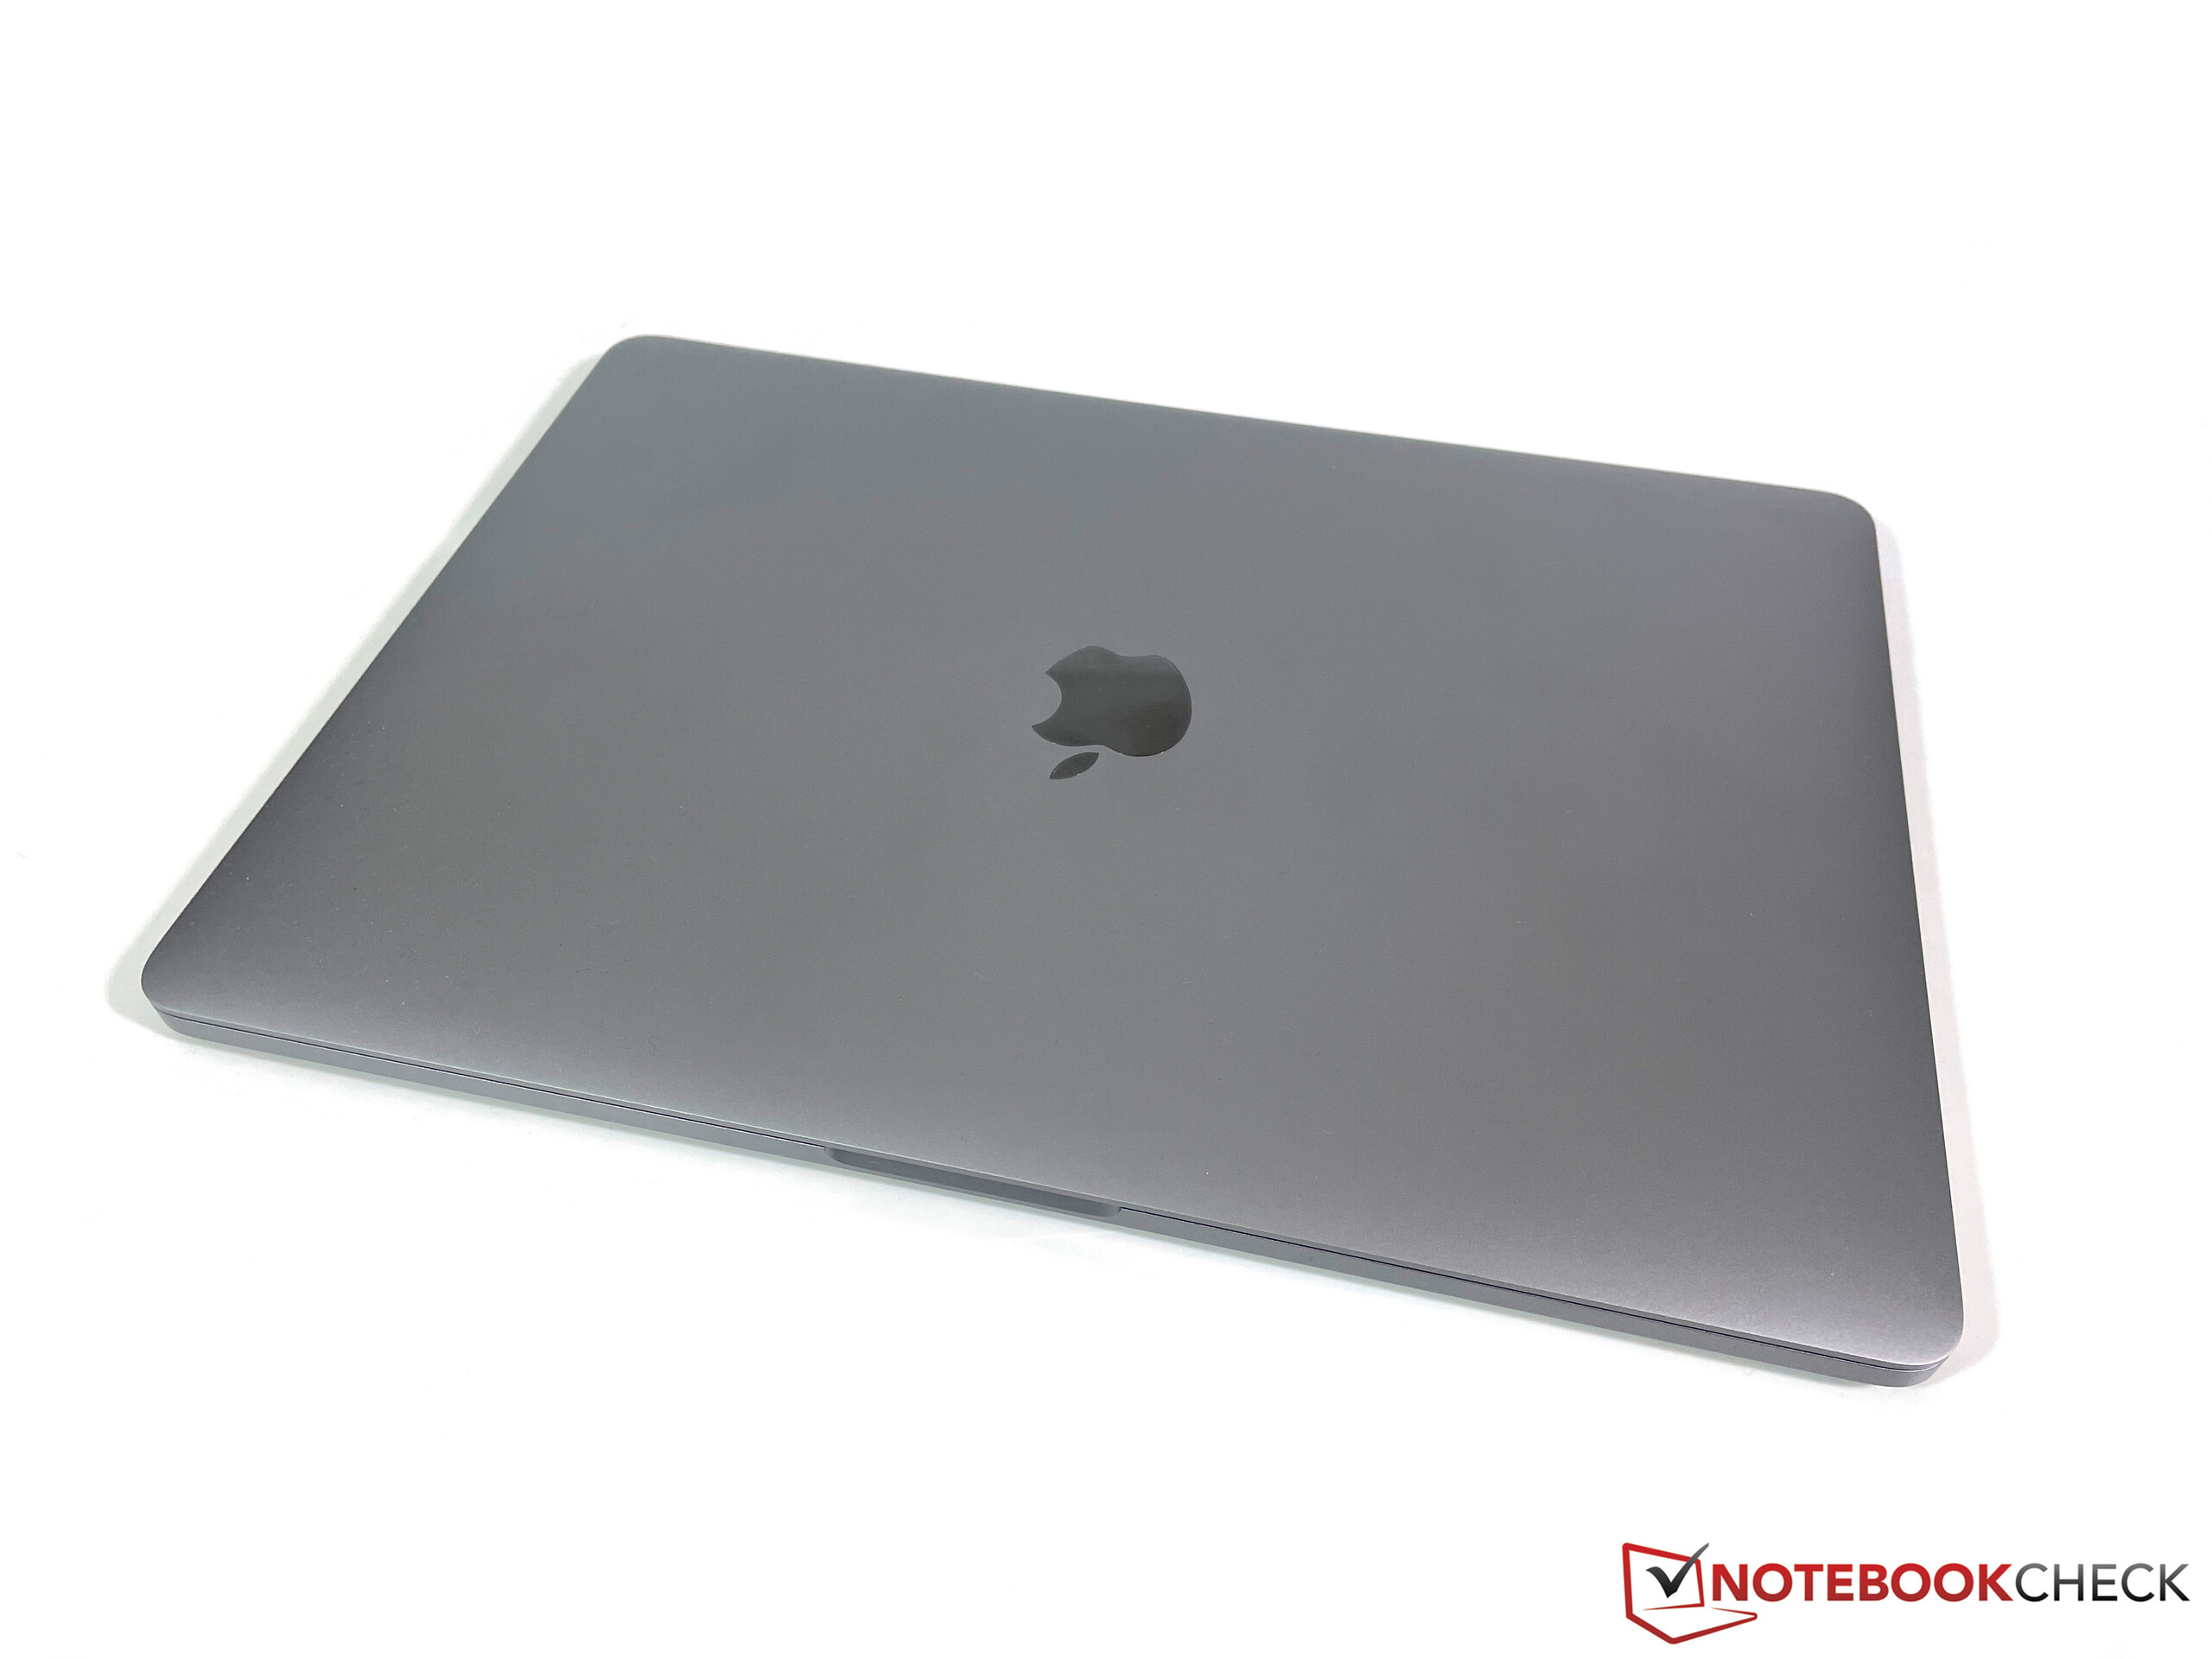
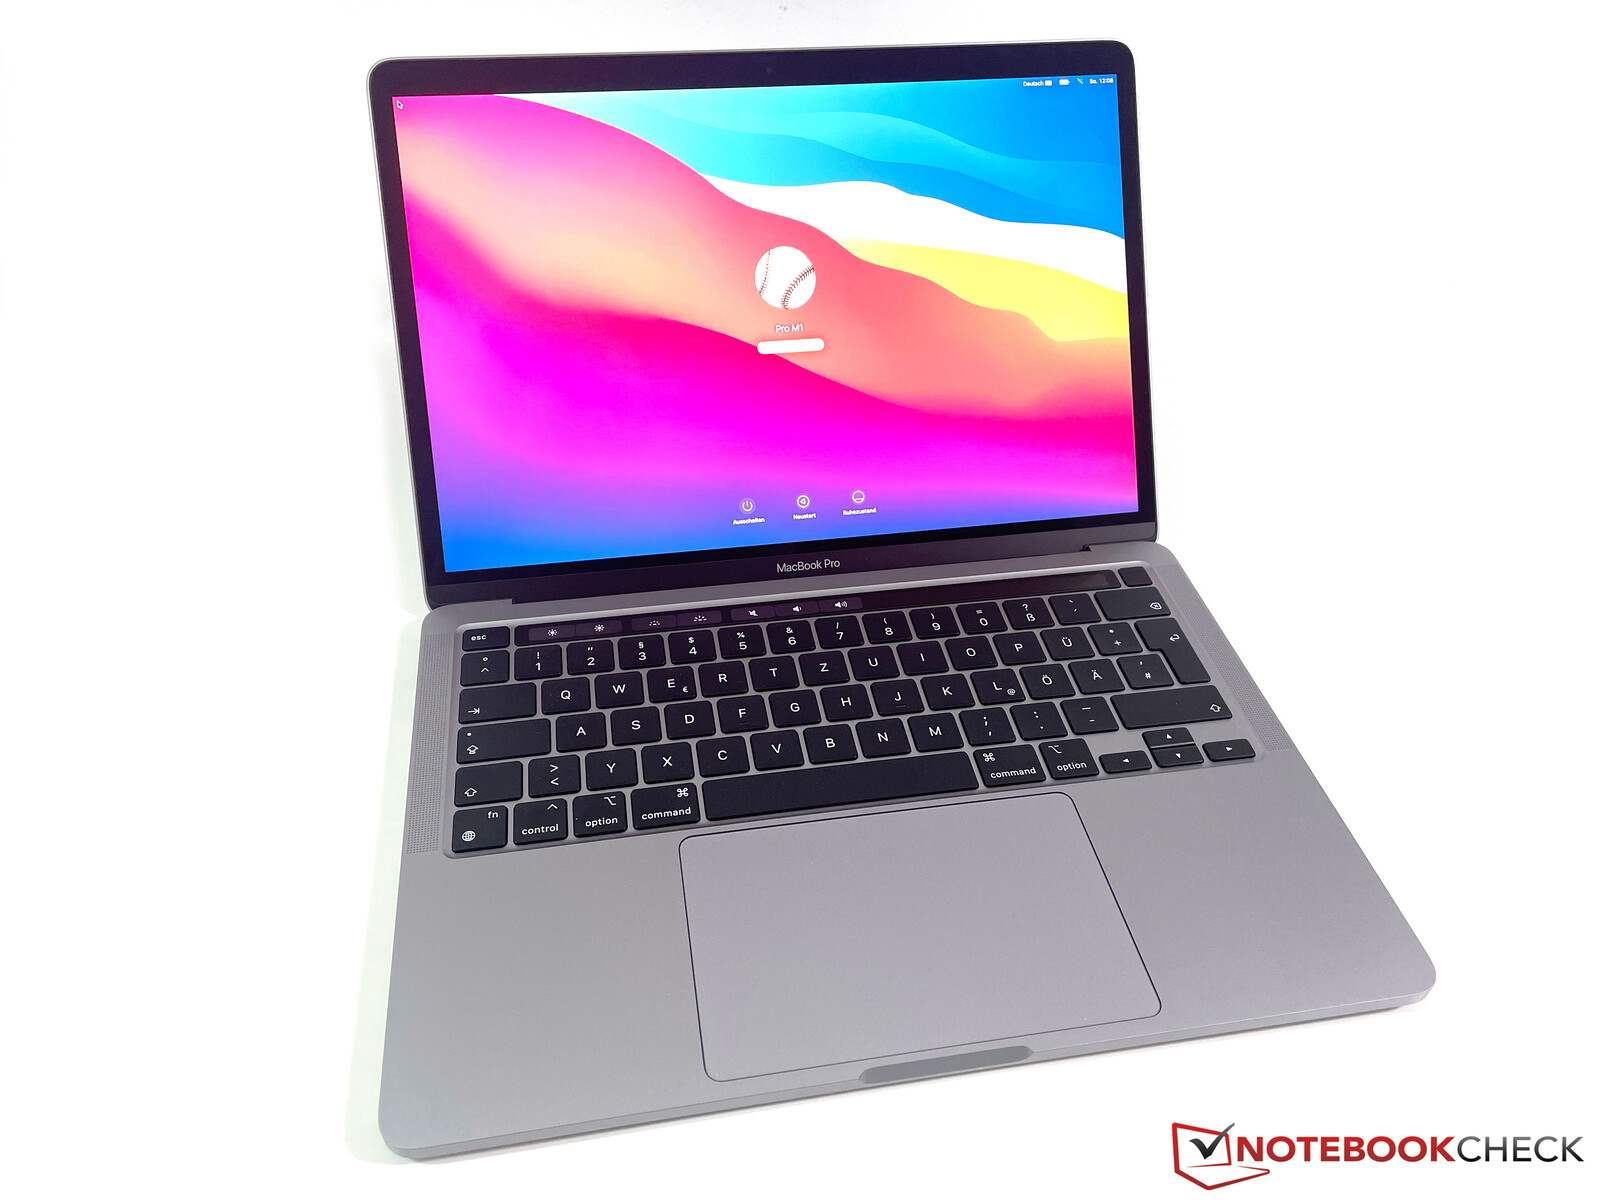
Apple did not touch the familiar unibody chassis from the entry-level MBP 13 and you can still choose between silver and space gray models. The quality of the MacBook Pro is still excellent, and the surfaces are not very prone to dirt or grease in practice. However, you start to notice the age of the case design, because the bezels are pretty wide compared to rivals like the Dell XPS 13, for example.
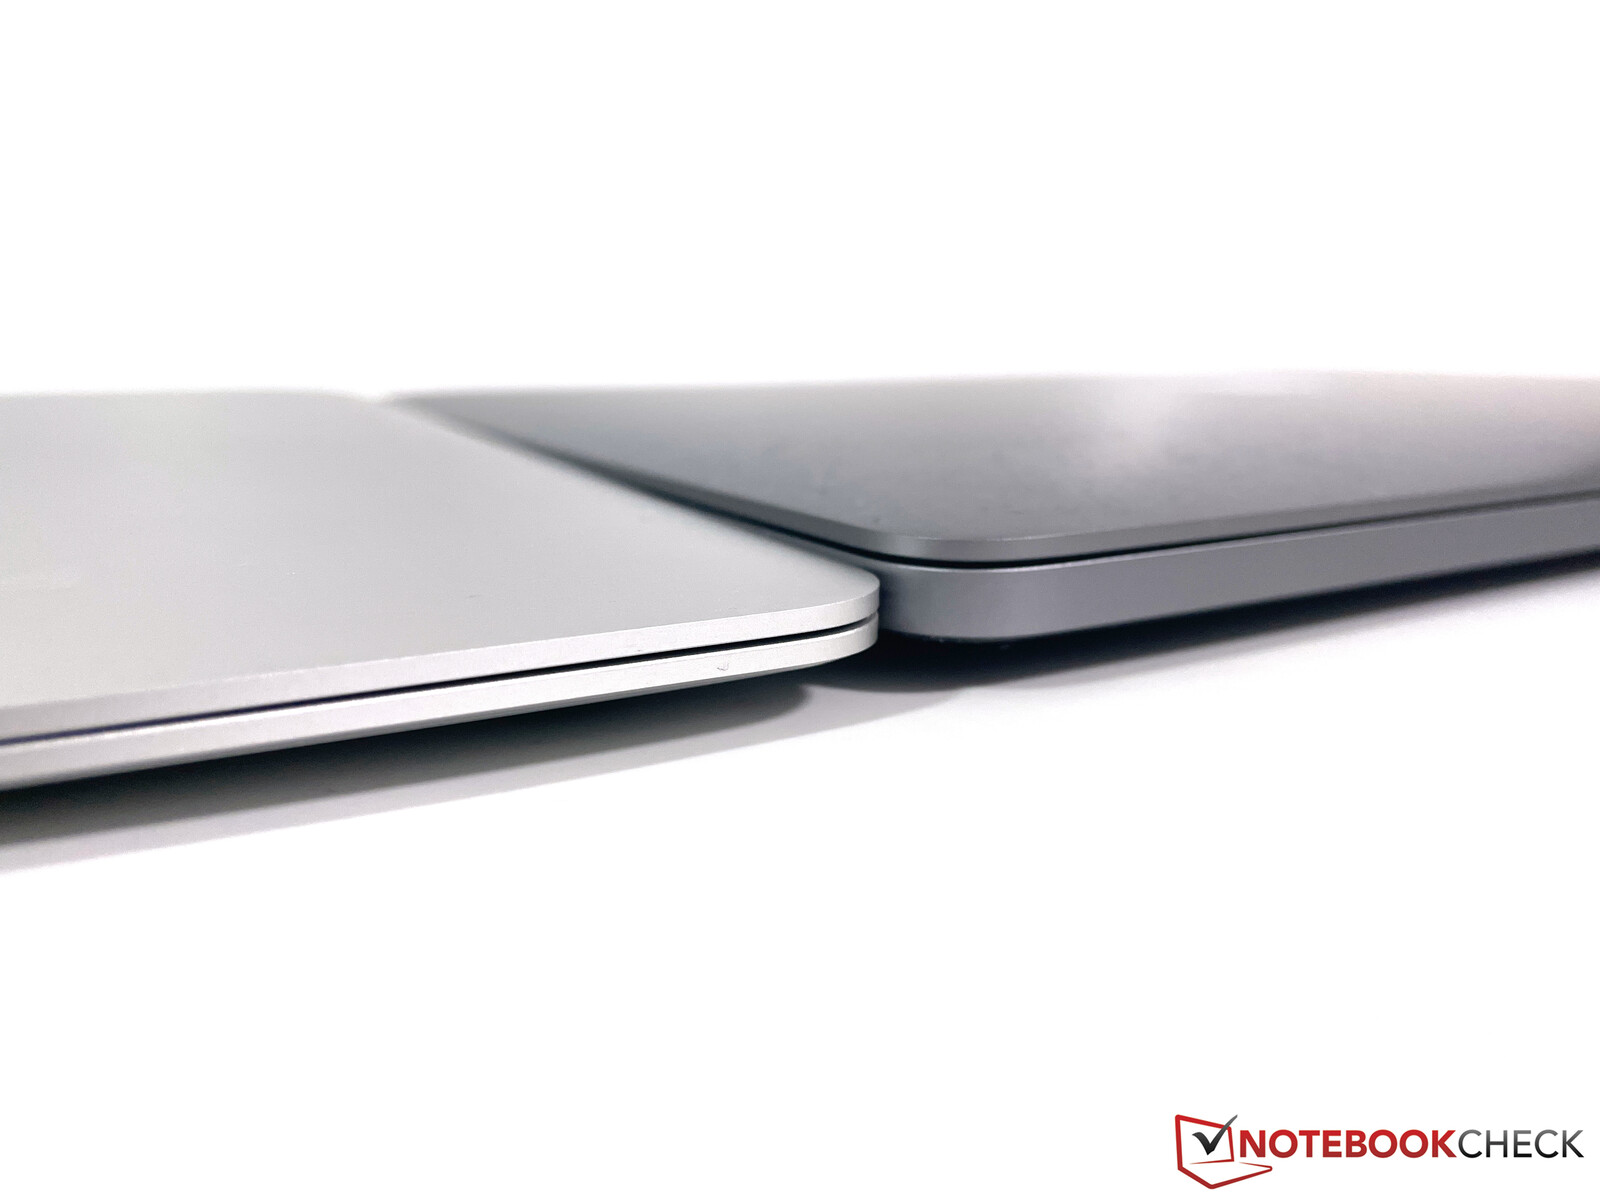
The MacBook Pro 13 and the MacBook Air have the same footprint, but the MacBook Air gets slimmer towards the front. Therefore, it is a bit more comfortable when you type because the front edge of the MBP 13 is pretty sharp. The weight advantage for the Air is not huge at ~150 grams.
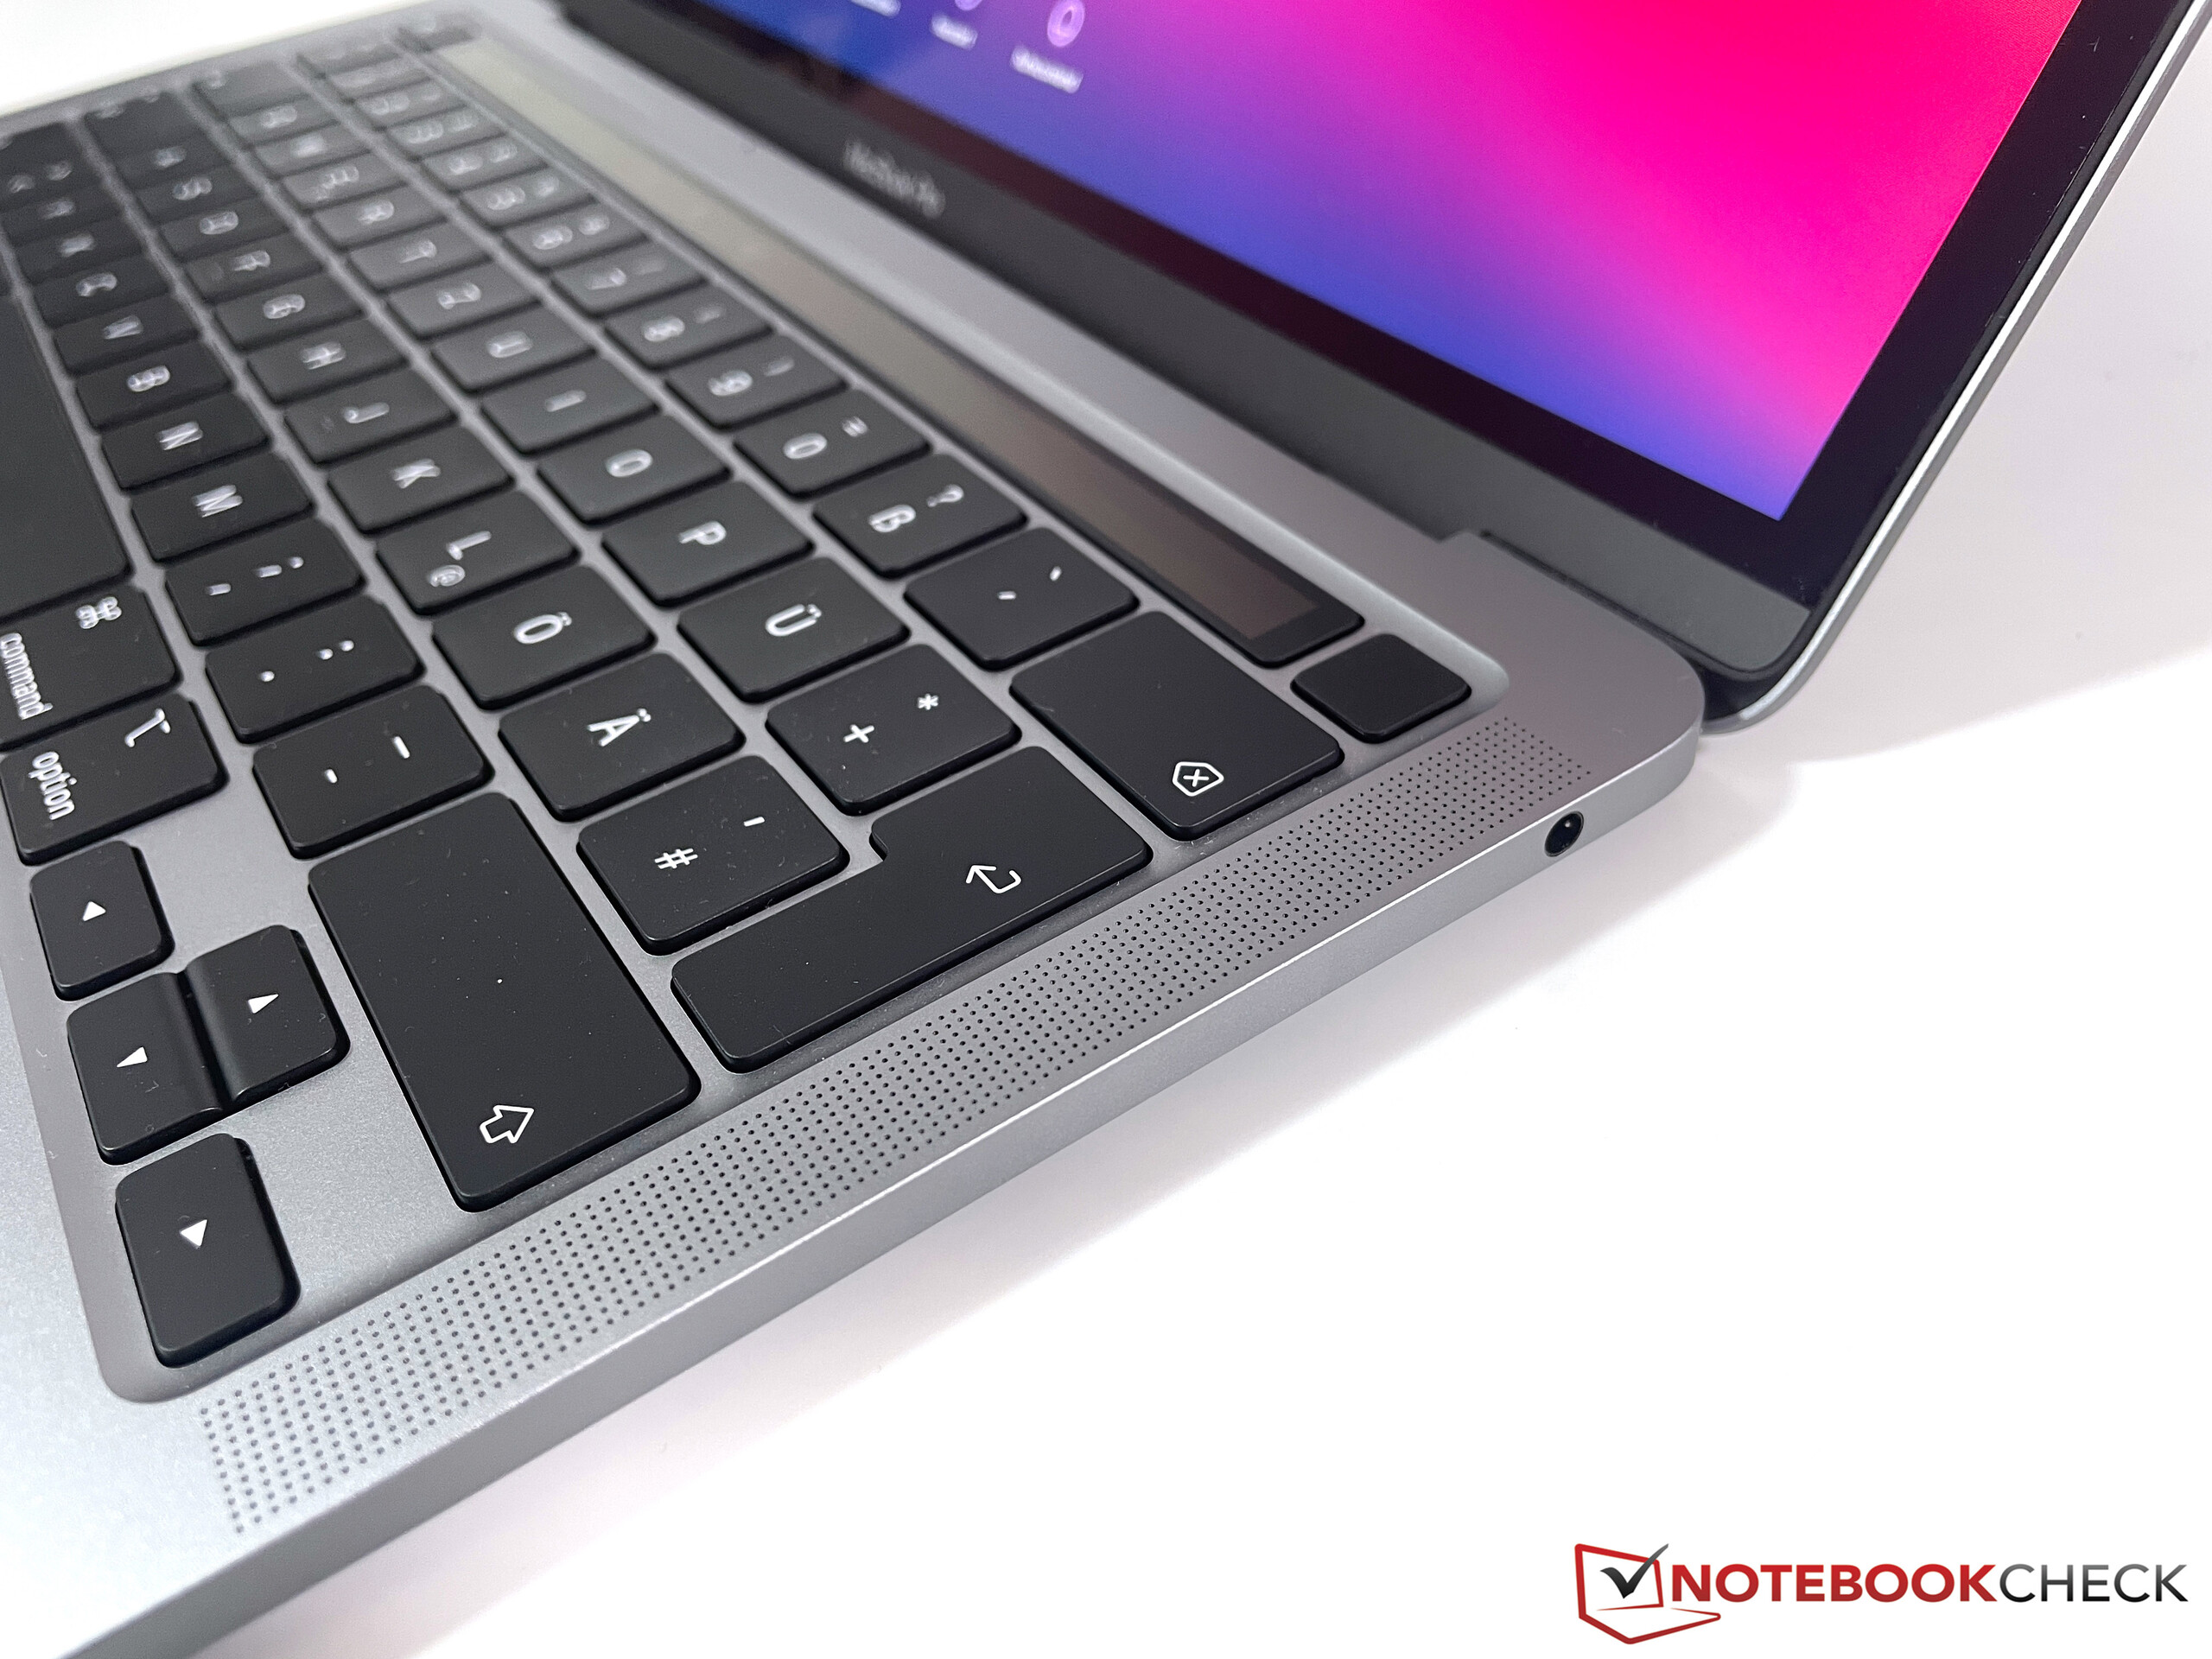
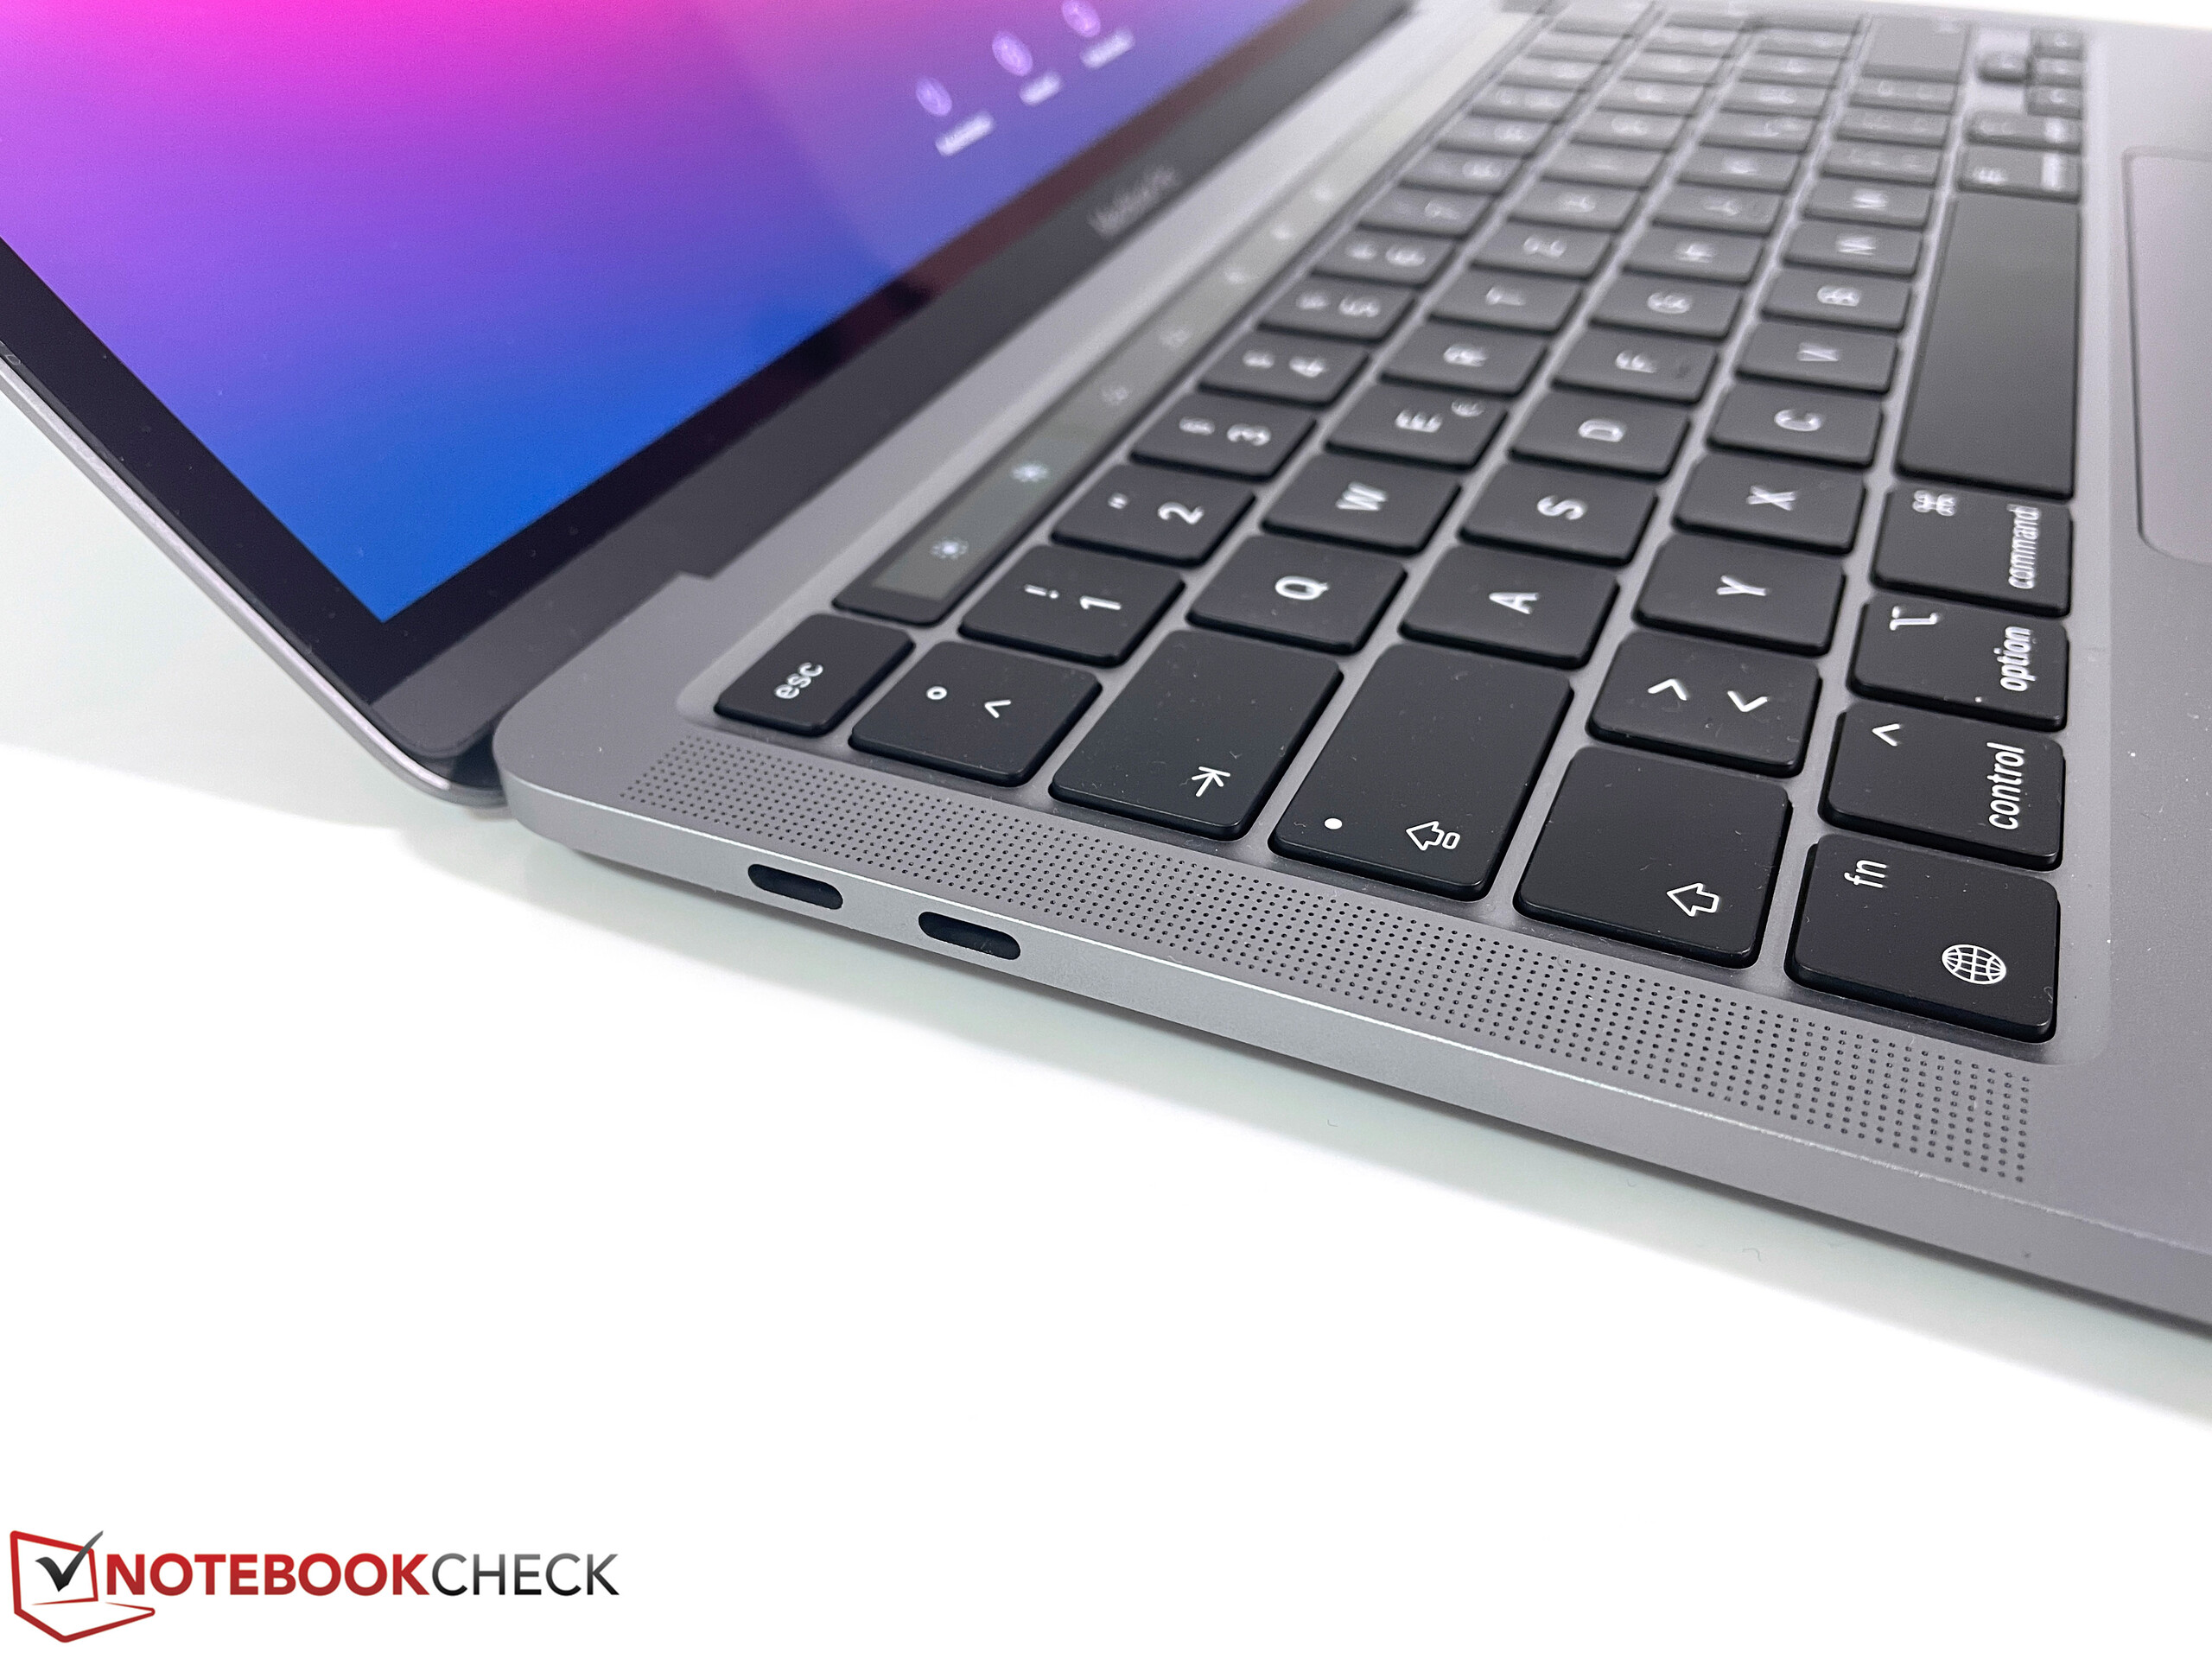
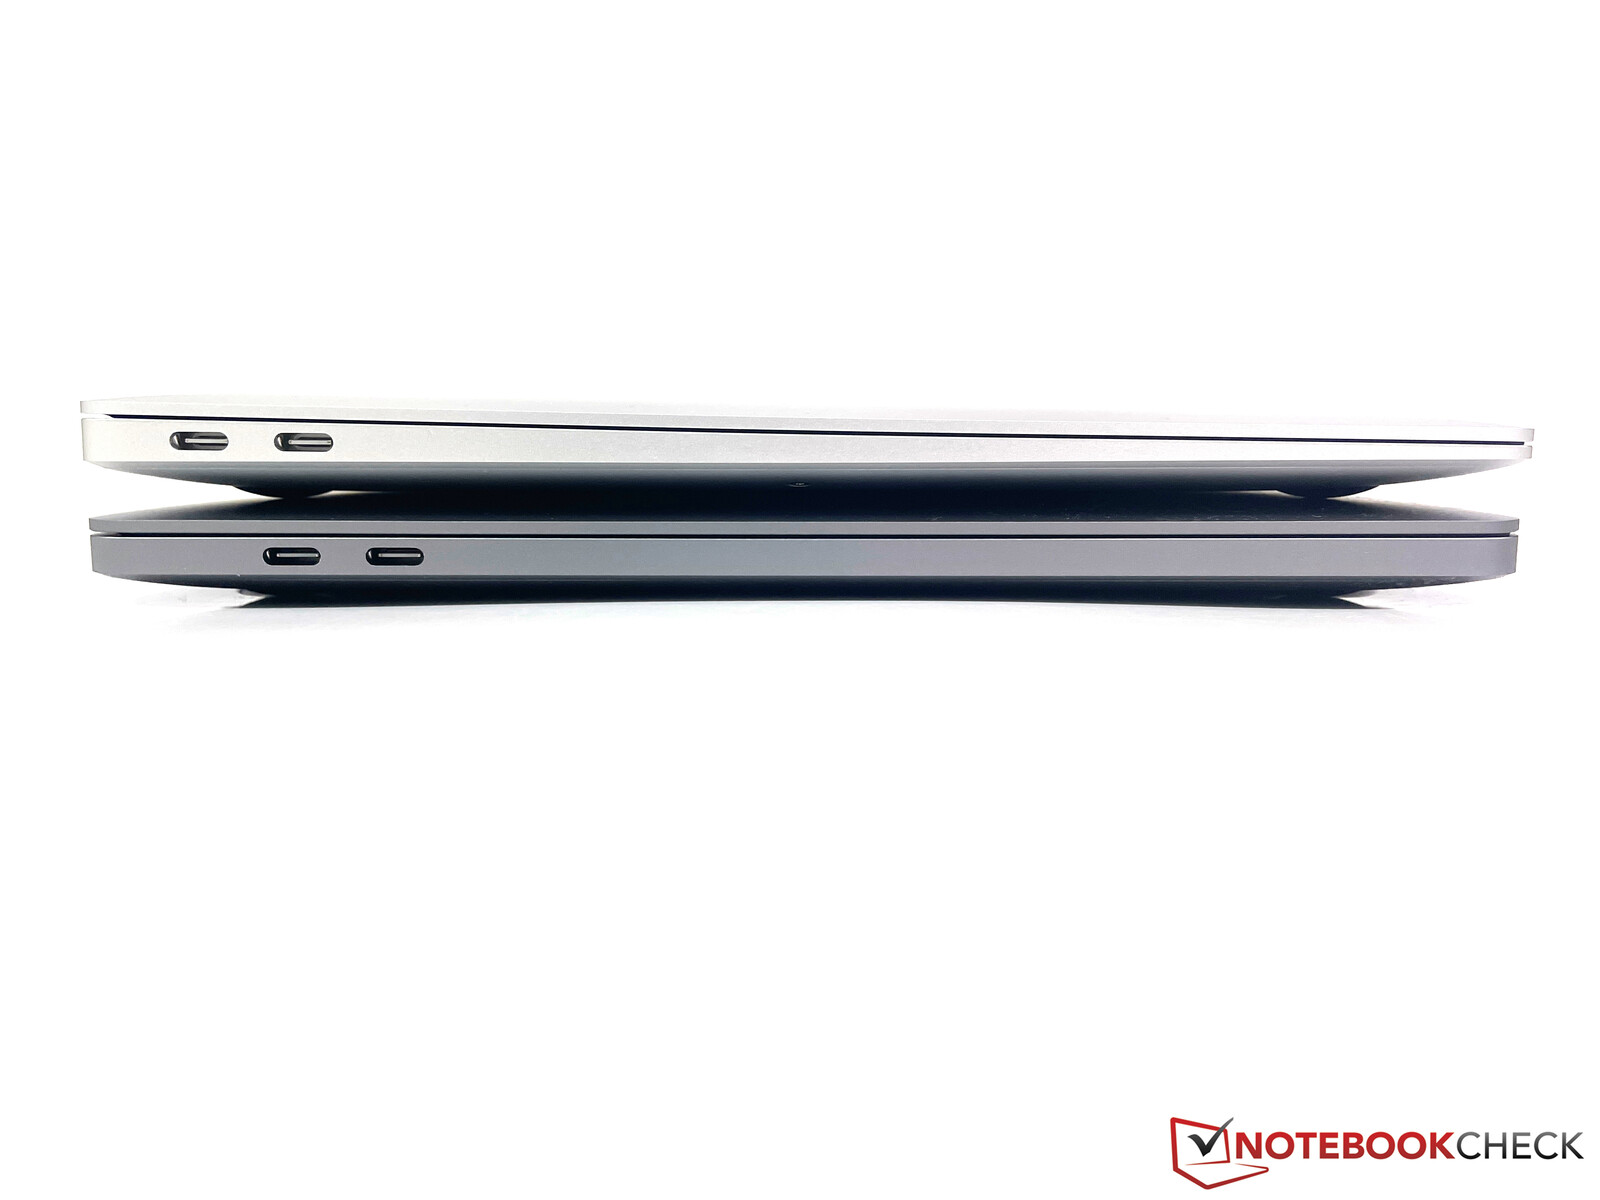
Connectivity - MBP 13 M1 with USB 4 and Wi-Fi 6
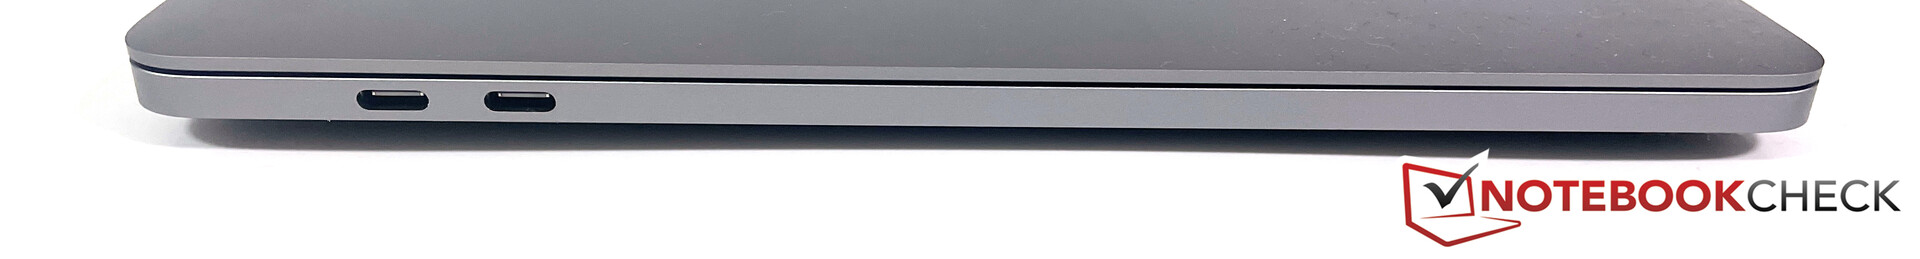
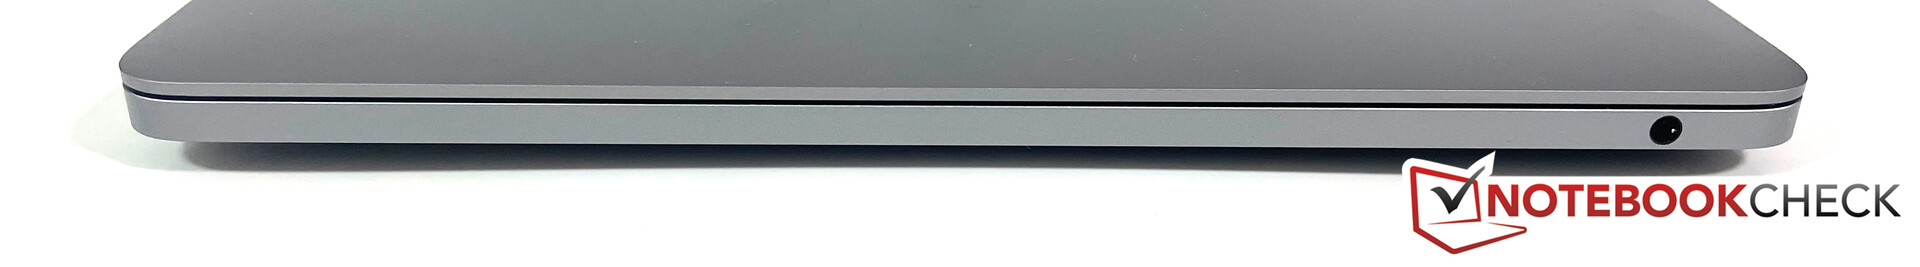
You still get a 3.5 mm stereo jack at the right and two Thunderbolt 3 ports (USB-C connectors) at the left side. They now also support USB 4, but the transfer rate is limited to 10 Gbps just like USB 3.1 Gen.2. There can still be compatibility issues when you connect peripherals, as we have already seen in our review of the new MacBook Air. One of the two ports is blocked by the power adapter, and the ports are also very close to each other, which can be an issue when you use wider thumb drives, for example.
Communication - Only 80 MHz Wi-Fi 6
Similar to the MacBook Air M1 and other Apple products with Wi-Fi 6 (e. g. iPads), the Wi-Fi module (2x2) supports the fast 802.11ax standard, but only 80 MHz and not 160 MHz connections. Therefore, the transfer rates are not better compared to the direct predecessor MBP 13 2020 with the Intel CPU and Wi-Fi 5. The Windows competition has an advantage here, even with older Wi-Fi 5 modules (160 MHz).
| Networking | |
| iperf3 transmit AX12 | |
| Huawei MateBook X Pro 2020 i7 | |
| Razer Book 13 FHD | |
| Dell XPS 13 9310 Core i7 FHD | |
| Apple MacBook Pro 13 2020 2GHz i5 10th-Gen | |
| Average 802.11 a/b/g/n/ac/ax (405 - 1750, n=103) | |
| Apple MacBook Pro 13 2020 2TB3 i5 | |
| Apple MacBook Pro 13 Late 2020 M1 Entry (8 / 256 GB) | |
| Apple MacBook Air 2020 M1 Entry | |
| iperf3 receive AX12 | |
| Razer Book 13 FHD | |
| Dell XPS 13 9310 Core i7 FHD | |
| Huawei MateBook X Pro 2020 i7 | |
| Apple MacBook Pro 13 2020 2GHz i5 10th-Gen | |
| Average 802.11 a/b/g/n/ac/ax (284 - 1414, n=103) | |
| Apple MacBook Pro 13 2020 2TB3 i5 | |
| Apple MacBook Pro 13 Late 2020 M1 Entry (8 / 256 GB) | |
| Apple MacBook Air 2020 M1 Entry | |

 M1 8-Core GPU, M1, Apple SSD AP0256")
 M1 8-Core GPU, M1, Apple SSD AP0256")
Maintenance
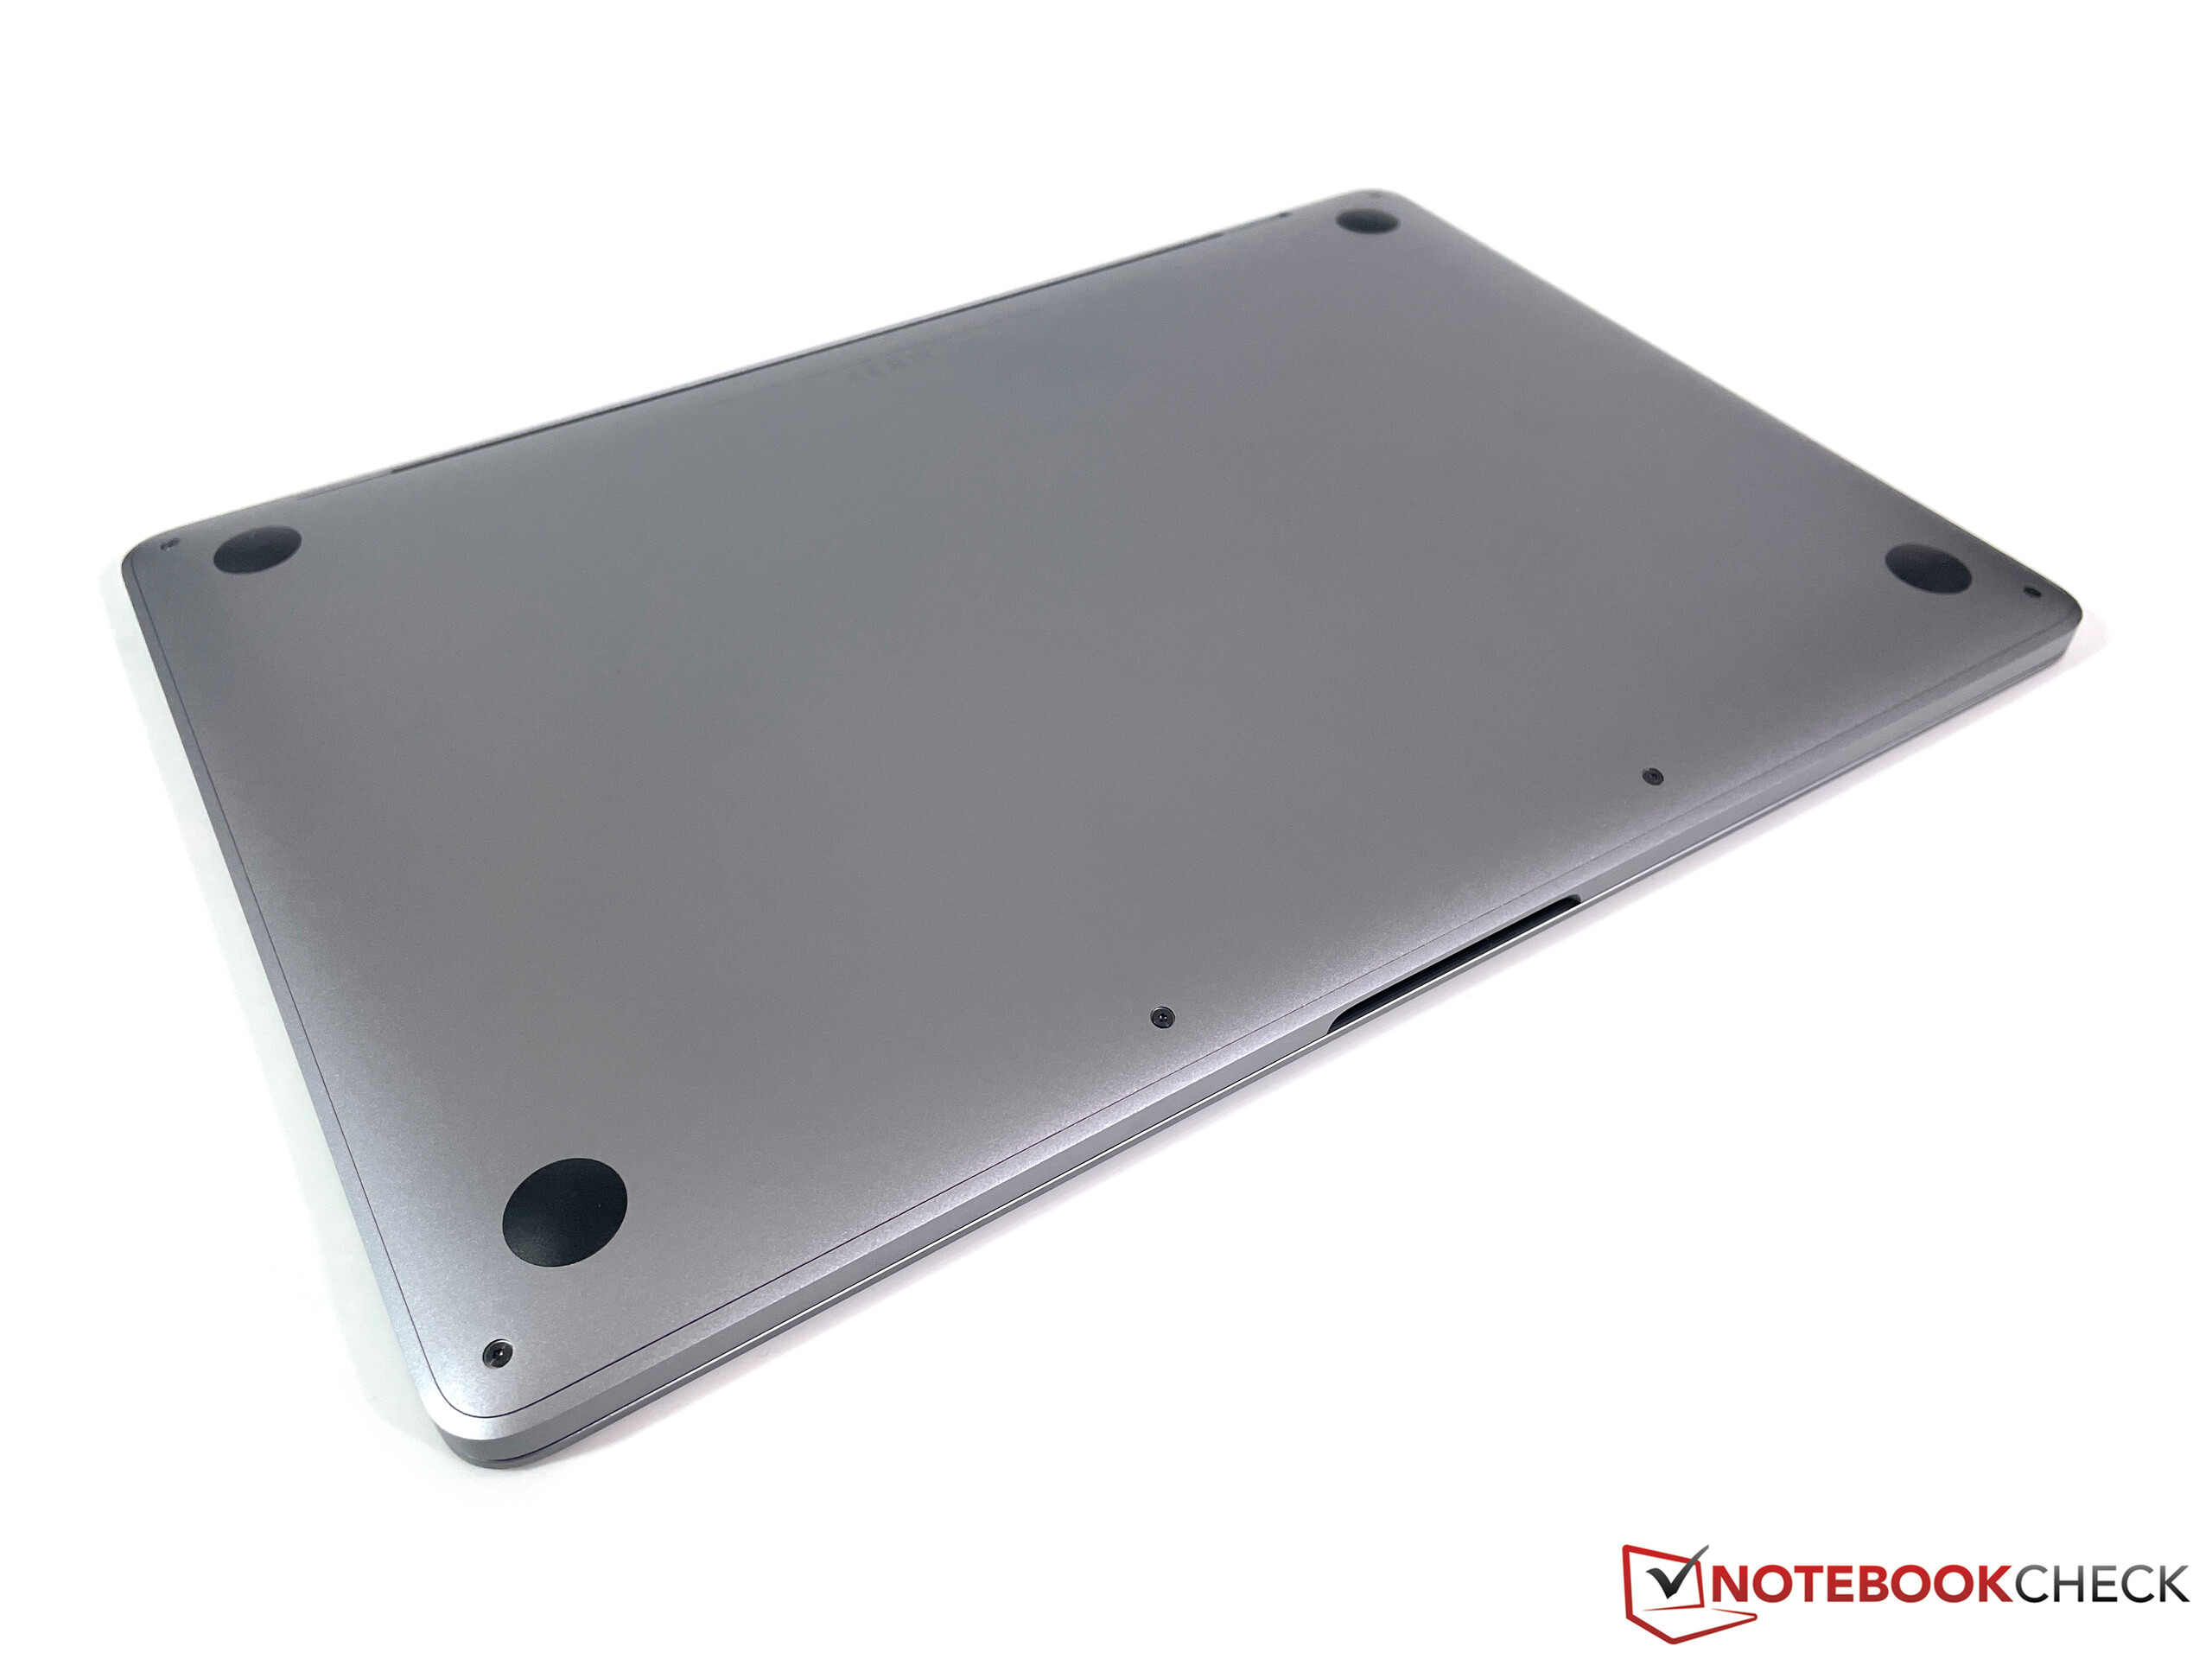
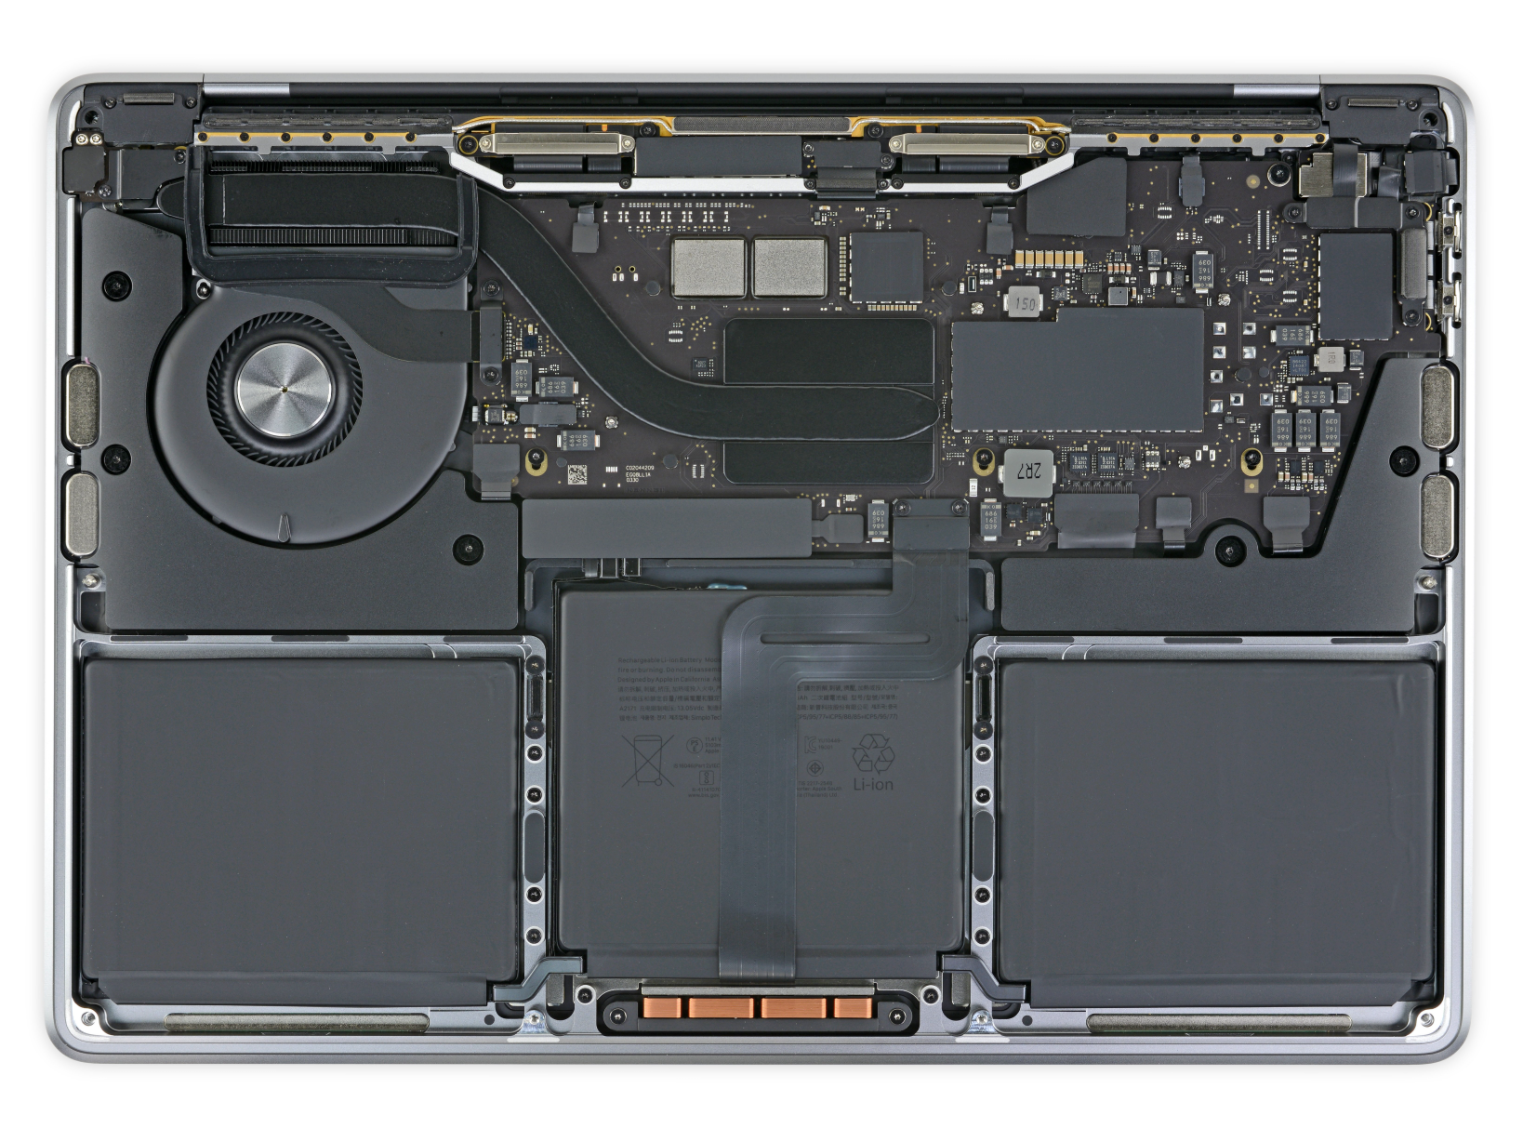
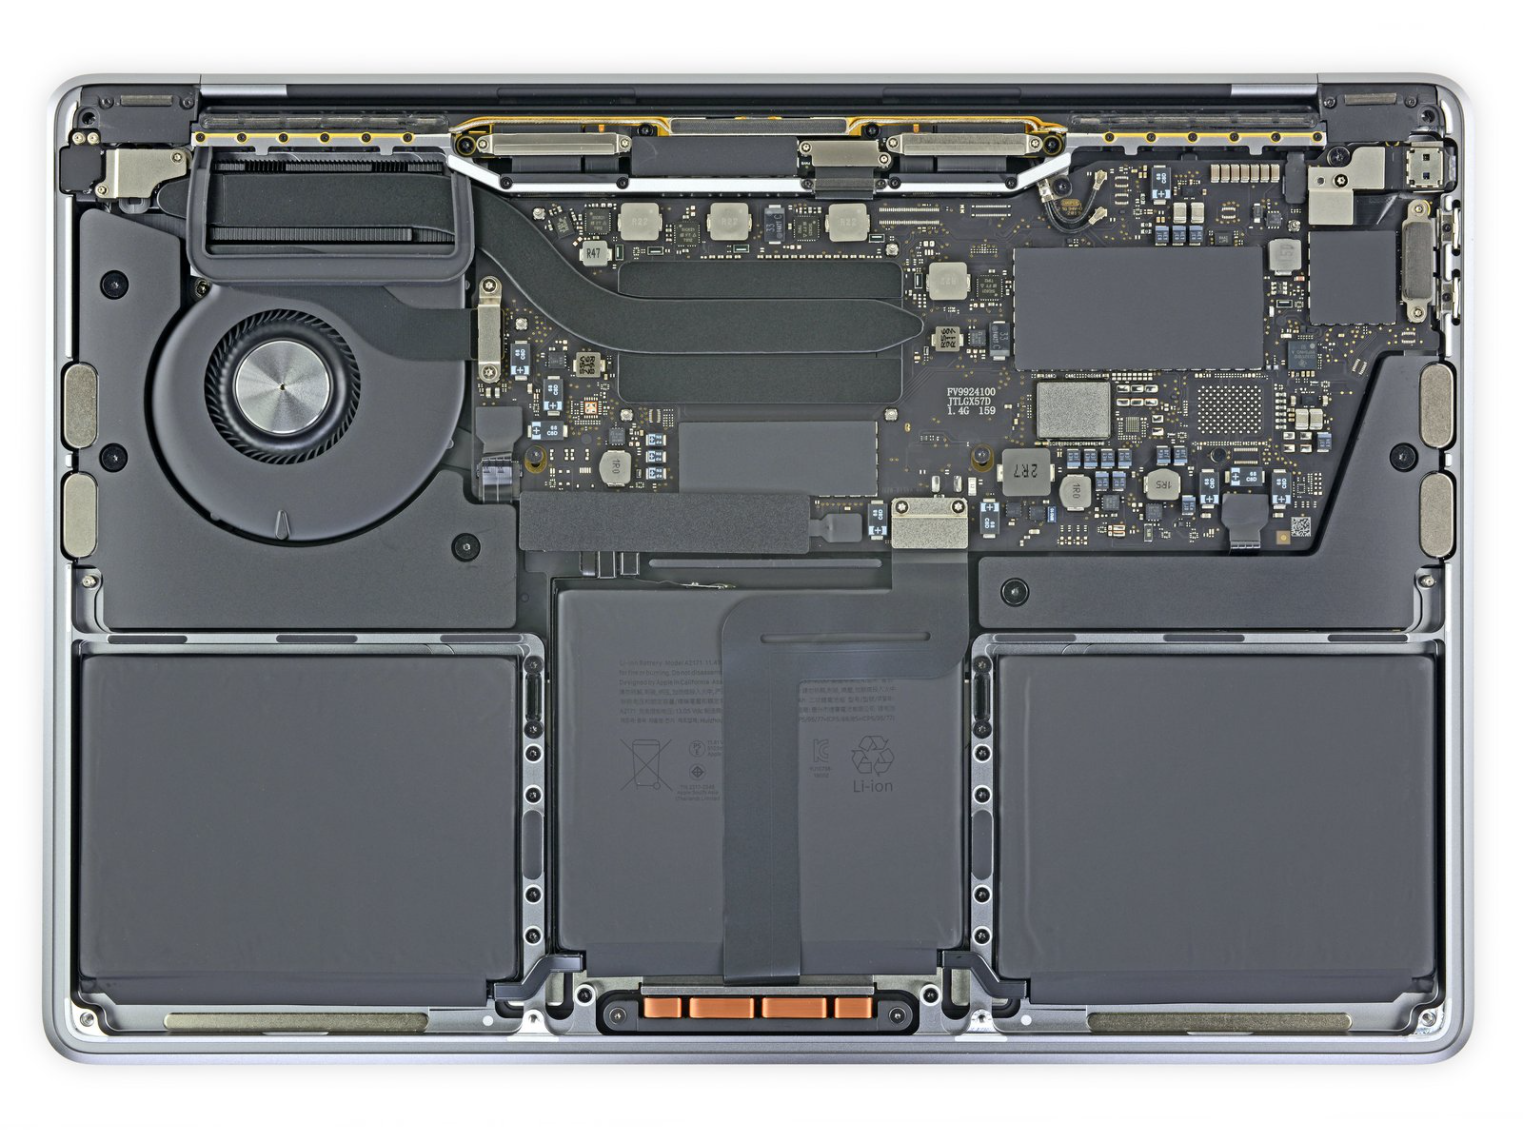
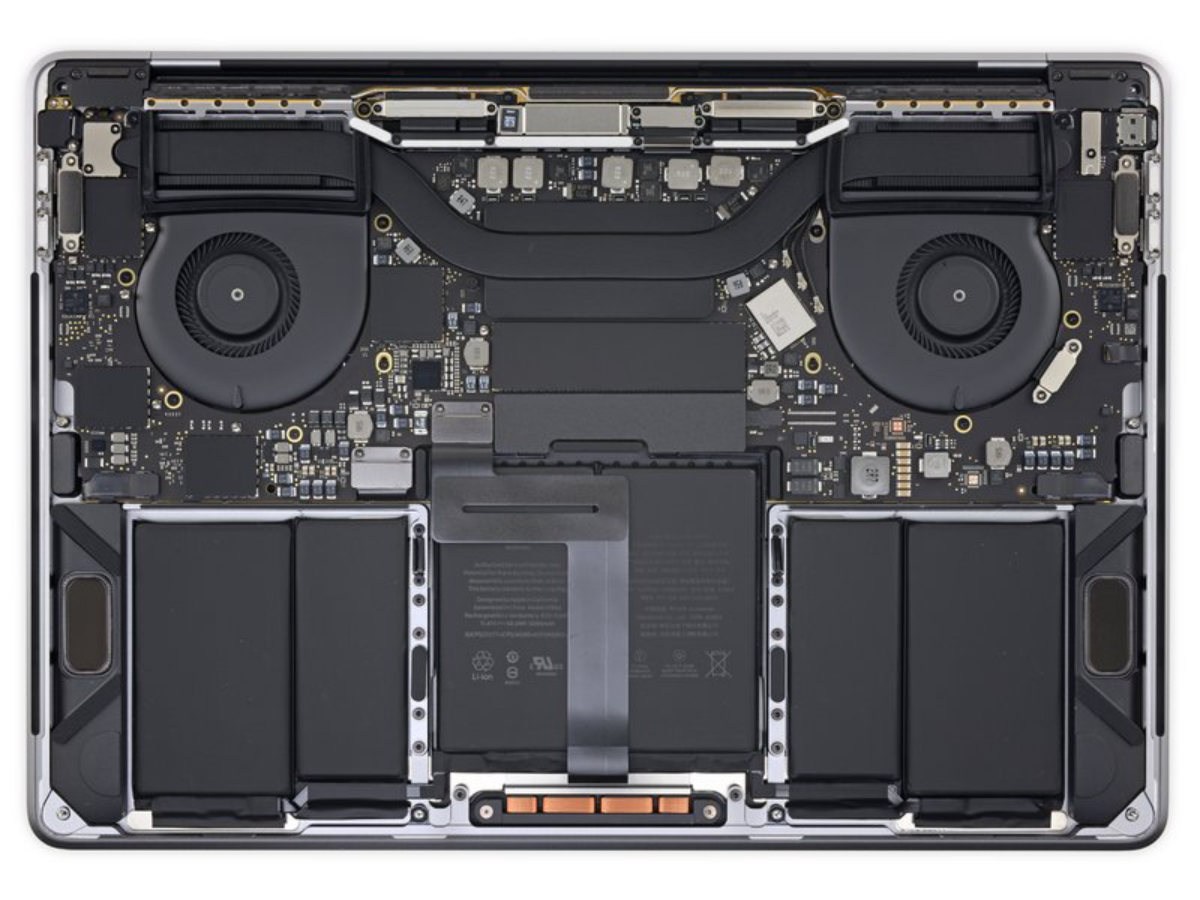
Apple pretty much took the internal layout from the old entry-level model with Intel CPUs; even the fan is identical. This means there is still a big difference compared to the more expensive MacBook Pro 13 4x TB3, which has two fans. All in all, this still means there is basically nothing to do here form a user maintenance standpoint.
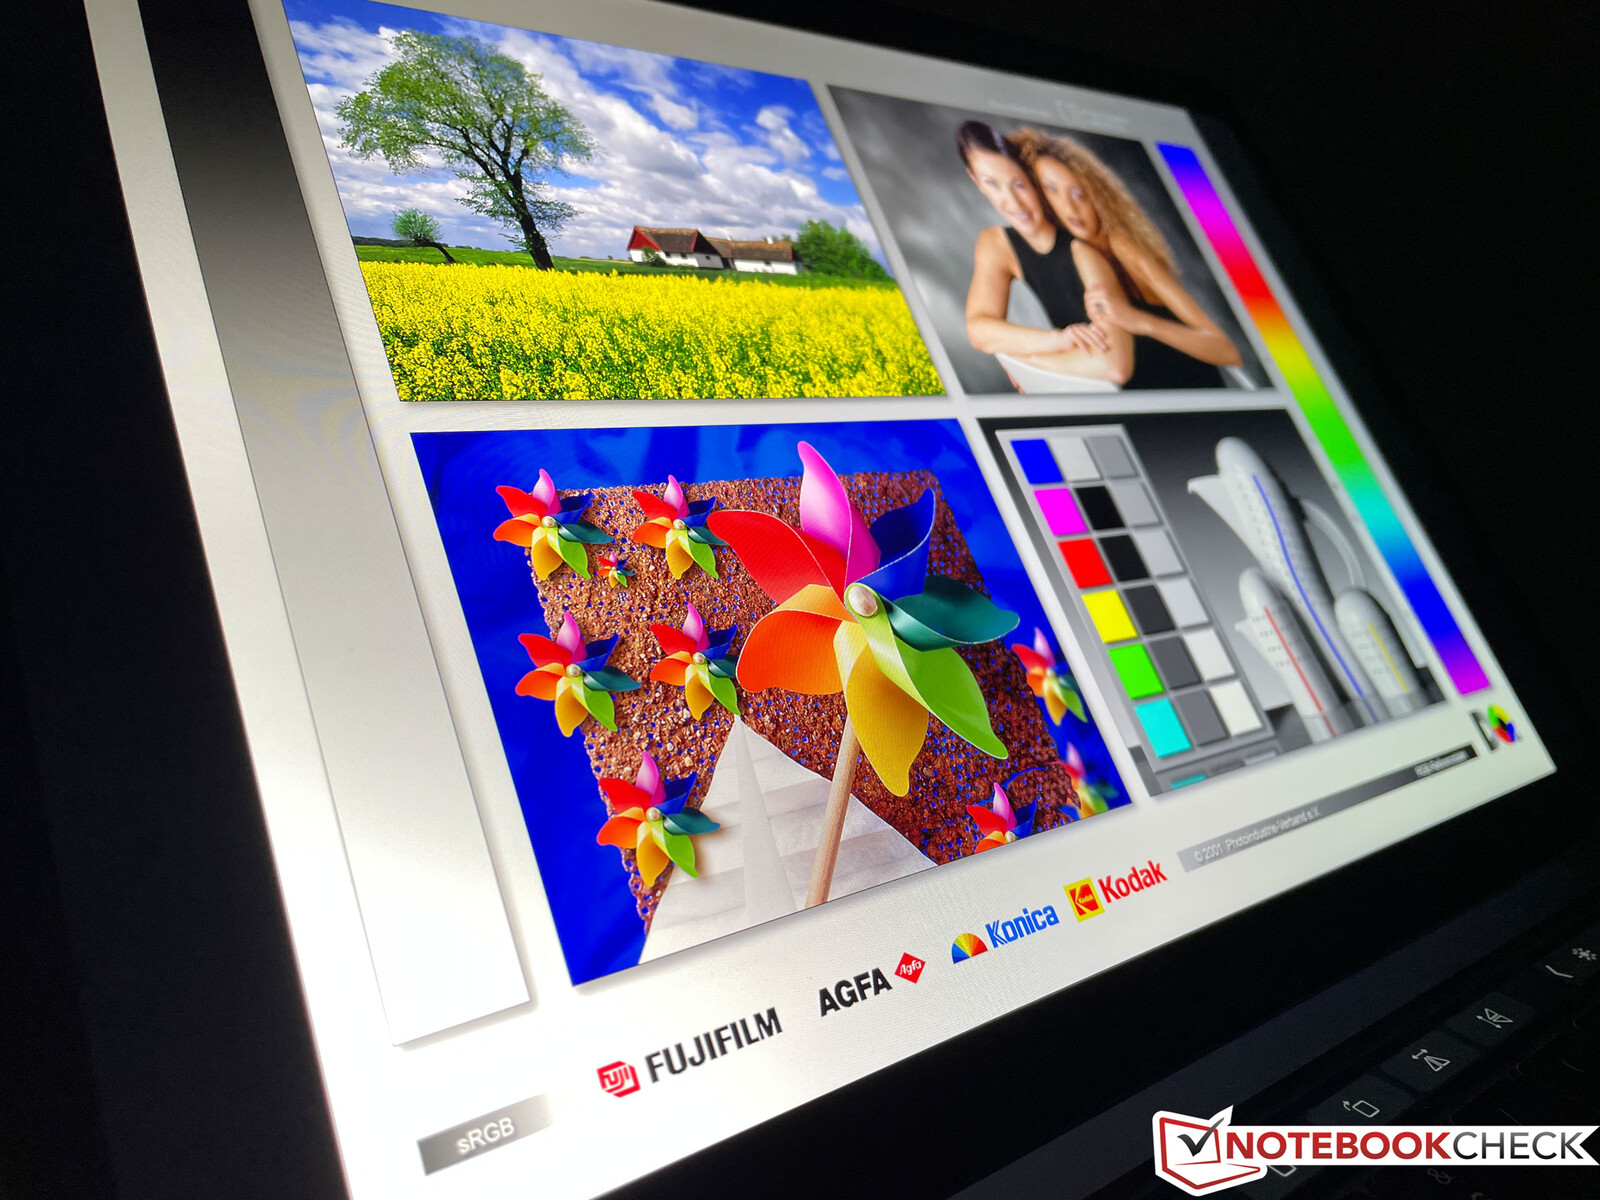
Display - 16:10 IPS-Panel
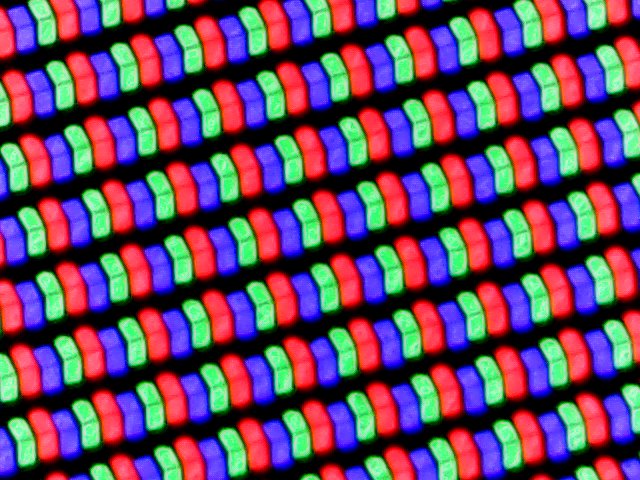
The display is still the same. You once again get a glossy IPS-screen with 2560 x 1600 pixels (227 ppi) and a 16:10 aspect ratio. Apple advertises a brightness of 500 nits, but we cannot confirm that at all measurement spots. All in all, the subjective picture impression is excellent. The device now supports iOS apps as well, so a touchscreen would definitely make more sense now.
Compared to Windows rivals, the MacBook Pro 13 offers other advantages like the very well working ambient light sensor, the automatic adjustment of the color temperature based on the ambient lighting (TrueTone) and the perfect scaling in macOS.
The response times are decent, but we can once determine a flickering of the background illumination at a brightness of 49 % or less. The frequency is very high at 122 kHz though, so there should not be any problems. We can also see some fluctuations on the oscilloscope at a brightness of 50 % or more, but we cannot measure it. Great: There is no visible backlight bleeding on a black background, even at the maximum brightness.
| |||||||||||||||||||||||||
Brightness Distribution: 94 %
Center on Battery: 510 cd/m²
Contrast: 1759:1 (Black: 0.29 cd/m²)
ΔE ColorChecker Calman: 1.3 | ∀{0.5-29.43 Ø4.73}
ΔE Greyscale Calman: 2 | ∀{0.09-98 Ø4.97}
100% sRGB (Argyll 1.6.3 3D)
88.3% AdobeRGB 1998 (Argyll 1.6.3 3D)
Gamma: 2.23
CCT: 6933 K
| Apple MacBook Pro 13 Late 2020 M1 Entry (8 / 256 GB) IPS, 2560x1600, 13.3" | Apple MacBook Pro 13 2020 2TB3 i5 2560x1600, 13.3" | Apple MacBook Air 2020 M1 Entry IPS, 2560x1600, 13.3" | Apple MacBook Pro 13 2020 2GHz i5 10th-Gen APPA03D, IPS, 2560x1600, 13.3" | Dell XPS 13 9310 Core i7 FHD Sharp LQ134N1, IPS, 1920x1200, 13.4" | Dell XPS 13 9310 Core i7 4K Sharp LQ134R1, IPS, 3840x2400, 13.4" | Razer Book 13 FHD Sharp LQ134N1JW48, IPS, 1920x1200, 13.4" | |
|---|---|---|---|---|---|---|---|
| Display | |||||||
| Display P3 Coverage (%) | 98.6 | 98.8 | 70.9 | 80.2 | 70.1 | ||
| sRGB Coverage (%) | 100 | 99.9 | 99.1 | 100 | 99.3 | ||
| AdobeRGB 1998 Coverage (%) | 85.9 | 86.4 | 72.9 | 78.9 | 71.6 | ||
| Response Times | -37% | 16% | -13% | -20% | -42% | -36% | |
| Response Time Grey 50% / Grey 80% * (ms) | 48 ? | 35.2 ? 27% | 31 ? 35% | 46 ? 4% | 52 ? -8% | 59.2 ? -23% | 56.8 ? -18% |
| Response Time Black / White * (ms) | 25.2 ? | 50.4 ? -100% | 26.1 ? -4% | 32.4 ? -29% | 33.2 ? -32% | 40.4 ? -60% | 38.8 ? -54% |
| PWM Frequency (Hz) | 122000 ? | 116300 ? | 118000 ? | 113600 ? | 2475 ? | 2137 ? | 2475 ? |
| Screen | -4% | -9% | -7% | -50% | -28% | 1% | |
| Brightness middle (cd/m²) | 510 | 508 0% | 417 -18% | 512 0% | 543.3 7% | 508.7 0% | 545.3 7% |
| Brightness (cd/m²) | 491 | 502 2% | 395 -20% | 491 0% | 524 7% | 479 -2% | 507 3% |
| Brightness Distribution (%) | 94 | 92 -2% | 91 -3% | 91 -3% | 92 -2% | 84 -11% | 88 -6% |
| Black Level * (cd/m²) | 0.29 | 0.4 -38% | 0.39 -34% | 0.32 -10% | 0.38 -31% | 0.3 -3% | 0.31 -7% |
| Contrast (:1) | 1759 | 1270 -28% | 1069 -39% | 1600 -9% | 1430 -19% | 1696 -4% | 1759 0% |
| Colorchecker dE 2000 * | 1.3 | 1.4 -8% | 1.12 14% | 1.7 -31% | 3.02 -132% | 2.72 -109% | 1.39 -7% |
| Colorchecker dE 2000 max. * | 3 | 2.5 17% | 2.71 10% | 3.4 -13% | 7.61 -154% | 4.7 -57% | 2.61 13% |
| Greyscale dE 2000 * | 2 | 1.7 15% | 1.7 15% | 1.9 5% | 5 -150% | 3.4 -70% | 1.3 35% |
| Gamma | 2.23 99% | 2.22 99% | 2207 0% | 2.19 100% | 2.02 109% | 2.11 104% | 2.2 100% |
| CCT | 6933 94% | 6861 95% | 6870 95% | 6817 95% | 6550 99% | 6245 104% | 6476 100% |
| Color Space (Percent of AdobeRGB 1998) (%) | 88.3 | 88.3 0% | 77.4 -12% | 66.8 -24% | 70.7 -20% | 65.9 -25% | |
| Color Space (Percent of sRGB) (%) | 100 | 100 0% | 99.9 0% | 99.6 0% | 100 0% | 99.6 0% | |
| Colorchecker dE 2000 calibrated * | 0.77 | 1 | 1.23 | 1.92 | 2.72 | ||
| Total Average (Program / Settings) | -21% /
-10% | 4% /
-4% | -10% /
-8% | -35% /
-45% | -35% /
-30% | -18% /
-5% |
* ... smaller is better
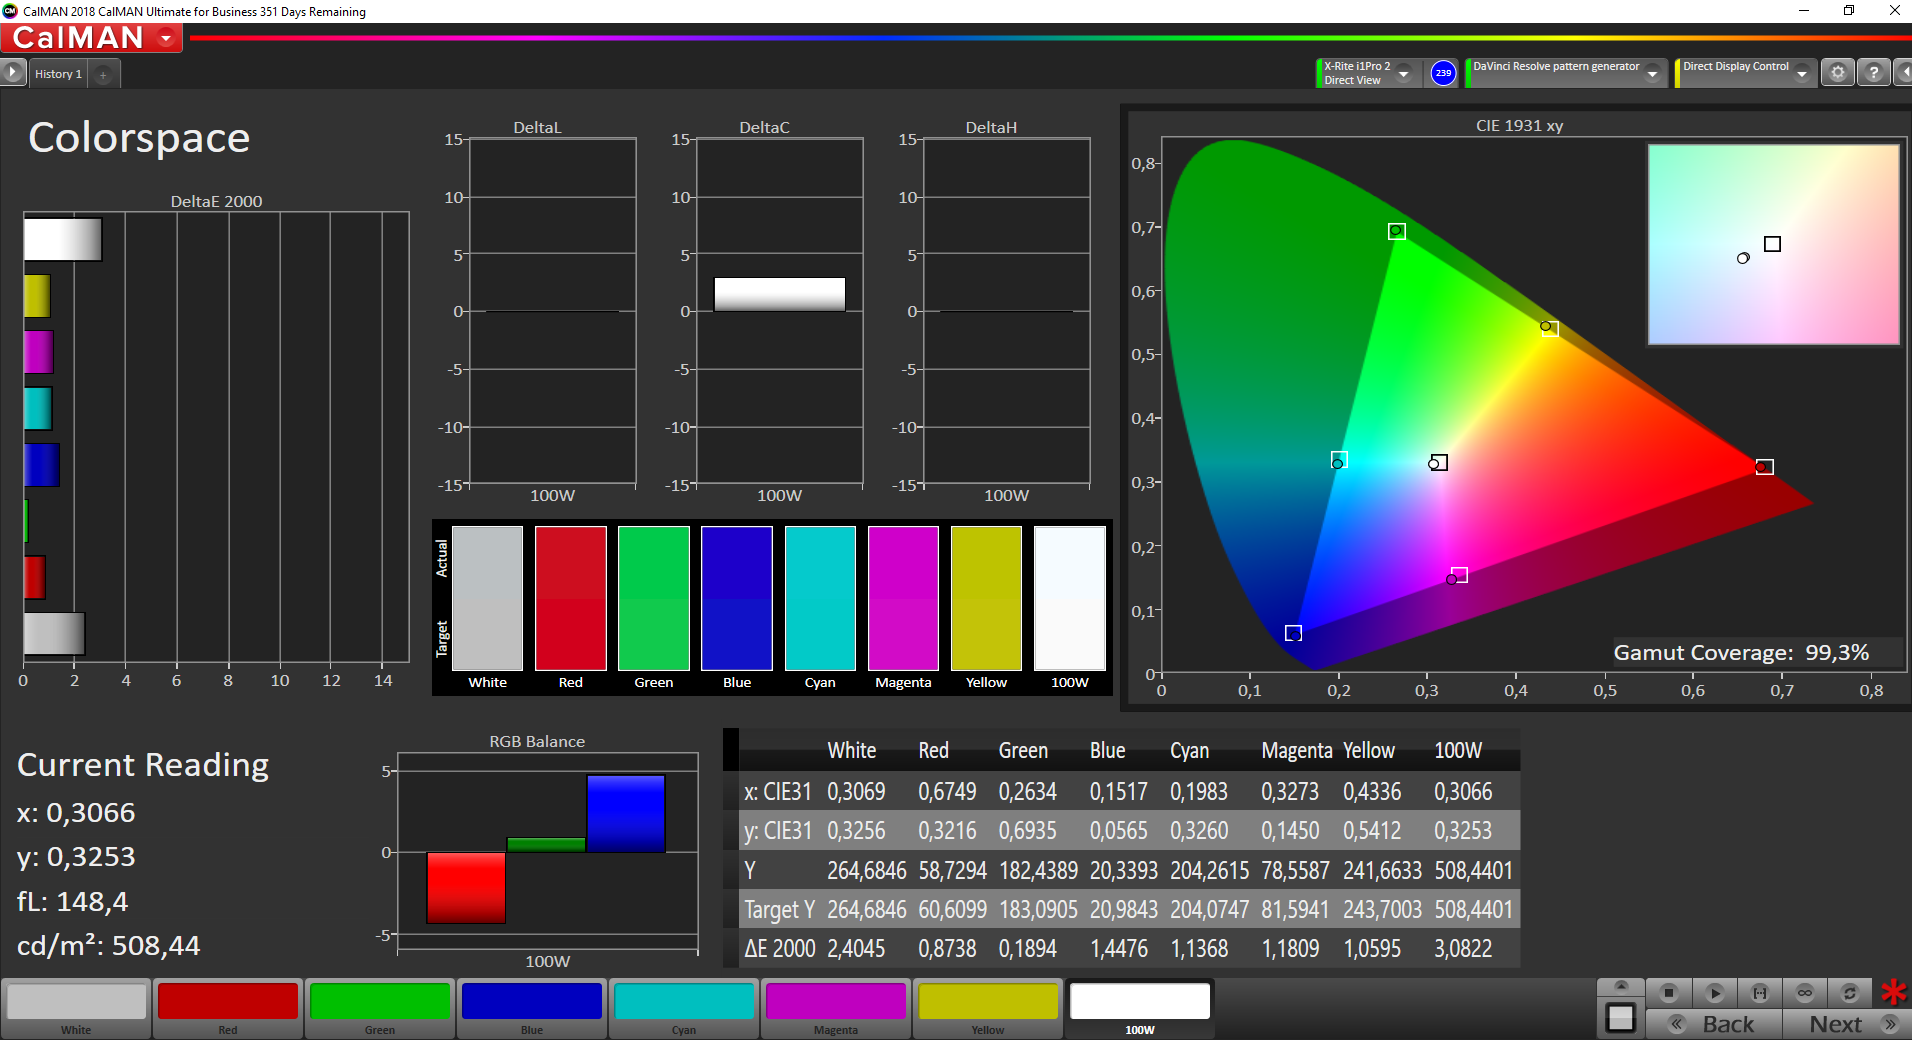
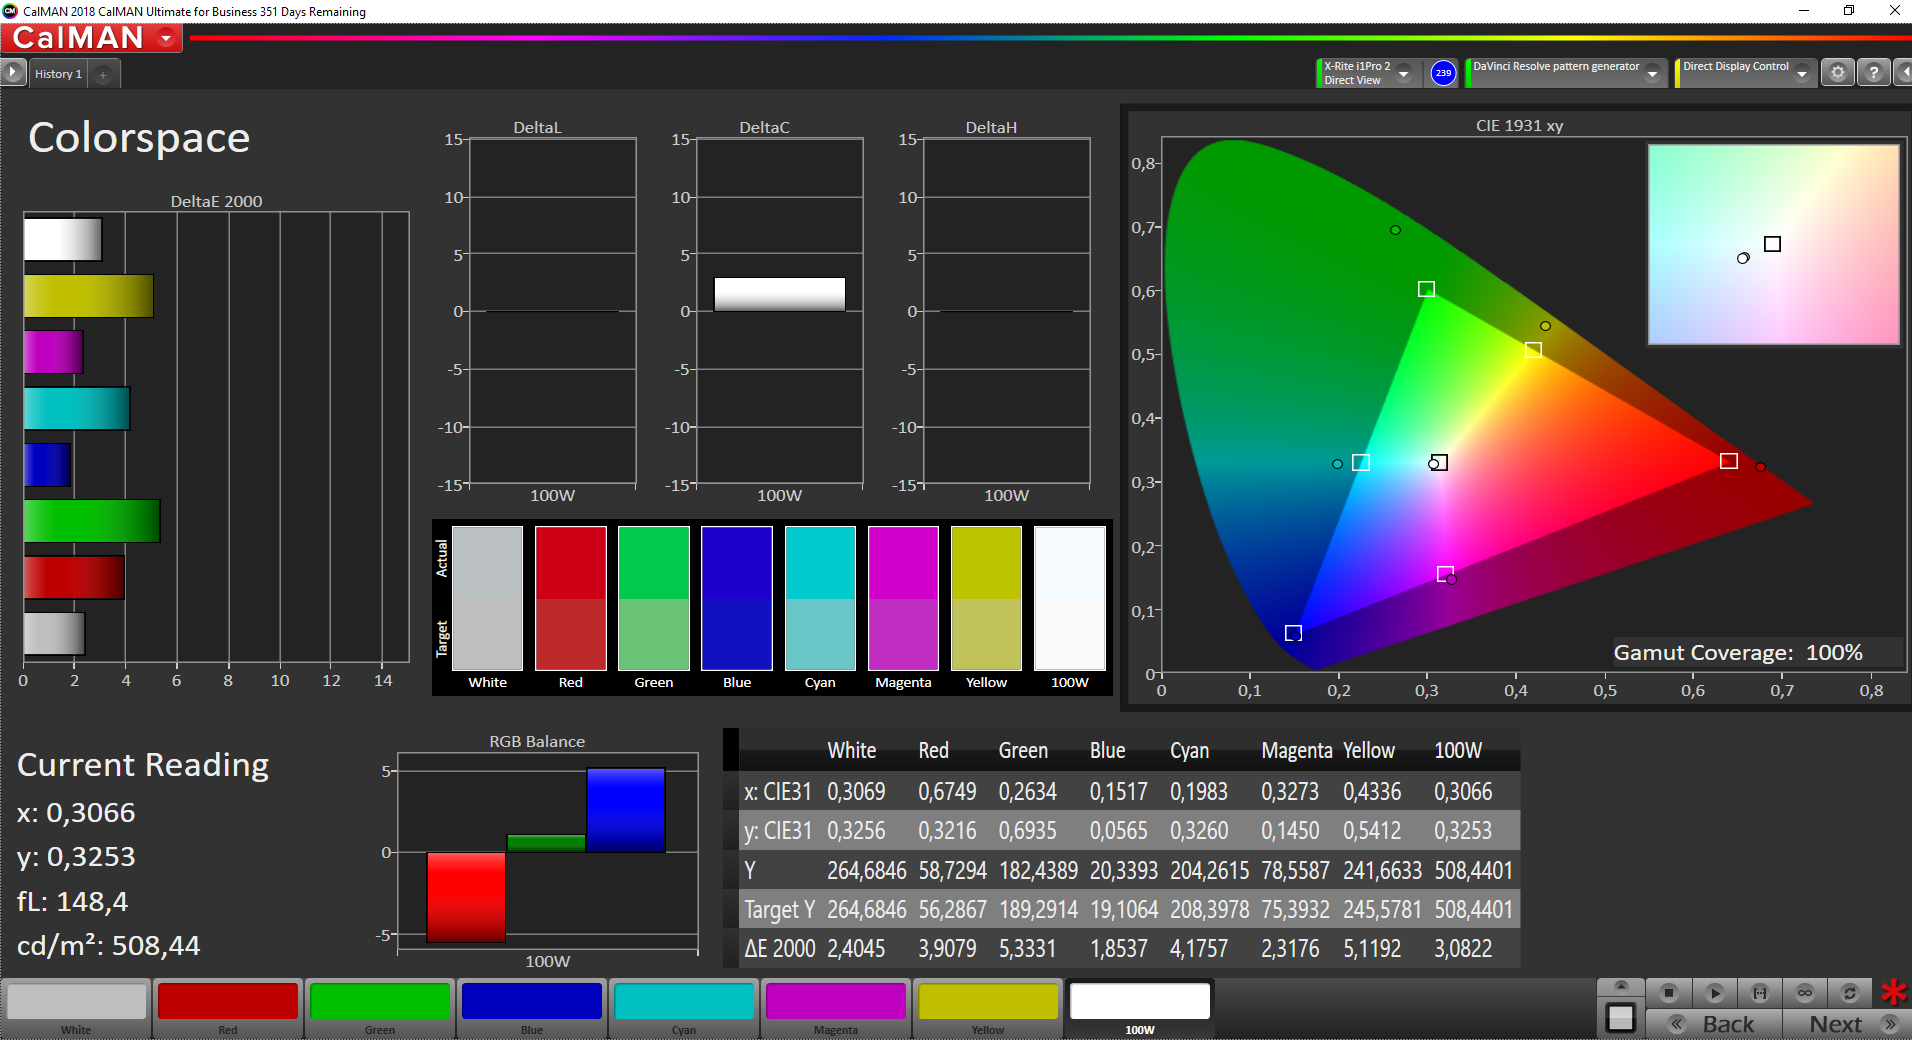
The MacBook Pro 13 is very well-calibrated out of the box. There is still some room for improvements when we look at the grayscale performance, but all the deviations are already below the important mark of 3. We used the P3 reference color space for our analysis with the professional CalMAN software and the X-Rite i1 Pro 2 spectrophotometer.
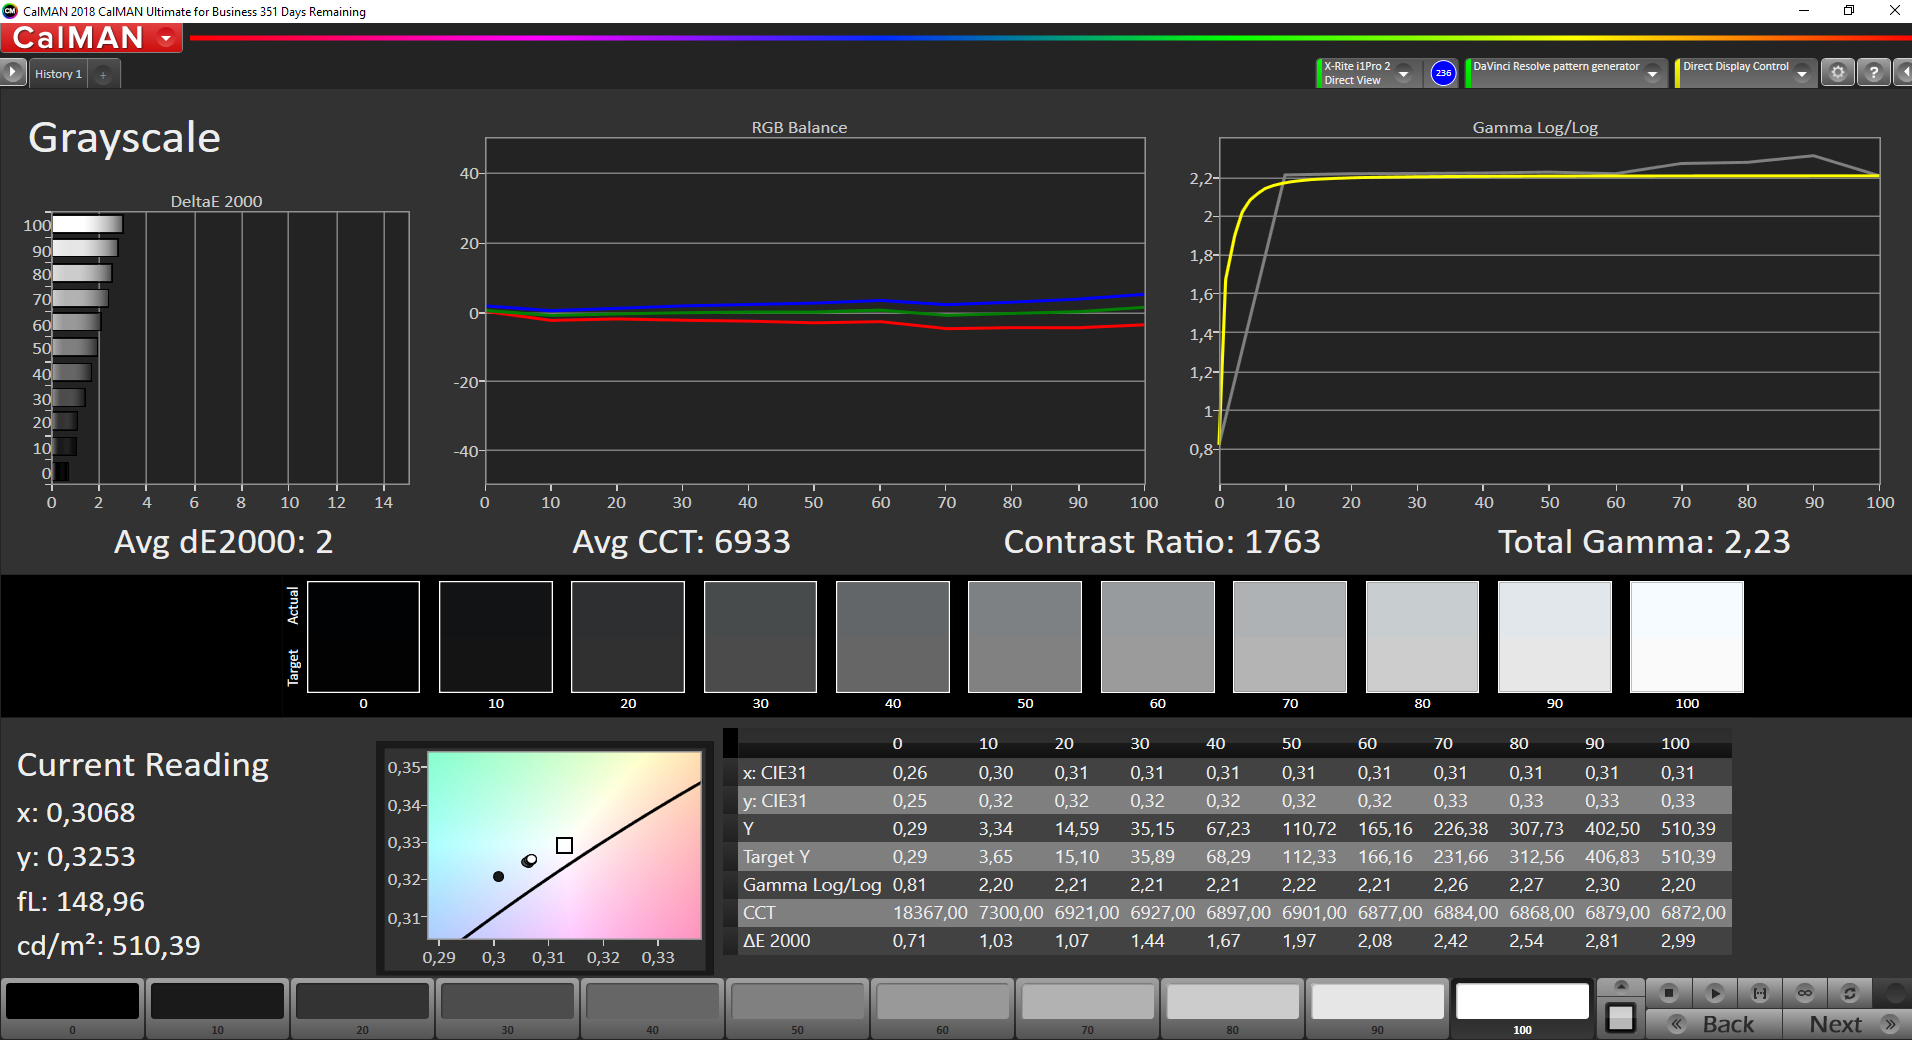
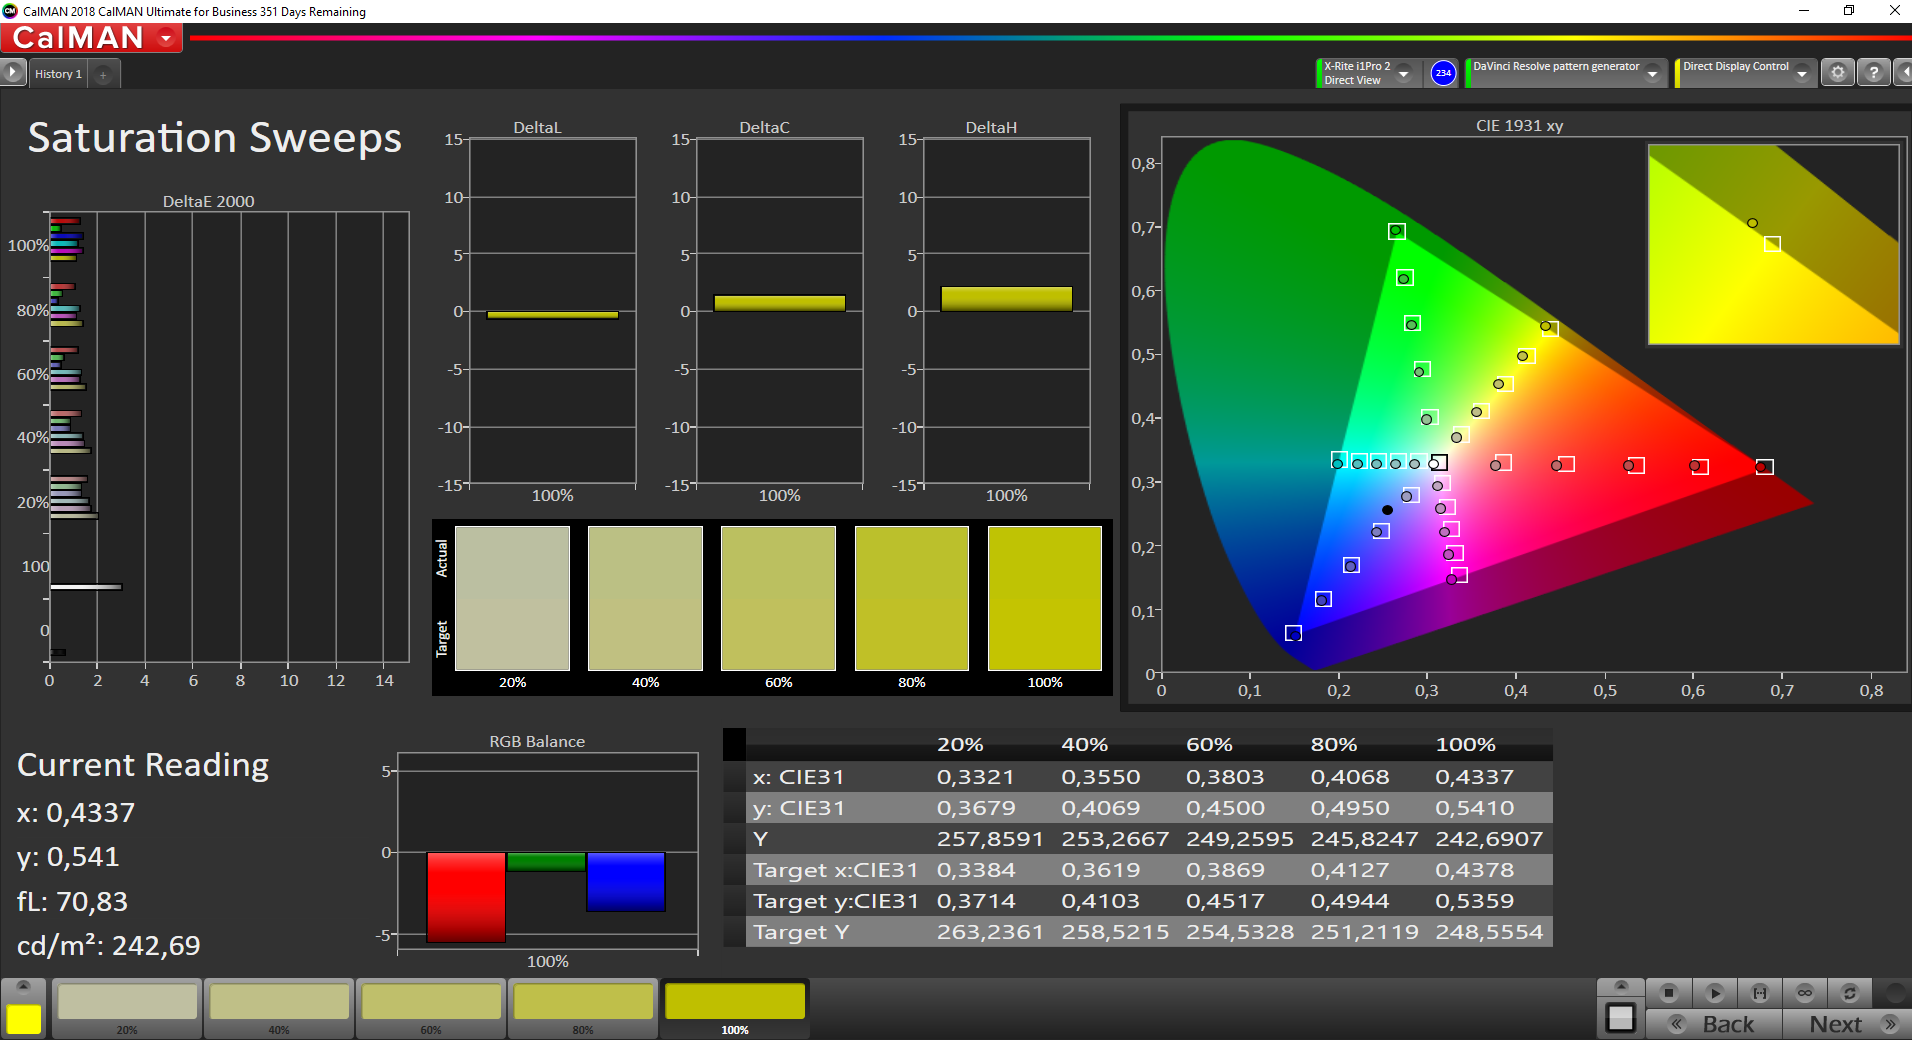
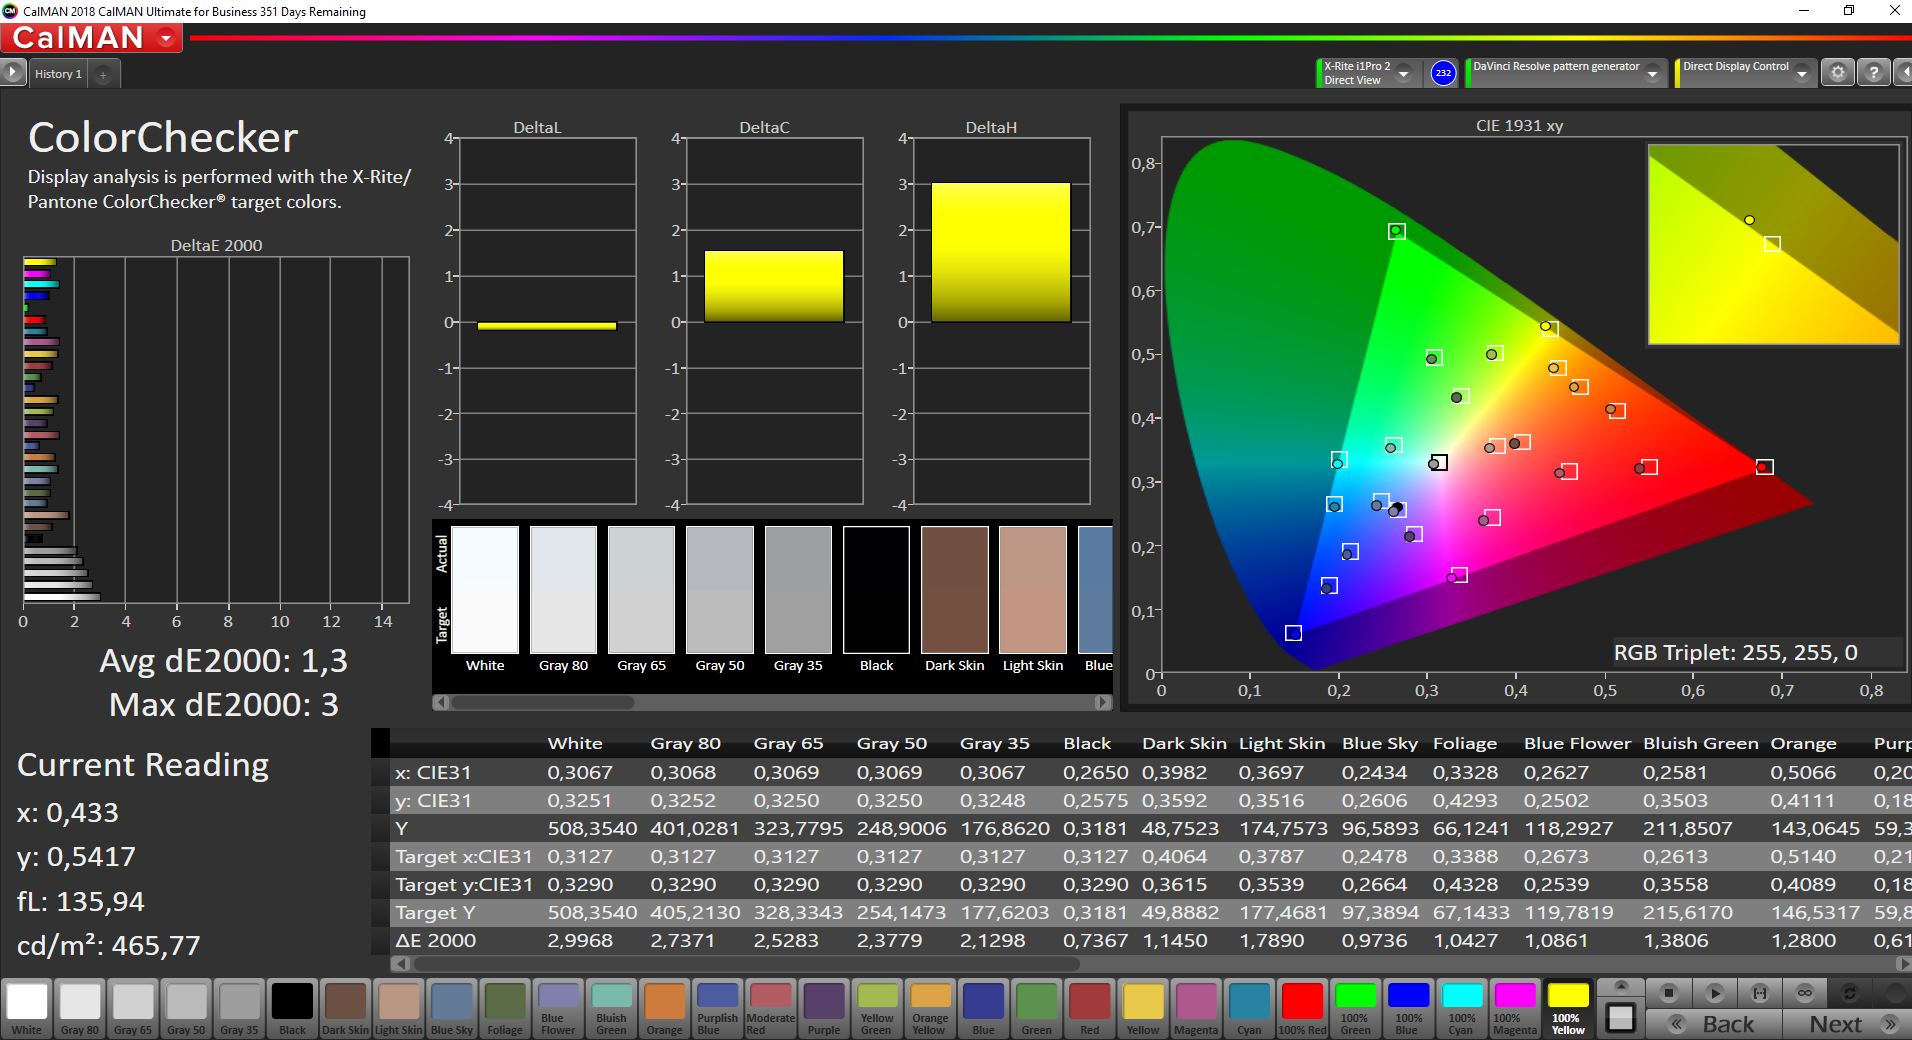
Right now, we are not able to calibrate the new MacBook Pro 13 M1 due to a software issue. Therefore, we have to use the CalMAN measurements (2D comparison with the reference color space) to determine the color gamut. We can confirm Apple's claim about the full P3 color gamut.

Display Response Times
| ↔ Response Time Black to White | ||
|---|---|---|
| 25.2 ms ... rise ↗ and fall ↘ combined | ↗ 8.4 ms rise | 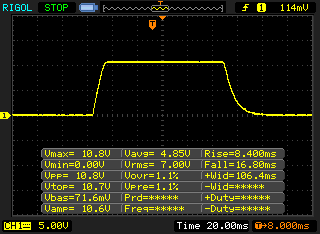 |
| ↘ 16.8 ms fall | ||
| The screen shows relatively slow response rates in our tests and may be too slow for gamers. In comparison, all tested devices range from 0.1 (minimum) to 240 (maximum) ms. » 60 % of all devices are better. This means that the measured response time is worse than the average of all tested devices (19.9 ms). | ||
| ↔ Response Time 50% Grey to 80% Grey | ||
| 48 ms ... rise ↗ and fall ↘ combined | ↗ 18.8 ms rise | 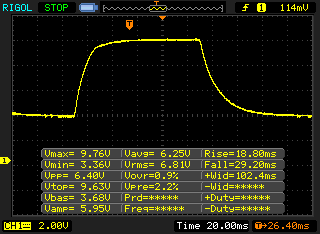 |
| ↘ 29.2 ms fall | ||
| The screen shows slow response rates in our tests and will be unsatisfactory for gamers. In comparison, all tested devices range from 0.165 (minimum) to 636 (maximum) ms. » 82 % of all devices are better. This means that the measured response time is worse than the average of all tested devices (31.1 ms). | ||
Screen Flickering / PWM (Pulse-Width Modulation)
| Screen flickering / PWM detected | 122000 Hz | ≤ 49 % brightness setting | 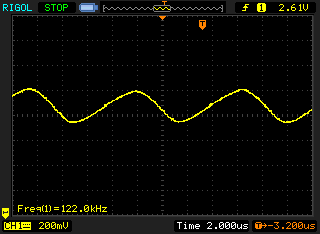 |
The display backlight flickers at 122000 Hz (worst case, e.g., utilizing PWM) Flickering detected at a brightness setting of 49 % and below. There should be no flickering or PWM above this brightness setting. The frequency of 122000 Hz is quite high, so most users sensitive to PWM should not notice any flickering. In comparison: 52 % of all tested devices do not use PWM to dim the display. If PWM was detected, an average of 7798 (minimum: 5 - maximum: 343500) Hz was measured. | |||
The viewing angle stability of the IPS panel is very good. The display also works well outdoors and it is definitely not as reflective as many other glossy screens. As long as you can avoid direct reflections from light sources, it is no problem to use the notebook even in brighter environments.


Performance - M1 clearly beats Intel
The entry-level model of the MacBook Pro 13 is, just like the new MacBook Air, equipped with Apple's new M1 processor (8 cores, 4x 3.2 GHz & 4x 2.3 GHz). The chip itself is completely identical in both devices, which also includes the clocks. The only difference is the integrated GPU, because the less expensive Air is available with a 7 or 8 GPU cores, the Pro always gets the faster 8-core GPU. The MBP 13 M1 also has the active cooling solution, which should stabilize the performance in sustained load scenarios.
Processor - Not faster than the MacBook Air in everyday scenarios
The performance of Apple's new M1 processor is once again impressive, not only compared to the previous Intel powered MBP 13 or the more expensive MBP 13 with four Thunderbolt ports. First, we have a look at the processor performance in native applications, in this case Cinebench R23. The single-core result is just marginally better than the MacBook Air M1, and even the first Multi run is just 5 % faster on the Pro. However, the Air has to reduce the performance a bit (-12 %) when you stress the device for longer periods due to the passive cooling solution. Still, you will hardly notice this in practice.
We are very impressed that the MacBook Pro 13 can maintain the performance. Almost all mobile devices (especially with 15W CPUs) usually throttle noticeably after the initial 30 seconds. The direct predecessor with the Intel Core i5-8257U is clearly beaten (+51 % Single, +94 % Multi). Our test device also beats pretty much everything in the single-core test, including the most powerful new Tiger Lake CPUs from Intel, the recent Ryzen mobile processors and even the current 45W CPUs from Intel do not stand a chance. Only the two brand-new desktop CPUs from AMD have a small lead.
The performance is not less impressive in the multi-core test, and Apple's M1 processor is only beaten by CPUs with much more cores. Among the mobile processors, only the AMD Ryzen 7 4800U has an advantage, but the much more popular Ryzen 7 4700U is marginally slower. All mobile Intel CPUs including the brand-new Tiger Lake processors are also slower.
Apps without a native version for the M1 CPU, are emulated by the app Rosetta, which works very well. However, the emulation does affect the performance a bit, so the advantage of the new M1 processor in the older Cinebench R15, for example, is a bit smaller. Still, the overall result is excellent.
Cinebench R15: CPU Single 64Bit | CPU Multi 64Bit
Blender: v2.79 BMW27 CPU
7-Zip 18.03: 7z b 4 -mmt1 | 7z b 4
Geekbench 5.5: Single-Core | Multi-Core
HWBOT x265 Benchmark v2.2: 4k Preset
LibreOffice : 20 Documents To PDF
R Benchmark 2.5: Overall mean
Cinebench R15: CPU Single 64Bit | CPU Multi 64Bit
Blender: v2.79 BMW27 CPU
7-Zip 18.03: 7z b 4 -mmt1 | 7z b 4
Geekbench 5.5: Single-Core | Multi-Core
HWBOT x265 Benchmark v2.2: 4k Preset
LibreOffice : 20 Documents To PDF
R Benchmark 2.5: Overall mean
* ... smaller is better
System Performance & SSD
There are no system benchmarks for the new M1 MacBooks yet, so we focus on the browser benchmarks and the subjective performance impression. If you have ever used Windows on an ARM notebook you probably expect performance issues, but this is fortunately not the case here. Subjectively, macOS even runs a bit better on the new M1 processor and almost all app for Intel Macs we have tried worked without any problems and the emulation did not have a significant impact on the performance impression. The browser benchmarks also produce excellent scores.
The new MBP 13 with the M1 processor is just a very fast and responsive machine when you use it. It obviously benefits from the PCIe SSD as well; the transfer rates are good, only the write result is a bit lower than expected. Still, this does not affect your everyday use.
* ... smaller is better
GPU Performance - iGPU with 8 cores
The MacBook Pro 13 M1 is always equipped with the faster 8-core version of the iGPU, while the entry-level Air is also available with a less powerful 7-core iGPU. The synthetic benchmark performance is pretty much identical to the MacBook Air with 8 GPU cores and roughly 5-10 % ahead of the MacBook Air with the 7-core iGPU. Our MacBook Pro 13 also passes the 3DMark Wild Life stress test without breaking a sweat.
Dedicated graphics cards like the GeForce MX350 are easily beaten and the M1 iGPU is just 24 % behind the mobile GeForce GTX 1650 Ti. The OpenCL performance on the other hand is comparable to the new Intel Xe Graphics (96 EUs) from the current Tiger Lake generation. The graphics adapter in the new iPad Air 2020 is also clearly beaten.
The MBP 13 M1 has no problems with iOS games. Other titles (like Borderlands 3, Shadow of the Tomb Raider) work, but they have to be emulated. Once there are native games for macOS with the M1 processor, we expect a significant performance bump. You might also experience some graphical issues, like we did wen we tested Total War: Three Kingdoms.
| low | med. | high | ultra | |
|---|---|---|---|---|
| Shadow of the Tomb Raider (2018) | 66 | 25 | 23 | |
| Total War: Three Kingdoms (2019) | 93.4 | 33 | 20.6 | |
| Borderlands 3 (2019) | 30.4 | 20.3 |
Emissions - MacBook Pro 13 stays cooler
System Noise
The fan is identical to the previous MBP 13 (2x TB3), so we were obviously eager to find out if there are any differences in terms of fan noise. The new MacBook Pro 13 with the M1 processor is a quieter device in general and the fan is not running as often as before. You will probably never hear the fan at all in everyday usage scenarios, and it usually takes about a minute before the fan starts spinning under load.
When we look at load scenarios, we have to differentiate between native and emulated apps. If you run Cinebench R23 (native), for example, it takes a couple of minutes before than fan kicks in and it will eventually fluctuate between 30.4-32.1 dB(A). For comparison: The predecessor reached its maximum fan noise of 40.8 dB(A) after a couple of minutes in this scenario. If you use Cinebench R15 on the other hand, the fan is spinning much faster on the new MBP 13 M1 and we can measure between 36.2-41.9 dB(A) after a couple of minutes. The change of the fan speed here is very slow, but you can notice it and we would prefer a steady rpm level.
Our stress test with Cinebench R23 (native) and Unigine Valley (emulated) will result in the maximum fan noise of the MBP 13 M1, which is even slightly louder compared to the predecessor at 41.9 dB(A). However, the fan is completely turned off if you only run Unigine Valley, so we suspect a bug here. The fan stayed very quiet during our gaming benchmarks and was often turned off.
| MacBook Pro 13 2020 M1 | MacBook Pro 13 2020 Core i5 | |
|---|---|---|
| Unigine Valley | fan off | 34 dB(A) |
| Cinebench R23 | 30.4-32.1 dB(A) | 40.8 dB(A) |
| Cinebench R15 | 36.2-41.9 dB(A) | 40.8 dB(A) |
| Stresstest (CB R23 + Unigine Valley) | 41.9 dB(A) | 40.8 dB(A) |
Noise level
| Idle |
| 29.2 / 29.2 / 29.2 dB(A) |
| Load |
| 32.1 / 41.9 dB(A) |
 | ||
30 dB silent 40 dB(A) audible 50 dB(A) loud |
||
min: | ||
| Apple MacBook Pro 13 Late 2020 M1 Entry (8 / 256 GB) M1 8-Core GPU, M1, Apple SSD AP0256 | Apple MacBook Pro 13 2020 2TB3 i5 Iris Plus Graphics 645, i5-8257U, Apple SSD AP0512 | Apple MacBook Pro 13 2020 2GHz i5 10th-Gen Iris Plus Graphics G7 (Ice Lake 64 EU), i5-1038NG7, Apple SSD SM0512F | Dell XPS 13 9310 Core i7 FHD Iris Xe G7 96EUs, i7-1165G7, Micron 2300 512GB MTFDHBA512TDV | Huawei MateBook X Pro 2020 i7 GeForce MX250, i7-10510U, Samsung PM981a MZVLB1T0HBLR | Razer Book 13 FHD Iris Xe G7 96EUs, i7-1165G7, Samsung SSD PM981a MZVLB256HBHQ | |
|---|---|---|---|---|---|---|
| Noise | 0% | -2% | 13% | -3% | 6% | |
| off / environment * (dB) | 29.2 | 29.2 -0% | 29.6 -1% | 25.7 12% | 29.6 -1% | 27 8% |
| Idle Minimum * (dB) | 29.2 | 29.2 -0% | 29.6 -1% | 25.7 12% | 29.6 -1% | 27 8% |
| Idle Average * (dB) | 29.2 | 29.2 -0% | 29.6 -1% | 25.7 12% | 29.6 -1% | 27 8% |
| Idle Maximum * (dB) | 29.2 | 29.2 -0% | 29.6 -1% | 25.9 11% | 30.3 -4% | 27.1 7% |
| Load Average * (dB) | 32.1 | 32.9 -2% | 34.4 -7% | 26.2 18% | 38 -18% | 29 10% |
| Load Maximum * (dB) | 41.9 | 40.8 3% | 42.1 -0% | 36.6 13% | 38 9% | 44.8 -7% |
| Witcher 3 ultra * (dB) | 36.1 | 36.5 | 38 | 33.3 |
* ... smaller is better
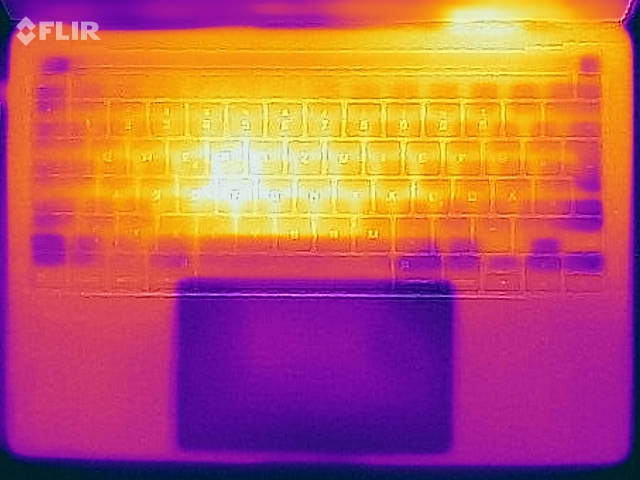
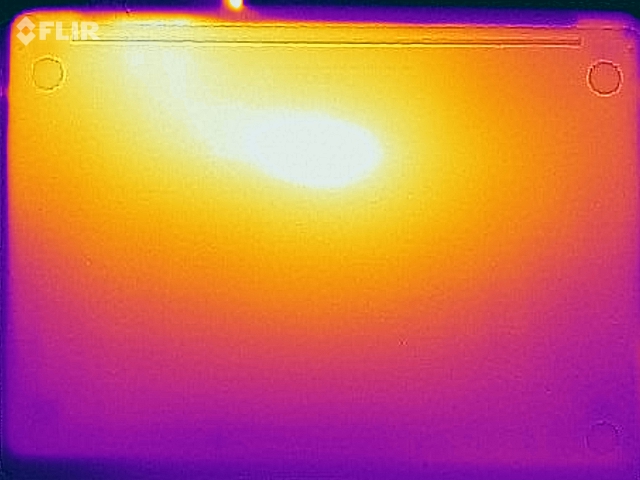
Temperature
Apple manages the surface temperatures very well. The MacBook Air M1 was already pretty decent despite the passive cooling solution. The MacBook Pro 13 is even a bit better thanks to the fan. We have already mentioned that the performance is steady, and at the same time we only determine slightly more than 40 °C at some measuring spots. The direct predecessor with Intel i5 CPU was a couple of degrees warmer. This means you can comfortable put the new MBP 13 M1 on your lap without any concerns. It is also very cool during everyday tasks.
(±) The maximum temperature on the upper side is 41 °C / 106 F, compared to the average of 35.9 °C / 97 F, ranging from 21.4 to 59 °C for the class Subnotebook.
(±) The bottom heats up to a maximum of 40.4 °C / 105 F, compared to the average of 39.2 °C / 103 F
(+) In idle usage, the average temperature for the upper side is 23.3 °C / 74 F, compared to the device average of 30.8 °C / 87 F.
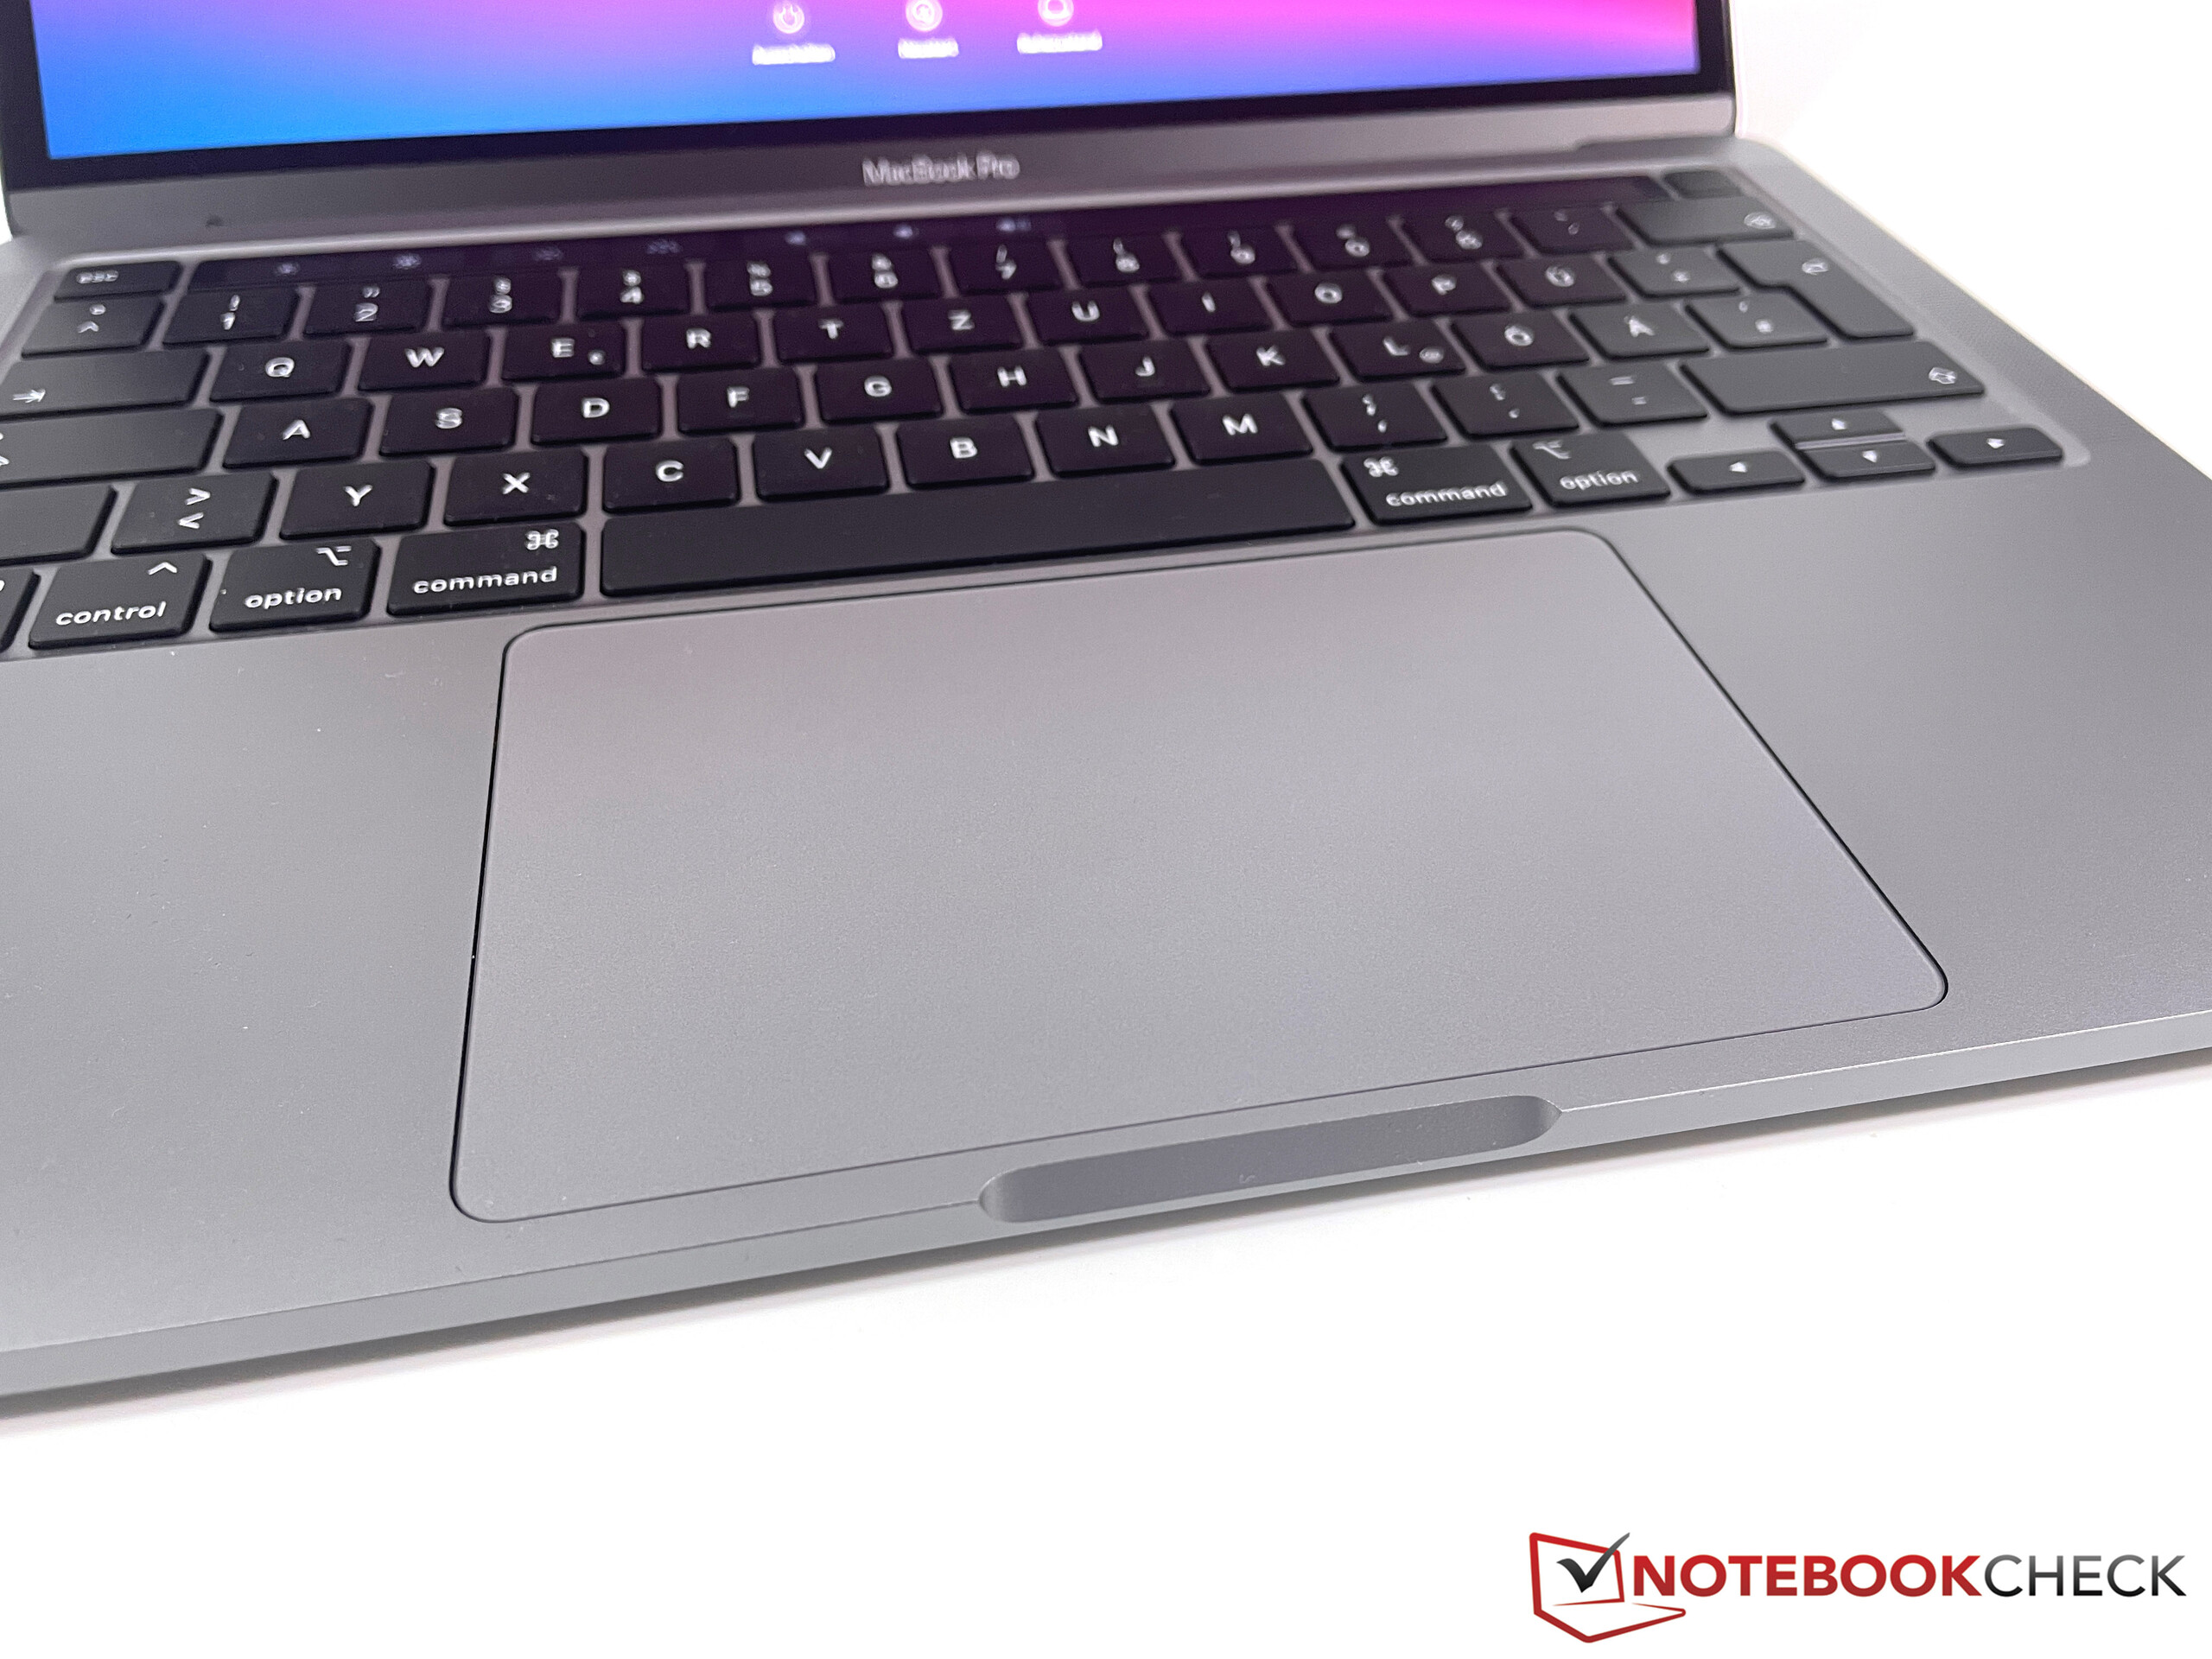
(+) The palmrests and touchpad are cooler than skin temperature with a maximum of 31 °C / 87.8 F and are therefore cool to the touch.
(-) The average temperature of the palmrest area of similar devices was 28.2 °C / 82.8 F (-2.8 °C / -5 F).
Speakers
The speakers are identical to the previous model and our audio analysis also shows pretty much the exact values. Apple's stereo speakers are still among the best in the notebook segment.
Apple MacBook Pro 13 Late 2020 M1 Entry (8 / 256 GB) audio analysis
(±) | speaker loudness is average but good (77.5 dB)
Bass 100 - 315 Hz
(±) | reduced bass - on average 8.7% lower than median
(±) | linearity of bass is average (8.6% delta to prev. frequency)
Mids 400 - 2000 Hz
(+) | balanced mids - only 4.2% away from median
(+) | mids are linear (4.2% delta to prev. frequency)
Highs 2 - 16 kHz
(+) | balanced highs - only 1.2% away from median
(+) | highs are linear (4% delta to prev. frequency)
Overall 100 - 16.000 Hz
(+) | overall sound is linear (12.9% difference to median)
Compared to same class
» 19% of all tested devices in this class were better, 5% similar, 76% worse
» The best had a delta of 5%, average was 18%, worst was 53%
Compared to all devices tested
» 12% of all tested devices were better, 3% similar, 85% worse
» The best had a delta of 4%, average was 24%, worst was 134%
Apple MacBook Pro 13 2020 2TB3 i5 audio analysis
(±) | speaker loudness is average but good (77.6 dB)
Bass 100 - 315 Hz
(±) | reduced bass - on average 7.7% lower than median
(±) | linearity of bass is average (7.8% delta to prev. frequency)
Mids 400 - 2000 Hz
(+) | balanced mids - only 4.8% away from median
(+) | mids are linear (2.7% delta to prev. frequency)
Highs 2 - 16 kHz
(+) | balanced highs - only 1.5% away from median
(+) | highs are linear (4.9% delta to prev. frequency)
Overall 100 - 16.000 Hz
(+) | overall sound is linear (12.9% difference to median)
Compared to same class
» 12% of all tested devices in this class were better, 3% similar, 85% worse
» The best had a delta of 4%, average was 24%, worst was 134%
Compared to all devices tested
» 12% of all tested devices were better, 3% similar, 85% worse
» The best had a delta of 4%, average was 24%, worst was 134%
Energy Management - Apple M1 is more efficient
Power Consumption
The power consumption improved compared to the predecessor and the (already very low) idle values are even better this time. The MacBook Air M1 is a bit more efficient, but it also has a slightly darker screen. We can measure up to 47.5W under load, but it dropped to around 43W after one hour. Despite the high fan noise, the MacBook Pro 13 eventually has to reduce the performance a bit. The included 61W power adapter is completely sufficient and still has enough headroom to charge the battery under load.
The keyboard illumination is also very efficient. While we can see jumps of up to 2W on some Windows laptops, the highest keyboard illumination on the MBP 13 only increases the consumption by 0.8W.
| Off / Standby | |
| Idle | |
| Load |
|
Key:
min: | |
| Apple MacBook Pro 13 Late 2020 M1 Entry (8 / 256 GB) M1, M1 8-Core GPU, Apple SSD AP0256, IPS, 2560x1600, 13.3" | Apple MacBook Air 2020 M1 Entry M1, M1 7-Core GPU, Apple SSD AP0256Q, IPS, 2560x1600, 13.3" | Apple MacBook Pro 13 2020 2TB3 i5 i5-8257U, Iris Plus Graphics 645, Apple SSD AP0512, , 2560x1600, 13.3" | Apple MacBook Pro 13 2020 2GHz i5 10th-Gen i5-1038NG7, Iris Plus Graphics G7 (Ice Lake 64 EU), Apple SSD SM0512F, IPS, 2560x1600, 13.3" | Dell XPS 13 9310 Core i7 FHD i7-1165G7, Iris Xe G7 96EUs, Micron 2300 512GB MTFDHBA512TDV, IPS, 1920x1200, 13.4" | Huawei MateBook X Pro 2020 i7 i7-10510U, GeForce MX250, Samsung PM981a MZVLB1T0HBLR, LTPS, 3000x2000, 13.9" | Razer Book 13 FHD i7-1165G7, Iris Xe G7 96EUs, Samsung SSD PM981a MZVLB256HBHQ, IPS, 1920x1200, 13.4" | Average Apple M1 8-Core GPU | Average of class Subnotebook | |
|---|---|---|---|---|---|---|---|---|---|
| Power Consumption | 8% | -34% | -64% | -30% | -74% | -27% | -50% | -44% | |
| Idle Minimum * (Watt) | 1.67 | 1.9 -14% | 2.3 -38% | 3.8 -128% | 3.9 -134% | 4.3 -157% | 3.3 -98% | 3.34 ? -100% | 3.82 ? -129% |
| Idle Average * (Watt) | 6.7 | 6.4 4% | 7.9 -18% | 8.6 -28% | 5.9 12% | 8.5 -27% | 6.4 4% | 14.6 ? -118% | 6.61 ? 1% |
| Idle Maximum * (Watt) | 7.4 | 7 5% | 8.6 -16% | 10.3 -39% | 6.3 15% | 12 -62% | 7 5% | 13.3 ? -80% | 7.99 ? -8% |
| Load Average * (Watt) | 28 | 25 11% | 46 -64% | 52.1 -86% | 39.7 -42% | 54.8 -96% | 37.3 -33% | 23 ? 18% | 41.9 ? -50% |
| Load Maximum * (Watt) | 47.5 | 30.3 36% | 64 -35% | 65.2 -37% | 47.5 -0% | 61.5 -29% | 53.7 -13% | 33.2 ? 30% | 64.1 ? -35% |
| Witcher 3 ultra * (Watt) | 48.2 | 34.8 | 47.1 | 36.4 |
* ... smaller is better
Battery Runtime
The battery capacity did not change (58.2 Wh), but the battery runtimes are noticeably longer compared to the previous Intel powered model. The MacBook Air M1 with the smaller battery (49.9 Wh) is beaten as well. We can determine more than 20 hours in our Wi-Fi test, and still more than 19 hours during video playback (both tests at an adjusted luminance of 150 cd/m²). If we repeat the Wi-Fi test with the maximum display brightness, the runtime drops by around 50 % to slightly more than 10 hours. Overall, these are excellent results.
| Apple MacBook Pro 13 Late 2020 M1 Entry (8 / 256 GB) M1, M1 8-Core GPU, 58.2 Wh | Apple MacBook Air 2020 M1 Entry M1, M1 7-Core GPU, 49.9 Wh | Apple MacBook Pro 13 2020 2TB3 i5 i5-8257U, Iris Plus Graphics 645, Wh | Apple MacBook Pro 13 2020 2GHz i5 10th-Gen i5-1038NG7, Iris Plus Graphics G7 (Ice Lake 64 EU), 58 Wh | Dell XPS 13 9310 Core i7 FHD i7-1165G7, Iris Xe G7 96EUs, 52 Wh | Huawei MateBook X Pro 2020 i7 i7-10510U, GeForce MX250, 57.4 Wh | Razer Book 13 FHD i7-1165G7, Iris Xe G7 96EUs, 55 Wh | Average of class Subnotebook | |
|---|---|---|---|---|---|---|---|---|
| Battery runtime | ||||||||
| WiFi v1.3 (h) | 20.4 | 16 -22% | 13.4 -34% | 12.1 -41% | 11 -46% | 10.4 -49% | 14.8 -27% | 14 ? -31% |
Pros
Cons
Verdict - MBP 13 is very good, but it does not justify the additional price over the Air
We can keep the verdict about the new MacBook Pro 13 with the M1 processor pretty short: It builds on the strengths of the previous iterations and the new processor improves some aspects like the performance, the fan noise in everyday scenarios or longer battery runtime. However, there are still some drawbacks like the limited number of ports or the slow Wi-Fi 6 transfer speeds. All in all, it is still one of the best mobile devices on the market.
The problem is the comparison with the new MacBook Air. Thanks to the M1 update, the Air is now much more powerful than before, and you cannot really notice a difference between the two devices in practice. The MacBook Pro 13 only benefits from its fan under sustained workloads, but we do not think this is really an important aspect for the target audience. The performance drop of the Air is also not that bad (about 12 % in Cinebench R23).
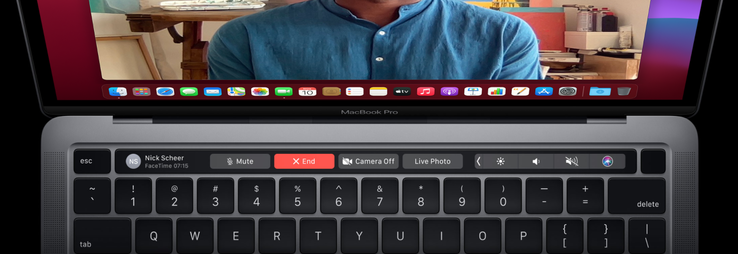
The Air also closed the gap when it comes to the display. It is still a bit darker than the Pro (400 vs. 500 nits), but the Air now also supports the larger P3 color gamut. Both devices support the same connectivity features. The battery runtime is better on the Pro thanks to the bigger battery, but it is also heavier in return. The only real difference when you use the device is the Touch Bar of the MacBook Pro 13. However, every user has to decide whether this is a positive or negative aspect. To be honest, even after a couple of years, the Touch Bar is still just a gimmick most of the time and basic actions like adjusting of the display brightness or speaker volume usually requires more inputs. Personally, we would prefer the physical F keys of the MacBook Air.
The MacBook Pro 13 benefits heavily from the new M1 processor and it is certainly one of the best subnotebooks you can get. Compared to the new MacBook Air, however, we miss the "Pro" features. Both models are extremely close in everyday usage scenarios, so we would definitely prefer the less expensive MacBook Air.
The price of the MacBook Pro 13 with a 256 GB SSD starts at $1299, and $1499 with a 512 GB SSD. The MacBook Air with the faster 8-core GPU and 512 GB is available for $1249, so it offers a much better price-performance ratio.
All in all, the new MacBook Pro 13 M1 seems to be filler product that does not make much sense. We cannot find any real arguments to prefer the Pro over the new Air. We suspect Apple will eventually discontinue the entry-level MacBook Pro 13 in the not-too-distant future and only offer a single (and more expensive) MacBook Pro 13 (or maybe MacBook Pro 14) with a more powerful M1X processor.
Apple MacBook Pro 13 Late 2020 M1 Entry (8 / 256 GB)
- 12/18/2020 v7 (old)
Andreas Osthoff
Price comparison
