Notebookcheck Logo

Intel Core i7-12700K vs Apple M2 vs Apple M2 Max

Intel Core i7-12700K

► remove from comparison Intel i7-12700K

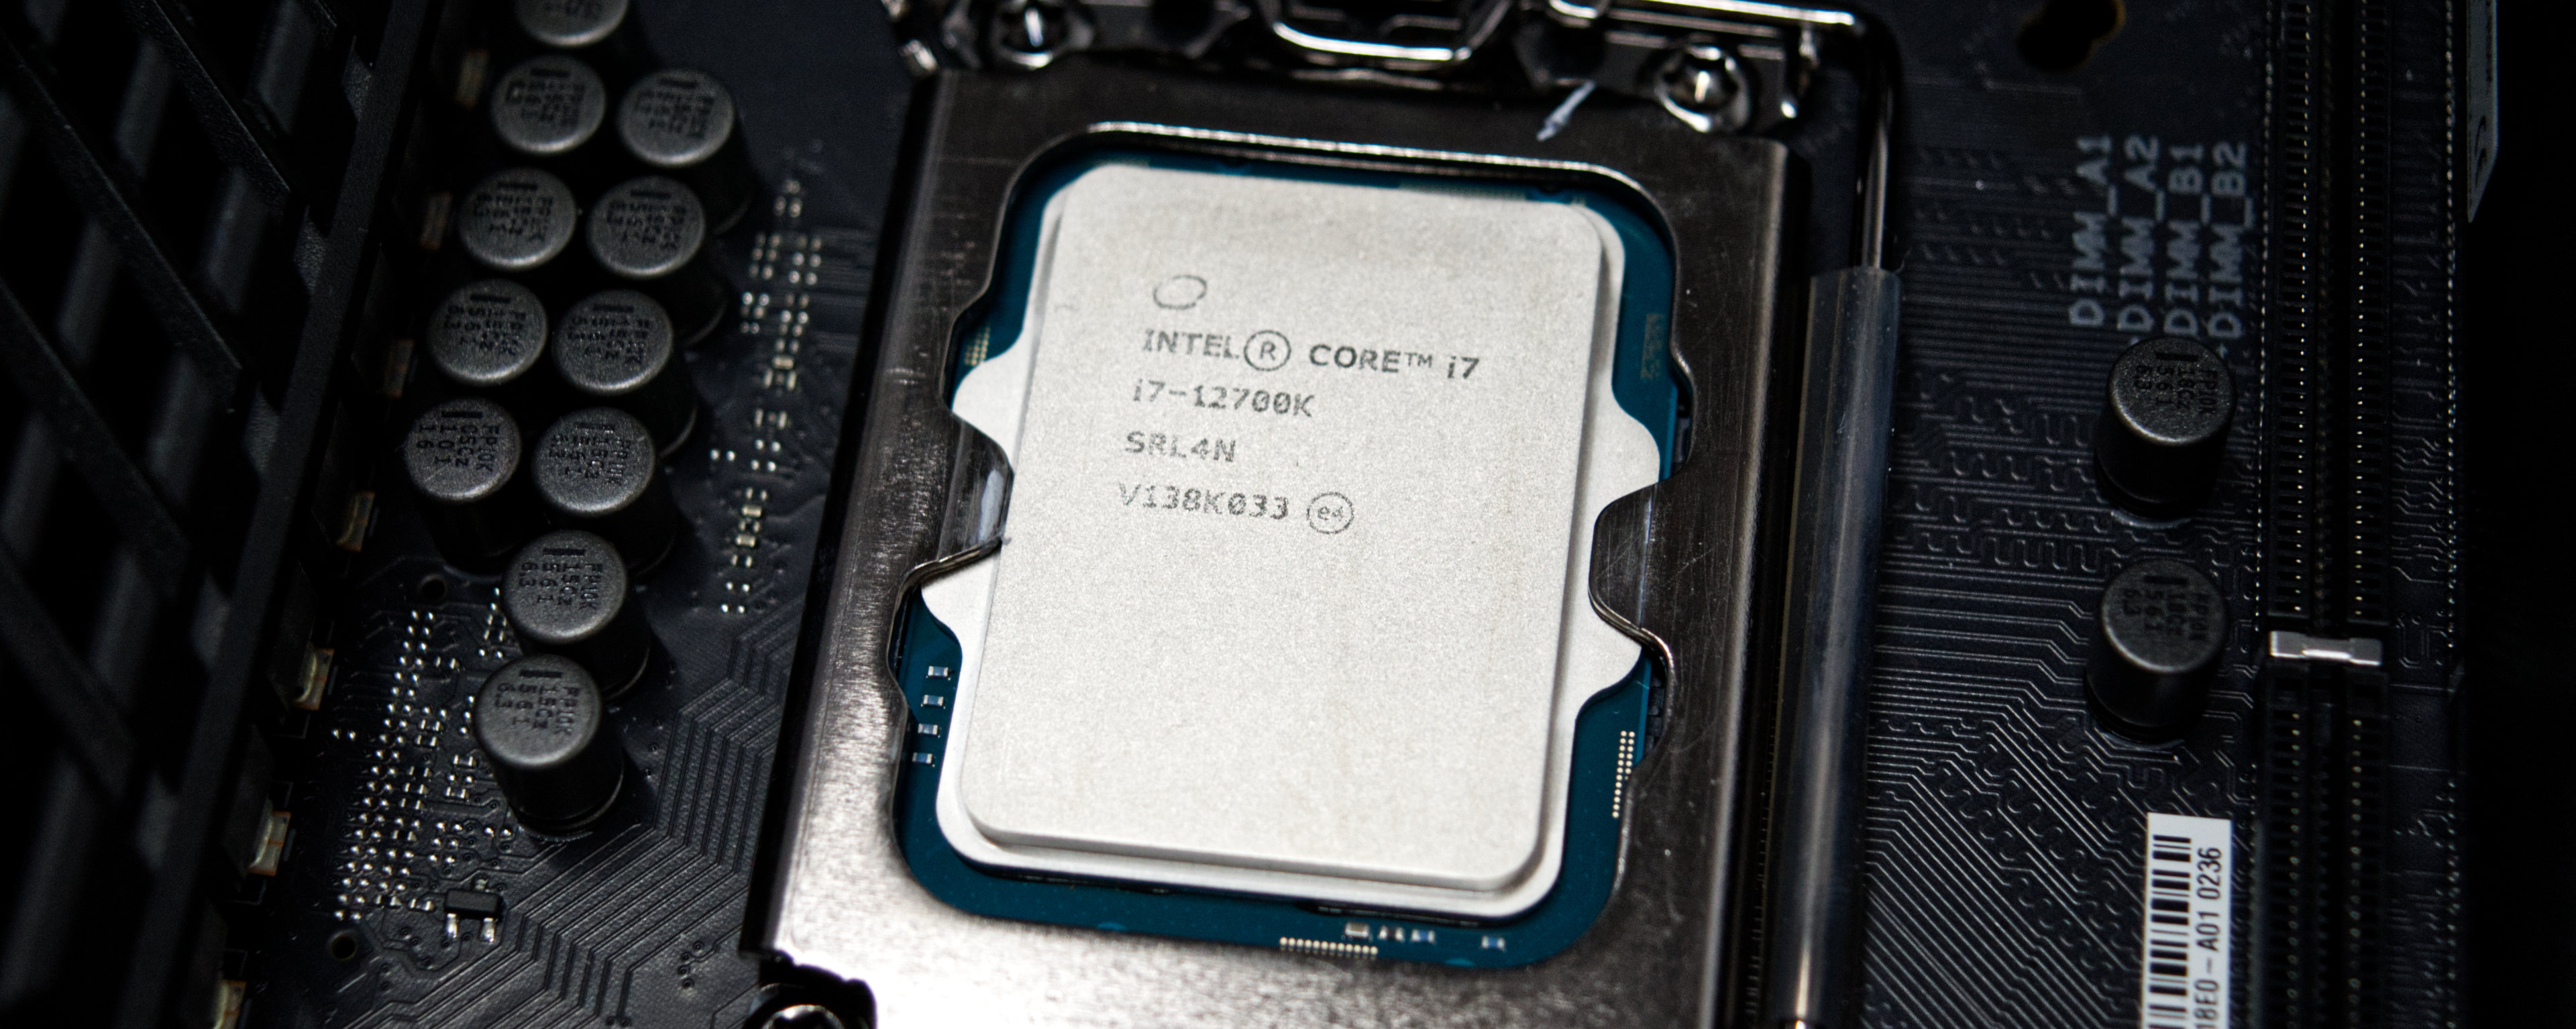
The Intel Core i7-12700K is a high end CPU for desktops based on the Alder Lake architecture. It was first announced in November 2021 and offers 8 performance cores and 4 efficiency cores. The performance cores (P-cores) support HyperThreading, leading to 20 Threads that can be processed at once. The performance cores can clock with up to 5 GHz (Turbo Boost Max 3.0), the efficiency cores can clock with up to 3.9 GHz. All cores can use 25 MB Smart Cache. The integrated memory controller supports up to 128 GB DDR5 with 4800 MT/s (dual channel).

Thread Director (in hardware) can support the operating system to decide which thread to use on the performance or efficiency cores for the best performance.

The integrated graphics adapter is based on the Xe-architecture and called Intel UHD Graphics 770. It clocks between 300 and 1.5 GHz.

For AI tasks, the CPU also integrates GNA 3.0 and DL Boost. Quick Sync in version 8 is the same as in the Rocket Lake CPUs and supports MPEG-2, AVC, VC-1 decode, JPEG, VP8 decode, VP9, HEVC and AV1 decode in hardware.

Performance

The average 12700K in our database is way ahead of the Ryzen 7 5800X and the Ryzen 9 3900X, as far as multi-thread benchmark scores are concerned. Which is a very, very impressive result, as of late 2022.

Power consumption

This Core i7 series chip has a Base power consumption of 125 W, with its highest Intel-recommended Turbo power consumption sitting at 190 W. It might be a good idea to get an AIO cooling solution for a chip this power hungry.

The i7-12700K is manufactured on Intel's fourth-generation 10 nm process marketed as Intel 7 for lower-than-average, as of early 2023, energy efficiency.

Apple M2

► remove from comparison Apple M2

The Apple M2 is a System on a Chip (SoC) from Apple that is found in the late 2022 MacBook Air and, MacBook Pro 13. It offers 8 cores divided in four performance cores and four power-efficiency cores. The big cores offer 192 KB instruction cache, 128 KB data cache, and 16 MB shared L2 cache (up from 12 MB). The four efficiency cores are a lot smaller and offer only 128 KB instruction cache, 64 KB data cache, and 4 MB shared cache. The efficiency cores (E cluster) clock with  up to 2,4 GHz, the performance cores (P cluster) with up to 3,5 GHz and therefore higher than the M1 cores. The architecture should be similar to the A15 (iPhone 13) with Avalanche and Blizzard cores.

The chip features a unified memory architecture for the CPU and GPU cores and supports up to 24 GB LPDDR5-6400 for a bandwidth of up to 100GB/s.

According to Apple, the M2 offers a 18% higher CPU performance at the same power consumption level compared to the Apple M1. In our tests, the MacBook Pro 13 with active cooling was able to reach the 18% in Geekbench Multi. In other benchmarks we measured 12 to 15% gains compared to the M1. Therefore, the performance is now near the M1 Pro with 8 cores. The passively cooled MacBook Air may however suffer from throttling in longer load scenarios.

The integrated graphics card in the M2 offers 8 or 10 cores and a peak performance of 3.6 TFLOPs.

Furthermore, the SoC integrates a fast 16 core neural engine with a peak performance of 16 TOPS (for AI hardware acceleration), a secure enclave (e.g., for encryption), Thunderbolt / USB 4 controller, an ISP, and media de- and encoders.

The Apple M2 includes 20 billion transistors (up from the 16 billion of the M1) and is manufactured in the second generation 5nm process at TSMC (most likely N5P). The power consumption is rated at 20W what we also measured under CPU load.

Apple M2 Max

► remove from comparison Apple M2 Max

The Apple M2 Max is a System on a Chip (SoC) from Apple that is found in the early 2023 MacBook Pro 14 and 16-inch models. It offers all 12 CPU cores available in the chip divided in eight performance cores (P-cores) and four power-efficiency cores (E-cores). The E-cores clock with up to 3.4 GHz, the P-Cores up to 3.7 GHz (mostly 3.3 GHz in multi-threaded workloads and 3.4 GHz in single threaded).

The big cores (codename Avalanche) offer 192 KB instruction cache, 128 KB data cache, and 36 MB shared L2 cache (up from 24 MB in the M1 Pro). The four efficiency cores (codename Blizzard) are a lot smaller and offer only 128 KB instruction cache, 64 KB data cache, and 4 MB shared cache. CPU and GPU can both use the 49 MB SLC (System Level Cache). 

The unified memory (32, 64, or 96 GB LPDDR5-6400) next to the chip is connected by a 512 Bit memory controller (400 GB/s bandwidth) and can be used by the GPU and CPU.

The CPU performance should be quite similar to the M2 Pro as only the higher memory bandwidth and bigger L3 cache could make a difference for some workloads.

The integrated graphics card in the M1 Max offers a 30-core GPU or a GPU with all 38 cores.

Furthermore, the SoC integrates a fast 16 core neural engine (faster than M1 Max), a secure enclave (e.g., for encryption), a unified memory architecture, Thunderbolt 4 controller, an ISP, and media de- and encoders (including ProRes).

The M2 Max is manufactured in 5 nm at TSMC (second generation) and integrates 40 billion transistors. The power consumption of the CPU part is up to 36 Watt according to powermetrics. When fully loading the CPU and GPU cores, the chip uses up to 89 Watt and the CPU part is limited to 25 Watt.

ModelIntel Core i7-12700KApple M2Apple M2 Max
SeriesIntel Alder Lake-SApple Apple M2Apple Apple M2
CodenameAlder Lake
Series: Apple M2
Intel Core i9-12900K3.2 - 5.2 GHz16 / 24 cores30 MB L3
Intel Core i9-129002.4 - 5.1 GHz16 / 24 cores20 MB L3
Intel Core i7-12700K « 2.7 - 5 GHz12 / 20 cores25 MB L3
Intel Core i7-12700F3.3 - 4.9 GHz12 / 20 cores25 MB L3
Intel Core i7-127003.3 - 4.9 GHz12 / 20 cores25 MB L3
Intel Core i5-12600K2.8 - 4.9 GHz10 / 16 cores20 MB L3
Apple M2 Max2.42 - 3.7 GHz12 / 12 cores48 MB L3
Apple M2 Pro2.42 - 3.5 GHz12 / 12 cores24 MB L3
Apple M2 Pro 10-Core2.42 - 3.7 GHz10 / 10 cores24 MB L3
Apple M2 « 2.42 - 3.48 GHz8 / 8 cores8 MB L3
Apple M2 Max « 2.42 - 3.7 GHz12 / 12 cores48 MB L3
Apple M2 Pro2.42 - 3.5 GHz12 / 12 cores24 MB L3
Apple M2 Pro 10-Core2.42 - 3.7 GHz10 / 10 cores24 MB L3
Apple M22.42 - 3.48 GHz8 / 8 cores8 MB L3
Clock2700 - 5000 MHz2424 - 3480 MHz2424 - 3696 MHz
L2 Cache12 MB20 MB36 MB
L3 Cache25 MB8 MB48 MB
Cores / Threads12 / 208 / 812 / 12
TDP125 Watt20 Watt79 Watt
Technology10 nm5 nm5 nm
max. Temp.100 °C
SocketLGA1700
FeaturesDDR4-3200/DDR5-4800 RAM, PCIe 5, Thr. Dir., DL Boost, GNA, vPro Enterp., MMX, SSE, SSE2, SSE3, SSSE3, SSE4.1, SSE4.2, AVX, AVX2, BMI2, ABM, FMA, ADX, SMEP, SMAP, EIST, TM1, TM2, HT, Turbo, SST, AES-NI, RDRAND, RDSEED, SHAARMv8 Instruction SetARMv8 Instruction Set
iGPUIntel UHD Graphics 770 (300 - 1500 MHz)Apple M2 10-Core GPU ( - 1398 MHz)Apple M2 Max 38-Core GPU
Architecturex86ARMARM
$409 U.S.
Announced
Manufacturerark.intel.comwww.apple.com
L1 Cache2 MB3.3 MB
Transistors20000 Million67000 Million

Benchmarks

Performance Rating - CB R15 + R20 + 7-Zip + X265 + Blender + 3DM11 CPU - i7-12700K
46.7 pt (65%)
Cinebench 2024 - CB24 CPU Single Core
100%
1 M2 +
121 Points (84%)
Cinebench 2024 - CB24 CPU Multi Core
100%
1 M2 +
513 Points (10%)
Cinebench R23 - Cinebench R23 Multi Core
min: 17003     avg: 19784     median: 19784 (18%)     max: 22565 Points
44%
M2 +
min: 8517     avg: 8654     median: 8667 (8%)     max: 8772 Points
min: 14738     avg: 14753     median: 14752.5 (14%)     max: 14767 Points
Cinebench R23 - Cinebench R23 Single Core
min: 1806     avg: 1851     median: 1850.5 (79%)     max: 1895 Points
86%
M2 +
min: 1580     avg: 1595     median: 1585 (67%)     max: 1638 Points
min: 1625     avg: 1644     median: 1643.5 (70%)     max: 1662 Points
Cinebench R20 - Cinebench R20 CPU (Single Core)
min: 731     avg: 736     median: 735.5 (82%)     max: 740 Points
52%
M2 +
min: 216     avg: 370.8     median: 381 (42%)     max: 446 Points
min: 451     avg: 455.5     median: 455.5 (51%)     max: 460 Points
Cinebench R20 - Cinebench R20 CPU (Multi Core)
min: 6953     avg: 7801     median: 7800.5 (19%)     max: 8648 Points
30%
M2 +
min: 2231     avg: 2325     median: 2324 (6%)     max: 2416 Points
min: 4044     avg: 4065     median: 4064.5 (10%)     max: 4085 Points
Cinebench R15 - Cinebench R15 CPU Multi 64 Bit
3325 Points (21%)
37%
M2 +
min: 1209.9     avg: 1222     median: 1215 (8%)     max: 1243 Points
min: 2074     avg: 2084     median: 2084 (13%)     max: 2094 Points
Cinebench R15 - Cinebench R15 CPU Single 64 Bit
272 Points (82%)
82%
M2 +
min: 222     avg: 223.8     median: 223 (67%)     max: 229 Points
min: 233     avg: 236     median: 236 (71%)     max: 239 Points
Cinebench R11.5 - Cinebench R11.5 CPU Multi 64 Bit
38.4 Points (50%)
Cinebench R11.5 - Cinebench R11.5 CPU Single 64 Bit
3.3 Points (82%)
Cinebench R10 - Cinebench R10 Rend. Single (32bit)
9305 Points (56%)
Cinebench R10 - Cinebench R10 Rend. Multi (32bit)
63484 Points (46%)
Cinebench R10 - Cinebench R10 Rend. Multi (64bit)
102539 Points (71%)
Cinebench R10 - Cinebench R10 Rend. Single (64bit)
15179 Points (18%)
wPrime 2.10 - wPrime 2.0 1024m *
171.2 s (2%)
wPrime 2.10 - wPrime 2.0 32m *
2.7 s (1%)
WinRAR - WinRAR 4.0
10389 Points (16%)
7-Zip 18.03 - 7-Zip 18.03 Multli Thread 4 runs
min: 65508     avg: 73439     median: 73438.5 (42%)     max: 81369 MIPS
7-Zip 18.03 - 7-Zip 18.03 Single Thread 4 runs
min: 6117     avg: 6270     median: 6269.5 (75%)     max: 6422 MIPS
X264 HD Benchmark 4.0 - x264 Pass 2
179 fps (62%)
X264 HD Benchmark 4.0 - x264 Pass 1
349.5 fps (81%)
HWBOT x265 Benchmark v2.2 - HWBOT x265 4k Preset
min: 14.9     avg: 20.5     median: 20.5 (36%)     max: 26.1 fps
TrueCrypt - TrueCrypt Serpent
1.6 GB/s (0%)
TrueCrypt - TrueCrypt Twofish
2.8 GB/s (48%)
TrueCrypt - TrueCrypt AES
15.7 GB/s (41%)
Blender - Blender 3.3 Classroom CPU *
100%
1 M2 +
min: 540     avg: 620     median: 619.5 (8%)     max: 702 Seconds
104%
1 M2 Max +
326 Seconds (4%)
Blender - Blender 2.79 BMW27 CPU *
min: 152.3     avg: 173.1     median: 173.1 (1%)     max: 193.9 Seconds
97%
M2 +
min: 549     avg: 614     median: 597 (4%)     max: 713 Seconds
333 Seconds (2%)
R Benchmark 2.5 - R Benchmark 2.5 *
min: 0.412     avg: 0.4     median: 0.4 (9%)     max: 0.423 sec
3DMark 06 - CPU - 3DMark 06 - CPU
16827 Points (36%)
Super Pi mod 1.5 XS 1M - Super Pi mod 1.5 XS 1M *
7.3 s (2%)
Super Pi mod 1.5 XS 2M - Super Pi mod 1.5 XS 2M *
16.6 s (1%)
Super Pi Mod 1.5 XS 32M - Super Pi mod 1.5 XS 32M *
387 s (2%)
3DMark Vantage - 3DM Vant. Perf. CPU no Physx
93250 Points (82%)
3DMark 11 - 3DM11 Performance Physics
min: 23129     avg: 24947     median: 24947 (67%)     max: 26765 Points
3DMark - 3DMark Ice Storm Physics
109742 Points (89%)
3DMark - 3DMark Ice Storm Extreme Physics
112268 Points (91%)
3DMark - 3DMark Ice Storm Unlimited Physics
109389 Points (92%)
3DMark - 3DMark Cloud Gate Physics
min: 21804     avg: 23017     median: 23017 (58%)     max: 24230 Points
3DMark - 3DMark Fire Strike Standard Physics
min: 31240     avg: 34160     median: 34159.5 (61%)     max: 37079 Points
3DMark - 3DMark Time Spy CPU
min: 13915     avg: 15550     median: 15550 (66%)     max: 17185 Points
Geekbench 6.2 - Geekbench 6.2 Single-Core
100%
1 M2 +
min: 2587     avg: 2610     median: 2593 (70%)     max: 2650 Points
104%
1 M2 Max +
2692 Points (72%)
Geekbench 6.2 - Geekbench 6.2 Multi-Core
100%
1 M2 +
min: 10034     avg: 10071     median: 10085 (40%)     max: 10093 Points
147%
1 M2 Max +
14863 Points (59%)
Geekbench 5.5 - Geekbench 5.1 - 5.4 64 Bit Single-Core
min: 1890     avg: 1912     median: 1911.5 (81%)     max: 1933 Points
100%
M2 +
min: 1887     avg: 1914     median: 1915.5 (81%)     max: 1953 Points
min: 1965     avg: 1970     median: 1967 (83%)     max: 1978 Points
Geekbench 5.5 - Geekbench 5.1 - 5.4 64 Bit Multi-Core
min: 12475     avg: 14016     median: 14016 (25%)     max: 15557 Points
64%
M2 +
min: 8491     avg: 8812     median: 8956 (16%)     max: 8994 Points
min: 15348     avg: 15388     median: 15373 (28%)     max: 15444 Points
Geekbench 5.0 - Geekbench 5.0 64 Bit Single-Core
min: 1835     avg: 1841     median: 1840.5 (8%)     max: 1846 Points
Geekbench 5.0 - Geekbench 5.0 64 Bit Multi-Core
min: 12318     avg: 13879     median: 13879 (44%)     max: 15440 Points
Geekbench 4.4 - Geekbench 4.1 - 4.4 64 Bit Single-Core
8133 Points (81%)
Geekbench 4.4 - Geekbench 4.1 - 4.4 64 Bit Multi-Core
55786 Points (61%)
Mozilla Kraken 1.1 - Kraken 1.1 Total Score *
min: 496     avg: 498     median: 498 (1%)     max: 500 ms
100%
M2 +
min: 440     avg: 451.2     median: 450.1 (1%)     max: 466.8 ms
min: 430.2     avg: 437.2     median: 437.2 (1%)     max: 444.2 ms
Octane V2 - Octane V2 Total Score
100%
1 M2 +
min: 72484     avg: 74555     median: 74746 (67%)     max: 77756 Points
104%
1 M2 Max +
min: 76610     avg: 77676     median: 77676 (70%)     max: 78742 Points
WebXPRT 4 - WebXPRT 4 Score
100%
1 M2 +
min: 223     avg: 236.6     median: 227 (65%)     max: 256 Points
114%
1 M2 Max +
min: 258     avg: 259     median: 259 (74%)     max: 260 Points
WebXPRT 3 - WebXPRT 3 Score
min: 301     avg: 303.5     median: 303.5 (63%)     max: 306 Points
124%
M2 +
min: 342     avg: 369.1     median: 377 (79%)     max: 387 Points
min: 402     avg: 404.5     median: 404.5 (84%)     max: 407 Points
Antutu v9 - AnTuTu v9 Total Score
100%
1 M2 +
min: 1257990     avg: 1337360     median: 1337360 (81%)     max: 1416730 Points
Antutu v9 - AnTuTu v9 CPU
100%
1 M2 +
min: 294643     avg: 298254     median: 298254 (82%)     max: 301865 Points
CrossMark - CrossMark Overall
1999 Points (77%)
76%
M2 +
min: 1437     avg: 1521     median: 1513.5 (58%)     max: 1585 Points
min: 1759     avg: 1835     median: 1834.5 (70%)     max: 1910 Points
Power Consumption - Prime95 Power Consumption - external Monitor *
min: 132.1     avg: 206.6     median: 206.6 (36%)     max: 281 Watt
Power Consumption - Cinebench R15 Multi Power Consumption - external Monitor *
278.2 Watt (51%)
192%
1 M2 +
29 Watt (5%)
176%
1 M2 Max +
72.8 Watt (13%)
Power Consumption - Geekbench 5.5 Power Consumption 150cd *
100%
1 M2 +
min: 6.86     avg: 8.3     median: 8.4 (4%)     max: 9.71 Watt
Power Consumption - Idle Power Consumption - external Monitor *
100%
1 M2 +
min: 2.03     avg: 2.6     median: 2.4 (2%)     max: 3.98 Watt
95%
1 M2 Max +
9.2 Watt (6%)
Power Consumption - Idle Power Consumption 150cd 1min *
100%
1 M2 +
min: 1.631     avg: 3.5     median: 3.6 (4%)     max: 5.32 Watt
Power Consumption - Cinebench R15 Multi Power Efficiency - external Monitor
12 Points per Watt (9%)
353%
1 M2 +
42.4 Points per Watt (32%)
238%
1 M2 Max +
28.5 Points per Watt (21%)

Average Benchmarks Intel Core i7-12700K → 100% n=12

Average Benchmarks Apple M2 → 74% n=12

Average Benchmarks Apple M2 Max → 89% n=12

- Range of benchmark values for this graphics card
- Average benchmark values for this graphics card
* Smaller numbers mean a higher performance
1 This benchmark is not used for the average calculation

v1.27
log 16. 14:55:27

#0 checking url part for id 14033 +0s ... 0s

#1 checking url part for id 14521 +0s ... 0s

#2 checking url part for id 14975 +0s ... 0s

#3 not redirecting to Ajax server +0s ... 0s

#4 did not recreate cache, as it is less than 5 days old! Created at Sun, 16 Jun 2024 05:37:17 +0200 +0.001s ... 0.001s

#5 composed specs +0.035s ... 0.036s

#6 did output specs +0s ... 0.036s

#7 getting avg benchmarks for device 14033 +0.019s ... 0.055s

#8 got single benchmarks 14033 +0.011s ... 0.066s

#9 getting avg benchmarks for device 14521 +0.003s ... 0.069s

#10 got single benchmarks 14521 +0.019s ... 0.089s

#11 getting avg benchmarks for device 14975 +0.003s ... 0.092s

#12 got single benchmarks 14975 +0.01s ... 0.102s

#13 got avg benchmarks for devices +0s ... 0.102s

#14 min, max, avg, median took s +0.334s ... 0.436s

#15 return log +0s ... 0.436s

Please share our article, every link counts!
> Expert Reviews and News on Laptops, Smartphones and Tech Innovations > Benchmarks / Tech > Processor Comparison - Head 2 Head
Redaktion, 2017-09- 8 (Update: 2023-07- 1)