Notebookcheck Logo

Intel Core i5-13450HX vs Intel Core i5-13500

Intel Core i5-13450HX

► remove from comparison Intel i5-13450HX

The Intel Core i5-13450HX is a fast mid-range mobile processor of the Raptor Lake series. Is was announced in early 2023. The CPU integrates 6 fast Raptor Cove performance cores (P-cores) with HyperThreading and 4 Gracemont efficiency cores without HyperThreading. The P-Cores clock between 2.4 GHz (base) up to 4.6 GHz (single core boost, all-core 4.5 GHz). The smaller E-Cores clock between 1.8 and 3.4 GHz. All cores can access the combined 20 MB L3 cache (compared to the 36 MB of the i9 models).

Compared to Alder Lake, Raptor Lake offers improved P-Cores (Raptor Cove micro-architecture) with bigger Caches and more E-Cores (same Gracemont micro-architecture). Furthermore, the chip supports faster DDR5 memory (up to 5600 MHz for the 13980HX, but only 4800 MHz for the i5).

Performance

While we have not tested a single system built around the 13450HX as of August 2023, we have tested several systems featuring the Core i5-12600K, a CPU with very similar specs (six P-cores mated to four E-cores, both running at insignificantly faster clock speeds than what the 13450HX has). Based on that, we expect the 13450HX to be 10% to 15% behind the Ryzen 7 7840HS and the Ryzen 9 7940HS, as far as multi-thread benchmark scores are concerned.

Your mileage may vary depending on how competent the system's cooling solution is and how high the CPU power limits are.

Power consumption

The chip's "minimum assured" power consumption sits at 45 W. Its Turbo power consumption is not supposed to go over 157 W and its "base" power consumption is supposed to be around 55 W. Most laptop makers will probably go for a value much higher than 55 W to extract as much performance out of the chip as possible.

The i5-13450HX is built with Intel's 4th generation 10 nm process marketed as Intel 7 for average, as of early 2023, energy efficiency.

Intel Core i5-13500

► remove from comparison Intel i5-13500

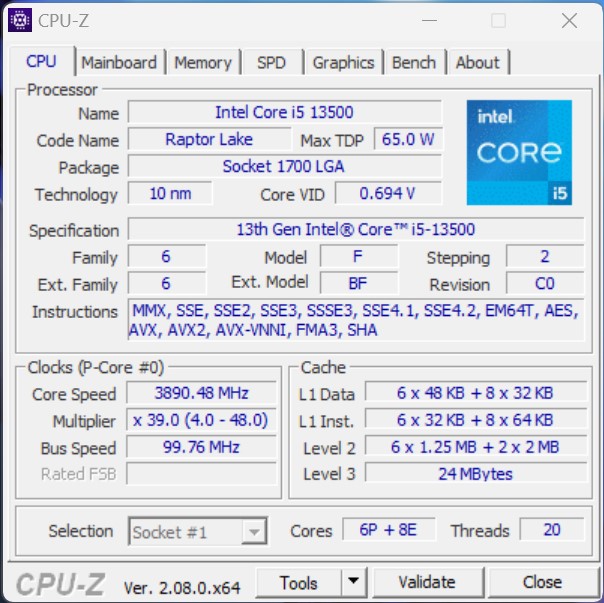
The Intel Core i5-13500 is a fast and relatively power efficient desktop processor based on the Raptor Lake architecture, which was introduced in October 2022. The processor offers a base clock of 2.5 GHz and reaches up to 4.8 GHz in Turbo. The hybrid CPU architecture introduced with Alder Lake is also used in the Raptor Lake processors. Compared to the Intel Core i5-12500, the Intel Core i5-13500 offers more cores, which means a higher overall performance can be achieved. In total, the Intel Core i5-13500 can process up to 20 threads in parallel. The performance cores (P cores) offer hyperthreading for this purpose, which is withheld from the energy-efficient cores (E cores).

Performance

Due to the higher number of physical computing units, the Intel Core i5-13500 offers noticeably more performance compared to the Intel Core i5-12500. Both processors have 6 P-cores, although only the Intel Core i5-13500 is additionally equipped with 8 E-cores.

Graphics unit

Like the Intel Core i5-12600K, the Intel Core i5-13500 offers an integrated graphics unit. The Intel Iris Xe architecture continues to serve as the basis. In terms of performance, however, not much has changed with the new Intel UHD Graphics 770.

Power consumption

The TDP of the Intel Core i5-13500 is 65 watts, with the option to increase this to up to 154 watts in Turbo mode. Compared to the Intel Core i5-12500, the energy requirement increases slightly.

ModelIntel Core i5-13450HXIntel Core i5-13500
CodenameRaptor Lake-HXRaptor Lake
SeriesIntel Raptor Lake-HXIntel Raptor Lake-S
Series: Raptor Lake-S Raptor Lake
Intel Core i9-13980HX compare1.6 - 5.6 GHz24 / 32 cores36 MB L3
Intel Core i9-13950HX compare1.6 - 5.5 GHz24 / 32 cores36 MB L3
Intel Core i9-13900HX compare1.6 - 5.4 GHz24 / 32 cores36 MB L3
Intel Core i7-13850HX compare1.5 - 5.3 GHz20 / 28 cores30 MB L3
Intel Core i7-13700HX compare1.5 - 5 GHz16 / 24 cores30 MB L3
Intel Core i7-13650HX compare1.9 - 4.9 GHz14 / 20 cores24 MB L3
Intel Core i5-13600HX compare1.9 - 4.8 GHz14 / 20 cores24 MB L3
Intel Core i5-13500HX compare1.8 - 4.7 GHz14 / 20 cores24 MB L3
Intel Core i5-13450HX « 1.8 - 4.6 GHz10 / 16 cores20 MB L3
Intel Core i9-13900K compare3 - 5.8 GHz24 / 32 cores36 MB L3
Intel Core i7-13700K compare3.4 - 5.4 GHz16 / 24 cores30 MB L3
Intel Core i5-13600K compare3.5 - 5.1 GHz14 / 20 cores24 MB L3
Intel Core i9-14901E compare2.8 - 5.6 GHz8 / 16 cores36 MB L3
Intel Core i5-13500 « 2.5 - 4.8 GHz14 / 20 cores24 MB L3
Intel Core i7-14701E compare2.6 - 5.4 GHz8 / 16 cores33 MB L3
Intel Core i9-14901TE compare2.3 - 5.5 GHz8 / 16 cores36 MB L3
Intel Core i7-14701TE compare2.1 - 5.2 GHz8 / 16 cores33 MB L3
Intel Core i5-14501TE compare2.2 - 5.1 GHz6 / 12 cores12 MB L3
Intel Core i5-14501E compare3.3 - 5.2 GHz6 / 12 cores24 MB L3
Intel Core i5-14401E compare2.5 - 4.7 GHz6 / 12 cores12 MB L3
Intel Core i5-14401TE compare2 - 4.5 GHz6 / 12 cores12 MB L3
Intel Core i5-13500T compare1.6 - 4.6 GHz14 / 20 cores24 MB L3
Clock1800 - 4600 MHz2500 - 4800 MHz
L3 Cache20 MB24 MB
Cores / Threads10 / 16
6 x 4.6 GHz Intel Raptor Cove P-Core
4 x 3.4 GHz Intel Gracemont E-Core
14 / 20
6 x 4.8 GHz Intel Raptor Cove P-Core
8 x 3.5 GHz Intel Gracemont E-Core
TDP55 Watt65 Watt
Technology10 nm10 nm
Die Size257 mm2215 mm2
max. Temp.100 °C100 °C
SocketBGA1964LGA 1700
FeaturesDDR4-3200/DDR5-4800 RAM, PCIe 5, Thr. Director, DL Boost, GNA, MMX, SSE, SSE2, SSE3, SSSE3, SSE4.1, SSE4.2, AVX, AVX2, BMI2, ABM, FMA, ADX, SMEP, SMAP, EIST, TM1, TM2, HT, Turbo, SST, AES-NI, RDRAND, RDSEED, SHAIntel UHD Graphics 770, DDR5 4800 MT/s, DDR4 3200 MT/s
iGPUIntel UHD Graphics Xe 16EUs (Tiger Lake-H) ( - 1450 MHz)Intel UHD Graphics 770 (300 - 1550 MHz)
Architecturex86x86
Announced
Manufacturerark.intel.comwww.intel.de
L2 Cache11.5 MB
TDP Turbo PL2154 Watt

Benchmarks

Performance Rating - CB R15 + R20 + 7-Zip + X265 + Blender + 3DM11 CPU - i5-13450HX
37.7 pt (63%)
Restrict / Search: Model: Max. age: years
Performance Rating - CB R15 + R20 + 7-Zip + X265 + Blender + 3DM11 CPU - i5-13500
38.3 pt (64%)
Restrict / Search: Model: Max. age: years
Cinebench 2024 - Cinebench 2024 CPU Single Core
101.5 Points (57%)
107 Points (60%)
Cinebench 2024 - Cinebench 2024 CPU Multi Core
812 Points (15%)
822 Points (15%)
Cinebench R23 - Cinebench R23 Multi Core
min: 16575     avg: 16869     median: 16797 (16%)     max: 17234 Points
14573 Points (14%)
Cinebench R23 - Cinebench R23 Single Core
min: 1710     avg: 1741     median: 1746 (73%)     max: 1766 Points
1780 Points (75%)
Cinebench R20 - Cinebench R20 CPU (Single Core)
min: 652     avg: 666     median: 667 (73%)     max: 680 Points
685 Points (75%)
Cinebench R20 - Cinebench R20 CPU (Multi Core)
min: 6489     avg: 6539     median: 6532 (16%)     max: 6595 Points
5633 Points (14%)
Cinebench R15 - Cinebench R15 CPU Multi 64 Bit
min: 2427     avg: 2478     median: 2503 (16%)     max: 2505 Points
2405 Points (15%)
Cinebench R15 - Cinebench R15 CPU Single 64 Bit
min: 239     avg: 246     median: 248 (69%)     max: 251 Points
256 Points (71%)
Cinebench R11.5 - Cinebench R11.5 CPU Multi 64 Bit
29.2 Points (38%)
28.4 Points (37%)
Cinebench R11.5 - Cinebench R11.5 CPU Single 64 Bit
3.1 Points (72%)
3.1 Points (74%)
Cinebench R10 - Cinebench R10 Rend. Single (32bit)
9840 Points (59%)
8875 Points (54%)
Cinebench R10 - Cinebench R10 Rend. Multi (32bit)
58749 Points (43%)
49300 Points (36%)
Cinebench R10 - Cinebench R10 Rend. Multi (64bit)
79625 Points (51%)
Cinebench R10 - Cinebench R10 Rend. Single (64bit)
14282 Points (17%)
wPrime 2.10 - wPrime 2.0 1024m *
100.7 s (1%)
wPrime 2.10 - wPrime 2.0 32m *
4 s (1%)
WinRAR - WinRAR 4.0
6830 Points (11%)
7704 Points (12%)
7-Zip 18.03 - 7-Zip 18.03 Multi Thread 4 runs
min: 59026     avg: 61014     median: 61811 (35%)     max: 62204 MIPS
55528 MIPS (32%)
7-Zip 18.03 - 7-Zip 18.03 Single Thread 4 runs
min: 5370     avg: 5506     median: 5571 (66%)     max: 5576 MIPS
5887 MIPS (69%)
X264 HD Benchmark 4.0 - x264 Pass 2
141.7 fps (4%)
134.6 fps (3%)
X264 HD Benchmark 4.0 - x264 Pass 1
324.6 fps (8%)
306 fps (8%)
HWBOT x265 Benchmark v2.2 - HWBOT x265 4k Preset
min: 16.9     avg: 18.3     median: 17.5 (31%)     max: 20.5 fps
16.3 fps (29%)
TrueCrypt - TrueCrypt Serpent
1 GB/s (29%)
1.3 GB/s (38%)
TrueCrypt - TrueCrypt Twofish
1.6 GB/s (28%)
2.3 GB/s (40%)
TrueCrypt - TrueCrypt AES
13.5 GB/s (35%)
12 GB/s (31%)
Blender - Blender 3.3 Classroom CPU *
min: 338     avg: 374     median: 387 (5%)     max: 397 Seconds
399 Seconds (5%)
Blender - Blender 2.79 BMW27 CPU *
min: 196     avg: 208.3     median: 200 (1%)     max: 229 Seconds
223 Seconds (2%)
R Benchmark 2.5 - R Benchmark 2.5 *
min: 0.4582     avg: 0.5     median: 0.5 (10%)     max: 0.4838 sec
0.4 sec (10%)
3DMark 06 - CPU - 3DMark 06 - CPU
14017 Points (30%)
14875 Points (32%)
Super Pi mod 1.5 XS 1M - Super Pi mod 1.5 XS 1M *
7.2 s (2%)
7.8 s (2%)
Super Pi mod 1.5 XS 2M - Super Pi mod 1.5 XS 2M *
15.9 s (1%)
17.2 s (1%)
Super Pi Mod 1.5 XS 32M - Super Pi mod 1.5 XS 32M *
402 s (2%)
3DMark Vantage - 3DM Vant. Perf. CPU no Physx
69725 Points (54%)
3DMark 11 - 3DM11 Performance Physics
min: 21532     avg: 21934     median: 21982 (54%)     max: 22288 Points
18026 Points (44%)
3DMark - 3DMark Ice Storm Physics
82893 Points (67%)
84456 Points (69%)
3DMark - 3DMark Ice Storm Extreme Physics
83392 Points (68%)
3DMark - 3DMark Ice Storm Unlimited Physics
81778 Points (66%)
3DMark - 3DMark Cloud Gate Physics
19916 Points (50%)
17891 Points (45%)
3DMark - 3DMark Fire Strike Standard Physics
min: 27233     avg: 27745     median: 27595 (49%)     max: 28408 Points
26263 Points (47%)
3DMark - 3DMark Time Spy CPU
min: 12644     avg: 12938     median: 13047 (55%)     max: 13123 Points
9655 Points (41%)
Geekbench 6.5 - Geekbench 6.5 Single-Core
min: 2381     avg: 2415     median: 2417 (58%)     max: 2448 Points
2483 Points (60%)
Geekbench 6.5 - Geekbench 6.5 Multi-Core
min: 12619     avg: 12701     median: 12684 (49%)     max: 12799 Points
10348 Points (40%)
Geekbench 6.0 - Geekbench 6.0 Single-Core
2301 Points (73%)
Geekbench 6.0 - Geekbench 6.0 Multi-Core
12295 Points (50%)
Geekbench 5.5 - Geekbench 5.1 - 5.5 64 Bit Single-Core
min: 1696     avg: 1739     median: 1757 (67%)     max: 1763 Points
1805 Points (69%)
Geekbench 5.5 - Geekbench 5.1 - 5.5 64 Bit Multi-Core
min: 11973     avg: 12000     median: 12005 (22%)     max: 12022 Points
10322 Points (18%)
Geekbench 5.0 - Geekbench 5.0 64 Bit Single-Core
1749 Points (8%)
Geekbench 5.0 - Geekbench 5.0 64 Bit Multi-Core
10213 Points (32%)
Geekbench 4.4 - Geekbench 4.1 - 4.4 64 Bit Single-Core
7379 Points (74%)
Geekbench 4.4 - Geekbench 4.1 - 4.4 64 Bit Multi-Core
39094 Points (38%)
Geekbench 4.0 - Geekbench 4.0 64 Bit Single-Core
7348 Points (81%)
Geekbench 4.0 - Geekbench 4.0 64 Bit Multi-Core
41034 Points (54%)
Mozilla Kraken 1.1 - Kraken 1.1 Total Score *
min: 531     avg: 537     median: 531 (1%)     max: 550 ms
519 ms (1%)
Octane V2 - Octane V2 Total Score
87588 Points (64%)
WebXPRT 4 - WebXPRT 4 Score
243 Points (67%)
254 Points (70%)
WebXPRT 3 - WebXPRT 3 Score
min: 262     avg: 274.7     median: 281 (50%)     max: 281 Points
266 Points (48%)
CrossMark - CrossMark Overall
1804 Points (67%)
1549 Points (58%)
Power Consumption - Prime95 Power Consumption - external Monitor *
min: 108.7     avg: 134.8     median: 134.8 (23%)     max: 160.8 Watt
98.7 Watt (17%)
Power Consumption - Cinebench R15 Multi Power Consumption - external Monitor *
121 Watt (22%)
Power Consumption - Idle Power Consumption - external Monitor *
min: 19.2     avg: 25.4     median: 25.4 (17%)     max: 31.6 Watt
7.9 Watt (5%)
Power Consumption - Idle Power Consumption 150cd 1min *
min: 11.5     avg: 14.8     median: 14.8 (18%)     max: 18.1 Watt
Power Consumption - Power Efficiency - Cinebench R15 Multi external Monitor
19.9 Points per Watt (15%)

Average Benchmarks Intel Core i5-13450HX → 100% n=40

Average Benchmarks Intel Core i5-13500 → 97% n=40

- Range of benchmark values for this graphics card
red legend - Average benchmark values for this graphics card
* Smaller numbers mean a higher performance
1 This benchmark is not used for the average calculation

Add one or more devices and compare

In the following list you can select (and also search for) devices that should be added to the comparison. You can select more than one device.

restrict list:
v1.34
log 08. 16:53:45

#0 ran 0s before starting gpusingle class +0s ... 0s

#1 checking url part for id 14673 +0s ... 0s

#2 checking url part for id 17901 +0s ... 0s

#3 redirected to Ajax server, took 1759935225s time from redirect:0 +0s ... 0s

#4 did not recreate cache, as it is less than 5 days old! Created at Tue, 07 Oct 2025 05:18:31 +0200 +0s ... 0s

#5 composed specs +0.006s ... 0.006s

#6 did output specs +0s ... 0.006s

#7 getting avg benchmarks for device 14673 +0.004s ... 0.01s

#8 got single benchmarks 14673 +0.007s ... 0.016s

#9 getting avg benchmarks for device 17901 +0.004s ... 0.02s

#10 got single benchmarks 17901 +0.004s ... 0.024s

#11 got avg benchmarks for devices +0s ... 0.024s

#12 min, max, avg, median took s +0.045s ... 0.069s

#13 return log +0.008s ... 0.077s

Please share our article, every link counts!
Mail Logo
> Expert Reviews and News on Laptops, Smartphones and Tech Innovations > Benchmarks / Tech > Processor Comparison - Head 2 Head
Redaktion, 2017-09- 8 (Update: 2023-07- 1)