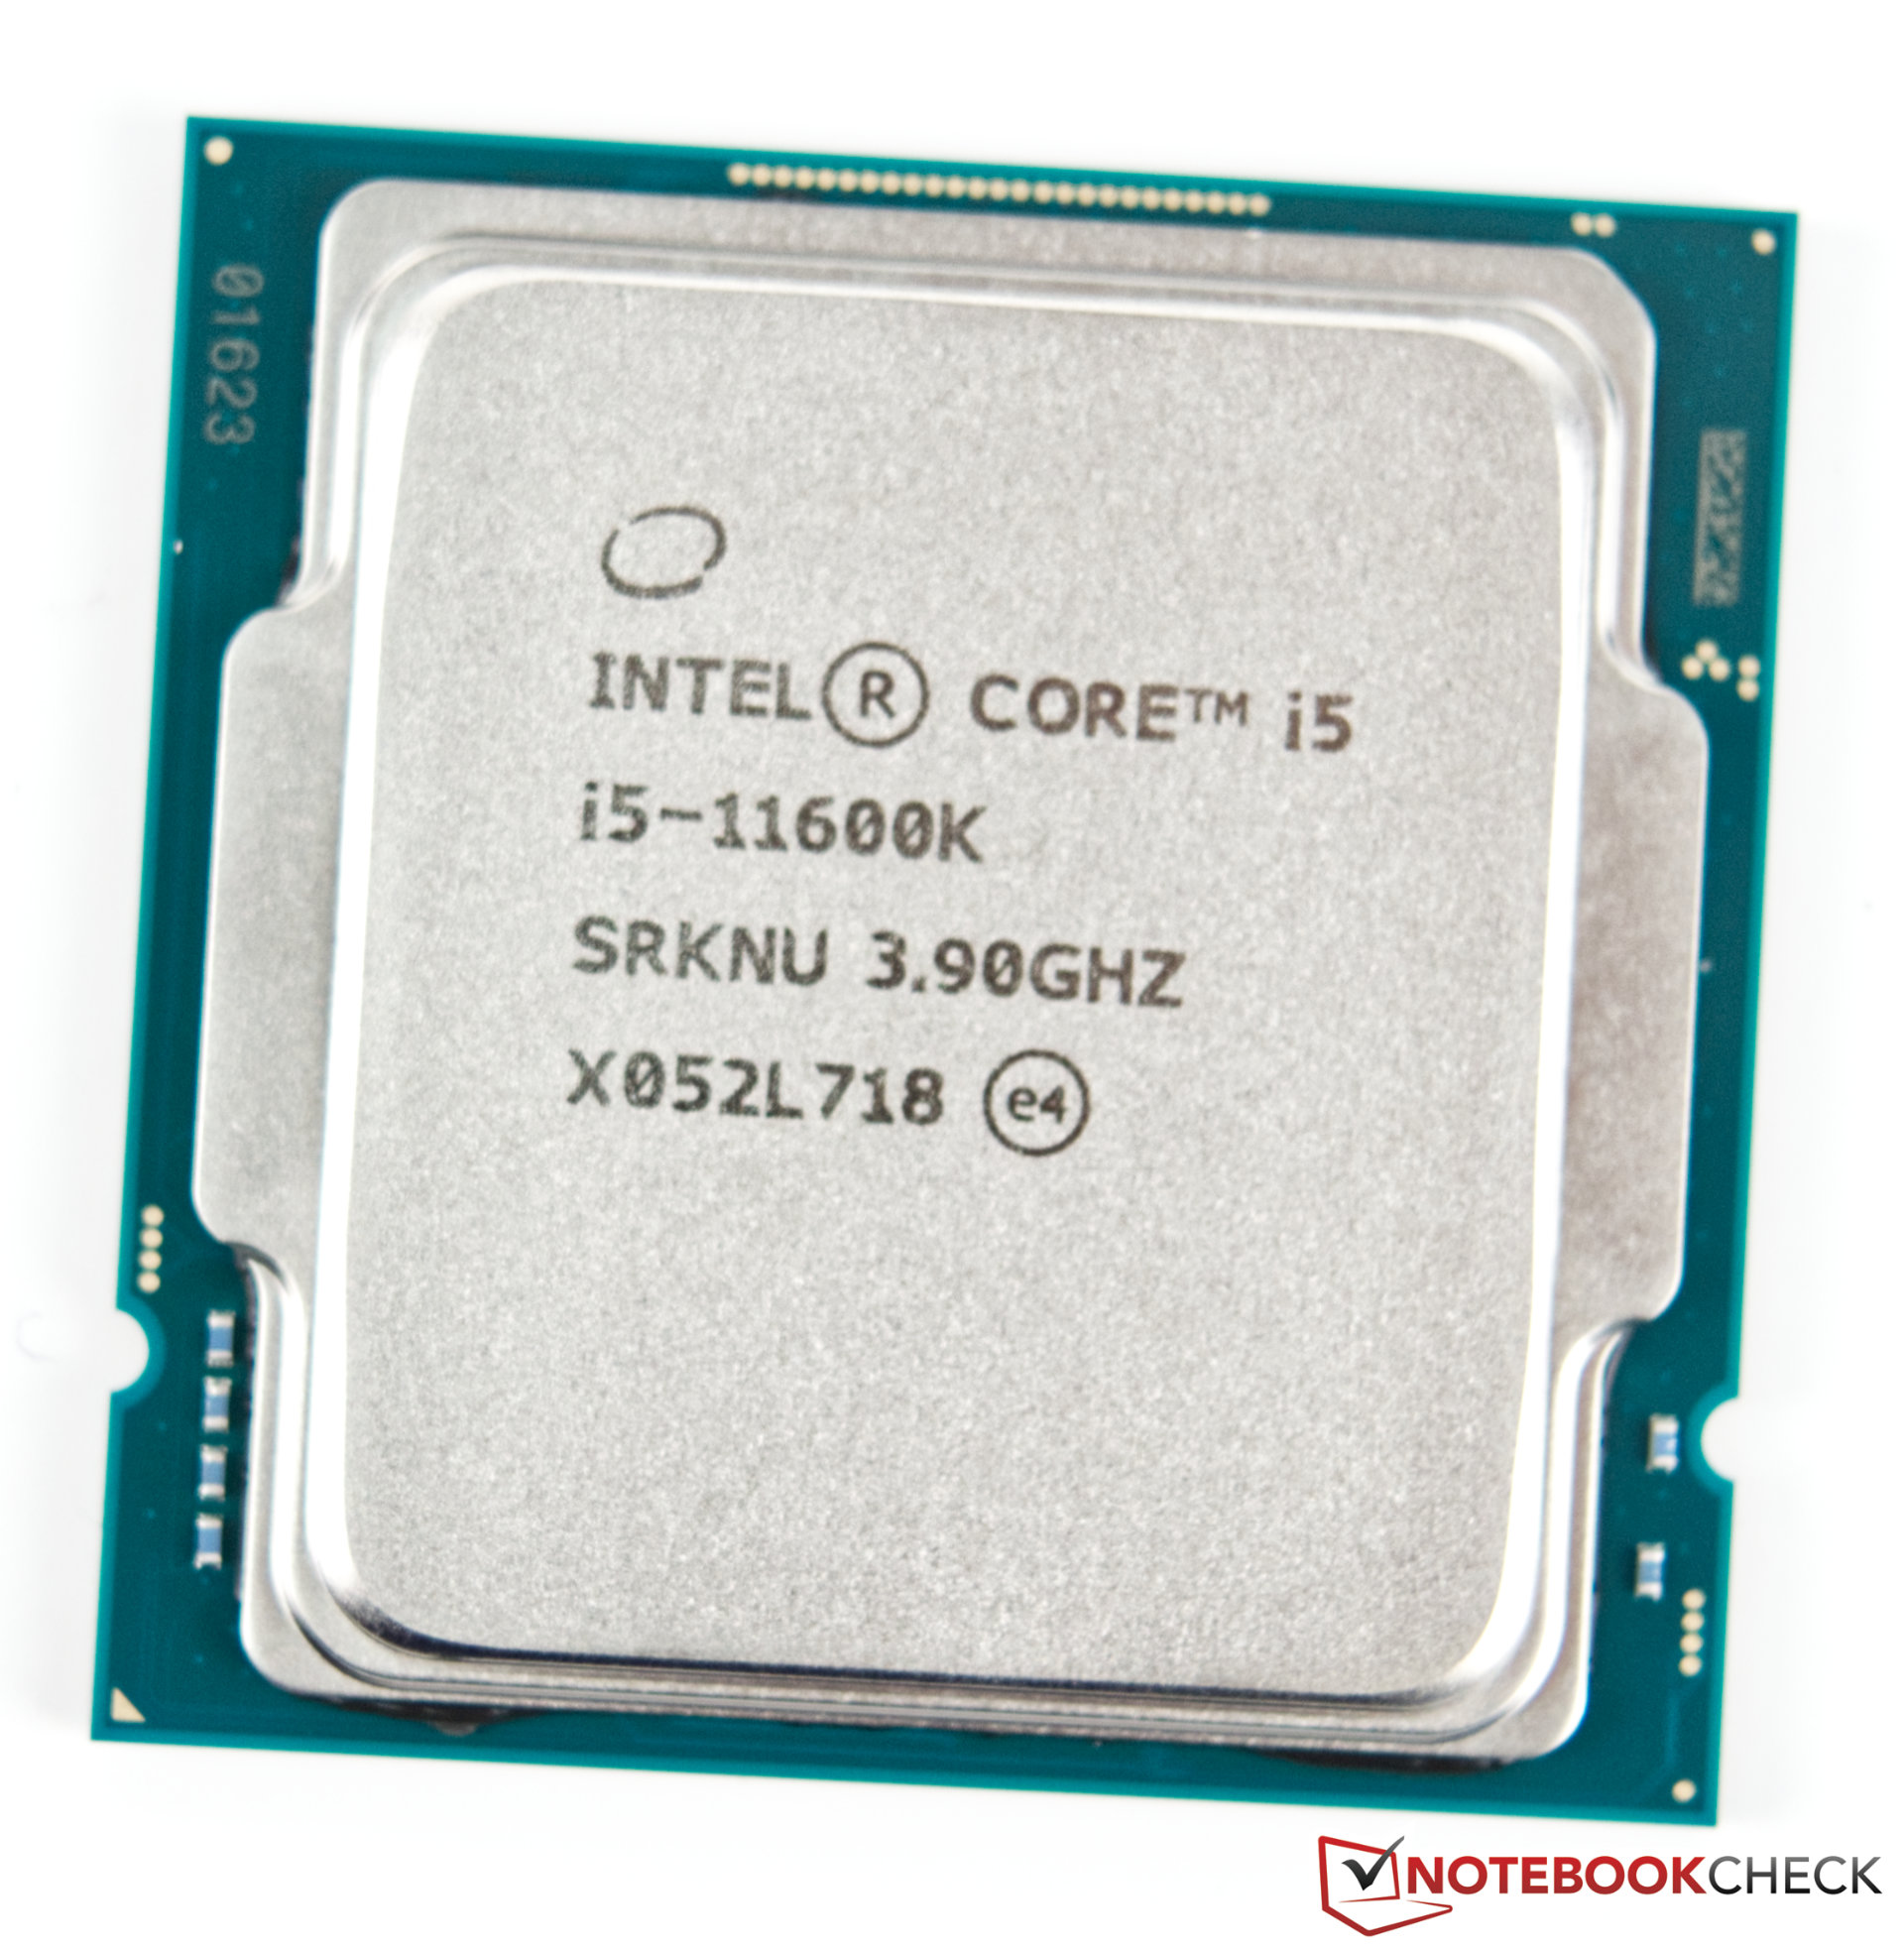
Intel Core i5-11600K ► remove from comparison The Intel Core i5-11600K is a high-end desktop CPU based on the Rocket Lake architecture. The CPU offers 6 cores and 12 threads clocked at 3.9 - 4.9 GHz (Turbo Boost 2.0 only). Using all cores, the CPU can clock up to 4.6 GHz.
The TDP is rated at 125 Watt (PL1, power limit sustained load) but the PL2 is set to around 250 Watt for short term boosts (up to 56 seconds).
The Sunny Cove processor cores (known from the Ice Lake mobile CPUs) offer larger caches and an improved IPC (up to 19%). Furthermore, the chip also includes (partly) integrated WiFi 6E and Thunderbolt 4. The platform supports PCIe 4.0 and Intel DL Boost for AI acceleration.
Thanks to the faster core architecture, the 11600K can beat the old i5-10600K by around 20 percent. Therefore, the i5-11600K is a good mid range choice for gaming.
The faster Rocket Lake-S CPUs also integrate a new Intel UHD Graphics 750 that is based on the current Intel Xe architecture (e.g. mobile Tiger Lake) and offers 32 EUs. In the 11600K, the GPU is clocked from 350 - 1300 MHz.
The CPU is manufactured on the old 14nm process like the Comet Lake predecessors. The power consumption is not as high, as the Core i9-11900K, but can't come close to the power efficient Ryzen 5 5600X.
Intel Core i5-13420H ► remove from comparison The Intel Core i5-13420H is a mid-range mobile CPU for laptops based on the Raptor Lake-H series (Alder Lake architecture). It was announced in early 2023 and offers 4 of the 6 performance cores (P-cores, Golden Cove architecture) and 4 of the 8 efficient cores (E-cores, Gracemont architecture). The P-cores support Hyper-Threading leading to 16 supported threads when combined with the E-cores. The clock rate ranges from 2.1 to 4.6 GHz (single core boost, all core up to 4.5 GHz) on the performance cluster and 1.5 to 3.4 GHz on the efficient cluster. The performance of the E-cores should be similar to old Skylake cores (compare to the Core i7-6700HQ ). All cores can use up to 12 MB L3 cache.
Performance
Thanks to the higher clock speeds of the improved Intel 7 process, the Core i5-13420H can surpass the old Core i5-12450H (e.g., + 200 MHz boost).
Features
The integrated memory controller supports various memory types up to DDR5-5200 (up from DDR5-4800 of the i5-12500H). The Thread Director (in hardware) can support the operating system to decide which thread to use on the performance or efficient cores for the best performance. For AI tasks, the CPU also integrates GNA 3.0 and DL Boost (via AVX2). Quick Sync in version 8 is the same as in the Rocket Lake CPUs and supports MPEG-2, AVC, VC-1 decode, JPEG, VP8 decode, VP9, HEVC, and AV1 decode in hardware. The CPU now supports PCIe 5.0 x8 for a GPU and two PCIe 4.0 x4 for SSDs.
The integrated graphics card is based on the Xe-architecture and offers 48 of the 96 EUs (Execution Units).
The CPU is rated at 45 W base power (115 W PL2) but most laptops will use a PL1 of around 60 Watt. The SoC is manufactured in a further improved 10nm process at Intel, which is known as Intel 7.
Model Intel Core i5-11600K Intel Core i5-13420H Codename Rocket Lake Raptor Lake-H Series Intel Rocket Lake Intel Raptor Lake-H Series: Raptor Lake-H Raptor Lake-H Clock 3900 - 4900 MHz 1500 - 4600 MHz L1 Cache 480 KB 704 KB L2 Cache 3 MB 8 MB L3 Cache 12 MB 12 MB Cores / Threads 6 / 12 8 / 12 TDP 125 Watt 45 Watt Technology 14 nm 10 nm max. Temp. 100 °C 100 °C Socket LGA1200 BGA1700 Features DDR4-3200 RAM, PCIe 4, 8 GT/s bus, DL Boost, GNA, vPro, MMX, SSE, SSE2, SSE3, SSSE3, SSE4.1, SSE4.2, AVX, AVX2, AVX-512, BMI2, ABM, FMA, ADX, VMX, SMEP, SMAP, MPX, EIST, TM1, TM2, HT, Turbo, SST, AES-NI, RDRAND, RDSEED, SHA Thread Director iGPU Intel UHD Graphics Xe 750 32EUs (Rocket Lake) (350 - 1300 MHz)Intel UHD Graphics Xe G4 48EUs ( - 1400 MHz)Architecture x86 x86 Announced Manufacturer ark.intel.com www.intel.com
Performance Rating - CB R15 + R20 + 7-Zip + X265 + Blender + 3DM11 CPU - i5-11600K
Performance Rating - CB R15 + R20 + 7-Zip + X265 + Blender + 3DM11 CPU - i5-13420H
Cinebench 2024 - Cinebench 2024 CPU Single Core
min: 95 avg: 99.2 median: 100 (50%) max: 102.7 Points
CPU TDP 28 W TDP 45 W TDP 115 W 100% 93% 97%
Cinebench 2024 - Cinebench 2024 CPU Multi Core
min: 450 avg: 498.7 median: 518 (10%) max: 528 Points
CPU TDP 28 W TDP 45 W TDP 115 W 85% 98% 100%
Cinebench R23 - Cinebench R23 Multi Core
min: 11124 avg: 11218 median: 11217.5 (10%) max: 11311 Points
CPU TDP ? TDP 251 W 98% 100%
min: 8691 avg: 10374 median: 10467.5 (10%) max: 11871 Points
CPU TDP ? TDP 28 W TDP 45 W TDP 115 W TDP 251 W 97% 76% 100% 86% 99%
Cinebench R23 - Cinebench R23 Single Core
min: 1500 avg: 1530 median: 1529.5 (62%) max: 1559 Points
CPU TDP ? TDP 251 W 96% 100%
min: 1673 avg: 1691 median: 1693 (69%) max: 1705 Points
CPU TDP ? TDP 28 W TDP 45 W TDP 115 W TDP 251 W 88% 100% 99% 98% 91%
Cinebench R20 - Cinebench R20 CPU (Single Core)
min: 576 avg: 586 median: 585.5 (64%) max: 595 Points
CPU TDP ? TDP 251 W 97% 100%
min: 641 avg: 649 median: 649.5 (71%) max: 655 Points
CPU TDP ? TDP 28 W TDP 45 W TDP 115 W TDP 251 W 88% 100% 99% 98% 91%
Cinebench R20 - Cinebench R20 CPU (Multi Core)
min: 4254 avg: 4302 median: 4301.5 (10%) max: 4349 Points
CPU TDP ? TDP 251 W 98% 100%
min: 3329 avg: 4079 median: 4231.5 (10%) max: 4524 Points
CPU TDP ? TDP 28 W TDP 45 W TDP 115 W TDP 251 W 97% 76% 100% 96% 99%
Cinebench R15 - Cinebench R15 CPU Multi 64 Bit
min: 1738 avg: 1744 median: 1744 (11%) max: 1750 Points
CPU TDP ? TDP 251 W 100% 99%
min: 1492 avg: 1679 median: 1704.5 (11%) max: 1815 Points
CPU TDP ? TDP 28 W TDP 45 W TDP 115 W TDP 251 W 99% 84% 100% 94% 98%
Cinebench R15 - Cinebench R15 CPU Single 64 Bit
min: 234 avg: 238 median: 238 (66%) max: 242 Points
CPU TDP ? TDP 251 W 97% 100%
min: 235 avg: 239.5 median: 239.5 (66%) max: 244 Points
CPU TDP ? TDP 28 W TDP 45 W TDP 115 W TDP 251 W 96% 100% 98% 97% 99%
Cinebench R11.5 - Cinebench R11.5 CPU Multi 64 Bit
Model CPU GPU RAM Value Intel Core i5-11600K i5-11600K 125 W / 251 W Titan RTX 1350 / 7000 MHz 24 GB 32 GB 19.32
min: 20.51 avg: 21 median: 21 (27%) max: 21.5 Points
CPU TDP 45 W TDP 115 W TDP 251 W 100% 95% 90%
Cinebench R11.5 - Cinebench R11.5 CPU Single 64 Bit
Model CPU GPU RAM Value Intel Core i5-11600K i5-11600K 125 W / 251 W Titan RTX 1350 / 7000 MHz 24 GB 32 GB 2.87
min: 2.93 avg: 2.9 median: 2.9 (70%) max: 2.94 Points
CPU TDP 45 W TDP 115 W TDP 251 W 100% 100% 98%
Cinebench R10 - Cinebench R10 Rend. Single (32bit)
Model CPU GPU RAM Value Intel Core i5-11600K i5-11600K 125 W / 251 W Titan RTX 1350 / 7000 MHz 24 GB 32 GB 9745
min: 9237 avg: 9270 median: 9269.5 (56%) max: 9302 Points
CPU TDP 45 W TDP 115 W TDP 251 W 95% 95% 100%
Cinebench R10 - Cinebench R10 Rend. Multi (32bit)
Model CPU GPU RAM Value Intel Core i5-11600K i5-11600K 125 W / 251 W Titan RTX 1350 / 7000 MHz 24 GB 32 GB 49408
min: 45040 avg: 46270 median: 46270 (34%) max: 47500 Points
CPU TDP 45 W TDP 115 W TDP 251 W 96% 91% 100%
Cinebench R10 - Cinebench R10 Rend. Multi (64bit)
Model CPU GPU RAM Value Intel Core i5-11600K i5-11600K 125 W / 251 W Titan RTX 1350 / 7000 MHz 24 GB 32 GB 64663
CPU TDP 115 W TDP 251 W 100% 92%
Cinebench R10 - Cinebench R10 Rend. Single (64bit)
Model CPU GPU RAM Value Intel Core i5-11600K i5-11600K 125 W / 251 W Titan RTX 1350 / 7000 MHz 24 GB 32 GB 12957
CPU TDP 115 W TDP 251 W 100% 95%
wPrime 2.10 - wPrime 2.0 1024m *
Model CPU GPU RAM Value Intel Core i5-11600K i5-11600K 125 W / 251 W Titan RTX 1350 / 7000 MHz 24 GB 32 GB 107.6
CPU TDP 115 W TDP 251 W 100% 105%
wPrime 2.10 - wPrime 2.0 32m *
Model CPU GPU RAM Value Intel Core i5-11600K i5-11600K 125 W / 251 W Titan RTX 1350 / 7000 MHz 24 GB 32 GB 4.919
CPU TDP 115 W TDP 251 W 100% 100%
WinRAR - WinRAR 4.0
Model CPU GPU RAM Value Intel Core i5-11600K i5-11600K 125 W / 251 W Titan RTX 1350 / 7000 MHz 24 GB 32 GB 7850
min: 5163 avg: 5541 median: 5541 (9%) max: 5919 Points
CPU TDP 45 W TDP 115 W TDP 251 W 75% 66% 100%
7-Zip 18.03 - 7-Zip 18.03 Multi Thread 4 runs
min: 44620 avg: 44971 median: 44971 (26%) max: 45322 MIPS
CPU TDP ? TDP 251 W 98% 100%
min: 35680 avg: 39427 median: 38528.5 (22%) max: 44970 MIPS
CPU TDP ? TDP 28 W TDP 45 W TDP 115 W TDP 251 W 98% 79% 94% 81% 100%
7-Zip 18.03 - 7-Zip 18.03 Single Thread 4 runs
min: 5987 avg: 6062 median: 6061.5 (71%) max: 6136 MIPS
CPU TDP ? TDP 251 W 98% 100%
min: 5003 avg: 5214 median: 5261.5 (62%) max: 5331 MIPS
CPU TDP ? TDP 28 W TDP 45 W TDP 115 W TDP 251 W 98% 87% 84% 85% 100%
X264 HD Benchmark 4.0 - x264 Pass 2
min: 100.5 avg: 100.8 median: 100.8 (3%) max: 101 fps
CPU TDP ? TDP 251 W 100% 100%
min: 98.75 avg: 105.5 median: 105.5 (3%) max: 112.2 fps
CPU TDP ? TDP 45 W TDP 115 W TDP 251 W 90% 100% 88% 90%
X264 HD Benchmark 4.0 - x264 Pass 1
min: 279 avg: 289 median: 289 (7%) max: 299 fps
CPU TDP ? TDP 251 W 93% 100%
min: 277 avg: 298.5 median: 298.5 (8%) max: 320 fps
CPU TDP ? TDP 45 W TDP 115 W TDP 251 W 87% 100% 87% 93%
HWBOT x265 Benchmark v2.2 - HWBOT x265 4k Preset
min: 14 avg: 14.4 median: 14.4 (25%) max: 14.7 fps
CPU TDP ? TDP 251 W 95% 100%
min: 8.75 avg: 11.5 median: 12 (21%) max: 13.3 fps
CPU TDP ? TDP 28 W TDP 45 W TDP 115 W TDP 251 W 95% 60% 86% 81% 100%
TrueCrypt - TrueCrypt Serpent
Model CPU GPU RAM Value Intel Core i5-11600K i5-11600K 125 W / 251 W Titan RTX 1350 / 7000 MHz 24 GB 32 GB 0.9
min: 0.89 avg: 0.9 median: 0.9 (27%) max: 0.919 GB/s
CPU TDP 45 W TDP 115 W TDP 251 W 97% 100% 98%
TrueCrypt - TrueCrypt Twofish
Model CPU GPU RAM Value Intel Core i5-11600K i5-11600K 125 W / 251 W Titan RTX 1350 / 7000 MHz 24 GB 32 GB 1.5
CPU TDP 45 W TDP 115 W TDP 251 W 100% 100% 88%
TrueCrypt - TrueCrypt AES
Model CPU GPU RAM Value Intel Core i5-11600K i5-11600K 125 W / 251 W Titan RTX 1350 / 7000 MHz 24 GB 32 GB 9.7
min: 8 avg: 8.8 median: 8.8 (23%) max: 9.6 GB/s
CPU TDP 45 W TDP 115 W TDP 251 W 99% 82% 100%
Blender - Blender 3.3 Classroom CPU *
min: 502 avg: 592 median: 554 (7%) max: 719 Seconds
CPU TDP 28 W TDP 45 W 100% 103%
Blender - Blender 2.79 BMW27 CPU *
min: 264.5 avg: 267.3 median: 267.3 (2%) max: 270 Seconds
CPU TDP ? TDP 251 W 100% 100%
min: 289 avg: 330.3 median: 314.5 (2%) max: 403 Seconds
CPU TDP ? TDP 28 W TDP 45 W TDP 115 W TDP 251 W 101% 100% 101% 101% 101%
R Benchmark 2.5 - R Benchmark 2.5 *
min: 0.506 avg: 0.5 median: 0.5 (11%) max: 0.528 sec
CPU TDP ? TDP 251 W 100% 101%
min: 0.501 avg: 0.5 median: 0.5 (11%) max: 0.545 sec
CPU TDP ? TDP 28 W TDP 45 W TDP 115 W TDP 251 W 100% 101% 100% 100% 101%
3DMark 06 - CPU - 3DMark 06 - CPU
min: 12802 avg: 13399 median: 13399 (29%) max: 13996 Points
CPU TDP ? TDP 45 W TDP 115 W 100% 96% 88%
Super Pi mod 1.5 XS 1M - Super Pi mod 1.5 XS 1M *
Model CPU GPU RAM Value Intel Core i5-11600K i5-11600K 125 W / 251 W Titan RTX 1350 / 7000 MHz 24 GB 32 GB 6.764
min: 7.455 avg: 7.6 median: 7.6 (2%) max: 7.8 s
CPU TDP 45 W TDP 115 W TDP 251 W 100% 100% 100%
Super Pi mod 1.5 XS 2M - Super Pi mod 1.5 XS 2M *
Model CPU GPU RAM Value Intel Core i5-11600K i5-11600K 125 W / 251 W Titan RTX 1350 / 7000 MHz 24 GB 32 GB 14.78
min: 16.5 avg: 16.7 median: 16.7 (1%) max: 16.823 s
CPU TDP 45 W TDP 115 W TDP 251 W 100% 100% 100%
Super Pi Mod 1.5 XS 32M - Super Pi mod 1.5 XS 32M *
Model CPU GPU RAM Value Intel Core i5-11600K i5-11600K 125 W / 251 W Titan RTX 1350 / 7000 MHz 24 GB 32 GB 353.7
CPU TDP 45 W TDP 251 W 100% 100%
3DMark Vantage - 3DM Vant. Perf. CPU no Physx
min: 54081 avg: 55301 median: 55301 (42%) max: 56521 Points
CPU TDP 45 W TDP 115 W 96% 100%
3DMark 11 - 3DM11 Performance Physics
min: 15381 avg: 16381 median: 16381 (40%) max: 17381 Points
CPU TDP ? TDP 251 W 88% 100%
min: 12080 avg: 15062 median: 16205 (40%) max: 17616 Points
CPU TDP ? TDP 28 W TDP 45 W TDP 115 W TDP 251 W 88% 93% 90% 70% 100%
3DMark - 3DMark Ice Storm Physics
min: 70567 avg: 75640 median: 75640 (61%) max: 80713 Points
CPU TDP ? TDP 251 W 87% 100%
min: 81932 avg: 87240 median: 84220 (68%) max: 95567 Points
CPU TDP ? TDP 45 W TDP 115 W TDP 251 W 79% 100% 91% 90%
3DMark - 3DMark Ice Storm Extreme Physics
Model CPU GPU RAM Value Intel Core i5-11600K i5-11600K 125 W / 251 W Titan RTX 1350 / 7000 MHz 24 GB 32 GB 79747
min: 81026 avg: 82286 median: 82285.5 (67%) max: 83545 Points
CPU TDP 45 W TDP 115 W TDP 251 W 97% 100% 95%
3DMark - 3DMark Ice Storm Unlimited Physics
Model CPU GPU RAM Value Intel Core i5-11600K i5-11600K 125 W / 251 W Titan RTX 1350 / 7000 MHz 24 GB 32 GB 81270
min: 87499 avg: 88702 median: 88701.5 (71%) max: 89904 Points
CPU TDP 45 W TDP 115 W TDP 251 W 97% 100% 90%
3DMark - 3DMark Cloud Gate Physics
min: 14147 avg: 14403 median: 14402.5 (36%) max: 14658 Points
CPU TDP ? TDP 251 W 97% 100%
min: 12495 avg: 14547 median: 14865.5 (38%) max: 15963 Points
CPU TDP ? TDP 45 W TDP 115 W TDP 251 W 96% 100% 96% 100%
3DMark - 3DMark Fire Strike Standard Physics
min: 21677 avg: 22154 median: 22154 (39%) max: 22631 Points
CPU TDP ? TDP 251 W 96% 100%
min: 18374 avg: 21341 median: 21338 (38%) max: 23877 Points
CPU TDP ? TDP 28 W TDP 45 W TDP 115 W TDP 251 W 96% 88% 97% 94% 100%
3DMark - 3DMark Time Spy CPU
min: 8286 avg: 8884 median: 8884 (37%) max: 9482 Points
CPU TDP ? TDP 251 W 87% 100%
min: 5527 avg: 7177 median: 7038 (30%) max: 8748 Points
CPU TDP ? TDP 28 W TDP 45 W TDP 115 W TDP 251 W 87% 63% 86% 58% 100%
Geekbench 6.5 - Geekbench 6.5 Single-Core
Model CPU GPU RAM Value ASUS PRIME Z590-P i5-11600K 15.5 GB 2284
min: 2231 avg: 2292 median: 2286 (53%) max: 2365 Points
CPU TDP ? TDP 28 W TDP 45 W TDP 115 W 97% 100% 96% 95%
Geekbench 6.5 - Geekbench 6.5 Multi-Core
Model CPU GPU RAM Value ASUS PRIME Z590-P i5-11600K 15.5 GB 9480
min: 7216 avg: 8541 median: 8842.5 (34%) max: 9262 Points
CPU TDP ? TDP 28 W TDP 45 W TDP 115 W 100% 98% 93% 76%
Geekbench 5.5 - Geekbench 5.1 - 5.5 64 Bit Single-Core
min: 1694 avg: 1723 median: 1723 (58%) max: 1752 Points
CPU TDP ? TDP 251 W 97% 100%
min: 1583 avg: 1631 median: 1635 (55%) max: 1669 Points
CPU TDP ? TDP 28 W TDP 45 W TDP 115 W TDP 251 W 97% 95% 93% 92% 100%
Geekbench 5.5 - Geekbench 5.1 - 5.5 64 Bit Multi-Core
min: 8336 avg: 8430 median: 8429.5 (15%) max: 8523 Points
CPU TDP ? TDP 251 W 98% 100%
min: 6895 avg: 7742 median: 7868 (14%) max: 8336 Points
CPU TDP ? TDP 28 W TDP 45 W TDP 115 W TDP 251 W 98% 93% 95% 81% 100%
Geekbench 5.0 - Geekbench 5.0 64 Bit Single-Core
Model CPU GPU RAM Value Intel Core i5-11600K i5-11600K 125 W / 251 W Titan RTX 1350 / 7000 MHz 24 GB 32 GB 1731
CPU TDP 115 W TDP 251 W 91% 100%
Geekbench 5.0 - Geekbench 5.0 64 Bit Multi-Core
Model CPU GPU RAM Value Intel Core i5-11600K i5-11600K 125 W / 251 W Titan RTX 1350 / 7000 MHz 24 GB 32 GB 8542
CPU TDP 115 W TDP 251 W 80% 100%
Geekbench 4.4 - Geekbench 4.1 - 4.4 64 Bit Single-Core
Model CPU GPU RAM Value Intel Core i5-11600K i5-11600K 125 W / 251 W Titan RTX 1350 / 7000 MHz 24 GB 32 GB 7438
CPU TDP 115 W TDP 251 W 93% 100%
Geekbench 4.4 - Geekbench 4.1 - 4.4 64 Bit Multi-Core
Model CPU GPU RAM Value Intel Core i5-11600K i5-11600K 125 W / 251 W Titan RTX 1350 / 7000 MHz 24 GB 32 GB 33266
CPU TDP 115 W TDP 251 W 86% 100%
Geekbench 4.0 - Geekbench 4.0 64 Bit Single-Core
Geekbench 4.0 - Geekbench 4.0 64 Bit Multi-Core
Mozilla Kraken 1.1 - Kraken 1.1 Total Score *
min: 587 avg: 598 median: 597.5 (1%) max: 608 ms
CPU TDP ? TDP 251 W 100% 100%
min: 546 avg: 564 median: 566.5 (1%) max: 577 ms
CPU TDP ? TDP 28 W TDP 45 W TDP 115 W TDP 251 W 100% 100% 100% 100% 100%
WebXPRT 4 - WebXPRT 4 Score
min: 226 avg: 238 median: 237.5 (62%) max: 251 Points
CPU TDP 28 W TDP 45 W TDP 115 W 100% 92% 94%
WebXPRT 3 - WebXPRT 3 Score
min: 263 avg: 271.5 median: 271.5 (49%) max: 280 Points
CPU TDP ? TDP 251 W 94% 100%
min: 247 avg: 257.8 median: 258.5 (46%) max: 267 Points
CPU TDP ? TDP 28 W TDP 45 W TDP 115 W TDP 251 W 94% 95% 91% 91% 100%
CrossMark - CrossMark Overall
min: 1366 avg: 1458 median: 1470 (55%) max: 1538 Points
CPU TDP ? TDP 28 W TDP 45 W TDP 115 W 100% 93% 83% 89%
Power Consumption - Prime95 Power Consumption - external Monitor *
min: 187 avg: 204.7 median: 199 (34%) max: 228 Watt
CPU TDP ? TDP 251 W 110% 100%
min: 43.7 avg: 59.5 median: 59.9 (10%) max: 74.4 Watt
CPU TDP ? TDP 28 W TDP 45 W TDP 115 W TDP 251 W 110% 152% 148% 144% 100%
Power Consumption - Cinebench R15 Multi Power Consumption - external Monitor *
min: 177 avg: 195.3 median: 189 (34%) max: 219.9 Watt
CPU TDP ? TDP 251 W 111% 100%
min: 61.2 avg: 81.3 median: 81.3 (15%) max: 101.4 Watt
CPU TDP ? TDP 28 W TDP 115 W TDP 251 W 111% 148% 136% 100%
Power Consumption - Idle Power Consumption - external Monitor *
min: 6.12 avg: 11.8 median: 12.2 (8%) max: 16.6 Watt
CPU TDP 28 W TDP 45 W TDP 115 W 106% 100% 101%
Power Consumption - Idle Power Consumption 150cd 1min *
min: 6.57 avg: 8.2 median: 8.2 (6%) max: 9.88 Watt
CPU TDP 28 W TDP 45 W 102% 100%
Power Consumption - Power Efficiency - Cinebench R15 Multi external Monitor
min: 7.9 avg: 8.9 median: 8.9 (7%) max: 9.89 Points per Watt
CPU TDP ? TDP 251 W 100% 80%
min: 16.5 avg: 20.5 median: 20.5 (15%) max: 24.4 Points per Watt
CPU TDP ? TDP 28 W TDP 115 W TDP 251 W 41% 100% 68% 32%
Average Benchmarks Intel Core i5-11600K → 100% n=47 Average Benchmarks Intel Core i5-13420H → 94% n=47
- Range of benchmark values for this graphics card
- Average benchmark values for this graphics card
* Smaller numbers mean a higher performance
1 This benchmark is not used for the average calculation
log 15. 00:33:23
#0 ran 0s before starting gpusingle class +0s ... 0s
#1 checking url part for id 13163 +0s ... 0s
#2 checking url part for id 14729 +0s ... 0s
#3 redirected to Ajax server, took 1765755203s time from redirect:0 +0s ... 0s
#4 did not recreate cache, as it is less than 5 days old! Created at Sun, 14 Dec 2025 14:22:43 +0100 +0s ... 0s
#5 composed specs +0.004s ... 0.004s
#6 did output specs +0s ... 0.004s
#7 getting avg benchmarks for device 13163 +0.004s ... 0.008s
#8 got single benchmarks 13163 +0.006s ... 0.014s
#9 getting avg benchmarks for device 14729 +0.004s ... 0.018s
#10 got single benchmarks 14729 +0.013s ... 0.03s
#11 got avg benchmarks for devices +0s ... 0.03s
#12 min, max, avg, median took s +0.048s ... 0.078s
#13 return log +0.002s ... 0.081s