Verdict — Older Ryzen 7 Performs Like A Core i3
This laptop was designed for users who are satisfied with Core i3-level of performance. The Ryzen 7 5700U is severely underclocked on the VigoBook G7 and the sluggishness is a bit noticeable when opening common applications like browsers or Office. Other aspects like the webcam and speakers are of very poor quality even relative to other budget models like the HP Pavilion.
More positive aspects include the IPS display and port options considering the price. Build quality also appears decent, but we can't speak for its longevity at the time of writing. Other models in this price category like the HP 250 G9 may come with even less RAM and slower graphics performance in comparison to our Thinkeagle.
Pros
Cons
Potential Competitors in Comparison
Image | Model / Review | Price | Weight | Height | Display |
|---|---|---|---|---|---|
1. 69.9%  | Thinkeagle VigoBook G7 AMD Ryzen 7 5700U ⎘ AMD Radeon RX Vega 8 (Ryzen 4000/5000) ⎘ 16 GB Memory | Amazon: List Price: 500 USD | 1.7 kg | 17.5 mm | 15.60" 1920x1080 141 PPI IPS |
2. 83.6% v7 (old)  | Ninkear A15 Plus (16+512) AMD Ryzen 7 5700U ⎘ AMD Radeon RX Vega 8 (Ryzen 4000/5000) ⎘ 16 GB Memory, 512 GB SSD | Amazon: List Price: 649.15 Euro | 1.8 kg | 18.2 mm | 15.60" 1920x1080 141 PPI IPS |
3. 87.6% v7 (old)  | Acer Aspire Vero AV15-53P Intel Core i7-1355U ⎘ Intel Iris Xe Graphics G7 96EUs ⎘ 16 GB Memory, 512 GB SSD | Amazon: List Price: 949€ | 1.8 kg | 17.78 mm | 15.60" 1920x1080 141 PPI IPS |
4. 75.2% v7 (old)  | HP 250 G9 7N029ES Intel Core i3-1215U ⎘ Intel UHD Graphics 64EUs (Alder Lake 12th Gen) ⎘ 8 GB Memory, 512 GB SSD | Amazon: List Price: 440€ | 1.7 kg | 19.9 mm | 15.60" 1920x1080 141 PPI IPS |
5. 82.1% v7 (old)  | Lenovo IdeaPad 3 15ABA7 AMD Ryzen 5 5625U ⎘ AMD Radeon RX Vega 7 ⎘ 16 GB Memory, 512 GB SSD | Amazon: 1. $589.00 Lenovo IdeaPad Slim 3 Laptop... 2. $599.99 Lenovo IdeaPad Slim 3, 15.6 ... 3. $509.99 Lenovo IdeaPad Slim 3 15.6" ... List Price: 799 Euro | 1.6 kg | 19.9 mm | 15.60" 1920x1080 141 PPI IPS |
6. 84.6% v7 (old) 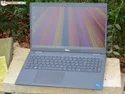 | Dell Latitude 3520 Intel Core i5-1135G7 ⎘ Intel Iris Xe Graphics G7 80EUs ⎘ 8 GB Memory, 512 GB SSD | Amazon: 1. $337.69 Dell Latitude 3520 Laptop 15... 2. $689.95 Dell Business Laptop Latitud... 3. $339.99 Dell Latitude 3520 15.6" FHD... List Price: 899 Euro | 1.8 kg | 18.06 mm | 15.60" 1920x1080 141 PPI IPS |
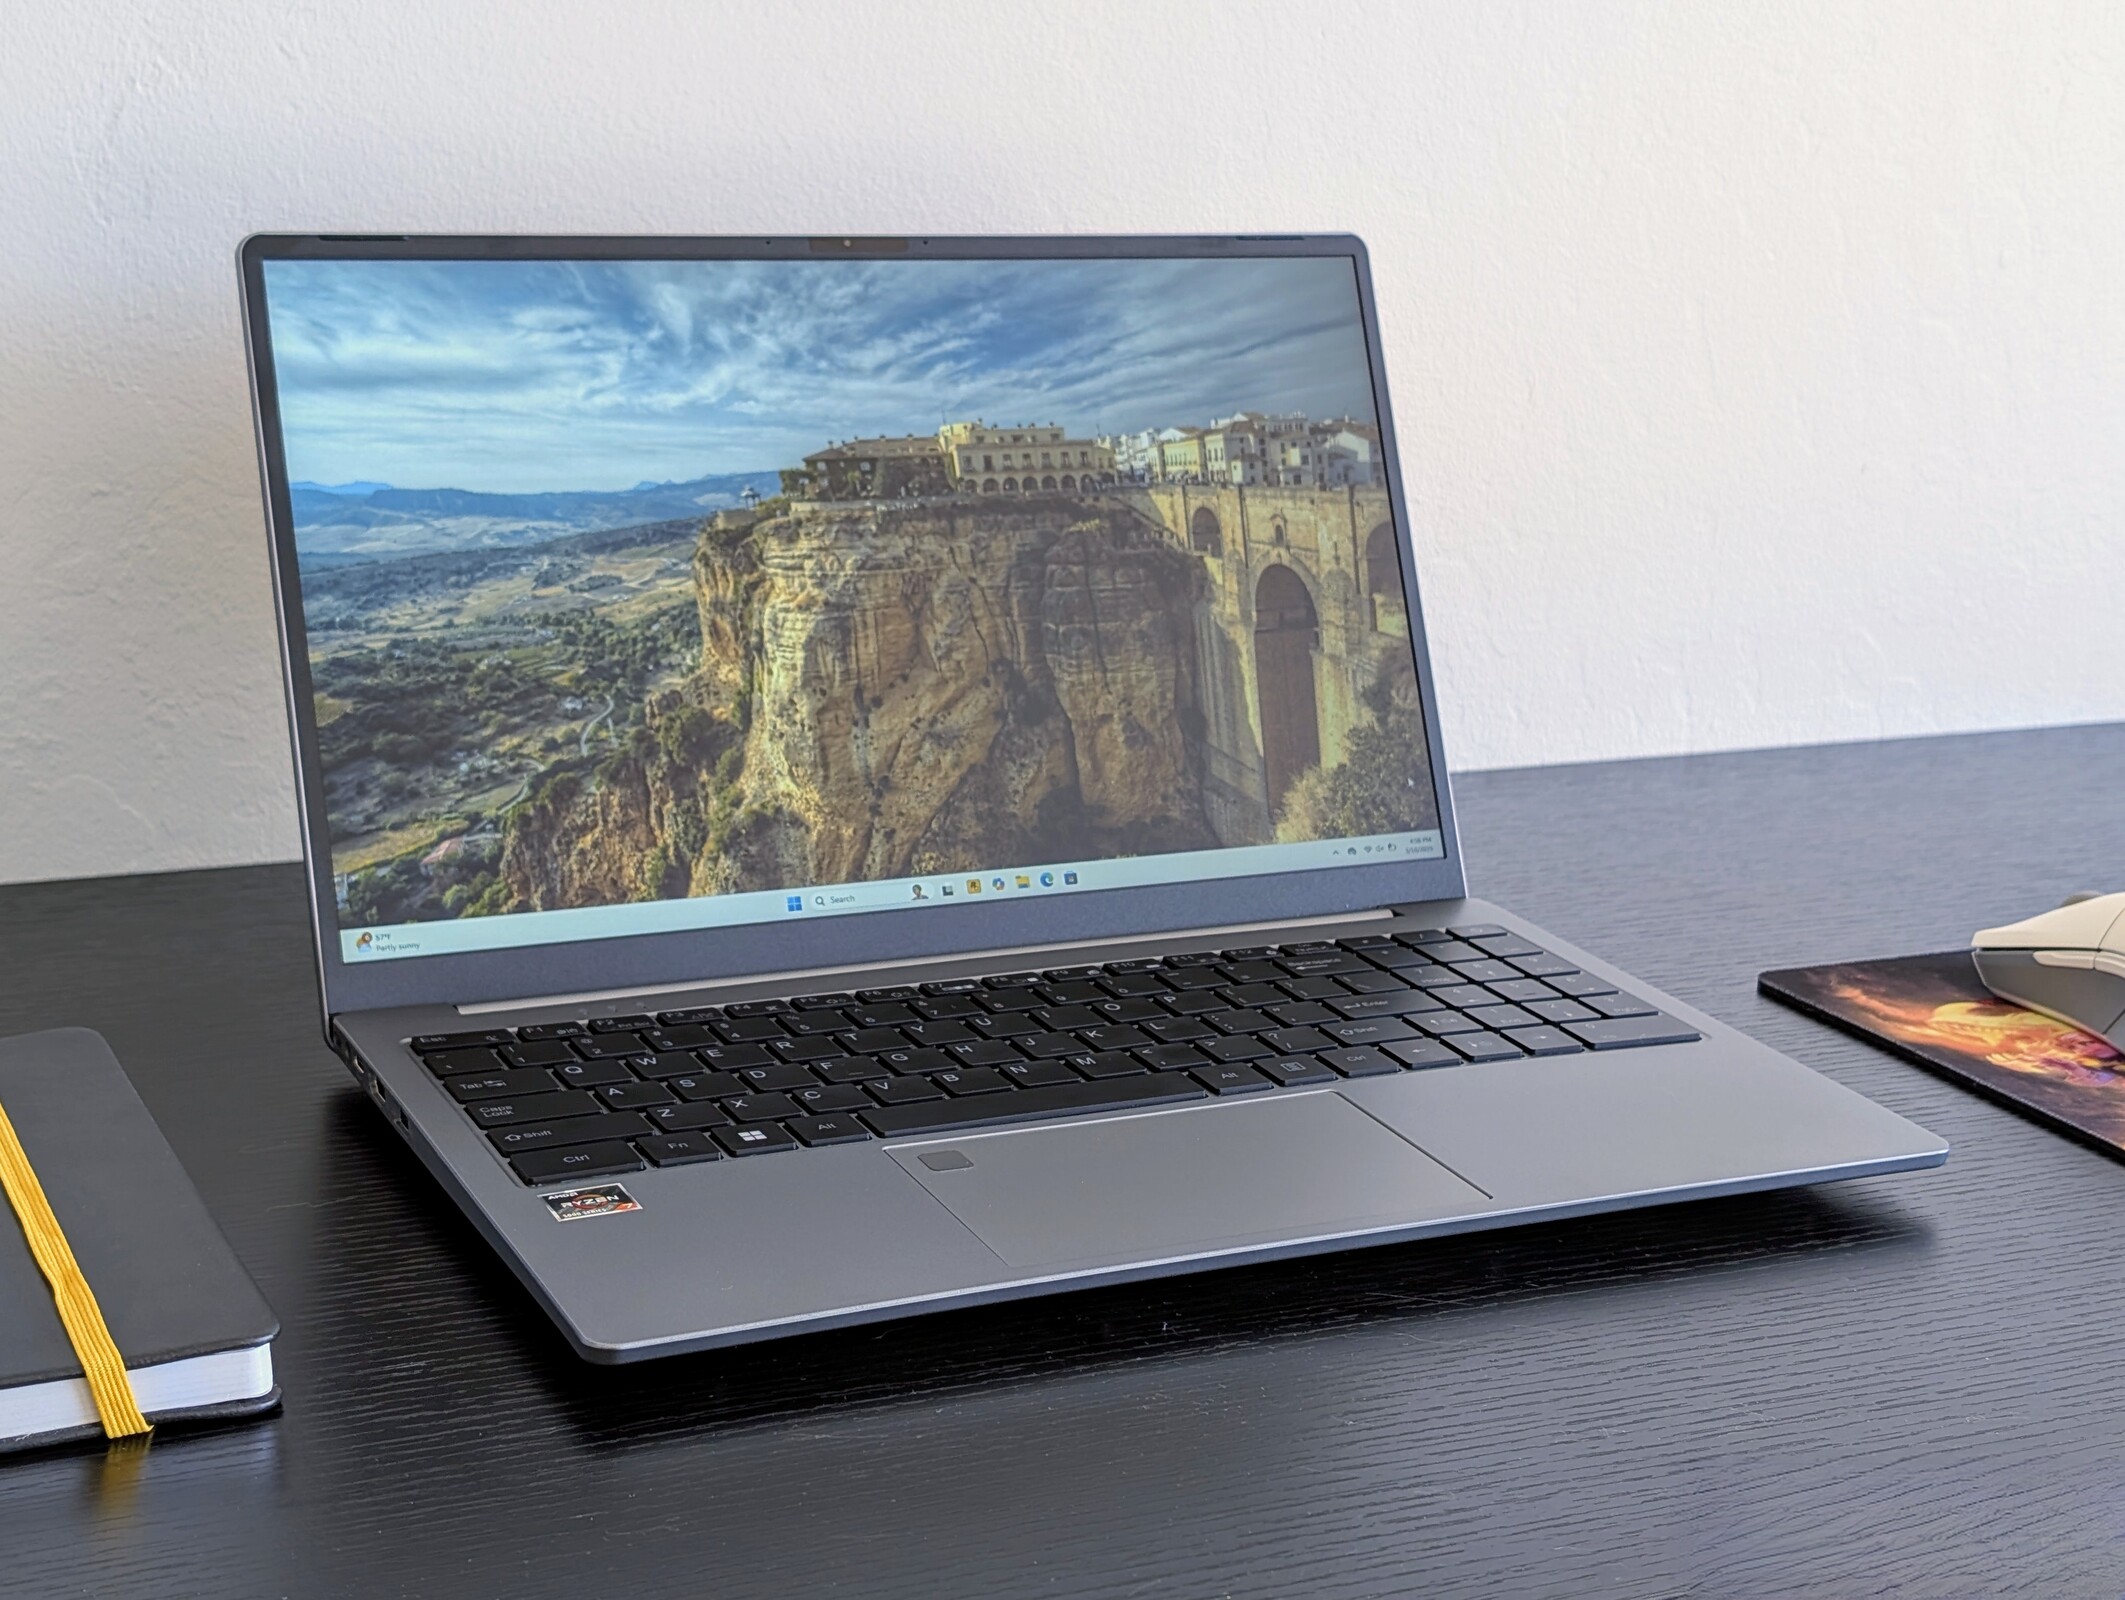
The Thinkeagle VigoBook G7 is budget multimedia laptop equipped with older AMD Zen 2 hardware to keep prices lower than most alternatives. Our unit comes with the Ryzen 7 5700U CPU, 1080p IPS display, 512 GB SSD, and 16 GB of RAM for approximately $500 USD.
Alternatives to the VigoBook G7 include other inexpensive models like the HP Pavilion series, Lenovo IdeaPad 1 or IdeaPad 3 series, or the Dell Inspiron series.
Specifications
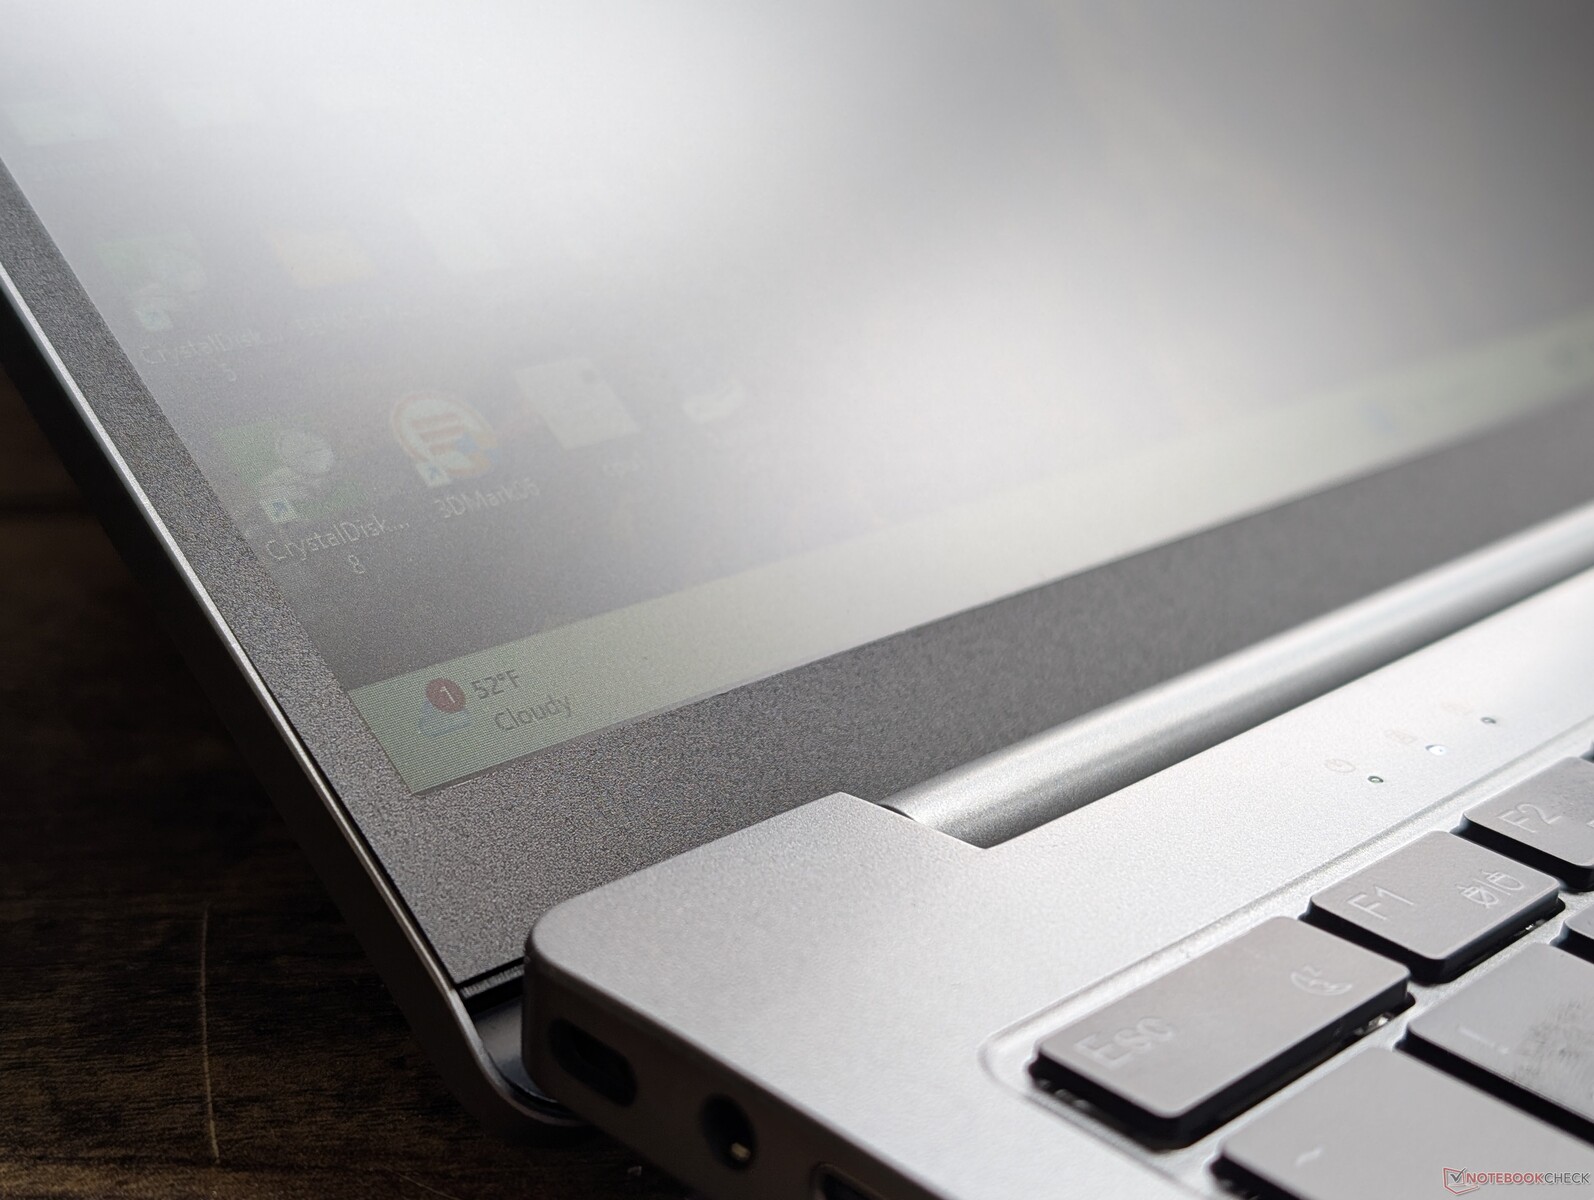
Case
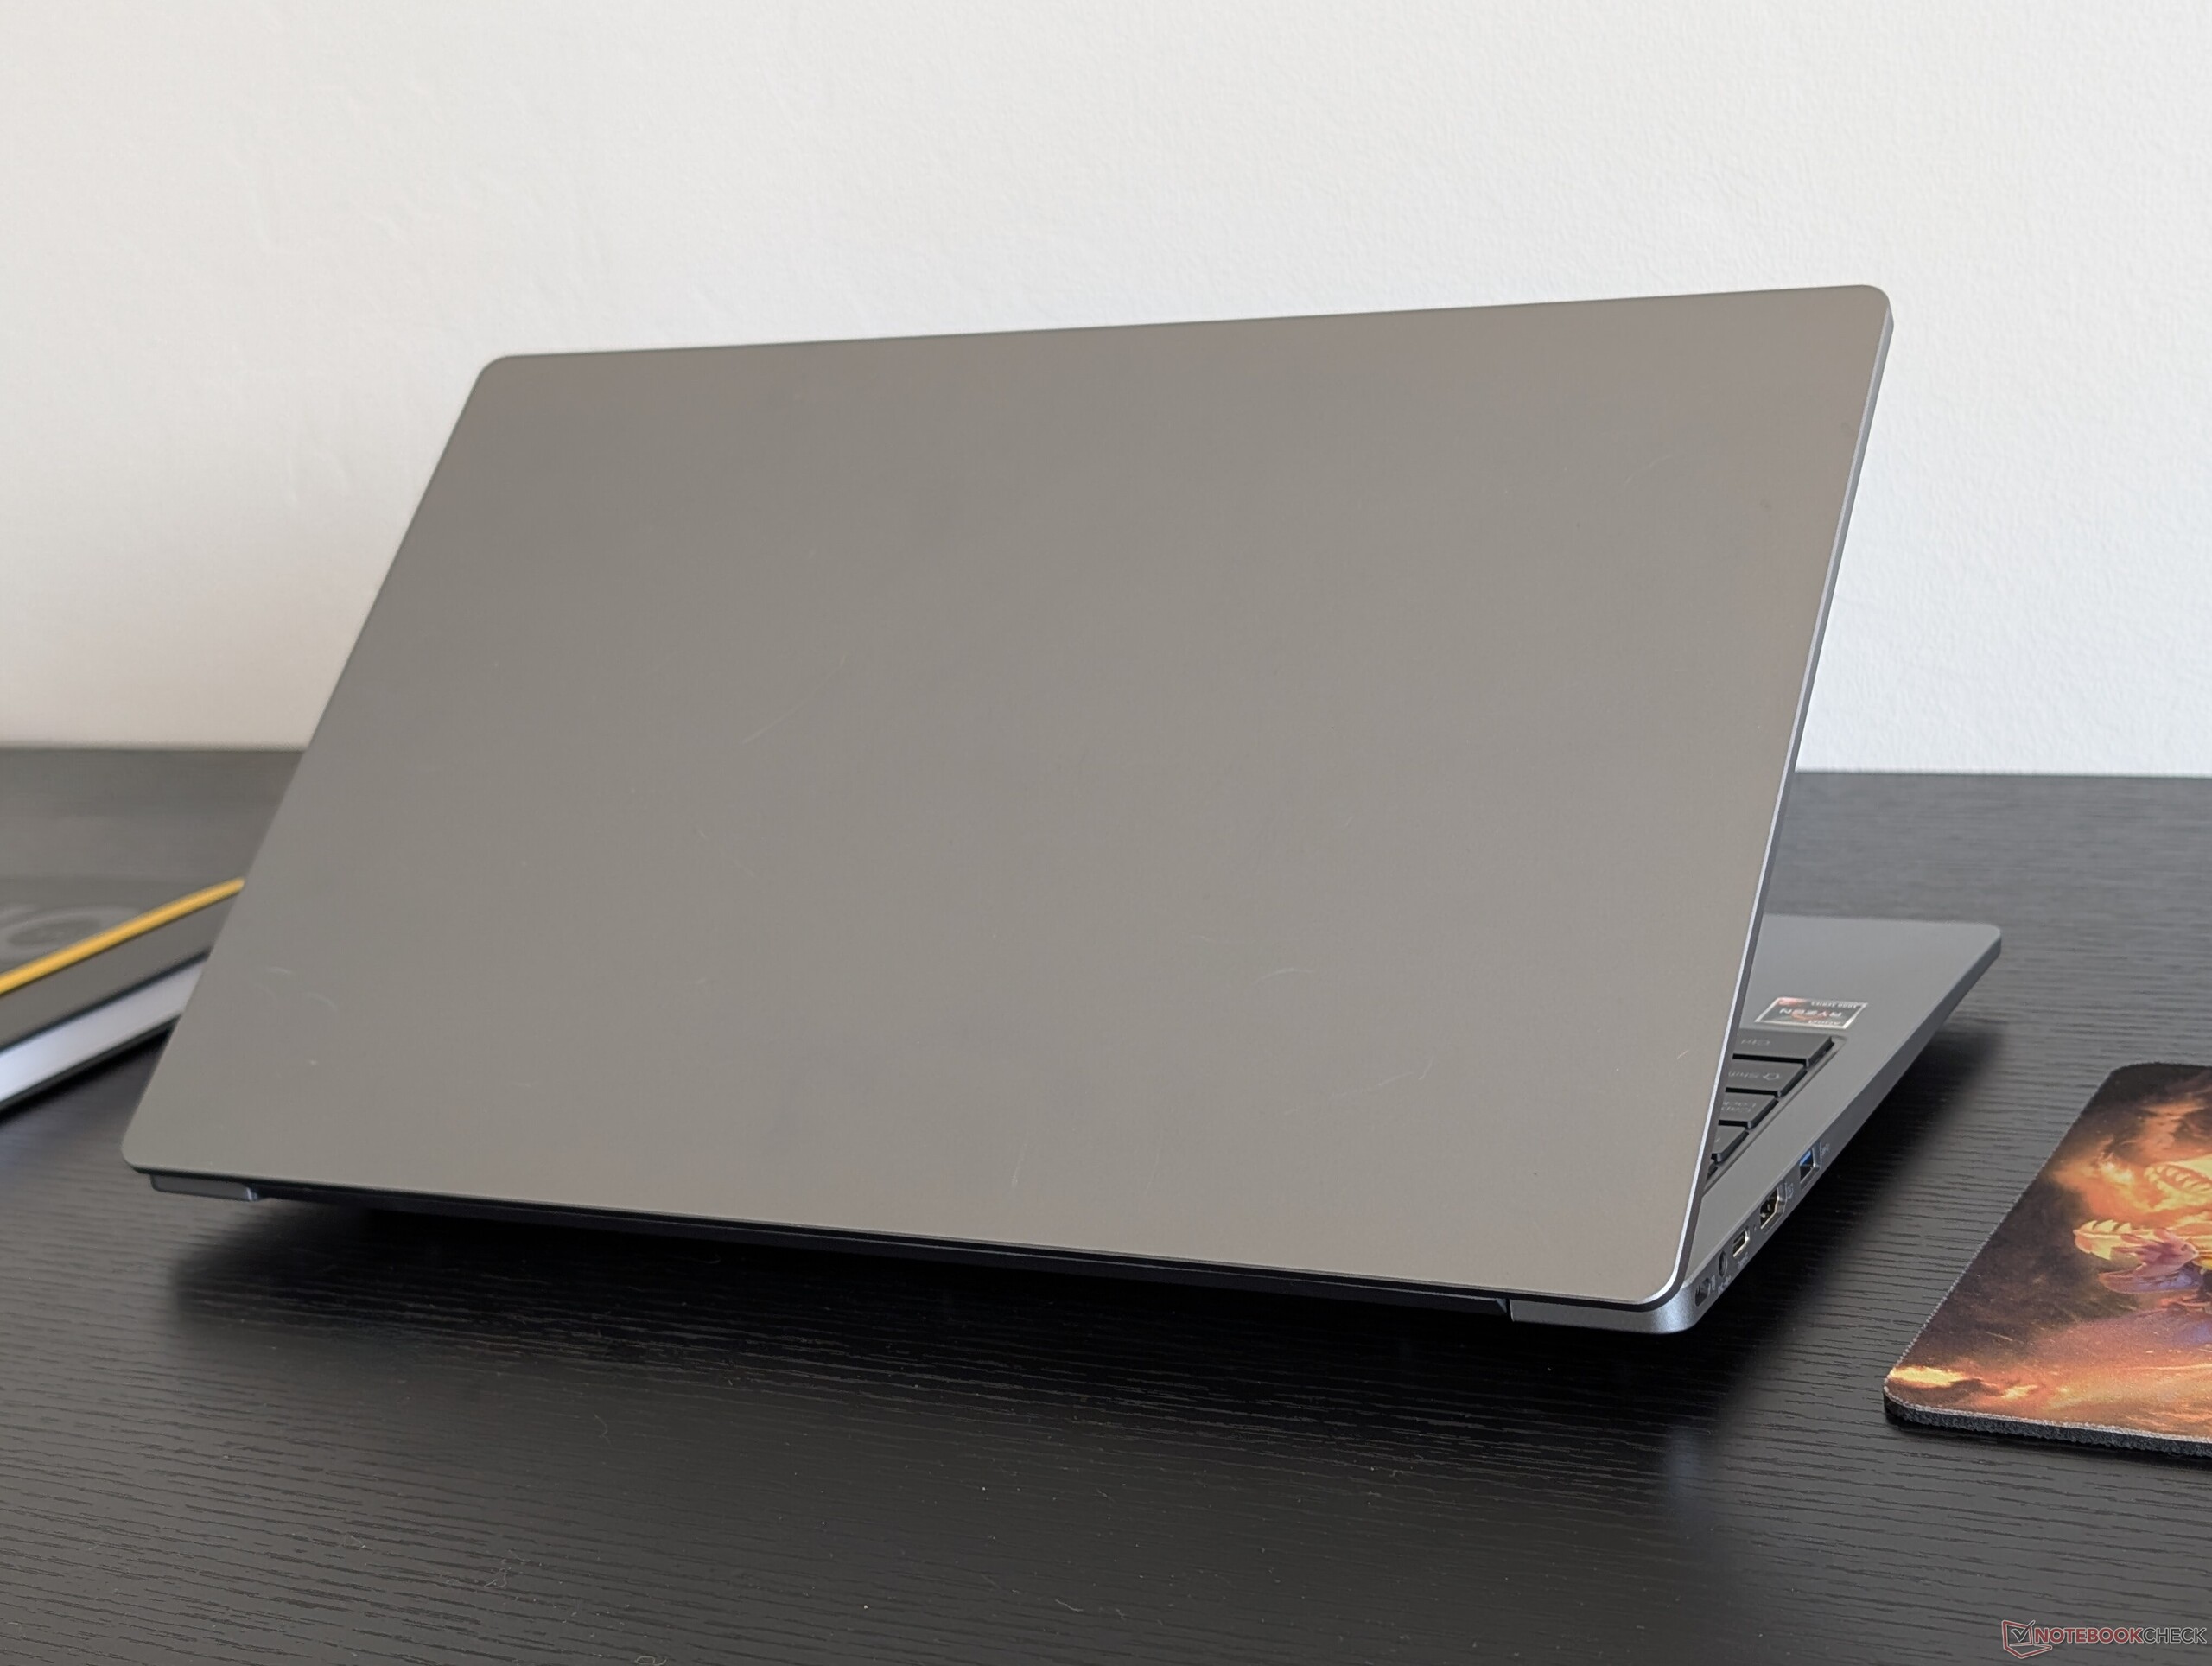
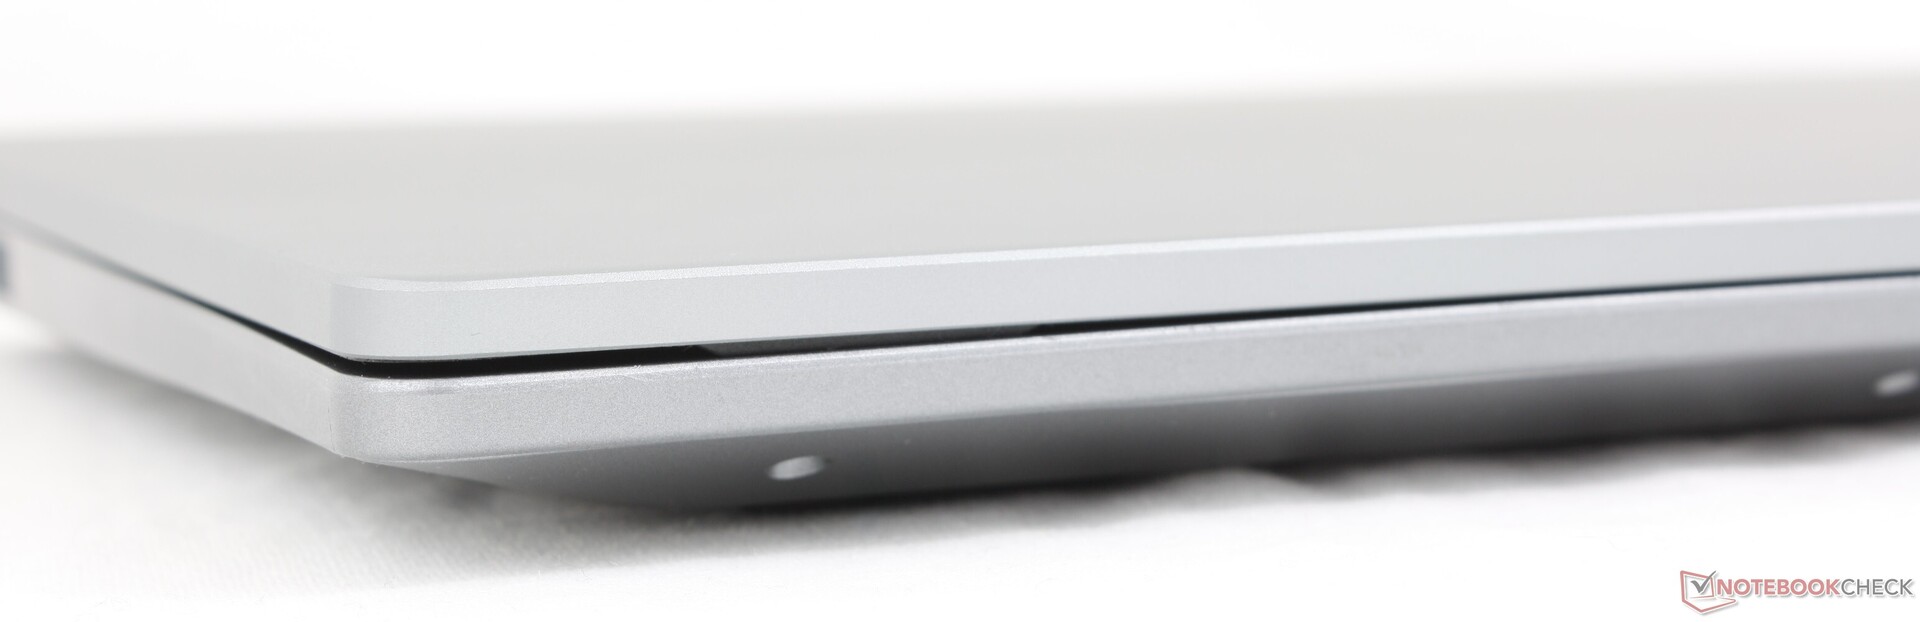
The chassis has a metal outer lid but with a plastic base which is a common approach for cheaper designs.
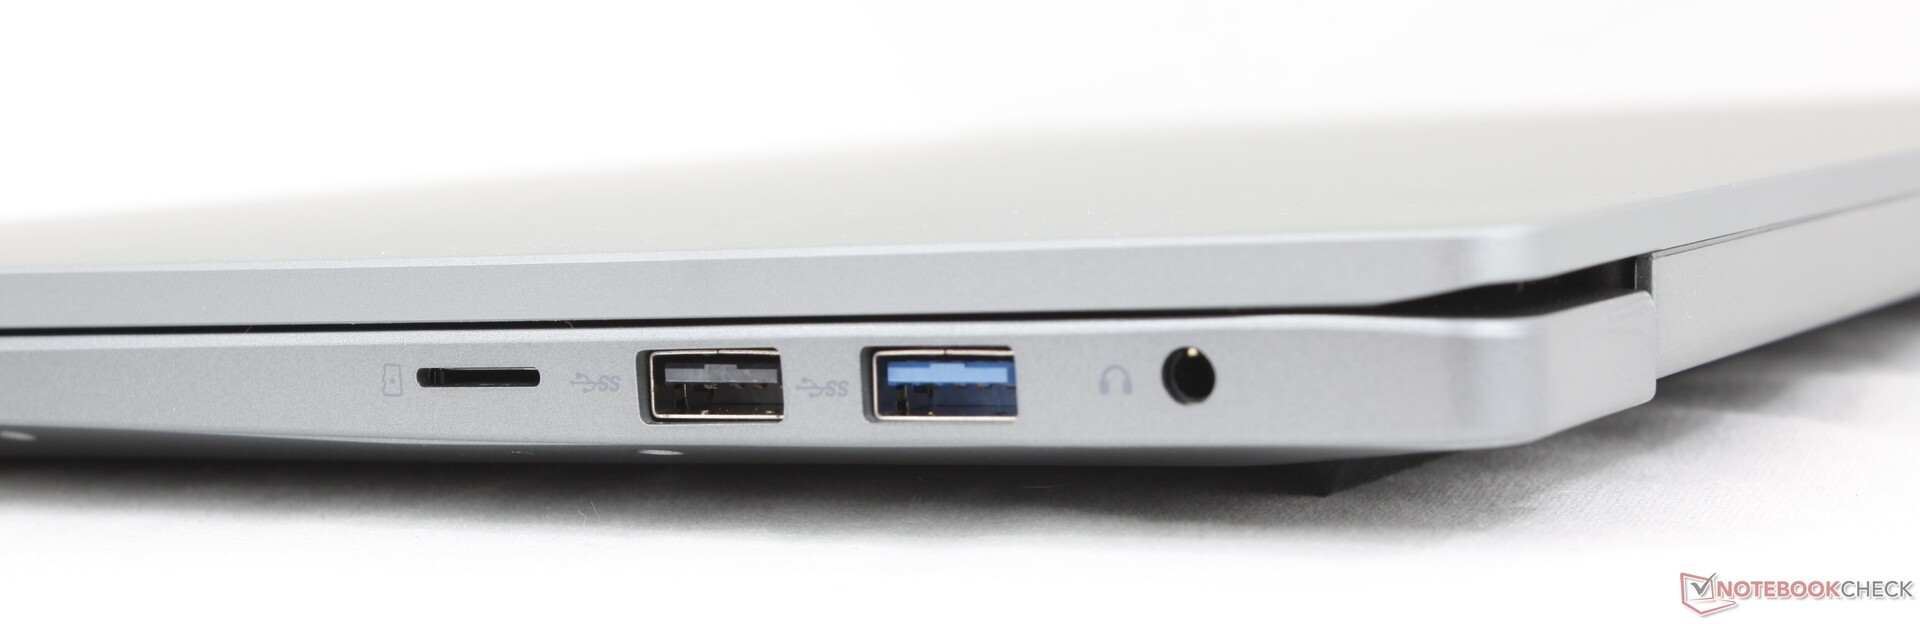
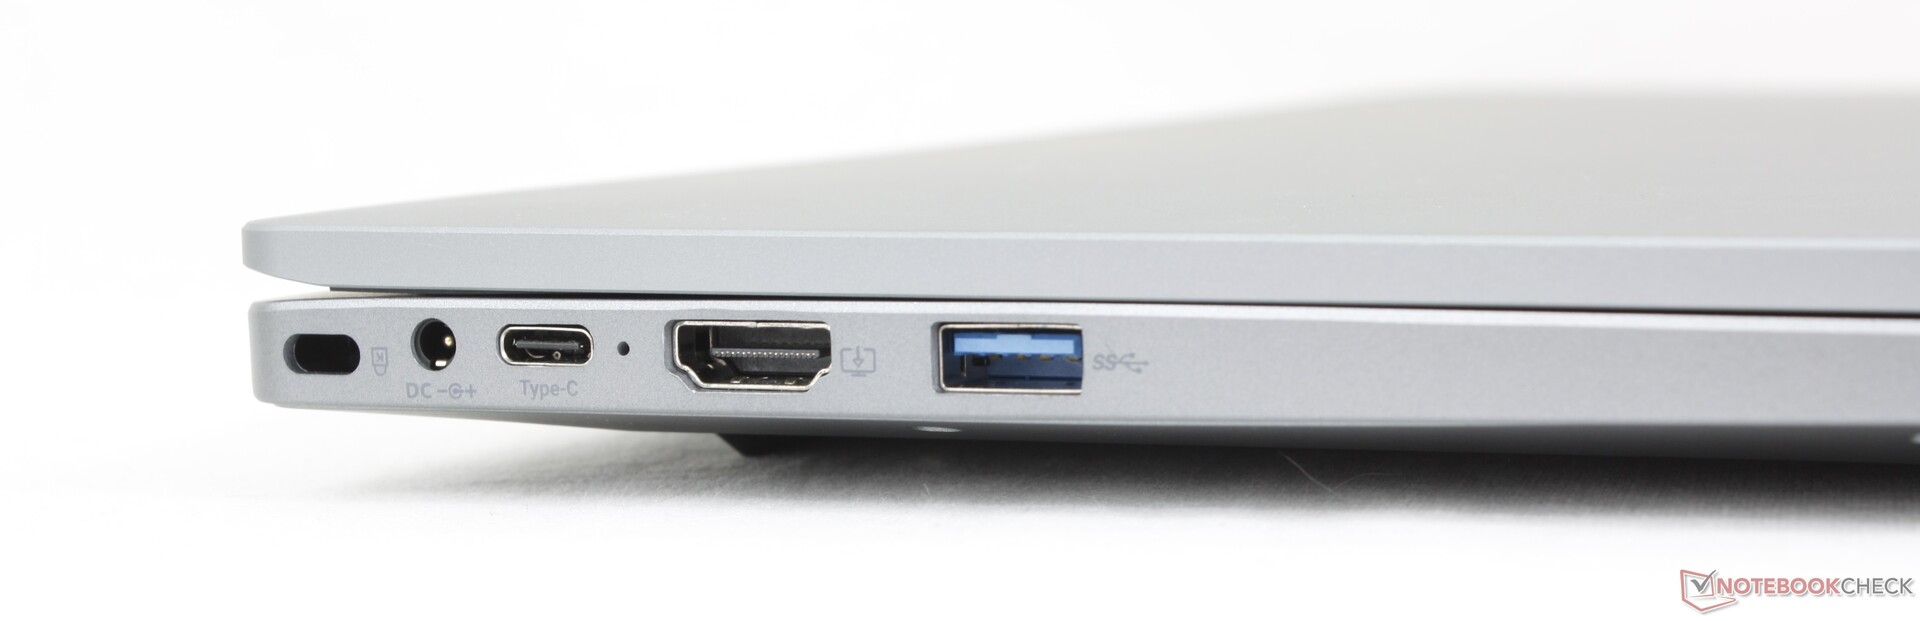
Connectivity
Port options are decent for a budget 15.6-inch form factor. Note that the system can be recharged via USB-C should you ever lose the barrel AC adapter that ships with the unit.
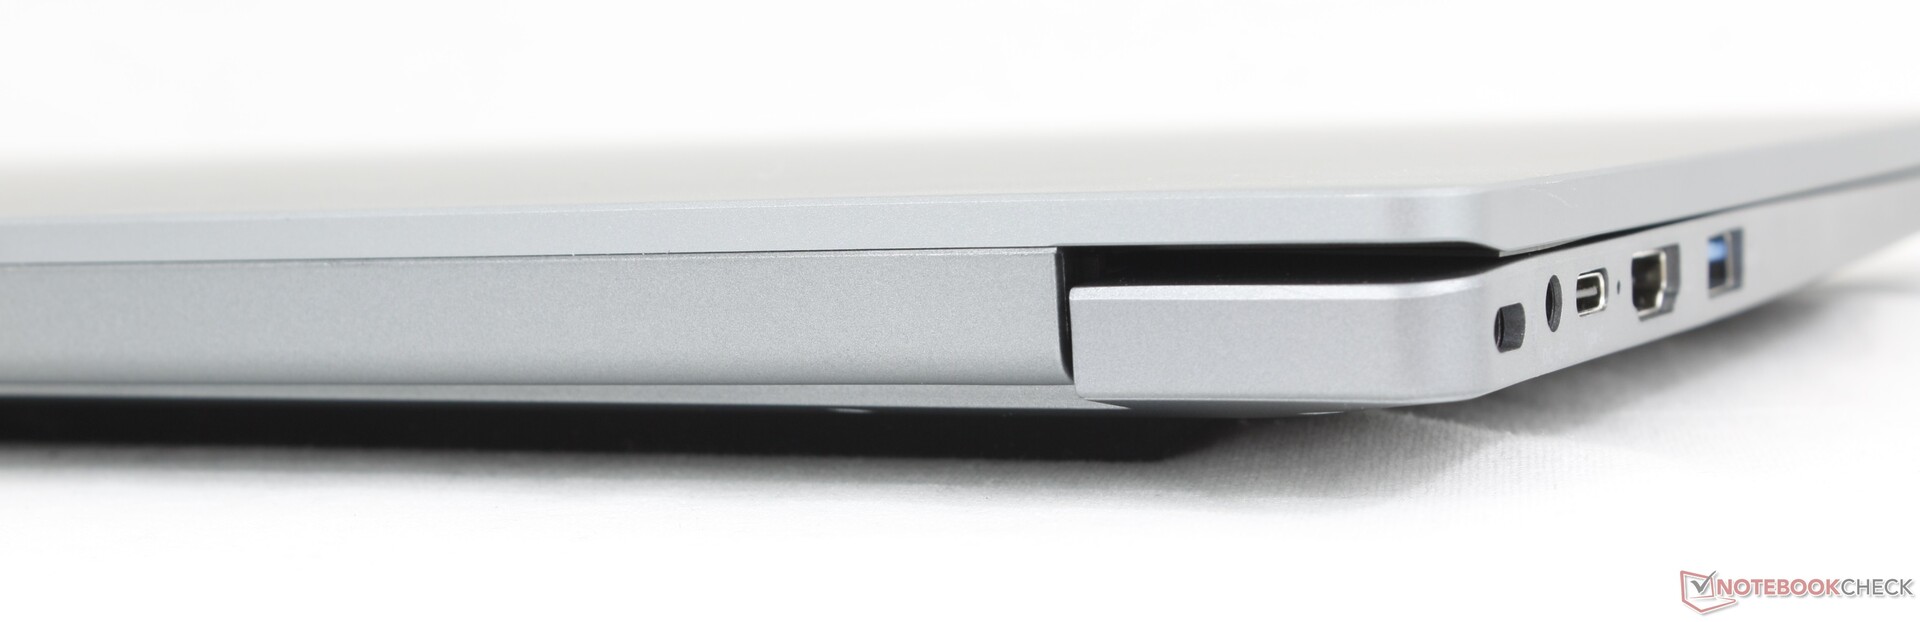
SD Card Reader
| SD Card Reader | |
| average JPG Copy Test (av. of 3 runs) | |
| Lenovo IdeaPad 3 15ABA7 (AV Pro SD microSD 128 GB V60) | |
| Ninkear A15 Plus (16+512) | |
| HP 250 G9 7N029ES (Angelbird AV Pro V60) | |
| Dell Latitude 3520 (AV Pro SD microSD 128 GB V60) | |
| Thinkeagle VigoBook G7 (AV Pro SD microSD 128 GB V60) | |
| maximum AS SSD Seq Read Test (1GB) | |
| Lenovo IdeaPad 3 15ABA7 (AV Pro SD microSD 128 GB V60) | |
| Ninkear A15 Plus (16+512) | |
| Thinkeagle VigoBook G7 (AV Pro SD microSD 128 GB V60) | |
| HP 250 G9 7N029ES (Angelbird AV Pro V60) | |
| Dell Latitude 3520 (AV Pro SD microSD 128 GB V60) | |
Communication
| Networking | |
| iperf3 transmit AXE11000 | |
| Dell Latitude 3520 | |
| Acer Aspire Vero AV15-53P | |
| Lenovo IdeaPad 3 15ABA7 | |
| Thinkeagle VigoBook G7 | |
| HP 250 G9 7N029ES | |
| Ninkear A15 Plus (16+512) | |
| iperf3 receive AXE11000 | |
| Dell Latitude 3520 | |
| Acer Aspire Vero AV15-53P | |
| Lenovo IdeaPad 3 15ABA7 | |
| Thinkeagle VigoBook G7 | |
| HP 250 G9 7N029ES | |
| Ninkear A15 Plus (16+512) | |
| iperf3 transmit AXE11000 6GHz | |
| Acer Aspire Vero AV15-53P | |
| iperf3 receive AXE11000 6GHz | |
| Acer Aspire Vero AV15-53P | |
Webcam


Maintenance
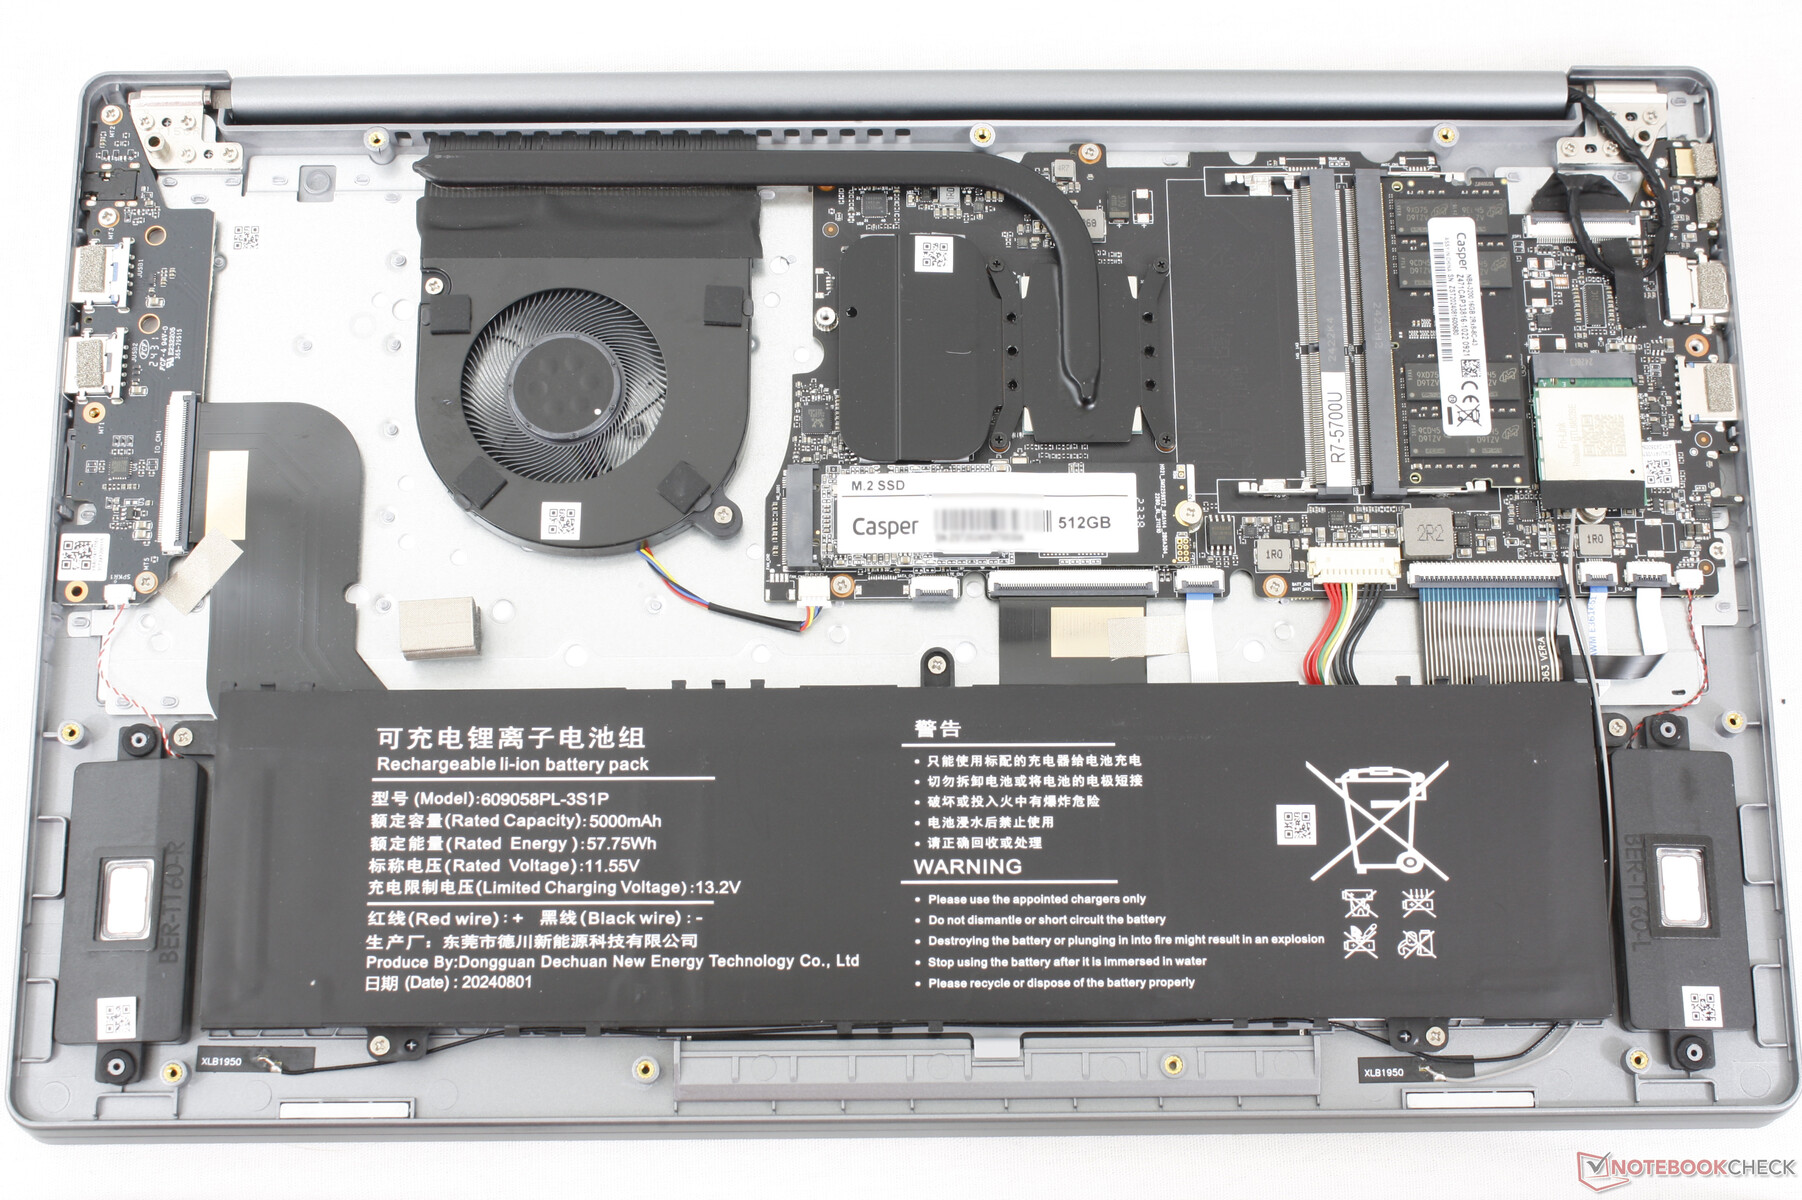
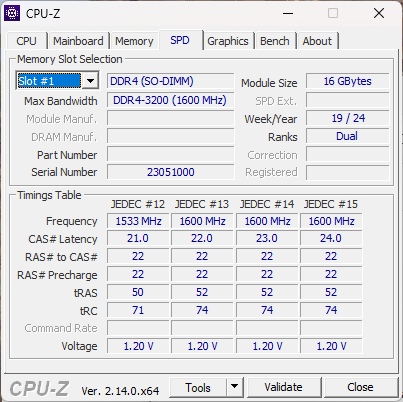
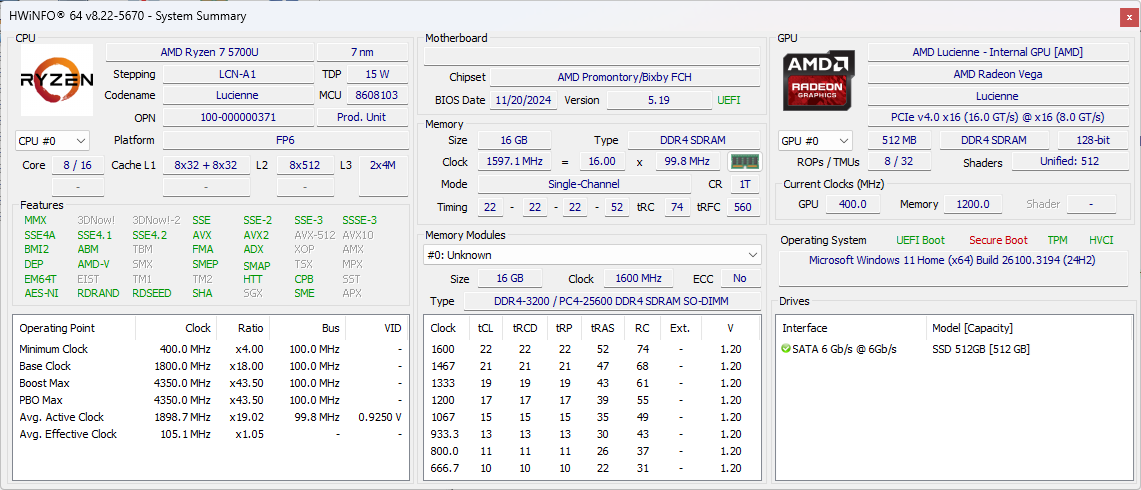
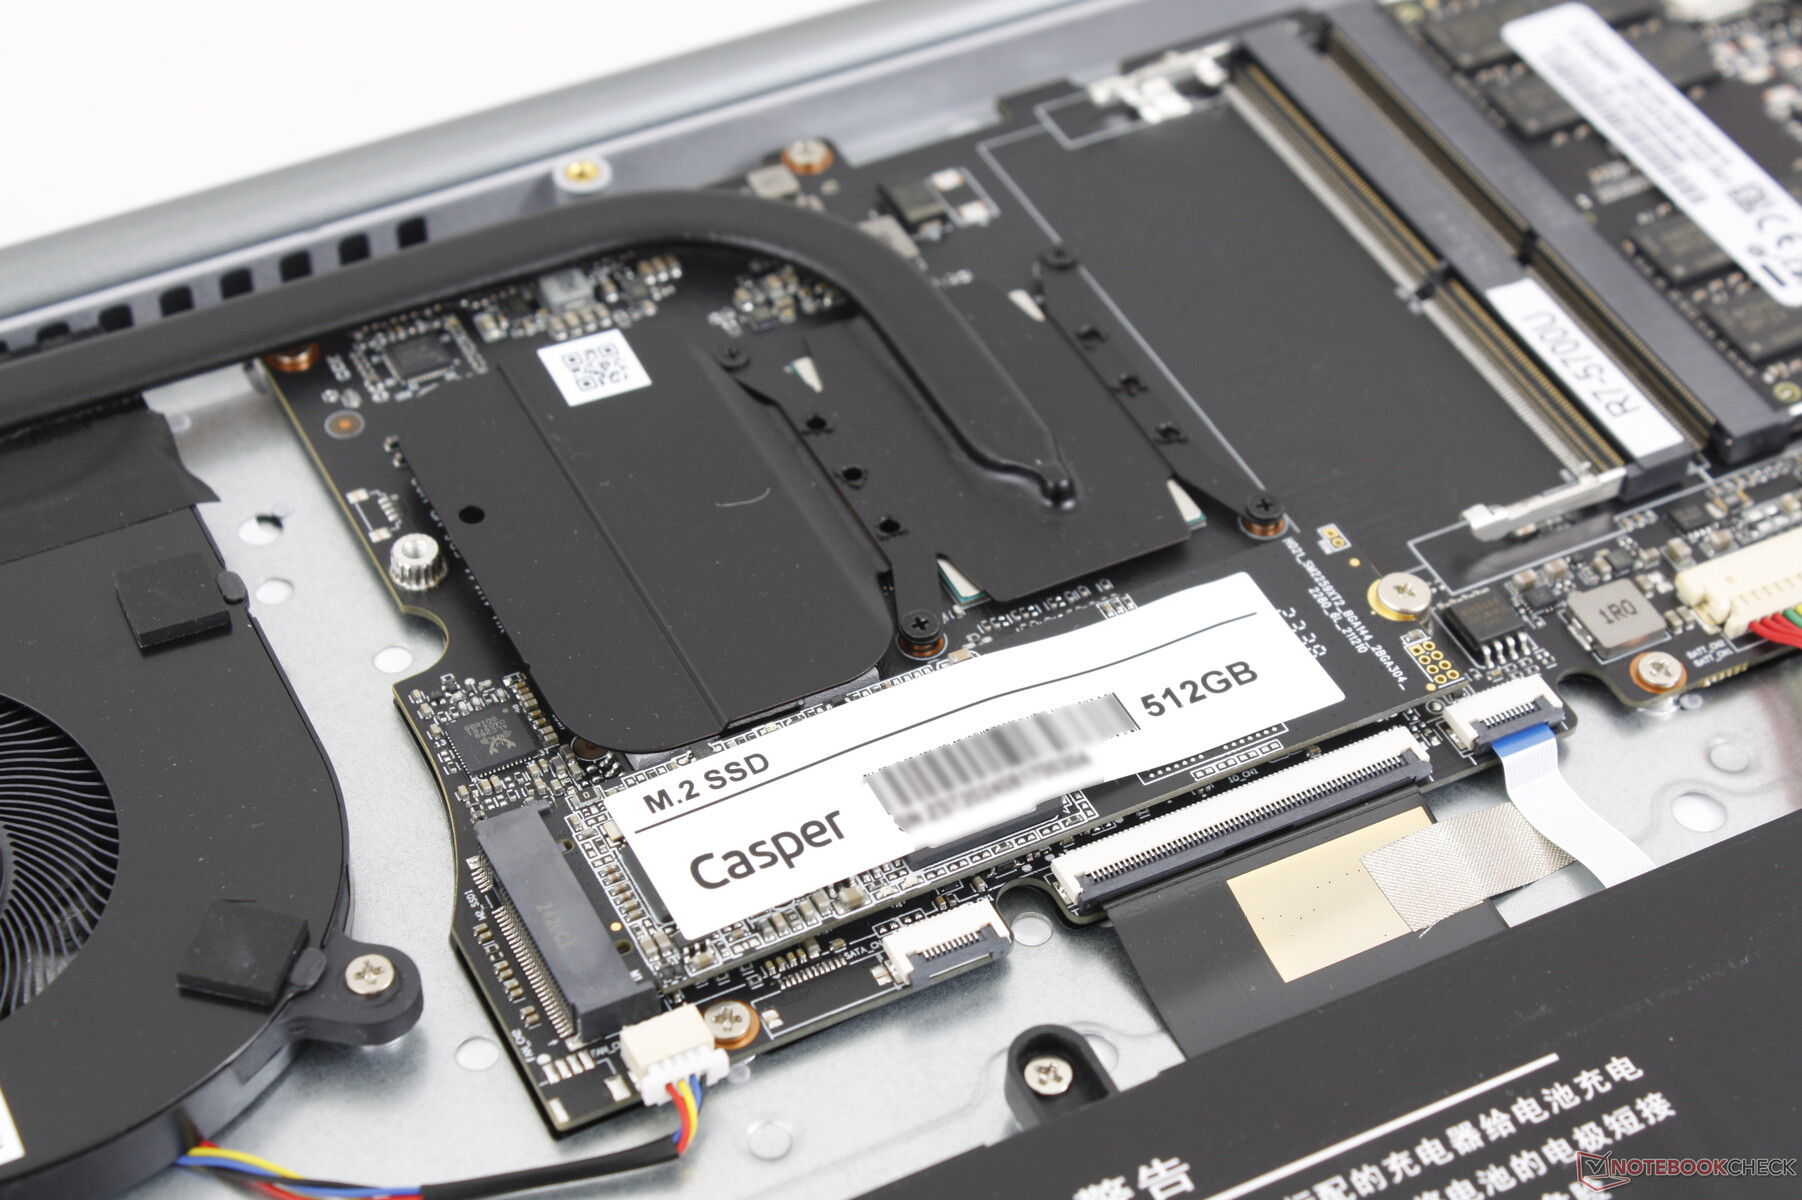
The bottom panel takes only a Phillips screwdriver to remove. Users have access to one M.2 2280 SSD slot and two DDR4 SODIMM slots.
Sustainability
The manufacturer advertises no sustainability measures taken during manufacturing. The packaging is mostly paper and cardboard with plastic wrapping and foam protection.
Input Devices
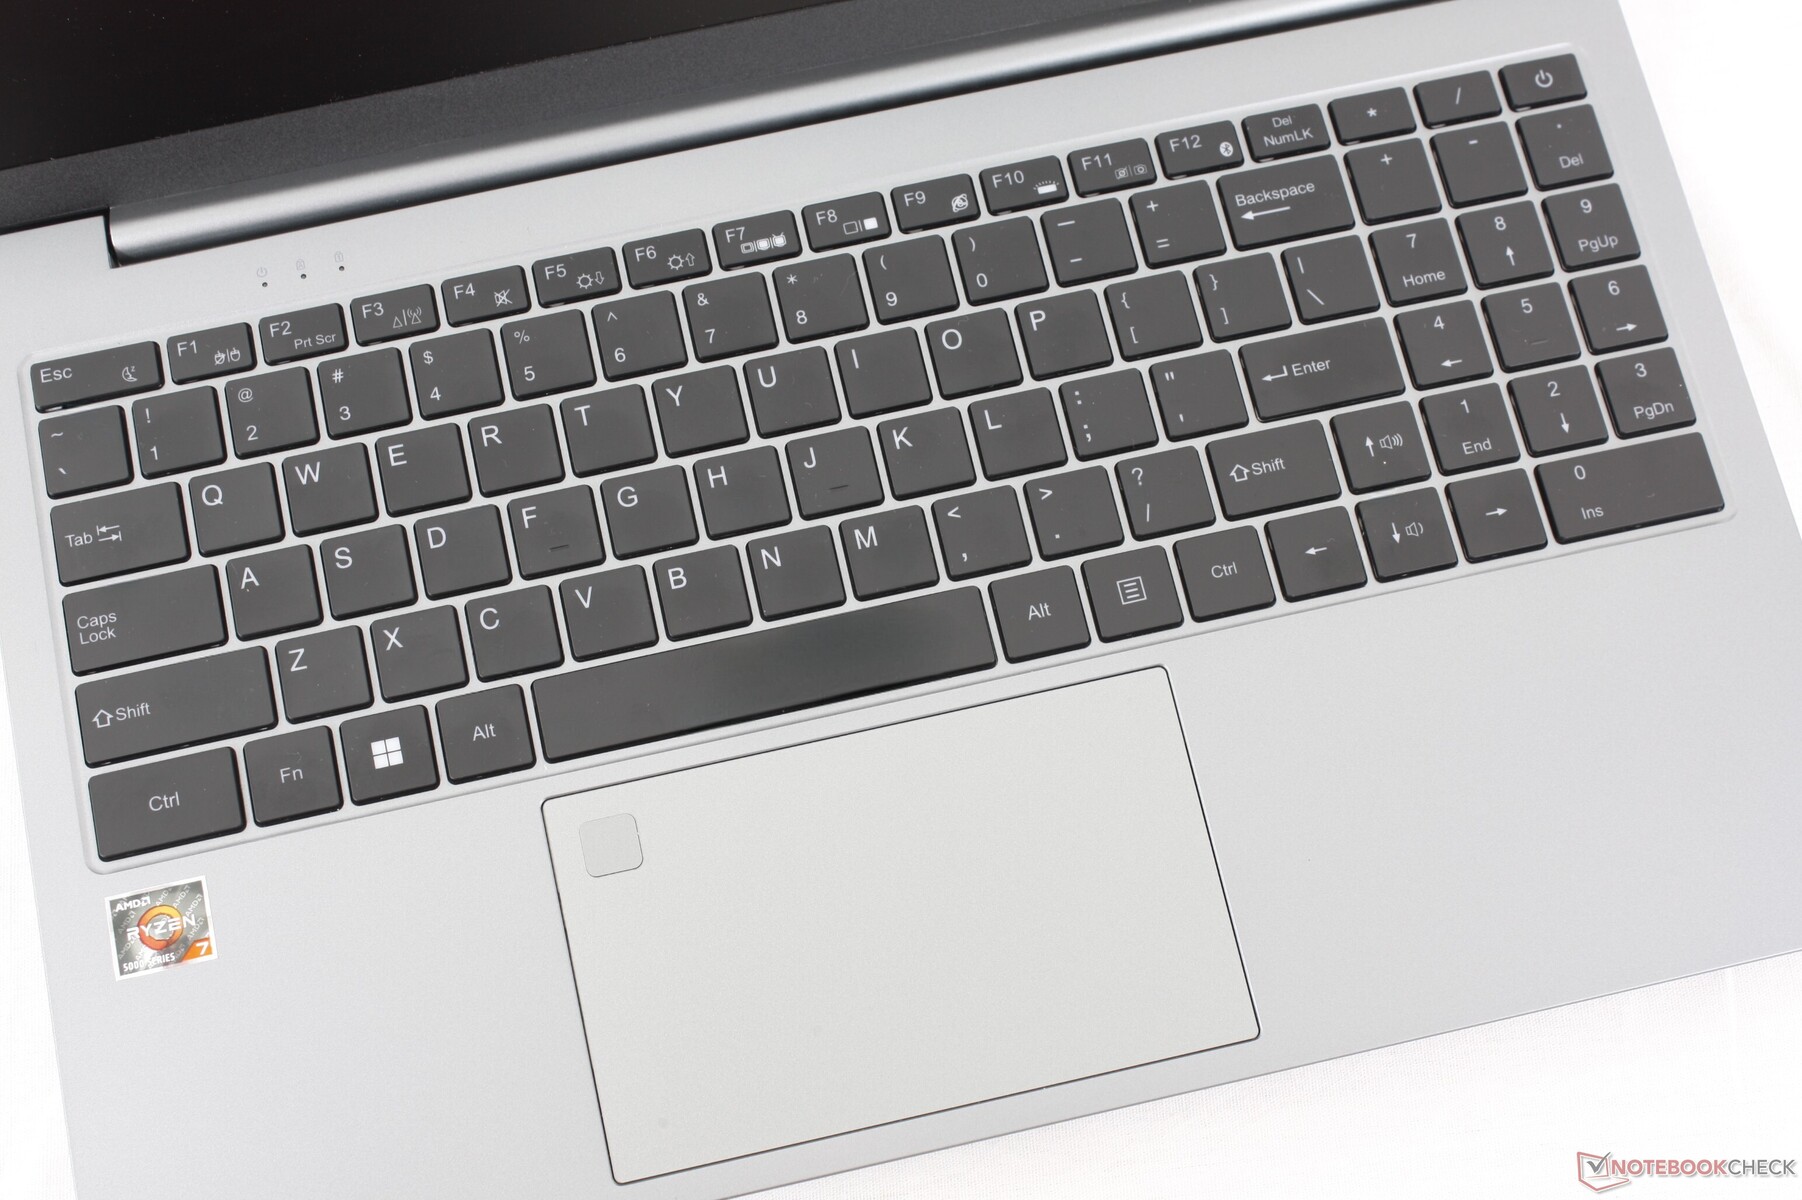
Keyboard And Touchpad
The keyboard is one of the better aspects of the VigoBook G7. Travel is deep and we appreciate that the numpad and arrow keys are the same size as the main QWERTY keys unlike on most other laptops. Unfortunately, the Enter key is relatively soft and with unsatisfying feedback when pressed.
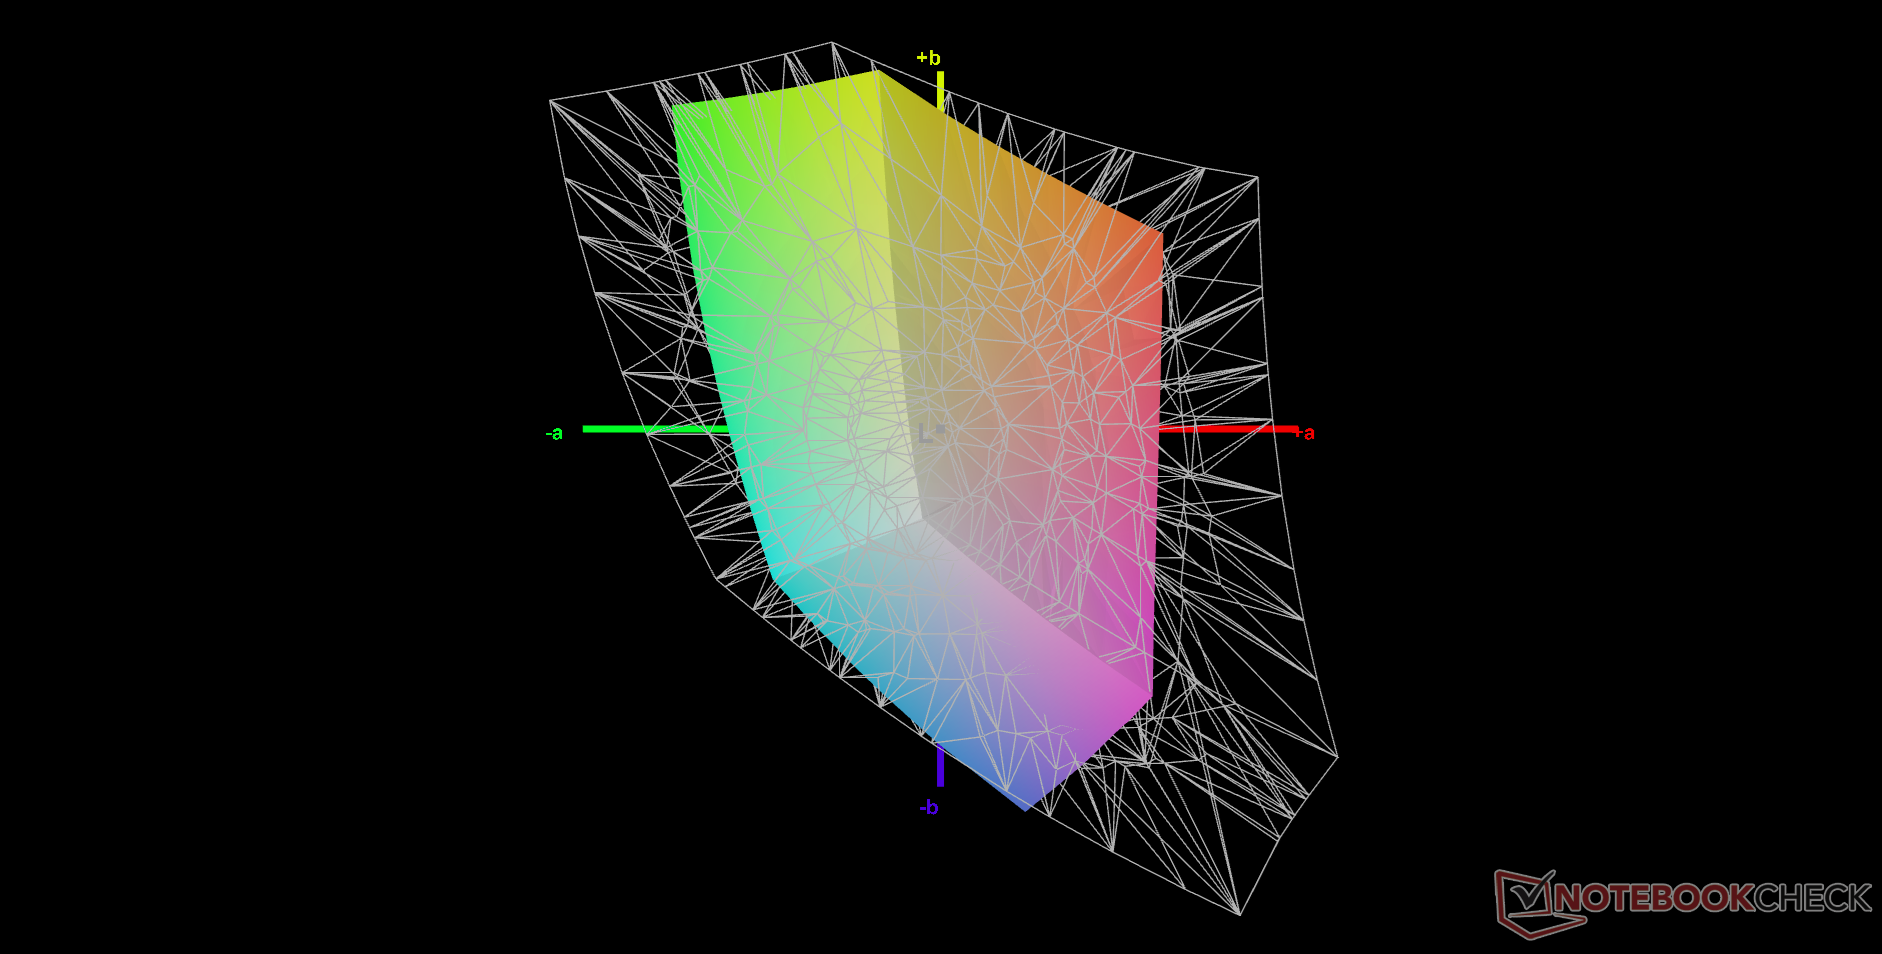
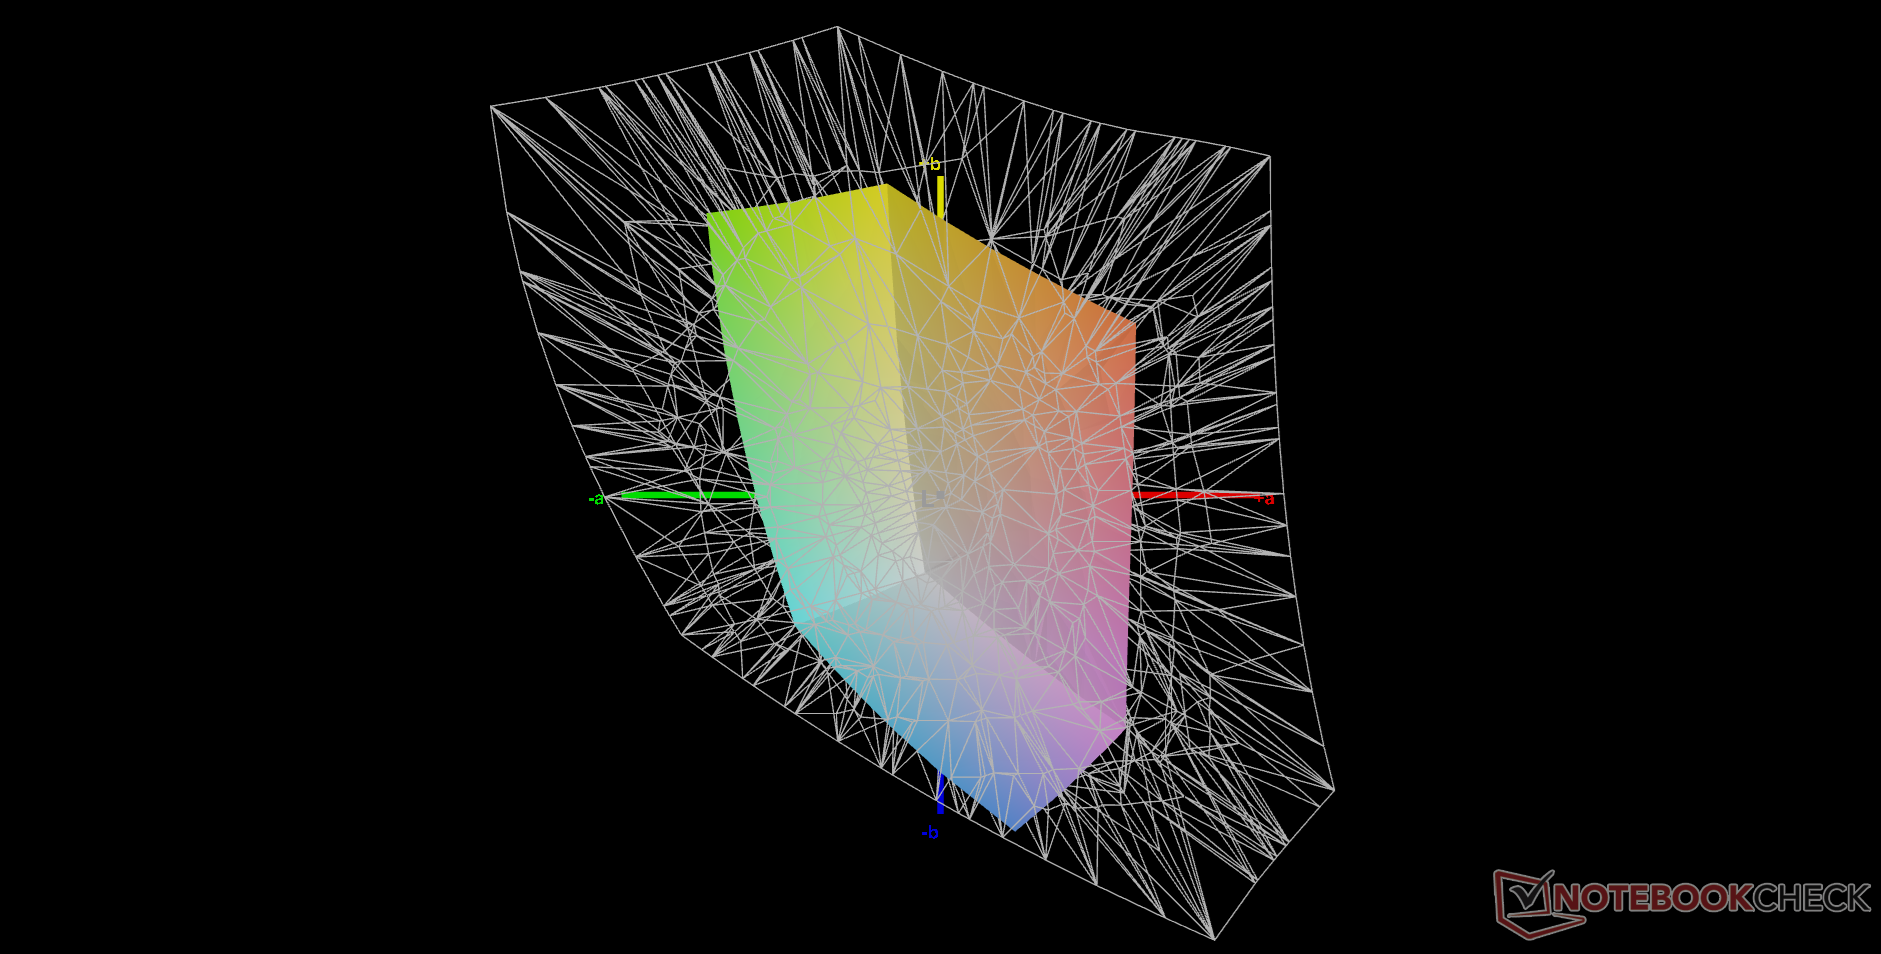
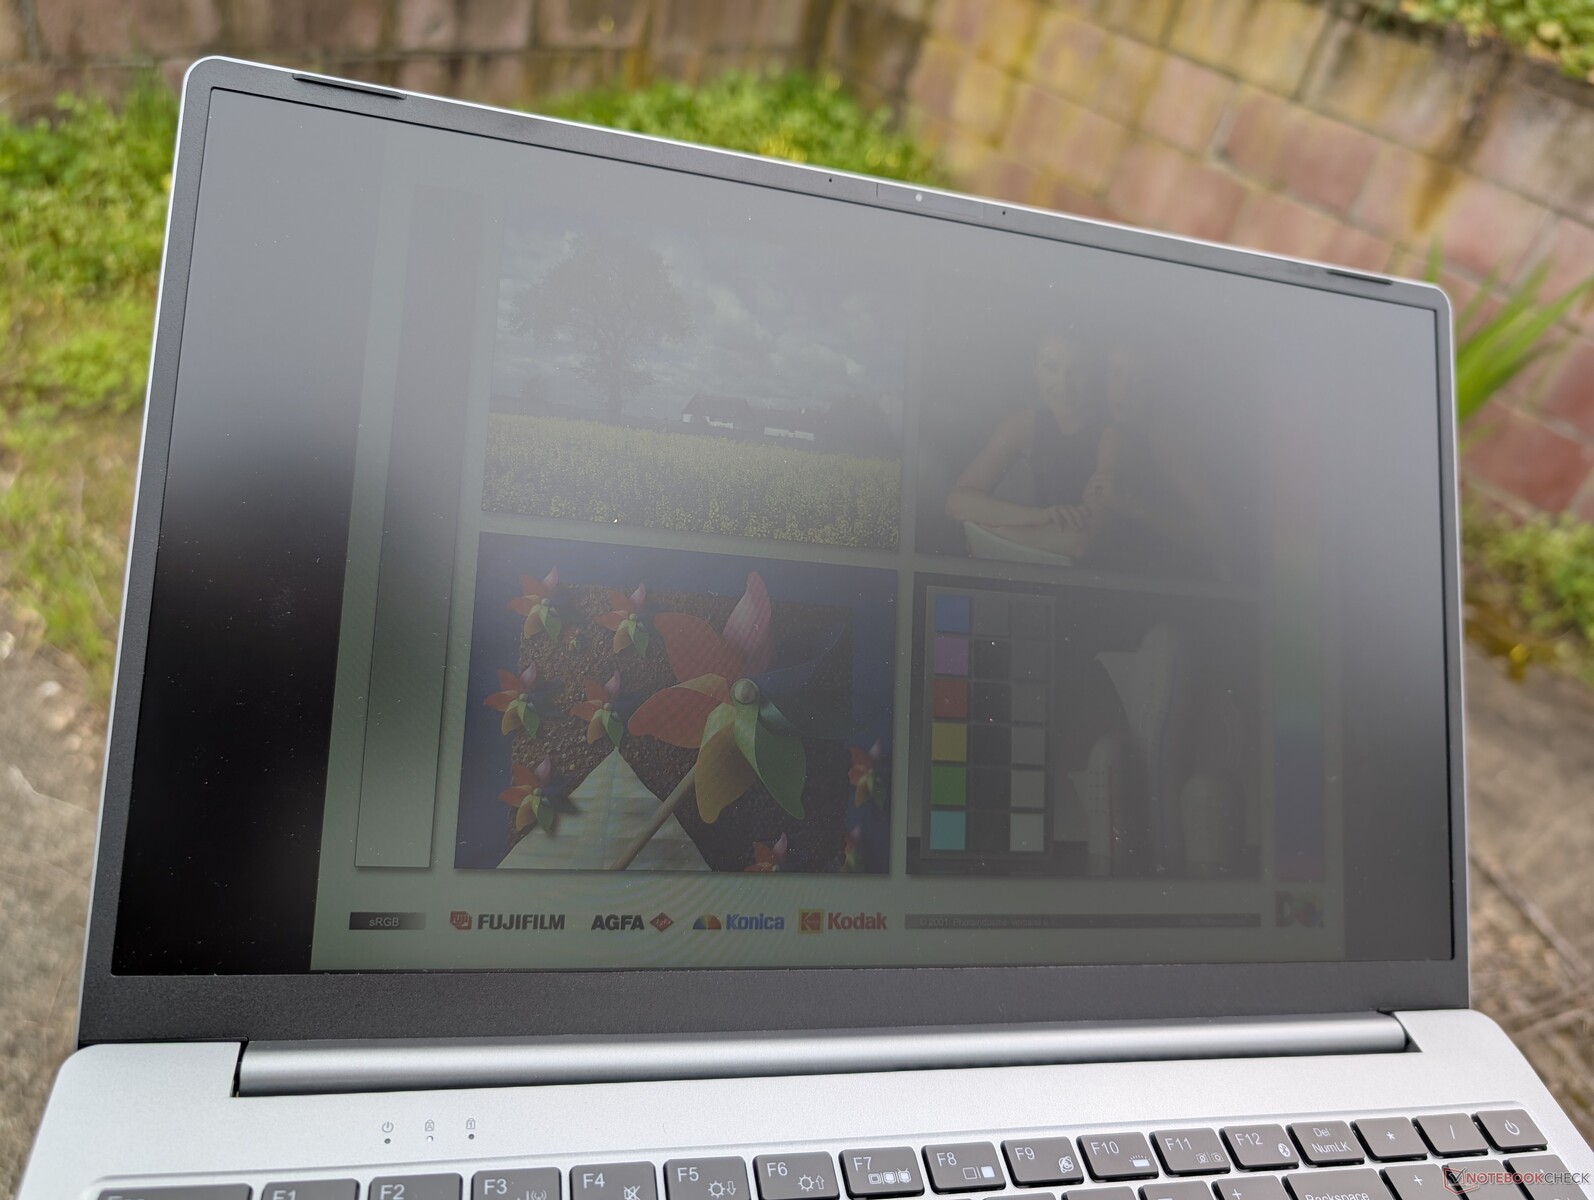
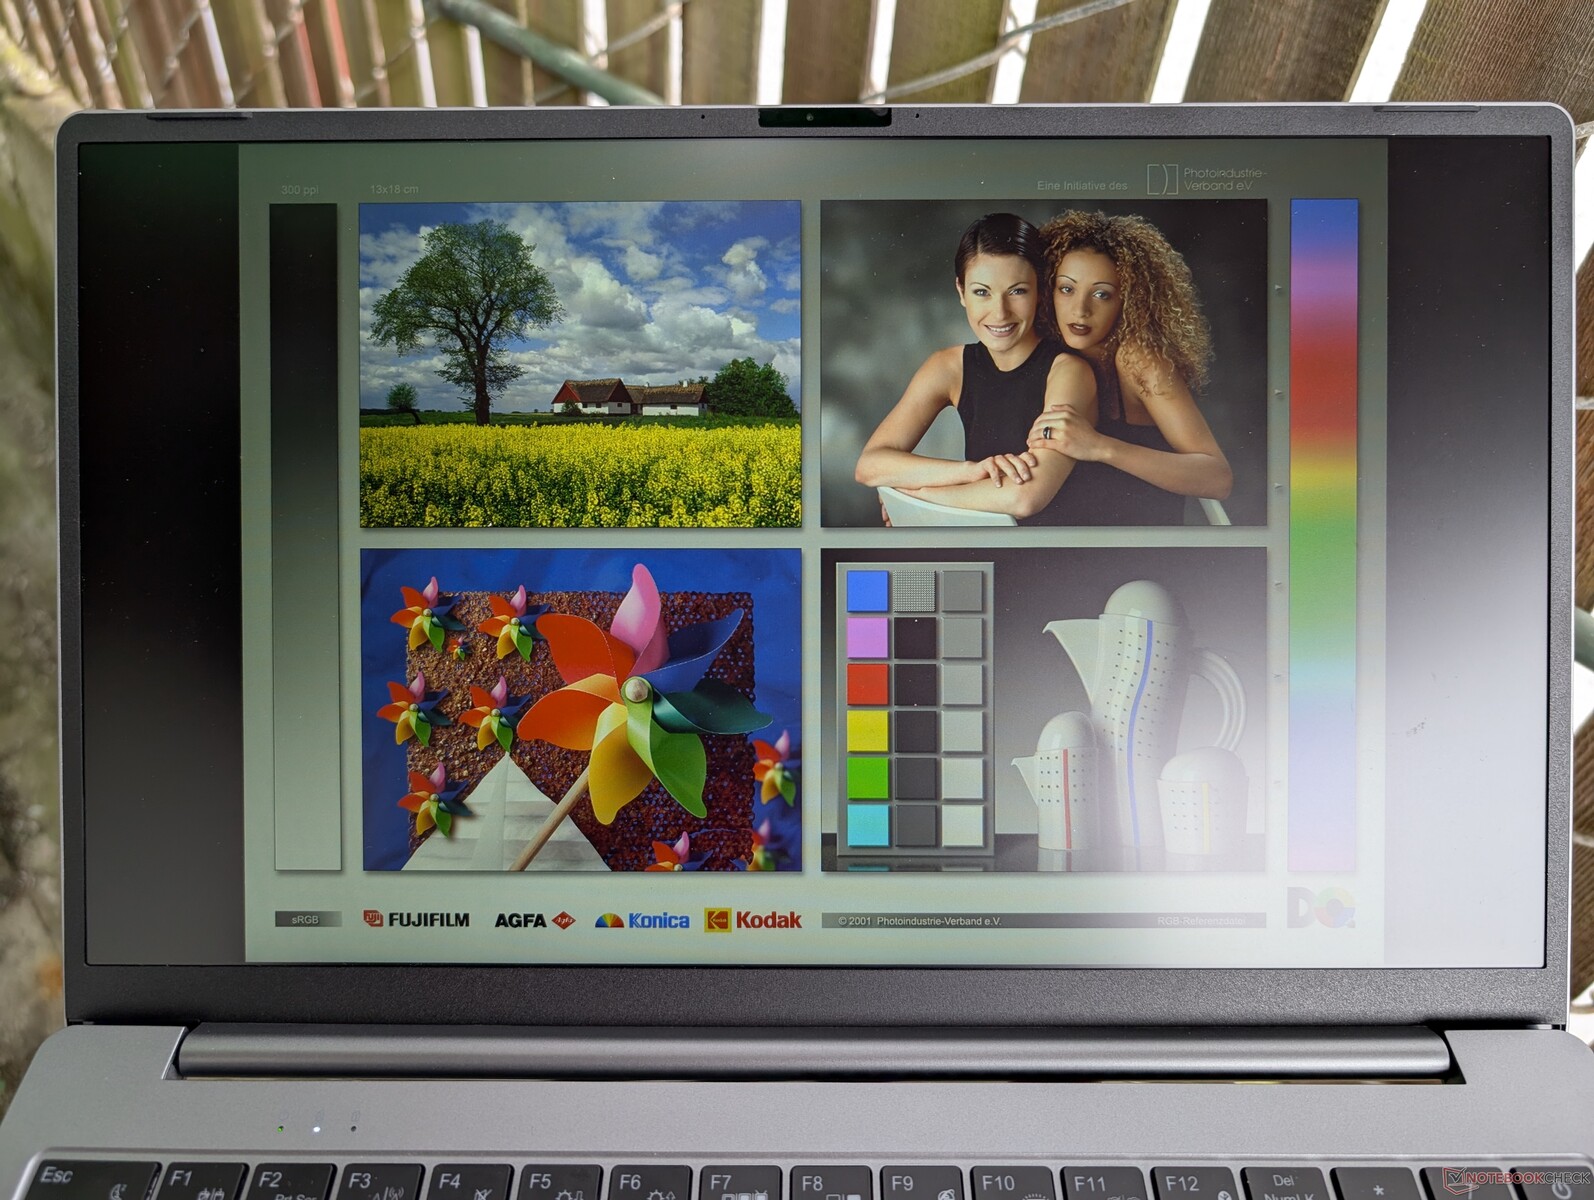
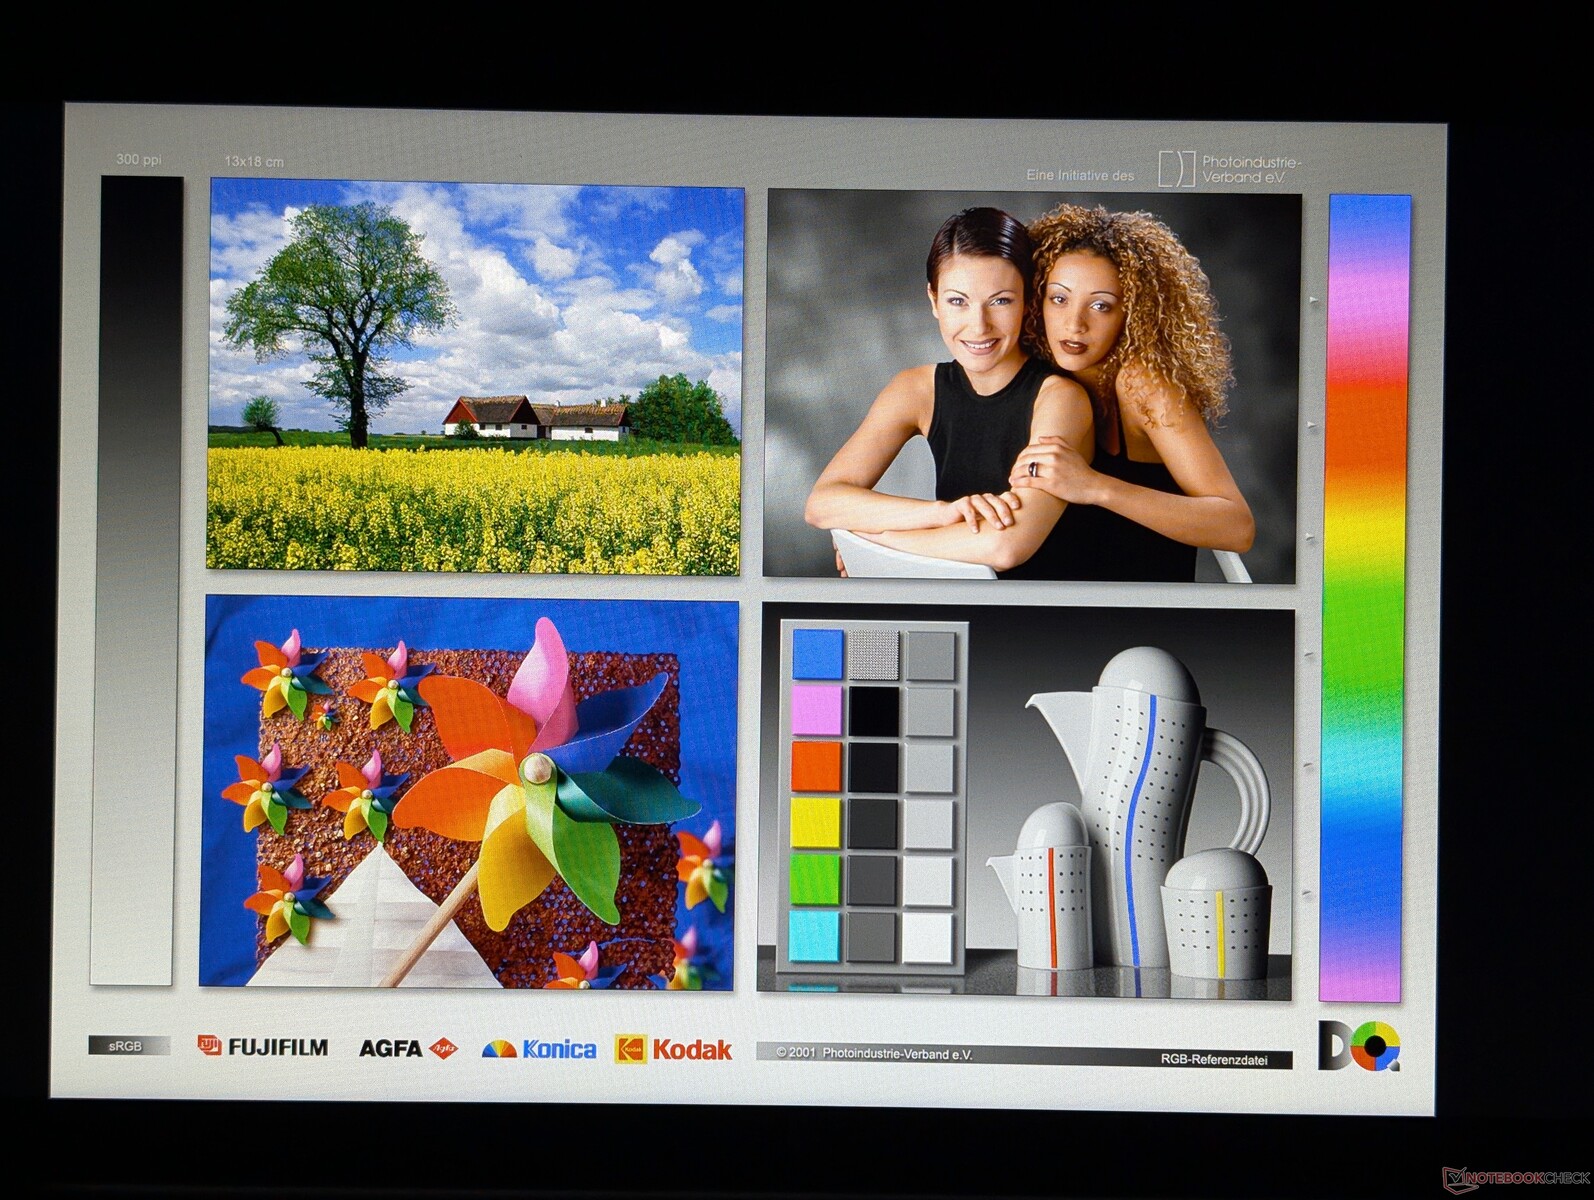
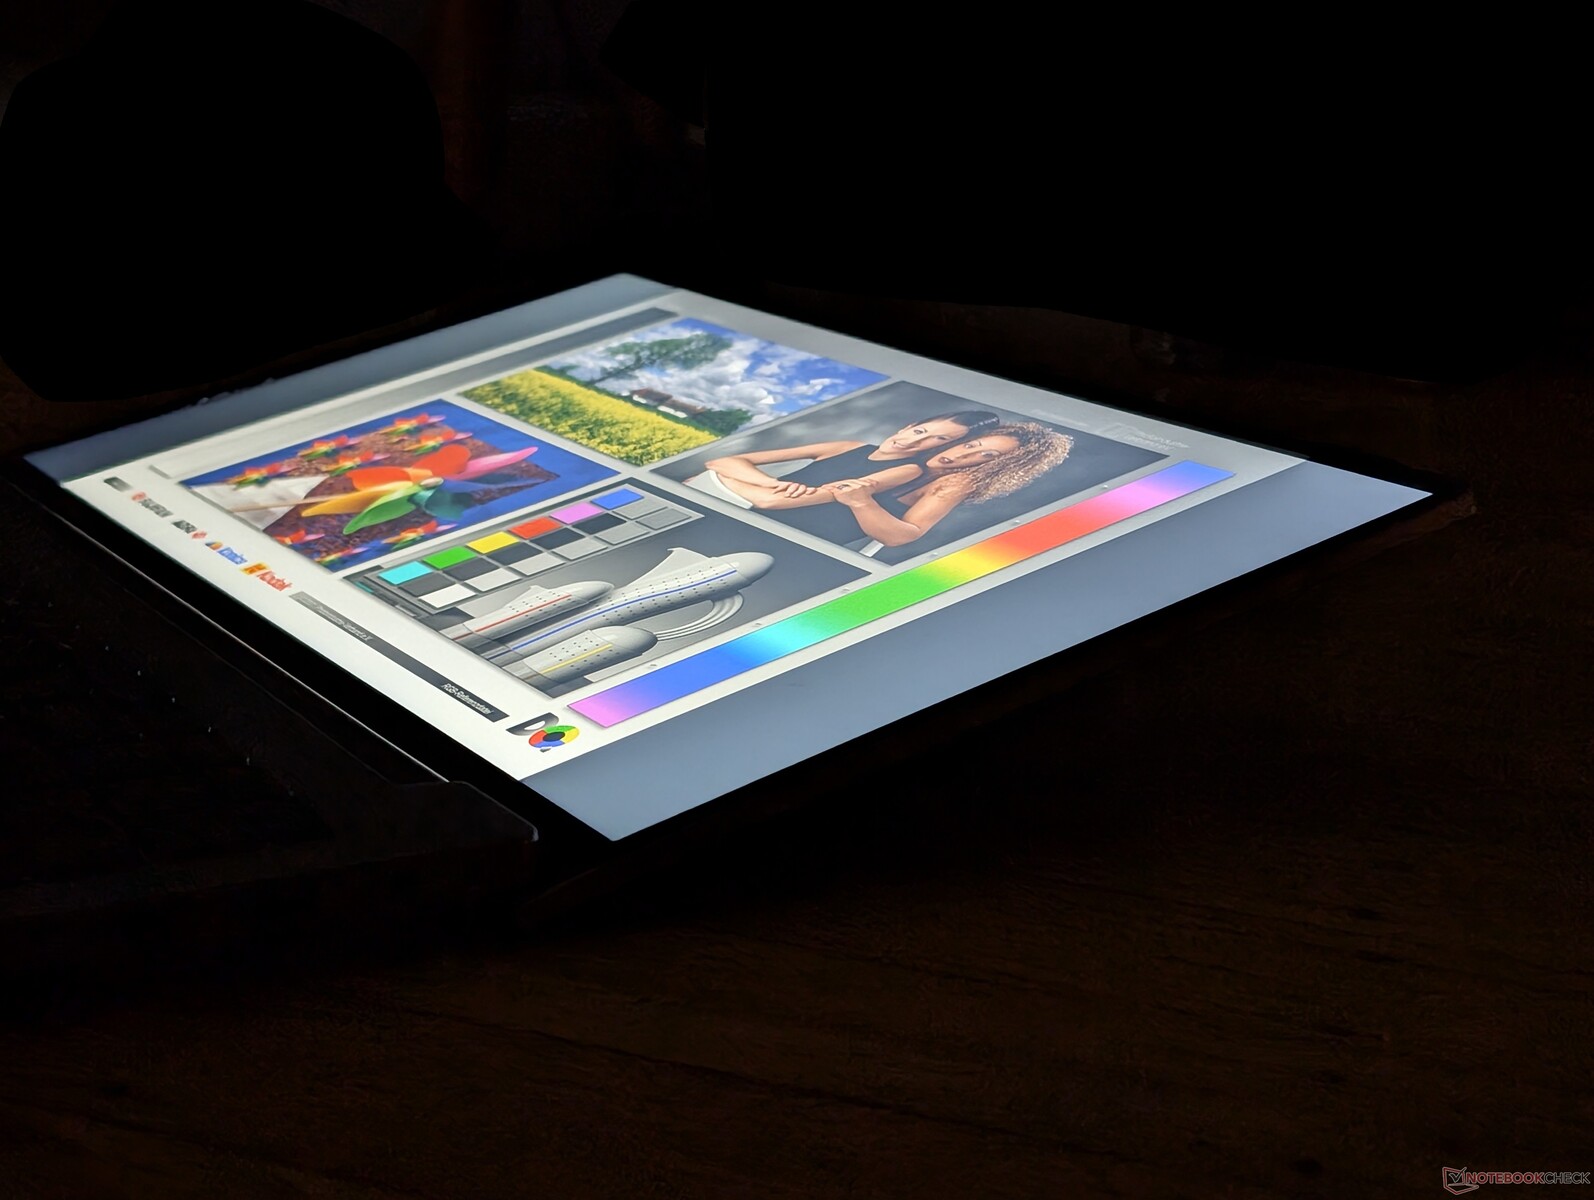
Display
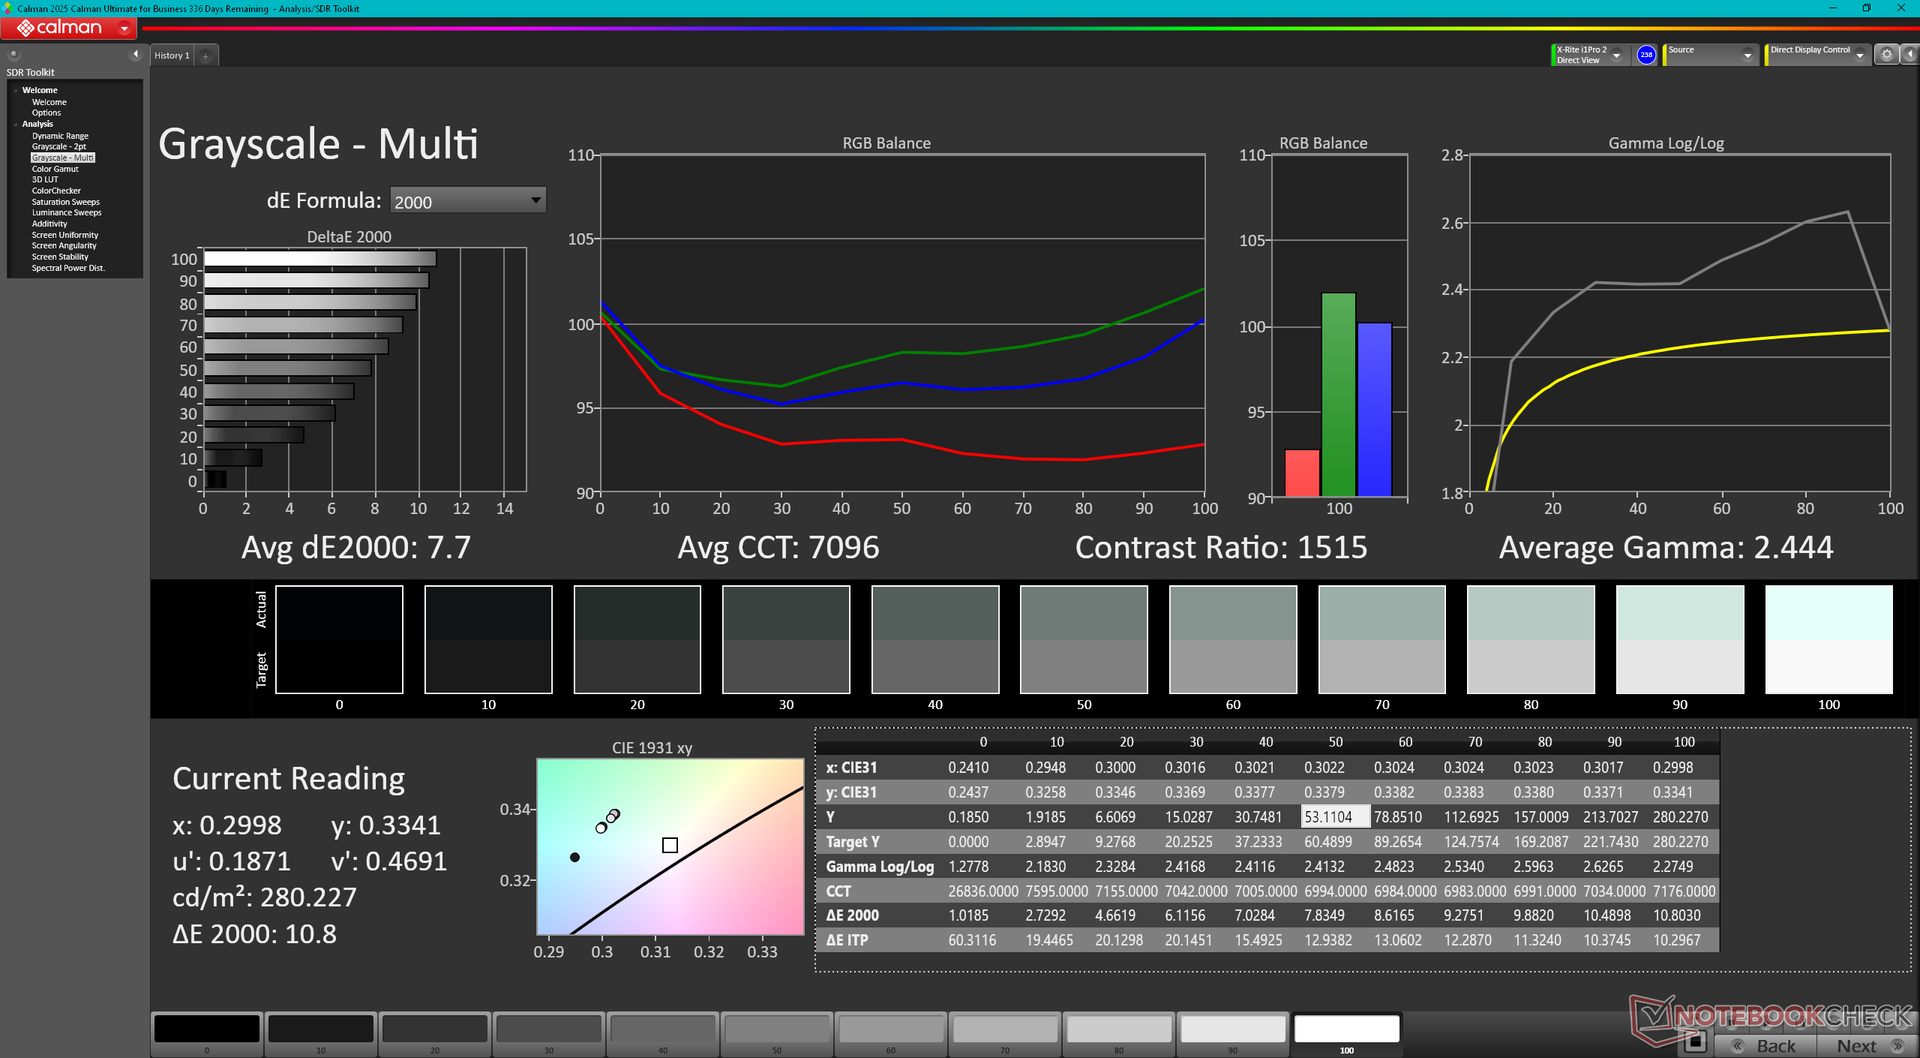
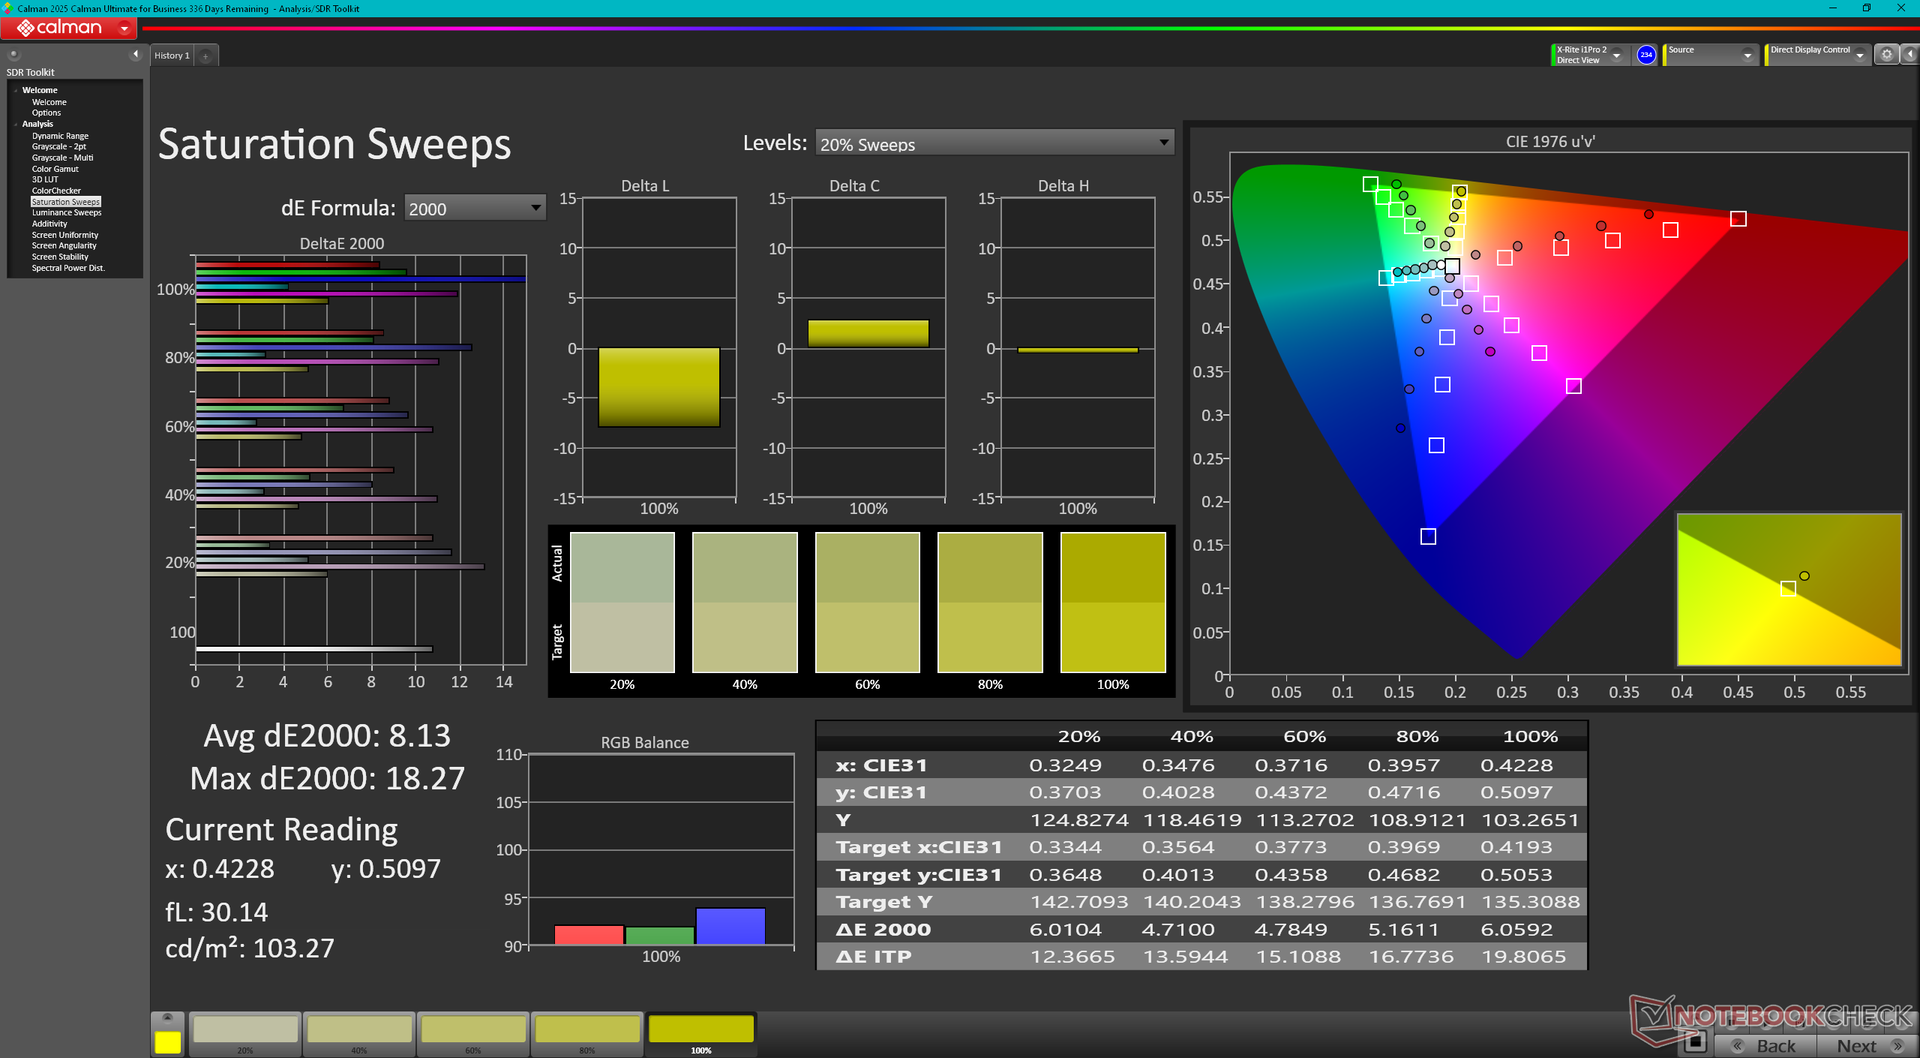
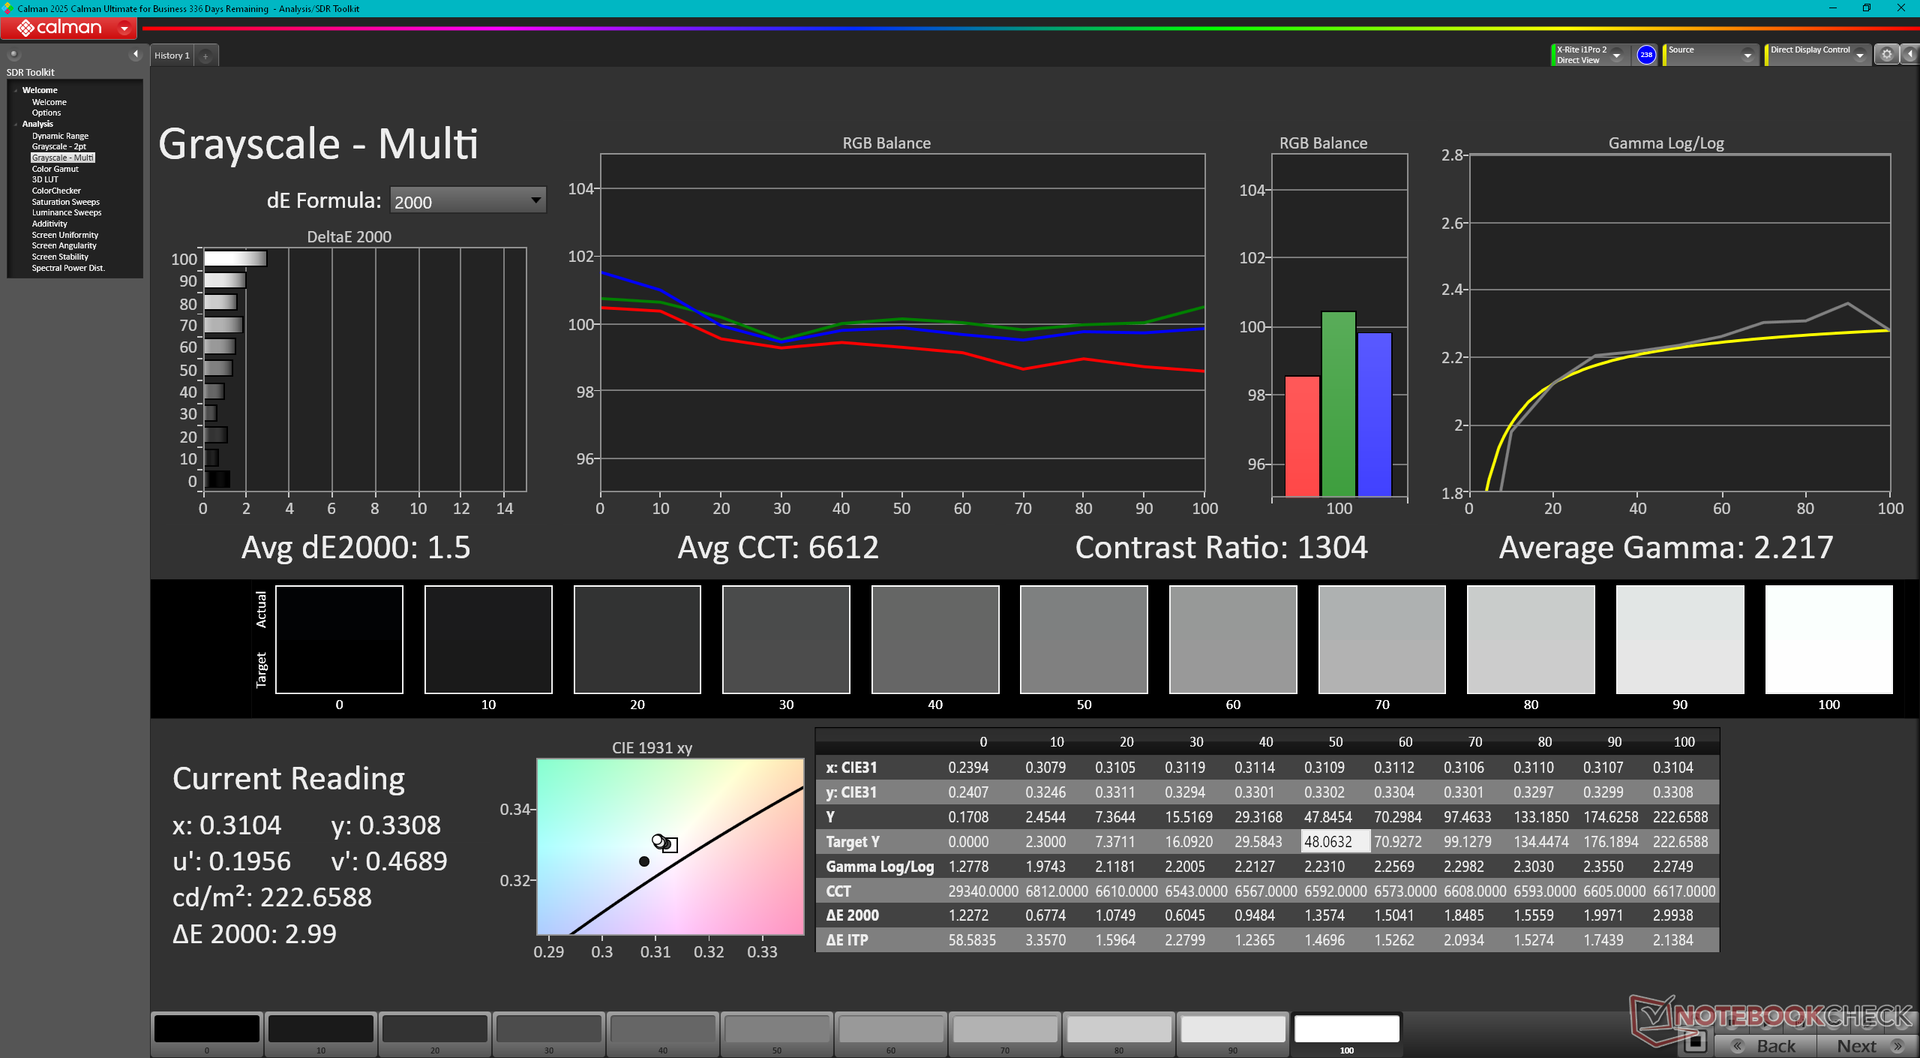
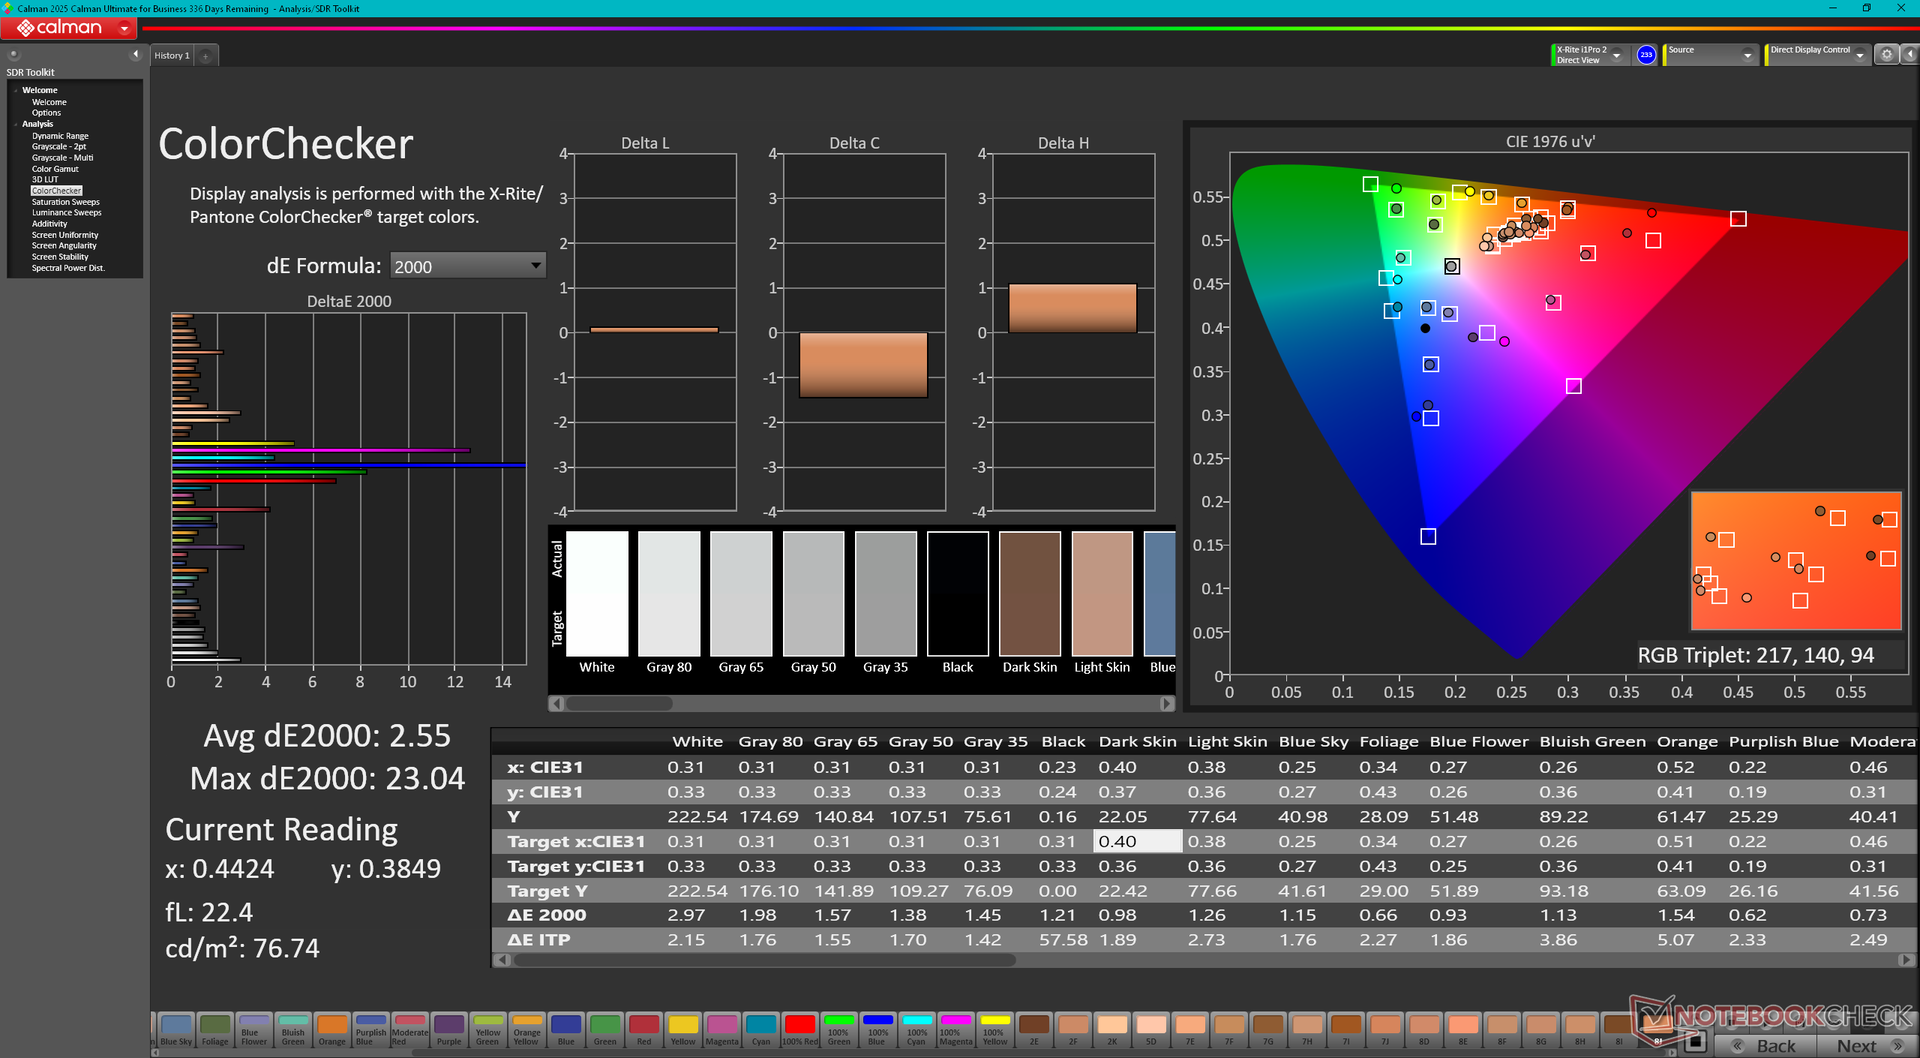
Colors are <60% of the sRGB standard to be a low-end IPS panel fit for a budget laptop like the VigoBook G7. Color temperature is also too cool out of the box, but an end-user calibration with an X-Rite colorimeter is able to address this issue as shown by our CalMan results below.
| |||||||||||||||||||||||||
Brightness Distribution: 74 %
Center on Battery: 270.4 cd/m²
Contrast: 1176:1 (Black: 0.23 cd/m²)
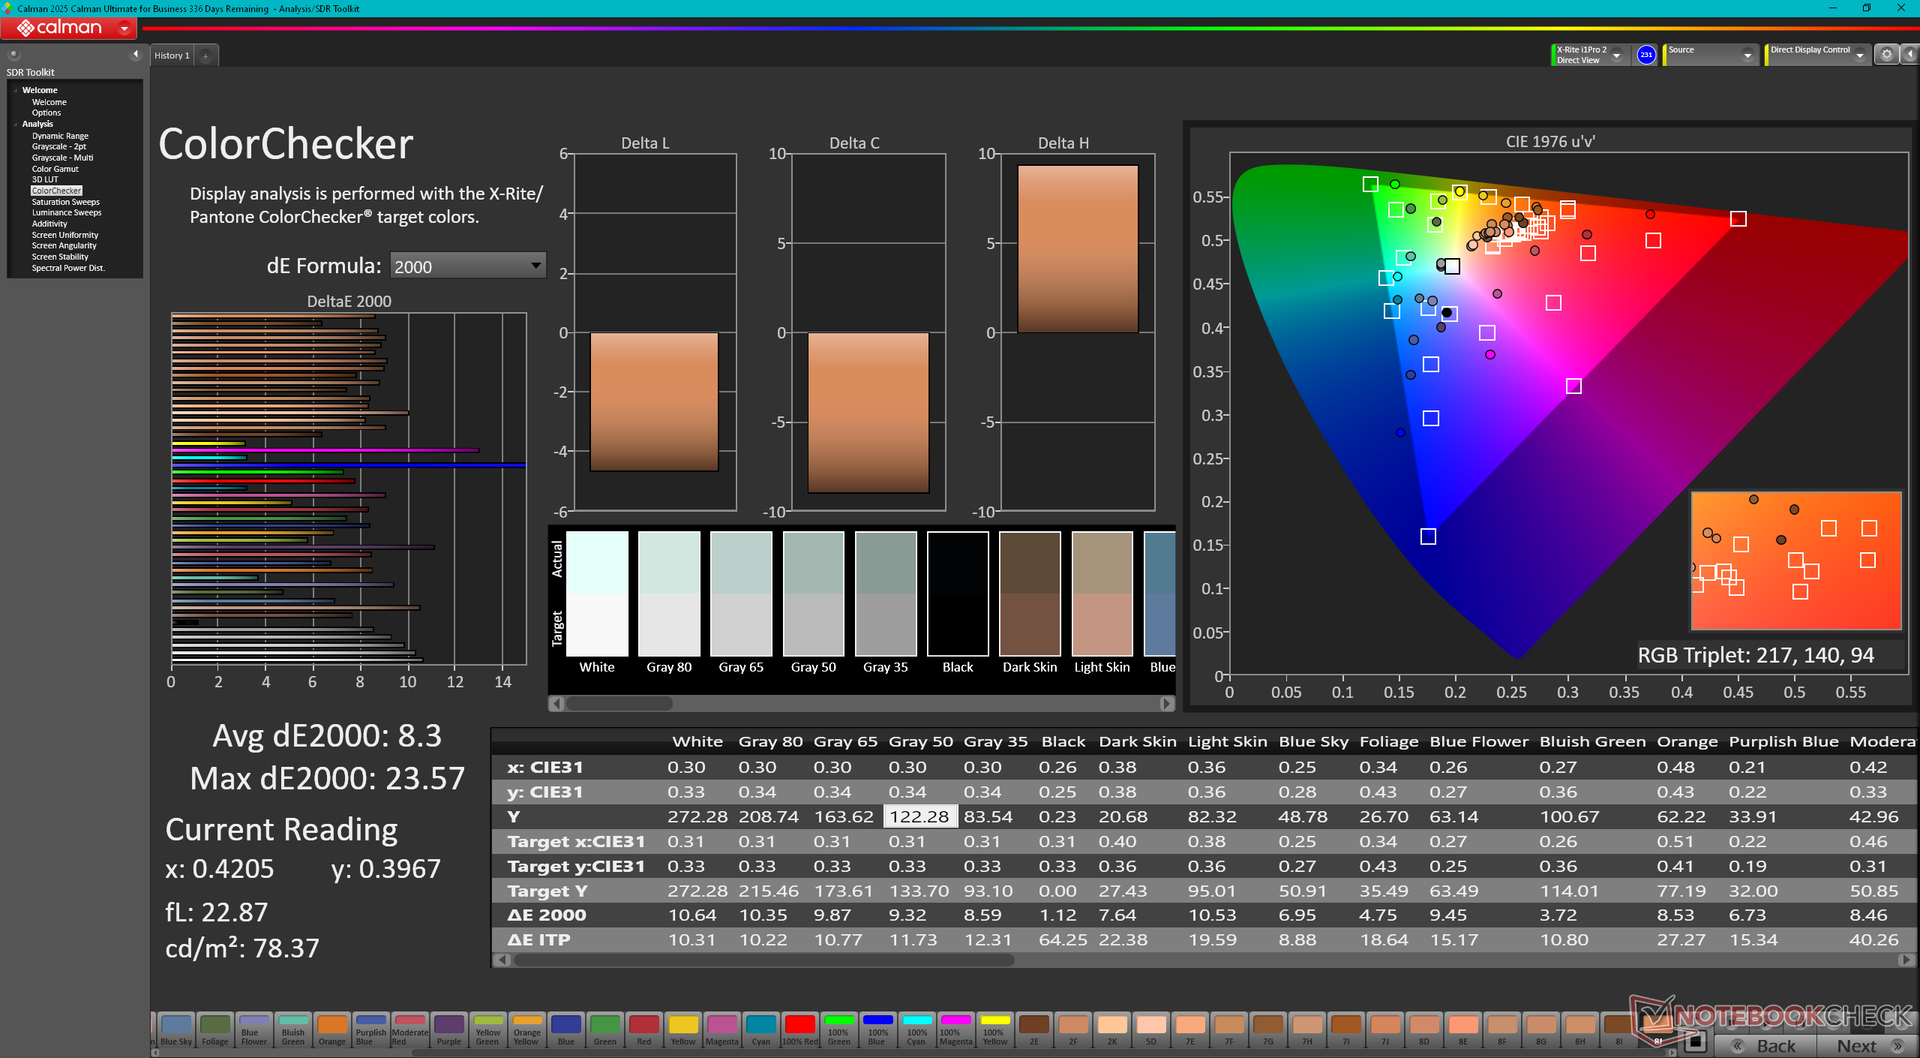
ΔE ColorChecker Calman: 8.3 | ∀{0.5-29.43 Ø4.72}
calibrated: 2.55
ΔE Greyscale Calman: 7.7 | ∀{0.09-98 Ø4.97}
39.6% AdobeRGB 1998 (Argyll 3D)
57.1% sRGB (Argyll 3D)
38.3% Display P3 (Argyll 3D)
Gamma: 2.44
CCT: 7096 K
| Thinkeagle VigoBook G7 G156EB06, IPS, 1920x1080, 15.6", 60 Hz | Ninkear A15 Plus (16+512) HKC023D, IPS, 1920x1080, 15.6", 60 Hz | Acer Aspire Vero AV15-53P AUO B156HAN09.0, IPS, 1920x1080, 15.6", 60 Hz | HP 250 G9 7N029ES CMN1538, IPS, 1920x1080, 15.6", 60 Hz | Lenovo IdeaPad 3 15ABA7 Lenovo LEN156FHD, IPS, 1920x1080, 15.6", 60 Hz | Dell Latitude 3520 BOE NE156FH, IPS, 1920x1080, 15.6", 60 Hz | |
|---|---|---|---|---|---|---|
| Display | 2% | 72% | 13% | 0% | 5% | |
| Display P3 Coverage (%) | 38.3 | 39.04 2% | 66.67 74% | 43.3 13% | 38.2 0% | 40 4% |
| sRGB Coverage (%) | 57.1 | 58.06 2% | 97.48 71% | 64.8 13% | 57.3 0% | 60.2 5% |
| AdobeRGB 1998 Coverage (%) | 39.6 | 40.34 2% | 68.14 72% | 44.7 13% | 39.5 0% | 41.4 5% |
| Response Times | 14% | -19% | -19% | 13% | 19% | |
| Response Time Grey 50% / Grey 80% * (ms) | 24.7 ? | 25 ? -1% | 25 ? -1% | 31.9 ? -29% | 27 ? -9% | 24 ? 3% |
| Response Time Black / White * (ms) | 19.8 ? | 14 ? 29% | 27 ? -36% | 21.6 ? -9% | 13 ? 34% | 13 ? 34% |
| PWM Frequency (Hz) | 200 ? | |||||
| PWM Amplitude * (%) | 50 | |||||
| Screen | 2% | 26% | 19% | 4% | 0% | |
| Brightness middle (cd/m²) | 270.4 | 254 -6% | 411.5 52% | 281 4% | 333 23% | 322 19% |
| Brightness (cd/m²) | 253 | 244 -4% | 372 47% | 257 2% | 312 23% | 294 16% |
| Brightness Distribution (%) | 74 | 89 20% | 84 14% | 82 11% | 82 11% | 87 18% |
| Black Level * (cd/m²) | 0.23 | 0.1587 31% | 0.52 -126% | 0.16 30% | 0.31 -35% | 0.445 -93% |
| Contrast (:1) | 1176 | 1601 36% | 791 -33% | 1756 49% | 1074 -9% | 724 -38% |
| Colorchecker dE 2000 * | 8.3 | 7.42 11% | 3.07 63% | 4.7 43% | 5.39 35% | 4.54 45% |
| Colorchecker dE 2000 max. * | 23.57 | 19.74 16% | 4.95 79% | 18 24% | 19.18 19% | 17.27 27% |
| Colorchecker dE 2000 calibrated * | 2.55 | 5.72 -124% | 1.03 60% | 3.7 -45% | 4.77 -87% | 4.43 -74% |
| Greyscale dE 2000 * | 7.7 | 5 35% | 1.74 77% | 3.6 53% | 3.56 54% | 1.25 84% |
| Gamma | 2.44 90% | 1.855 119% | 2.238 98% | 2.2 100% | 2.47 89% | 2.46 89% |
| CCT | 7096 92% | 6421 101% | 6611 98% | 7267 89% | 6290 103% | 6677 97% |
| Total Average (Program / Settings) | 6% /
4% | 26% /
30% | 4% /
12% | 6% /
4% | 8% /
4% |
* ... smaller is better
Display Response Times
| ↔ Response Time Black to White | ||
|---|---|---|
| 19.8 ms ... rise ↗ and fall ↘ combined | ↗ 11.1 ms rise | 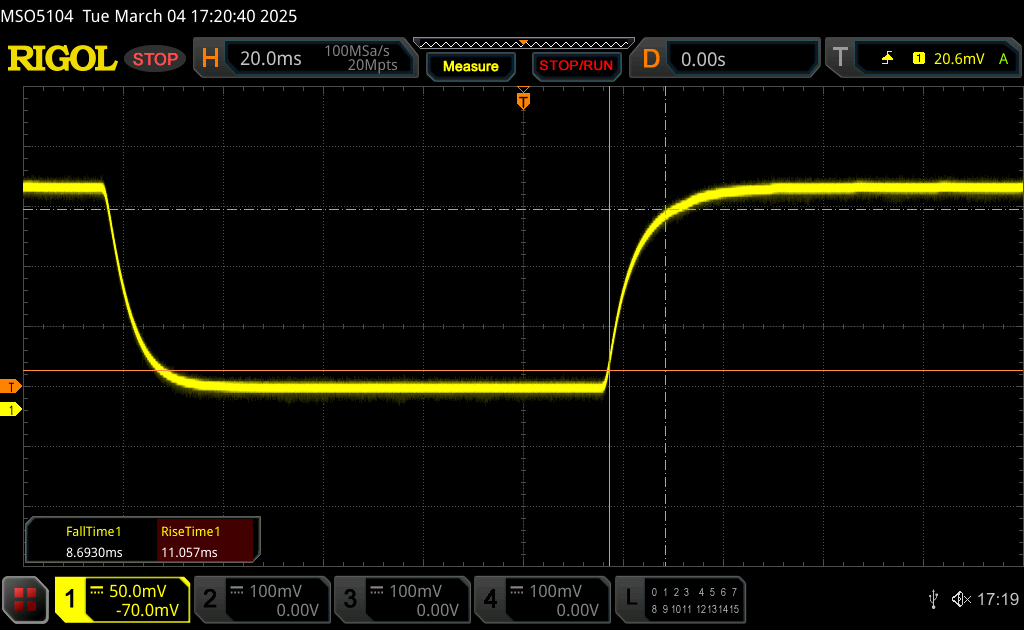 |
| ↘ 8.7 ms fall | ||
| The screen shows good response rates in our tests, but may be too slow for competitive gamers. In comparison, all tested devices range from 0.1 (minimum) to 240 (maximum) ms. » 44 % of all devices are better. This means that the measured response time is similar to the average of all tested devices (19.8 ms). | ||
| ↔ Response Time 50% Grey to 80% Grey | ||
| 24.7 ms ... rise ↗ and fall ↘ combined | ↗ 13 ms rise | 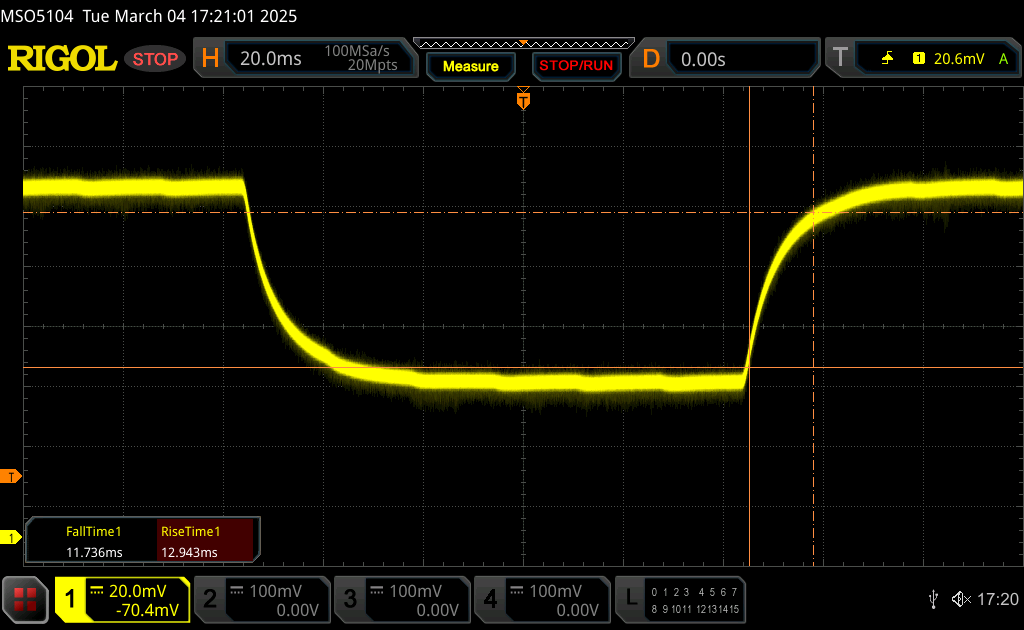 |
| ↘ 11.7 ms fall | ||
| The screen shows good response rates in our tests, but may be too slow for competitive gamers. In comparison, all tested devices range from 0.165 (minimum) to 636 (maximum) ms. » 35 % of all devices are better. This means that the measured response time is better than the average of all tested devices (31 ms). | ||
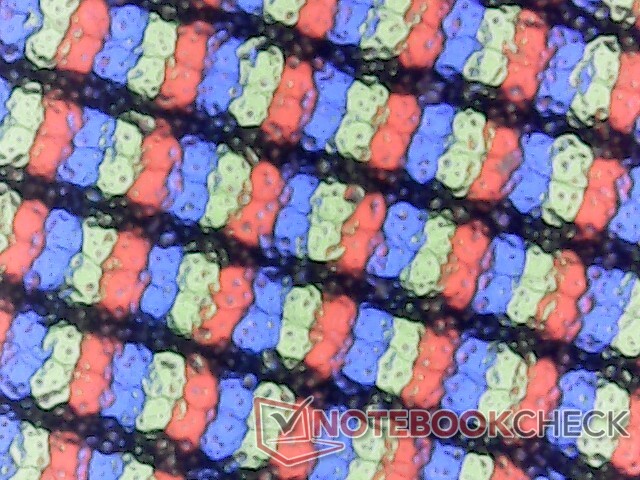
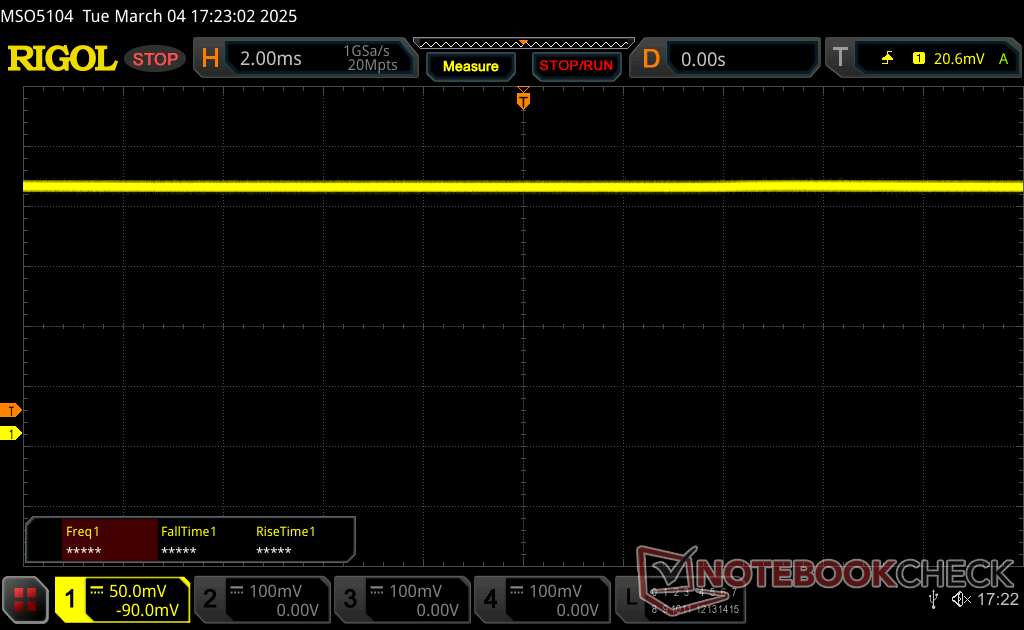
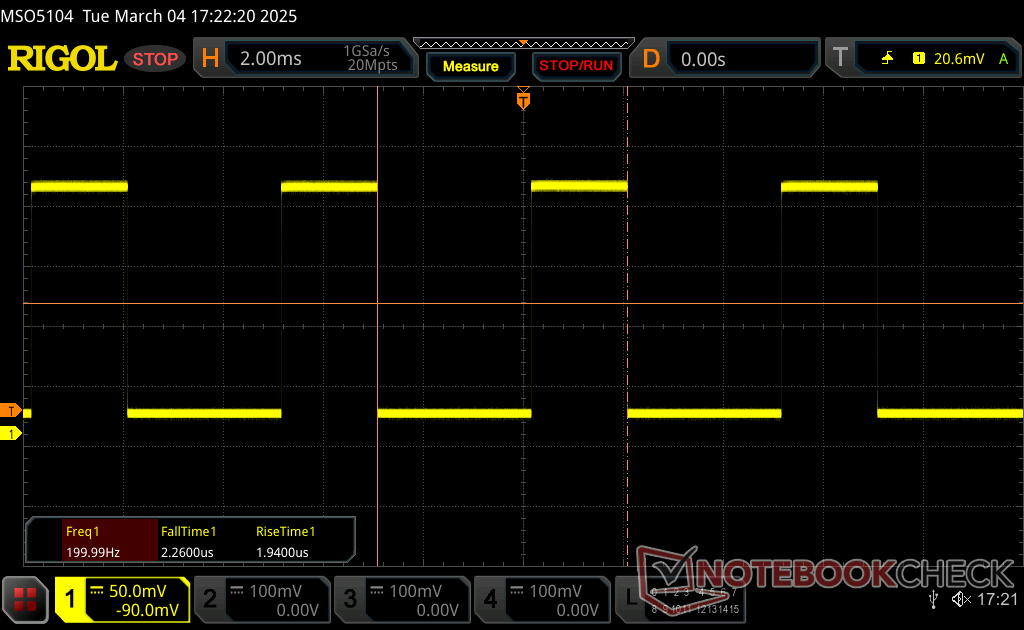
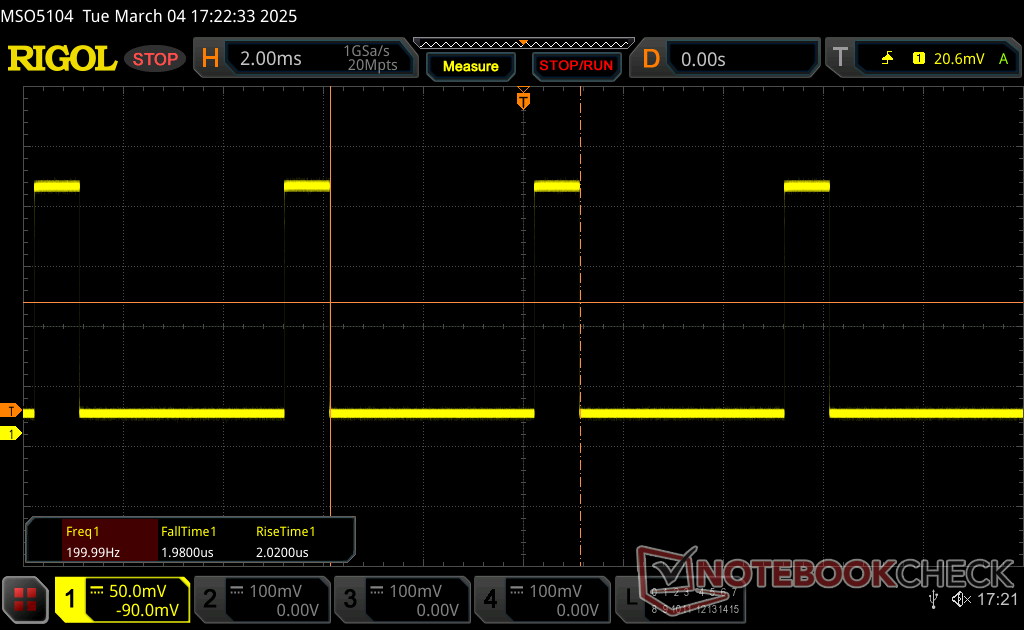
Screen Flickering / PWM (Pulse-Width Modulation)
| Screen flickering / PWM detected | 200 Hz Amplitude: 50 % | ≤ 99 % brightness setting | 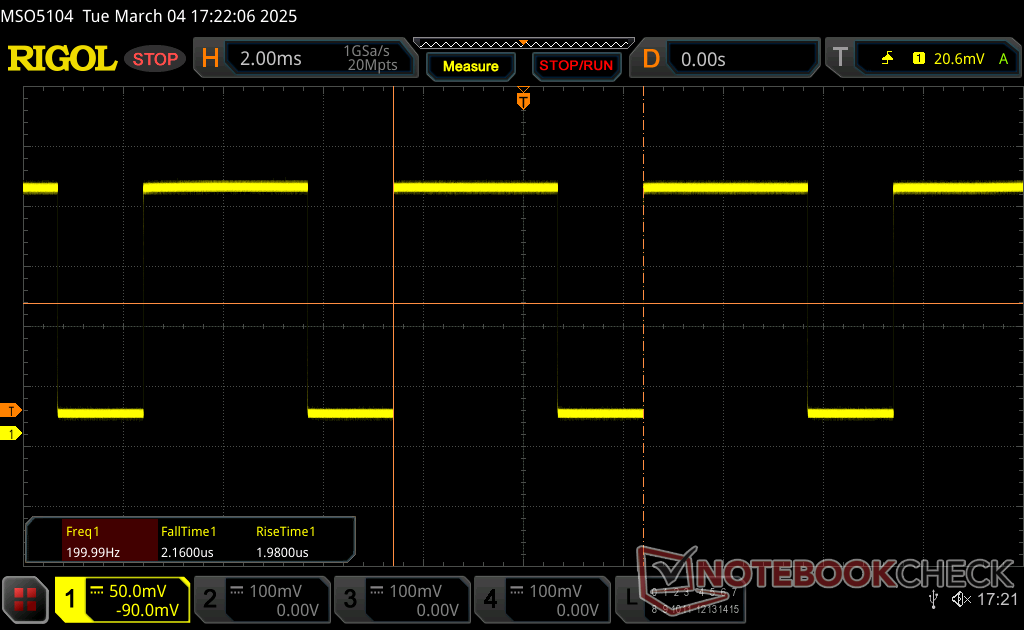 |
The display backlight flickers at 200 Hz (worst case, e.g., utilizing PWM) Flickering detected at a brightness setting of 99 % and below. There should be no flickering or PWM above this brightness setting. The frequency of 200 Hz is relatively low, so sensitive users will likely notice flickering and experience eyestrain at the stated brightness setting and below. In comparison: 52 % of all tested devices do not use PWM to dim the display. If PWM was detected, an average of 7772 (minimum: 5 - maximum: 343500) Hz was measured. | |||
PWM is present on all brightness levels except the maximum.
Performance
Testing Conditions
We set Windows to Performance mode prior to running the benchmarks below.
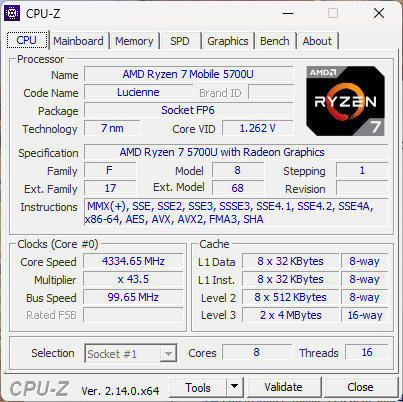
Processor
Performance is poor even when compared to other laptops with the same Ryzen 7 5700U CPU. The Ninkear A15 Plus, for example, runs 60 percent faster than our Thinkeagle with the exact same AMD processor.
Cinebench R15 Multi Loop
Cinebench R23: Multi Core | Single Core
Cinebench R20: CPU (Multi Core) | CPU (Single Core)
Cinebench R15: CPU Multi 64Bit | CPU Single 64Bit
Blender: v2.79 BMW27 CPU
7-Zip 18.03: 7z b 4 | 7z b 4 -mmt1
Geekbench 6.7: Multi-Core | Single-Core
Geekbench 5.5: Multi-Core | Single-Core
HWBOT x265 Benchmark v2.2: 4k Preset
LibreOffice : 20 Documents To PDF
R Benchmark 2.5: Overall mean
| CPU Performance rating | |
| Lenovo IdeaPad Gaming 3 15ARH7 -2! | |
| Acer Aspire Vero AV15-53P | |
| Lenovo IdeaPad 3 15ABA7 -2! | |
| Eurocom C315 Blitz | |
| Ninkear A15 Plus (16+512) | |
| Average AMD Ryzen 7 5700U | |
| Lenovo V15 G2 ALC-82KD003XGE -3! | |
| HP 250 G9 7N029ES | |
| Thinkeagle VigoBook G7 | |
| Dell Latitude 3520 -2! | |
| Lenovo ThinkPad L15 G2-20X4S0KU00 -2! | |
| ACEMagician Ace AX15, N95 | |
| Geekbench 6.7 / Multi-Core | |
| Eurocom C315 Blitz | |
| Acer Aspire Vero AV15-53P | |
| Ninkear A15 Plus (16+512) | |
| Ninkear A15 Plus (16+512) | |
| Average AMD Ryzen 7 5700U (4983 - 6260, n=5) | |
| HP 250 G9 7N029ES | |
| Thinkeagle VigoBook G7 | |
| ACEMagician Ace AX15, N95 | |
| Geekbench 6.7 / Single-Core | |
| Eurocom C315 Blitz | |
| Acer Aspire Vero AV15-53P | |
| HP 250 G9 7N029ES | |
| Ninkear A15 Plus (16+512) | |
| Ninkear A15 Plus (16+512) | |
| Thinkeagle VigoBook G7 | |
| Average AMD Ryzen 7 5700U (1550 - 1625, n=5) | |
| ACEMagician Ace AX15, N95 | |
* ... smaller is better
AIDA64: FP32 Ray-Trace | FPU Julia | CPU SHA3 | CPU Queen | FPU SinJulia | FPU Mandel | CPU AES | CPU ZLib | FP64 Ray-Trace | CPU PhotoWorxx
| Performance rating | |
| Ninkear A15 Plus (16+512) | |
| Average AMD Ryzen 7 5700U | |
| Lenovo IdeaPad 3 15ABA7 | |
| Acer Aspire Vero AV15-53P | |
| Thinkeagle VigoBook G7 | |
| Dell Latitude 3520 | |
| HP 250 G9 7N029ES | |
| AIDA64 / FP32 Ray-Trace | |
| Ninkear A15 Plus (16+512) | |
| Average AMD Ryzen 7 5700U (5679 - 12346, n=20) | |
| Lenovo IdeaPad 3 15ABA7 | |
| Acer Aspire Vero AV15-53P | |
| Dell Latitude 3520 | |
| Thinkeagle VigoBook G7 | |
| HP 250 G9 7N029ES | |
| AIDA64 / FPU Julia | |
| Lenovo IdeaPad 3 15ABA7 | |
| Average AMD Ryzen 7 5700U (39042 - 69580, n=20) | |
| Ninkear A15 Plus (16+512) | |
| Thinkeagle VigoBook G7 | |
| Acer Aspire Vero AV15-53P | |
| Dell Latitude 3520 | |
| HP 250 G9 7N029ES | |
| AIDA64 / CPU SHA3 | |
| Lenovo IdeaPad 3 15ABA7 | |
| Ninkear A15 Plus (16+512) | |
| Average AMD Ryzen 7 5700U (1103 - 2231, n=20) | |
| Acer Aspire Vero AV15-53P | |
| Dell Latitude 3520 | |
| Thinkeagle VigoBook G7 | |
| HP 250 G9 7N029ES | |
| AIDA64 / CPU Queen | |
| Ninkear A15 Plus (16+512) | |
| Average AMD Ryzen 7 5700U (57016 - 99178, n=20) | |
| Lenovo IdeaPad 3 15ABA7 | |
| Thinkeagle VigoBook G7 | |
| Acer Aspire Vero AV15-53P | |
| Dell Latitude 3520 | |
| HP 250 G9 7N029ES | |
| AIDA64 / FPU SinJulia | |
| Ninkear A15 Plus (16+512) | |
| Average AMD Ryzen 7 5700U (6837 - 14169, n=20) | |
| Thinkeagle VigoBook G7 | |
| Lenovo IdeaPad 3 15ABA7 | |
| Acer Aspire Vero AV15-53P | |
| Dell Latitude 3520 | |
| HP 250 G9 7N029ES | |
| AIDA64 / FPU Mandel | |
| Lenovo IdeaPad 3 15ABA7 | |
| Average AMD Ryzen 7 5700U (20179 - 36523, n=20) | |
| Ninkear A15 Plus (16+512) | |
| Acer Aspire Vero AV15-53P | |
| Thinkeagle VigoBook G7 | |
| Dell Latitude 3520 | |
| HP 250 G9 7N029ES | |
| AIDA64 / CPU AES | |
| Lenovo IdeaPad 3 15ABA7 | |
| Dell Latitude 3520 | |
| Ninkear A15 Plus (16+512) | |
| Average AMD Ryzen 7 5700U (26066 - 64646, n=20) | |
| Acer Aspire Vero AV15-53P | |
| Thinkeagle VigoBook G7 | |
| HP 250 G9 7N029ES | |
| AIDA64 / CPU ZLib | |
| Average AMD Ryzen 7 5700U (440 - 776, n=20) | |
| Ninkear A15 Plus (16+512) | |
| Lenovo IdeaPad 3 15ABA7 | |
| Acer Aspire Vero AV15-53P | |
| Thinkeagle VigoBook G7 | |
| Dell Latitude 3520 | |
| HP 250 G9 7N029ES | |
| AIDA64 / FP64 Ray-Trace | |
| Ninkear A15 Plus (16+512) | |
| Average AMD Ryzen 7 5700U (2985 - 6784, n=20) | |
| Lenovo IdeaPad 3 15ABA7 | |
| Acer Aspire Vero AV15-53P | |
| Dell Latitude 3520 | |
| Thinkeagle VigoBook G7 | |
| HP 250 G9 7N029ES | |
| AIDA64 / CPU PhotoWorxx | |
| Acer Aspire Vero AV15-53P | |
| Average AMD Ryzen 7 5700U (6903 - 25066, n=20) | |
| Lenovo IdeaPad 3 15ABA7 | |
| HP 250 G9 7N029ES | |
| Ninkear A15 Plus (16+512) | |
| Thinkeagle VigoBook G7 | |
| Dell Latitude 3520 | |
System Performance
CrossMark: Overall | Productivity | Creativity | Responsiveness
WebXPRT 3: Overall
WebXPRT 4: Overall
Mozilla Kraken 1.1: Total
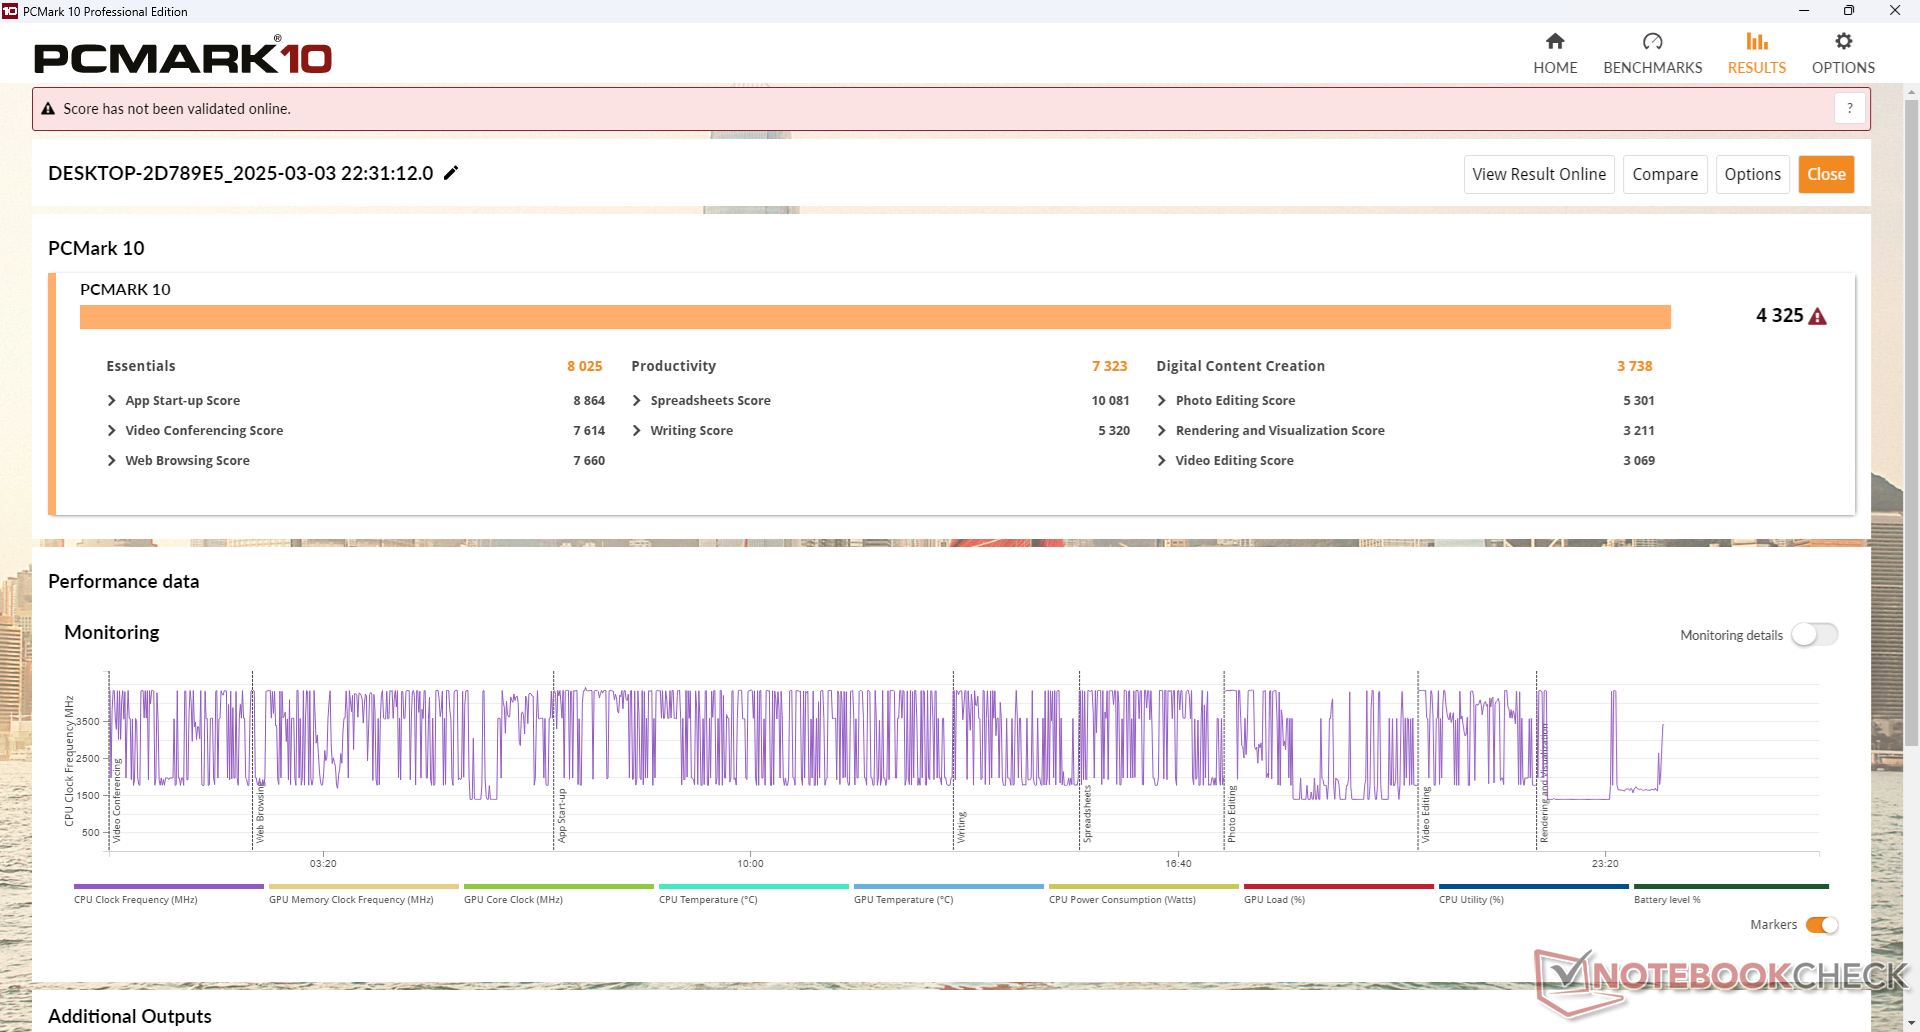
| PCMark 10 / Score | |
| Lenovo IdeaPad 3 15ABA7 | |
| Acer Aspire Vero AV15-53P | |
| Average AMD Ryzen 7 5700U, AMD Radeon RX Vega 8 (Ryzen 4000/5000) (4325 - 5518, n=15) | |
| Ninkear A15 Plus (16+512) | |
| HP 250 G9 7N029ES | |
| Dell Latitude 3520 | |
| Thinkeagle VigoBook G7 | |
| PCMark 10 / Essentials | |
| Acer Aspire Vero AV15-53P | |
| Lenovo IdeaPad 3 15ABA7 | |
| HP 250 G9 7N029ES | |
| Average AMD Ryzen 7 5700U, AMD Radeon RX Vega 8 (Ryzen 4000/5000) (8025 - 10091, n=15) | |
| Dell Latitude 3520 | |
| Ninkear A15 Plus (16+512) | |
| Thinkeagle VigoBook G7 | |
| PCMark 10 / Productivity | |
| Lenovo IdeaPad 3 15ABA7 | |
| Average AMD Ryzen 7 5700U, AMD Radeon RX Vega 8 (Ryzen 4000/5000) (7001 - 8457, n=15) | |
| Acer Aspire Vero AV15-53P | |
| Ninkear A15 Plus (16+512) | |
| Thinkeagle VigoBook G7 | |
| HP 250 G9 7N029ES | |
| Dell Latitude 3520 | |
| PCMark 10 / Digital Content Creation | |
| Acer Aspire Vero AV15-53P | |
| Lenovo IdeaPad 3 15ABA7 | |
| Average AMD Ryzen 7 5700U, AMD Radeon RX Vega 8 (Ryzen 4000/5000) (3738 - 5964, n=15) | |
| Ninkear A15 Plus (16+512) | |
| Dell Latitude 3520 | |
| HP 250 G9 7N029ES | |
| Thinkeagle VigoBook G7 | |
| CrossMark / Overall | |
| Acer Aspire Vero AV15-53P | |
| Lenovo IdeaPad 3 15ABA7 | |
| HP 250 G9 7N029ES | |
| Dell Latitude 3520 | |
| Ninkear A15 Plus (16+512) | |
| Average AMD Ryzen 7 5700U, AMD Radeon RX Vega 8 (Ryzen 4000/5000) (866 - 1183, n=8) | |
| Thinkeagle VigoBook G7 | |
| CrossMark / Productivity | |
| Acer Aspire Vero AV15-53P | |
| Lenovo IdeaPad 3 15ABA7 | |
| HP 250 G9 7N029ES | |
| Dell Latitude 3520 | |
| Ninkear A15 Plus (16+512) | |
| Average AMD Ryzen 7 5700U, AMD Radeon RX Vega 8 (Ryzen 4000/5000) (931 - 1191, n=8) | |
| Thinkeagle VigoBook G7 | |
| CrossMark / Creativity | |
| Acer Aspire Vero AV15-53P | |
| Lenovo IdeaPad 3 15ABA7 | |
| HP 250 G9 7N029ES | |
| Ninkear A15 Plus (16+512) | |
| Average AMD Ryzen 7 5700U, AMD Radeon RX Vega 8 (Ryzen 4000/5000) (907 - 1197, n=8) | |
| Dell Latitude 3520 | |
| Thinkeagle VigoBook G7 | |
| CrossMark / Responsiveness | |
| Acer Aspire Vero AV15-53P | |
| Dell Latitude 3520 | |
| Lenovo IdeaPad 3 15ABA7 | |
| HP 250 G9 7N029ES | |
| Ninkear A15 Plus (16+512) | |
| Average AMD Ryzen 7 5700U, AMD Radeon RX Vega 8 (Ryzen 4000/5000) (605 - 1159, n=8) | |
| Thinkeagle VigoBook G7 | |
| WebXPRT 3 / Overall | |
| HP 250 G9 7N029ES | |
| Acer Aspire Vero AV15-53P | |
| Lenovo IdeaPad 3 15ABA7 | |
| Dell Latitude 3520 | |
| Average AMD Ryzen 7 5700U, AMD Radeon RX Vega 8 (Ryzen 4000/5000) (197.4 - 222, n=14) | |
| Thinkeagle VigoBook G7 | |
| WebXPRT 4 / Overall | |
| HP 250 G9 7N029ES | |
| Acer Aspire Vero AV15-53P | |
| Ninkear A15 Plus (16+512) | |
| Lenovo IdeaPad 3 15ABA7 | |
| Average AMD Ryzen 7 5700U, AMD Radeon RX Vega 8 (Ryzen 4000/5000) (158.5 - 225, n=5) | |
| Dell Latitude 3520 | |
| Thinkeagle VigoBook G7 | |
| Mozilla Kraken 1.1 / Total | |
| Thinkeagle VigoBook G7 | |
| Average AMD Ryzen 7 5700U, AMD Radeon RX Vega 8 (Ryzen 4000/5000) (791 - 835, n=15) | |
| Dell Latitude 3520 | |
| Lenovo IdeaPad 3 15ABA7 | |
| HP 250 G9 7N029ES | |
| Acer Aspire Vero AV15-53P | |
* ... smaller is better
| PCMark 10 Score | 4325 points | |
Help | ||
| AIDA64 / Memory Copy | |
| Acer Aspire Vero AV15-53P | |
| Lenovo IdeaPad 3 15ABA7 | |
| Average AMD Ryzen 7 5700U (15867 - 39326, n=20) | |
| HP 250 G9 7N029ES | |
| Ninkear A15 Plus (16+512) | |
| Thinkeagle VigoBook G7 | |
| Dell Latitude 3520 | |
| AIDA64 / Memory Read | |
| Acer Aspire Vero AV15-53P | |
| Average AMD Ryzen 7 5700U (17632 - 47190, n=20) | |
| Lenovo IdeaPad 3 15ABA7 | |
| Ninkear A15 Plus (16+512) | |
| Thinkeagle VigoBook G7 | |
| HP 250 G9 7N029ES | |
| Dell Latitude 3520 | |
| AIDA64 / Memory Write | |
| Acer Aspire Vero AV15-53P | |
| Average AMD Ryzen 7 5700U (11554 - 47048, n=20) | |
| Lenovo IdeaPad 3 15ABA7 | |
| Ninkear A15 Plus (16+512) | |
| Thinkeagle VigoBook G7 | |
| HP 250 G9 7N029ES | |
| Dell Latitude 3520 | |
| AIDA64 / Memory Latency | |
| Acer Aspire Vero AV15-53P | |
| Lenovo IdeaPad 3 15ABA7 | |
| Average AMD Ryzen 7 5700U (84.9 - 113, n=20) | |
| Thinkeagle VigoBook G7 | |
| Ninkear A15 Plus (16+512) | |
| Dell Latitude 3520 | |
| HP 250 G9 7N029ES | |
* ... smaller is better
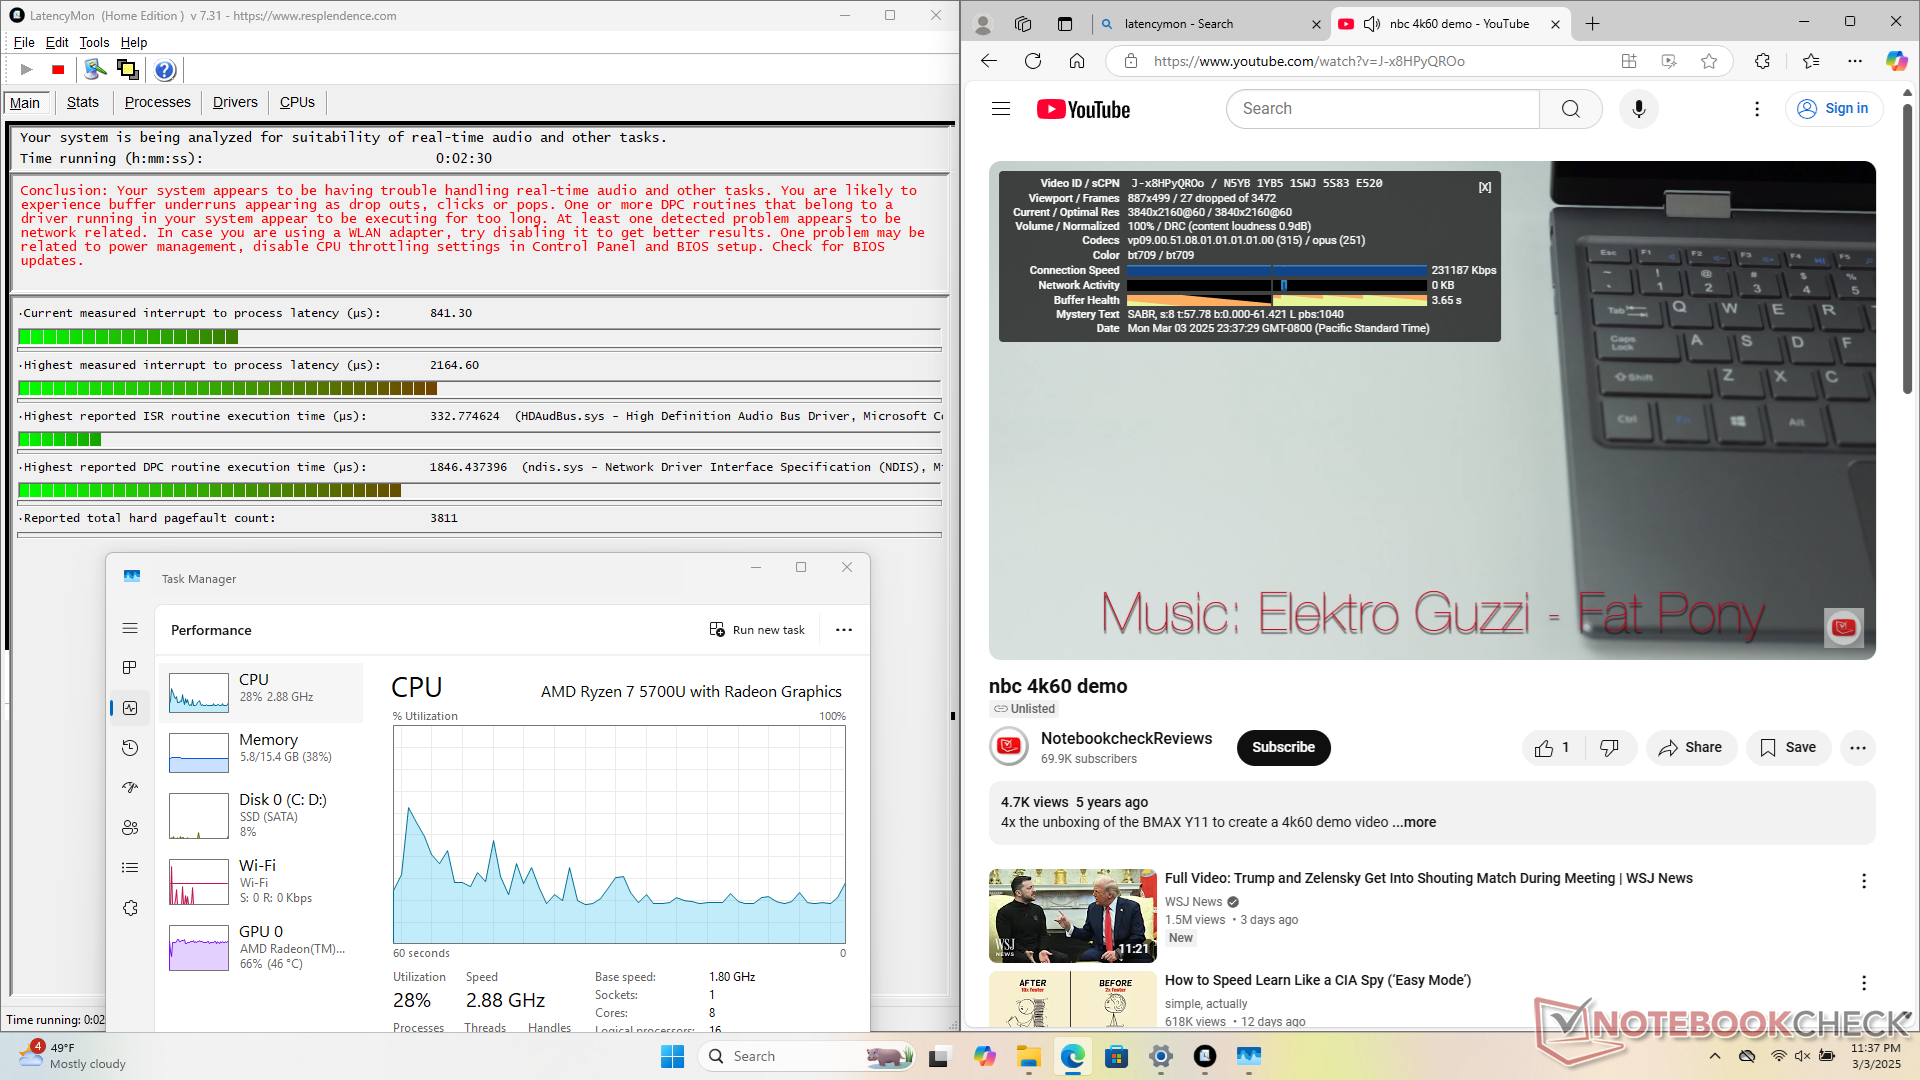
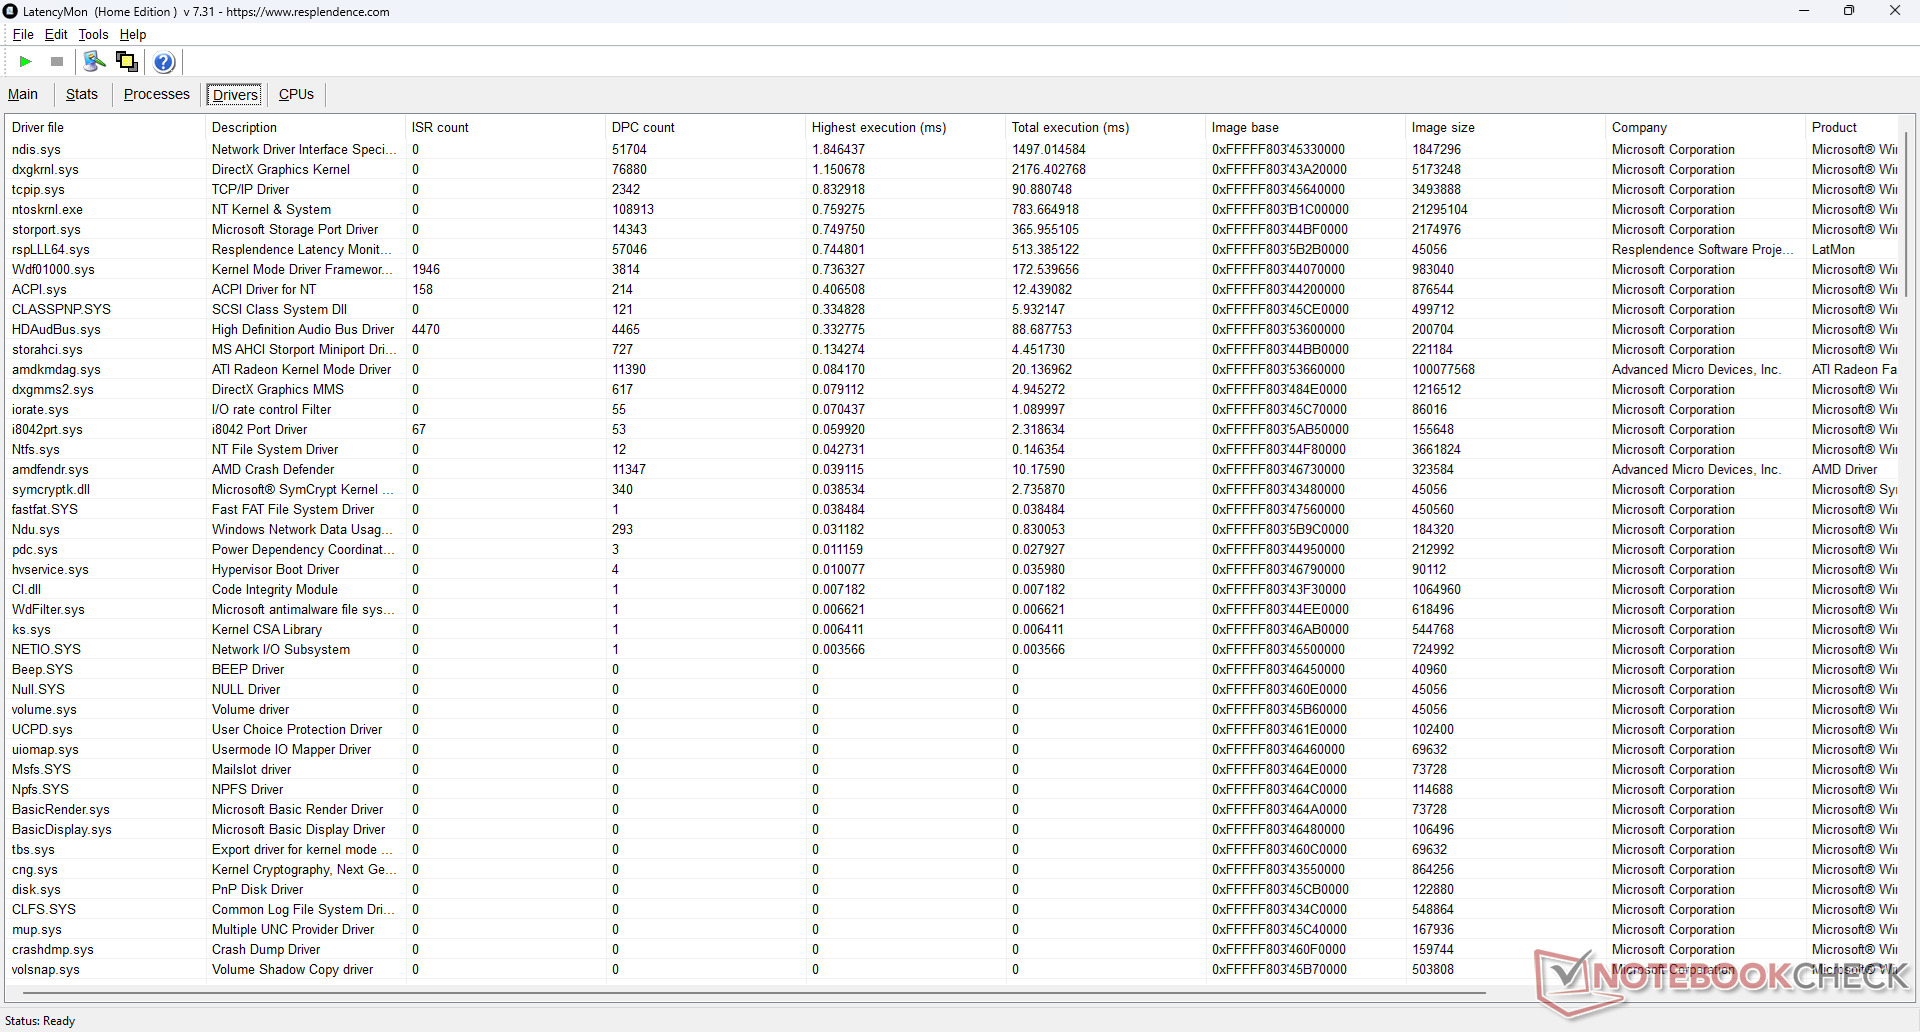
DPC Latency
LatencyMon reveals both DPC issues and dropped frames when playing 4K60 video even after repeat testing.
| DPC Latencies / LatencyMon - interrupt to process latency (max), Web, Youtube, Prime95 | |
| Ninkear A15 Plus (16+512) | |
| Thinkeagle VigoBook G7 | |
| HP 250 G9 7N029ES | |
| Dell Latitude 3520 | |
| Lenovo IdeaPad 3 15ABA7 | |
| Acer Aspire Vero AV15-53P | |
* ... smaller is better
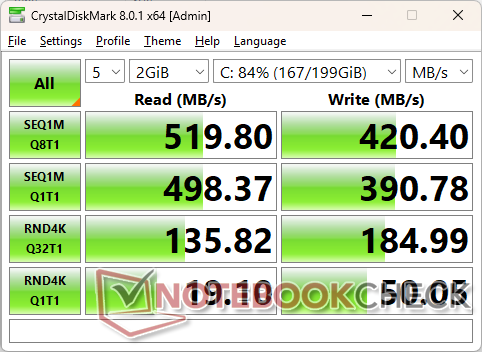
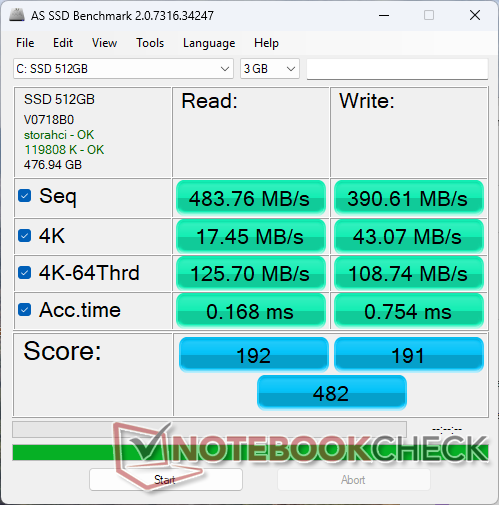
Storage Devices
The system ships with a SATA III M.2 SSD instead of the usual PCIe4 drive to save on costs.

| Drive Performance rating - Percent | |
| Acer Aspire Vero AV15-53P | |
| Ninkear A15 Plus (16+512) | |
| Lenovo IdeaPad 3 15ABA7 | |
| Dell Latitude 3520 | |
| HP 250 G9 7N029ES | |
| Thinkeagle VigoBook G7 | |
* ... smaller is better
Disk Throttling: DiskSpd Read Loop, Queue Depth 8
GPU Performance
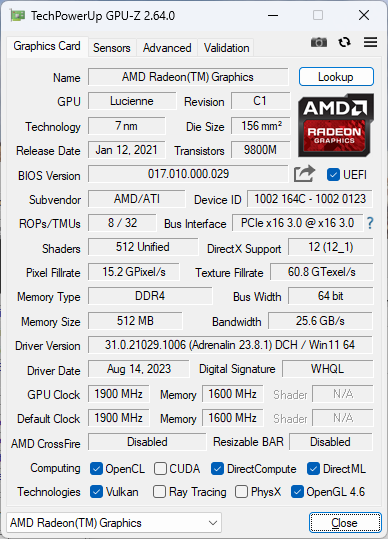
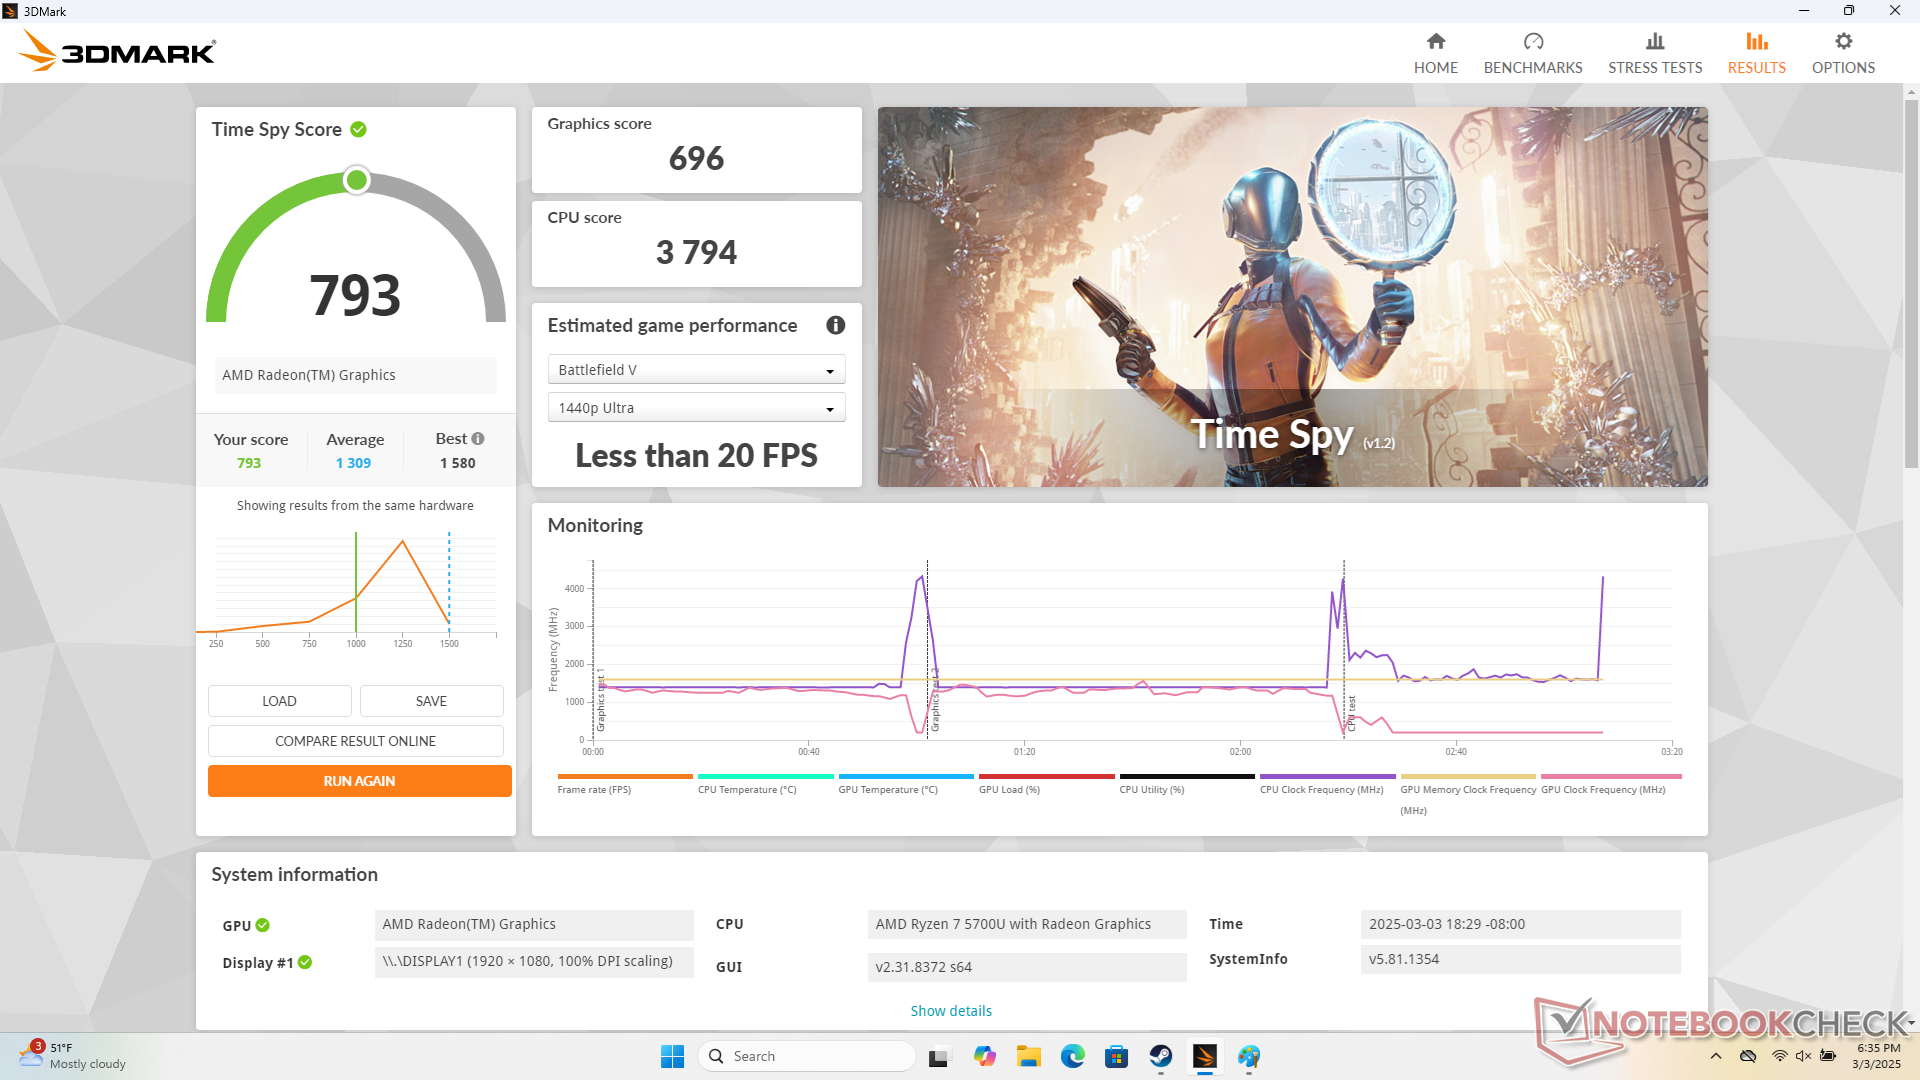
Graphics performance is roughly 35 percent slower than the average laptop in our database with the same integrated Radeon RX Vega 8 GPU. This is due to the slower-than-average processor performance mentioned above and the single-channel RAM configuration of our review unit.
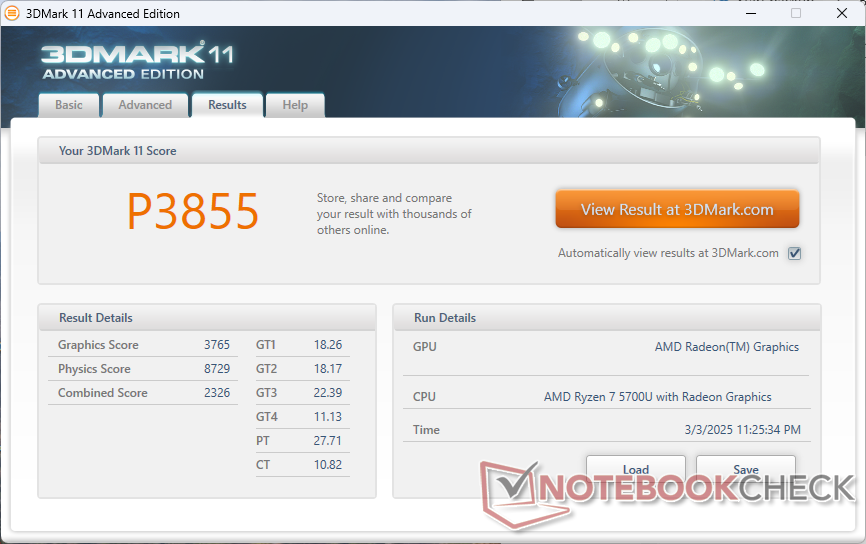
| 3DMark 11 Performance | 3855 points | |
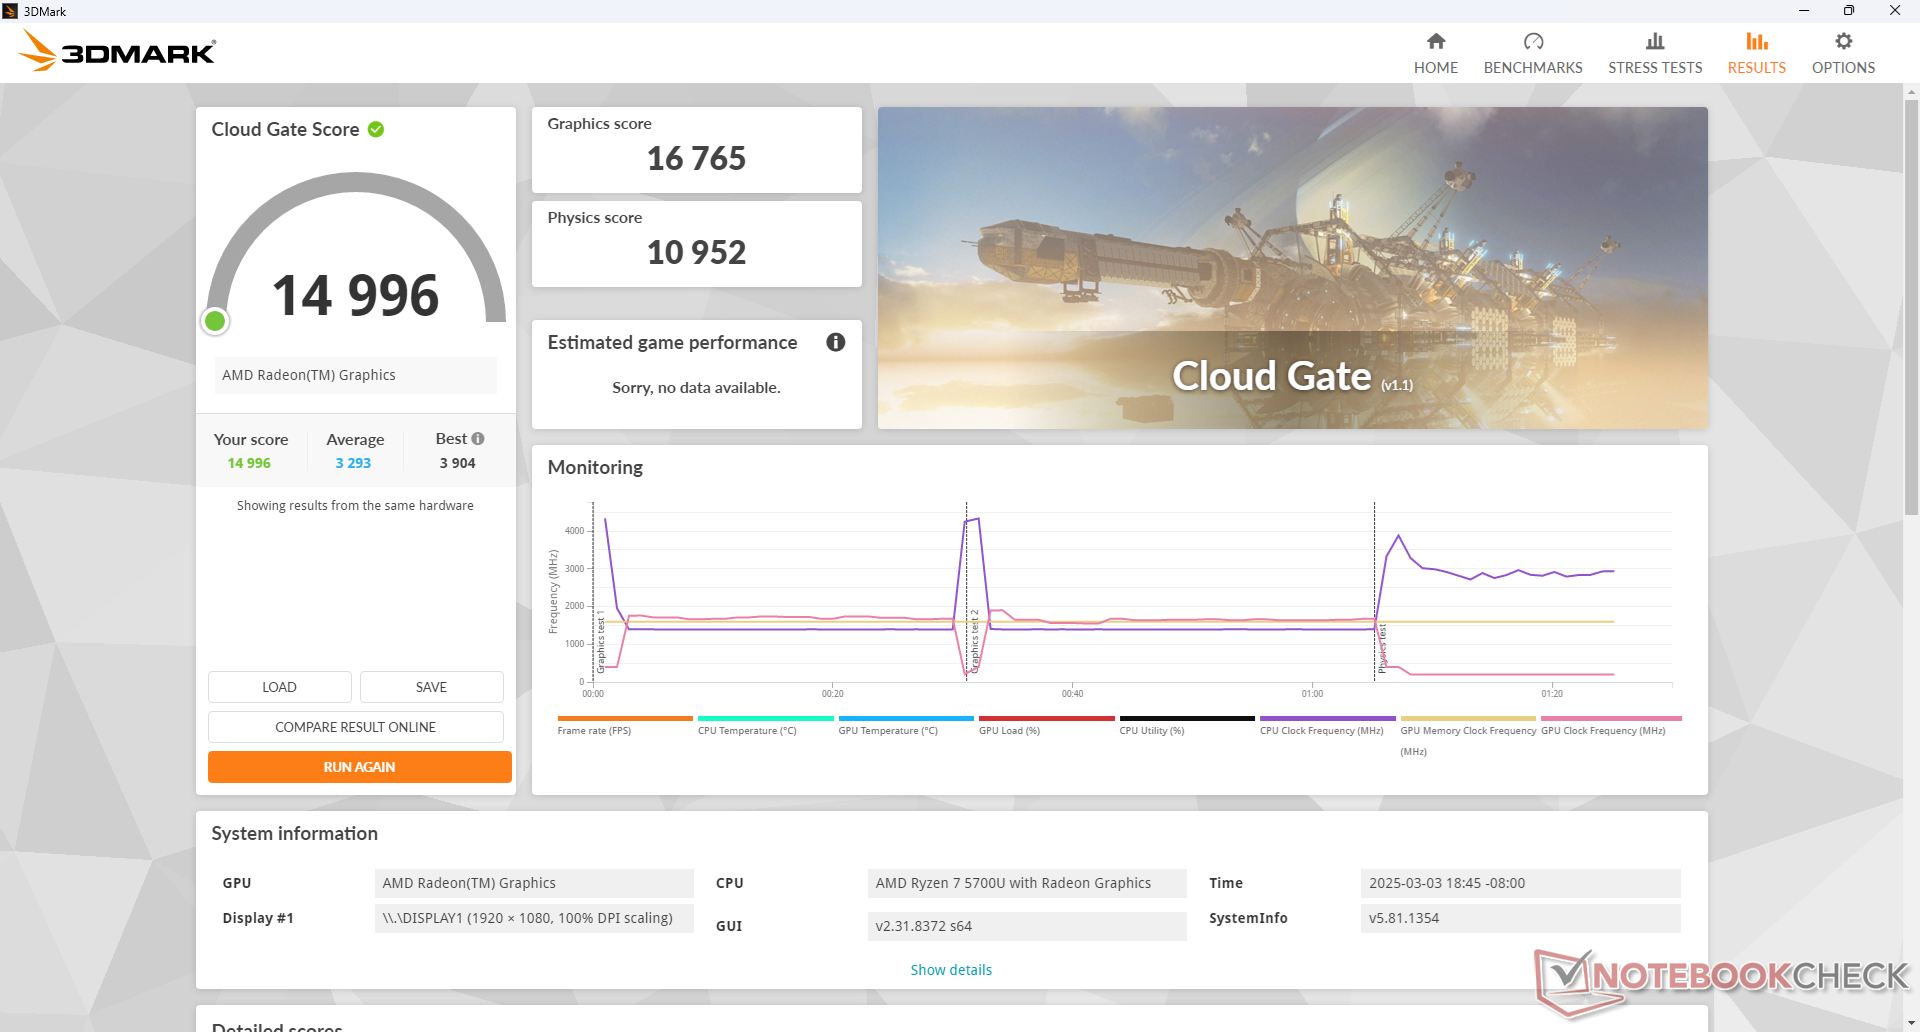
| 3DMark Cloud Gate Standard Score | 14996 points | |
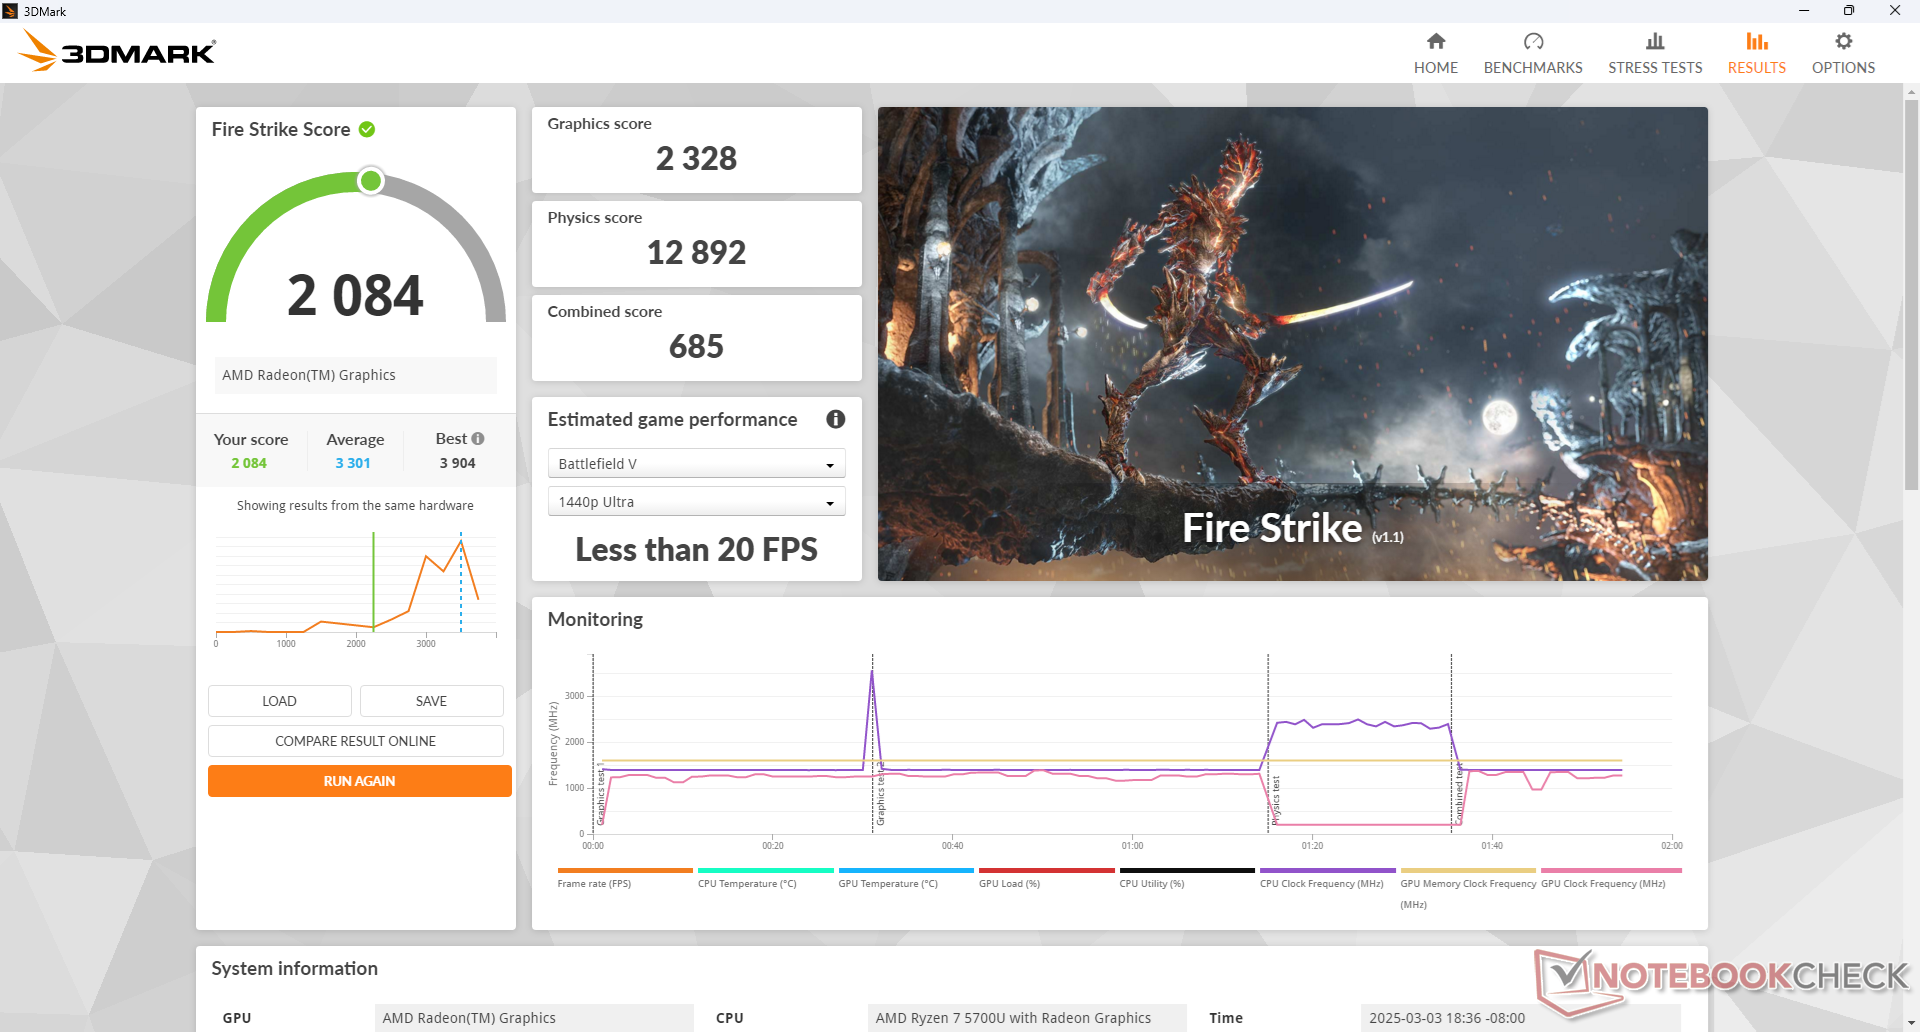
| 3DMark Fire Strike Score | 2084 points | |
| 3DMark Time Spy Score | 793 points | |
Help | ||
* ... smaller is better
| Tiny Tina's Wonderlands | |
| 1280x720 Lowest Preset (DX12) | |
| Average AMD Radeon RX Vega 8 (Ryzen 4000/5000) (30.7 - 82.2, n=8) | |
| Eurocom C315 Blitz | |
| Thinkeagle VigoBook G7 | |
| 1920x1080 Low Preset (DX12) | |
| Average AMD Radeon RX Vega 8 (Ryzen 4000/5000) (16 - 38.4, n=8) | |
| Thinkeagle VigoBook G7 | |
| 1920x1080 Medium Preset (DX12) | |
| Average AMD Radeon RX Vega 8 (Ryzen 4000/5000) (12.1 - 29.1, n=8) | |
| Thinkeagle VigoBook G7 | |
| 1920x1080 High Preset (DX12) | |
| Average AMD Radeon RX Vega 8 (Ryzen 4000/5000) (7.7 - 18.6, n=8) | |
| Thinkeagle VigoBook G7 | |
| 1920x1080 Badass Preset (DX12) | |
| Average AMD Radeon RX Vega 8 (Ryzen 4000/5000) (5.5 - 15, n=8) | |
| Thinkeagle VigoBook G7 | |
| F1 22 | |
| 1280x720 Ultra Low Preset AA:T AF:16x | |
| Eurocom C315 Blitz | |
| Lenovo IdeaPad 3 15ABA7 | |
| Average AMD Radeon RX Vega 8 (Ryzen 4000/5000) (40.8 - 89.3, n=8) | |
| Thinkeagle VigoBook G7 | |
| 1920x1080 Low Preset AA:T AF:16x | |
| Eurocom C315 Blitz | |
| Average AMD Radeon RX Vega 8 (Ryzen 4000/5000) (22.1 - 48.8, n=12) | |
| Lenovo IdeaPad 3 15ABA7 | |
| Thinkeagle VigoBook G7 | |
| 1920x1080 Medium Preset AA:T AF:16x | |
| Eurocom C315 Blitz | |
| Average AMD Radeon RX Vega 8 (Ryzen 4000/5000) (19.7 - 42.4, n=13) | |
| Lenovo IdeaPad 3 15ABA7 | |
| Thinkeagle VigoBook G7 | |
| 1920x1080 High Preset AA:T AF:16x | |
| Eurocom C315 Blitz | |
| Lenovo IdeaPad 3 15ABA7 | |
| Average AMD Radeon RX Vega 8 (Ryzen 4000/5000) (15.1 - 31.2, n=11) | |
| Thinkeagle VigoBook G7 | |
| 1920x1080 Ultra High Preset AA:T AF:16x | |
| Eurocom C315 Blitz | |
| Average AMD Radeon RX Vega 8 (Ryzen 4000/5000) (11 - 22.5, n=8) | |
| Lenovo IdeaPad 3 15ABA7 | |
| Thinkeagle VigoBook G7 | |
Cyberpunk 2077 ultra FPS Chart
| low | med. | high | ultra | |
|---|---|---|---|---|
| Dota 2 Reborn (2015) | 77.2 | 56.8 | 32.2 | 30.3 |
| Final Fantasy XV Benchmark (2018) | 21.4 | 11.4 | 7.61 | |
| X-Plane 11.11 (2018) | 25.3 | 18.7 | 16.9 | |
| Strange Brigade (2018) | 45 | 18.5 | 15.7 | 13.3 |
| Tiny Tina's Wonderlands (2022) | 16 | 12.1 | 7.7 | 5.5 |
| F1 22 (2022) | 22.1 | 19.7 | 15.1 | 11 |
| Cyberpunk 2077 (2023) |
Emissions
System Noise
Fan noise is very quiet at just under 30 dB(A) even when running very demanding loads compared to 40 dB(A) or greater on most other laptops.
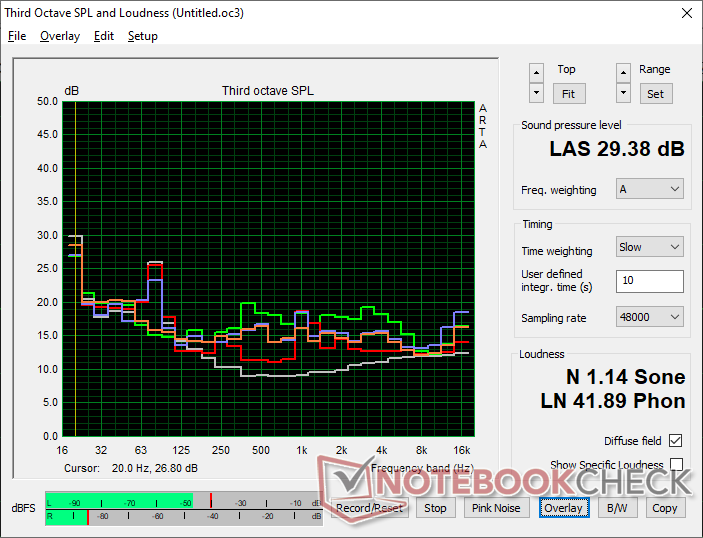
Noise level
| Idle |
| 22.9 / 22.9 / 26 dB(A) |
| Load |
| 27.3 / 29.4 dB(A) |
 | ||
30 dB silent 40 dB(A) audible 50 dB(A) loud |
||
min: | ||
| Thinkeagle VigoBook G7 Vega 8, R7 5700U | Ninkear A15 Plus (16+512) Vega 8, R7 5700U, GOFATOO P110E-512GB | Acer Aspire Vero AV15-53P Iris Xe G7 96EUs, i7-1355U, Kingston OM8SEP4512Q-AA | HP 250 G9 7N029ES UHD Graphics 64EUs, i3-1215U, SK hynix HFS512GEJ9X125N | Lenovo IdeaPad 3 15ABA7 Vega 7, R5 5625U, Micron 2450 512GB MTFDKCD512TFK | Dell Latitude 3520 Iris Xe G7 80EUs, i5-1135G7, Kioxia BG5 KBG50ZNS256G | |
|---|---|---|---|---|---|---|
| Noise | -14% | -21% | -25% | -29% | -16% | |
| off / environment * (dB) | 22.7 | 24.78 -9% | 25.89 -14% | 24.3 -7% | 26 -15% | 26 -15% |
| Idle Minimum * (dB) | 22.9 | 24.78 -8% | 26.68 -17% | 24.3 -6% | 26 -14% | 26 -14% |
| Idle Average * (dB) | 22.9 | 27.6 -21% | 26.04 -14% | 24.3 -6% | 26 -14% | 26 -14% |
| Idle Maximum * (dB) | 26 | 26.5 -2% | 26.05 -0% | 28.2 -8% | 26 -0% | 26 -0% |
| Load Average * (dB) | 27.3 | 34.38 -26% | 39.23 -44% | 45.2 -66% | 46 -68% | 31.1 -14% |
| Cyberpunk 2077 ultra * (dB) | 26.6 | |||||
| Load Maximum * (dB) | 29.4 | 34.58 -18% | 40.25 -37% | 45.2 -54% | 47.9 -63% | 41.5 -41% |
| Witcher 3 ultra * (dB) | 45.2 |
* ... smaller is better
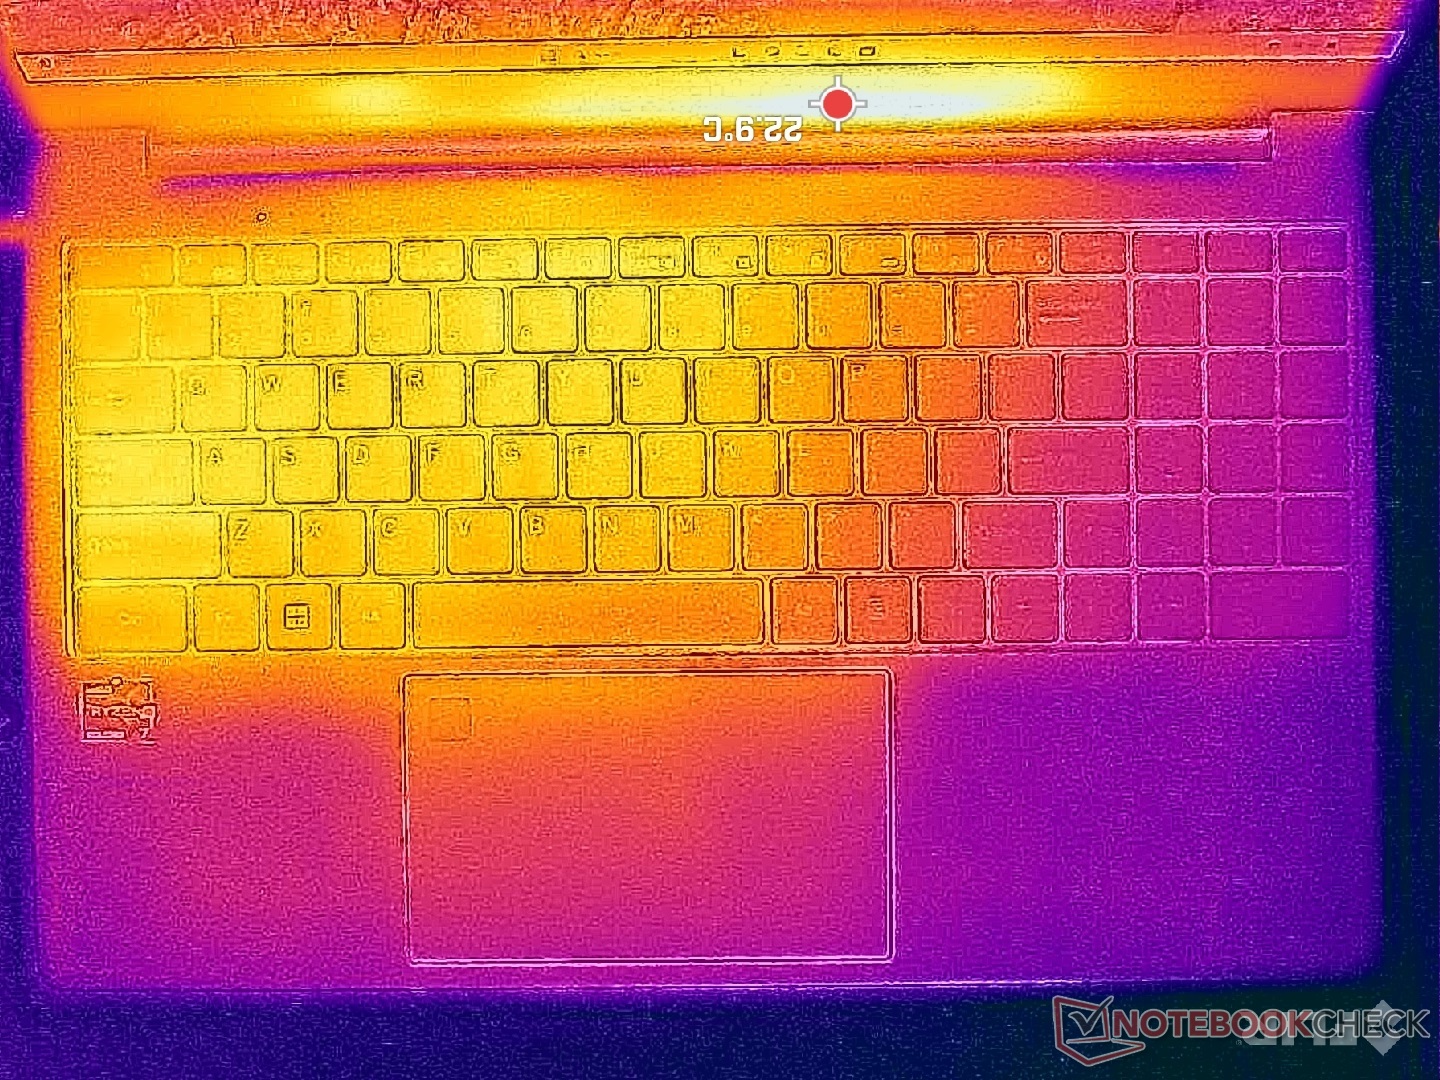
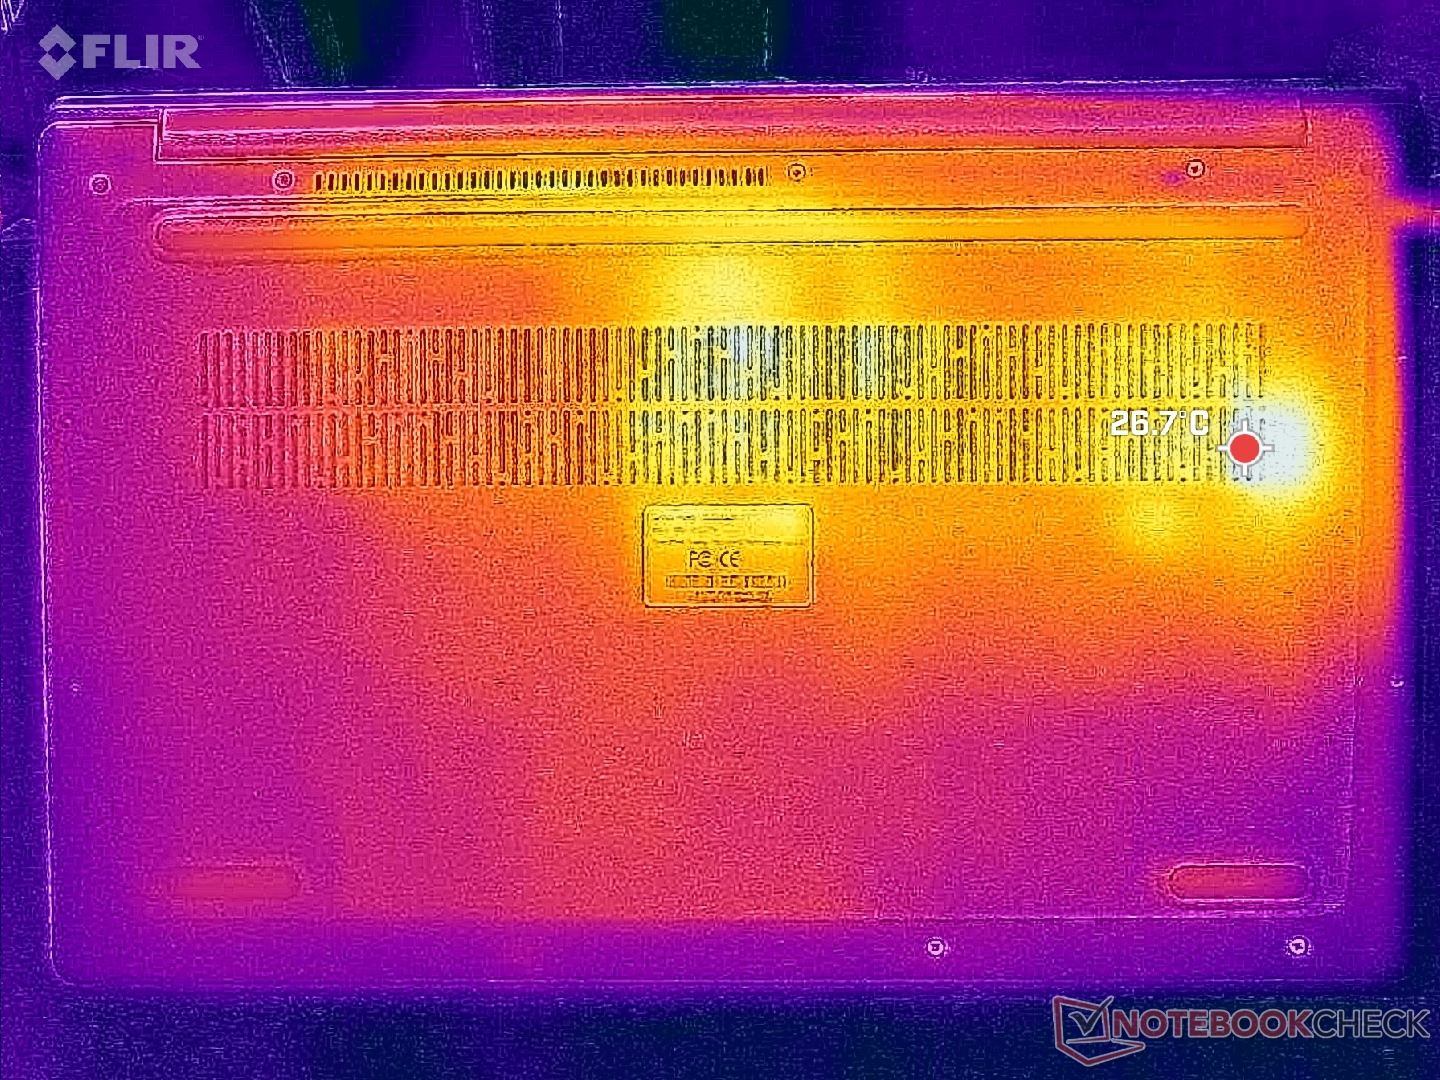
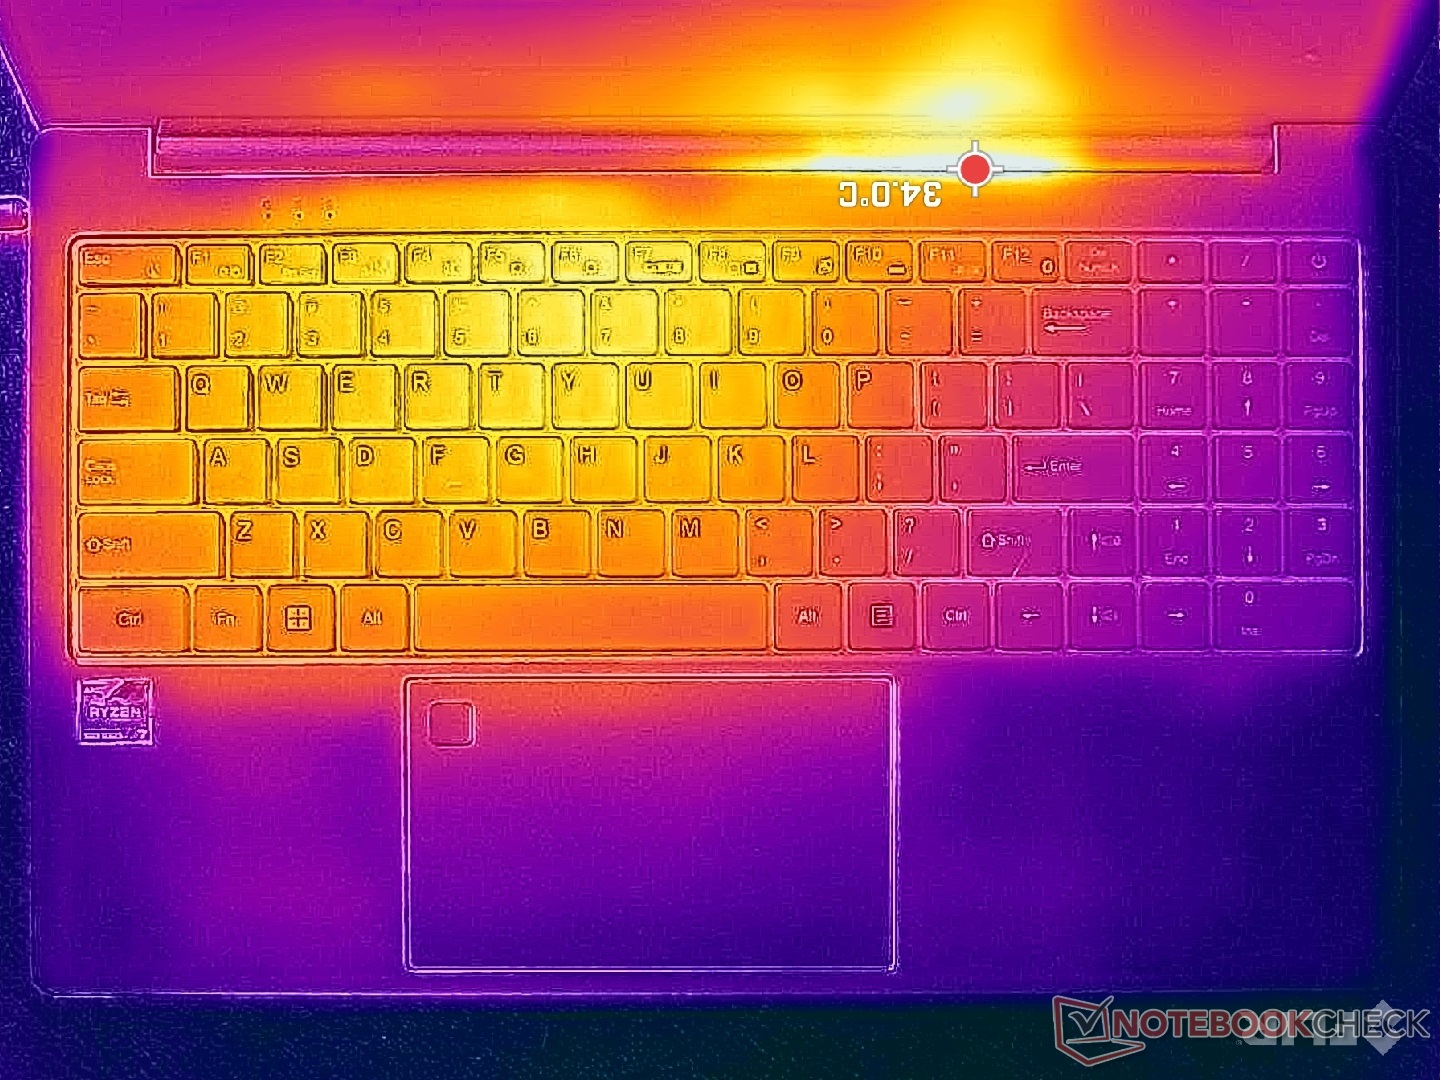
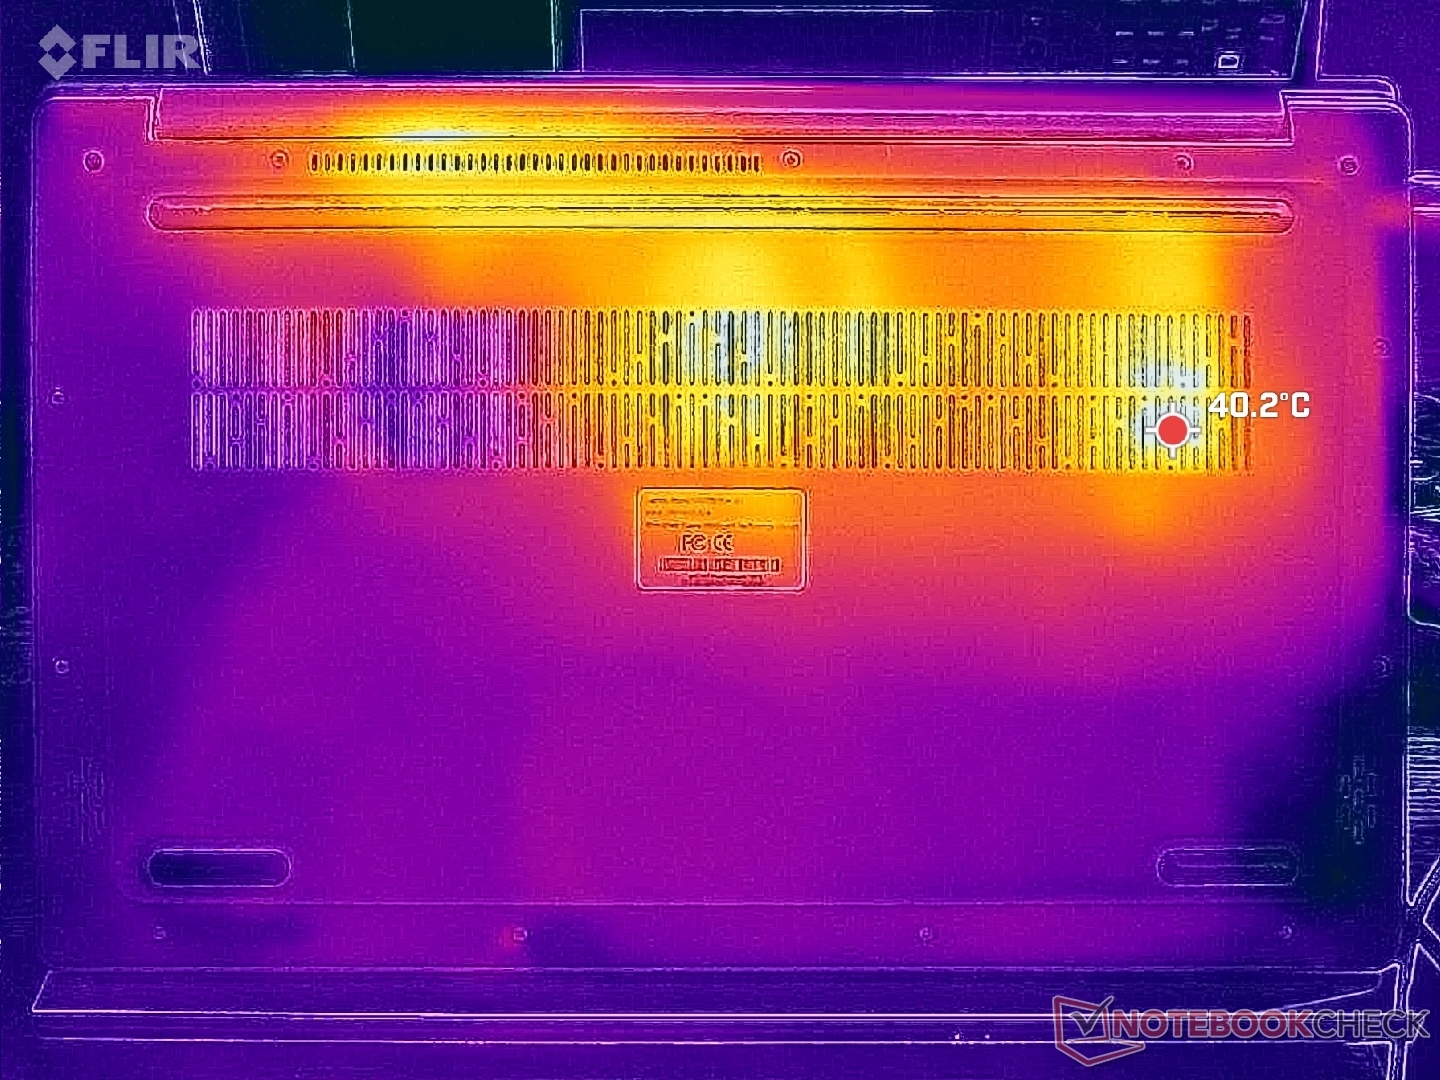
Temperature
Surface temperatures are warmer on the left half of the chassis than the right. Hot spots are otherwise tolerable at just 32 C to 37 C when running demanding loads like games.
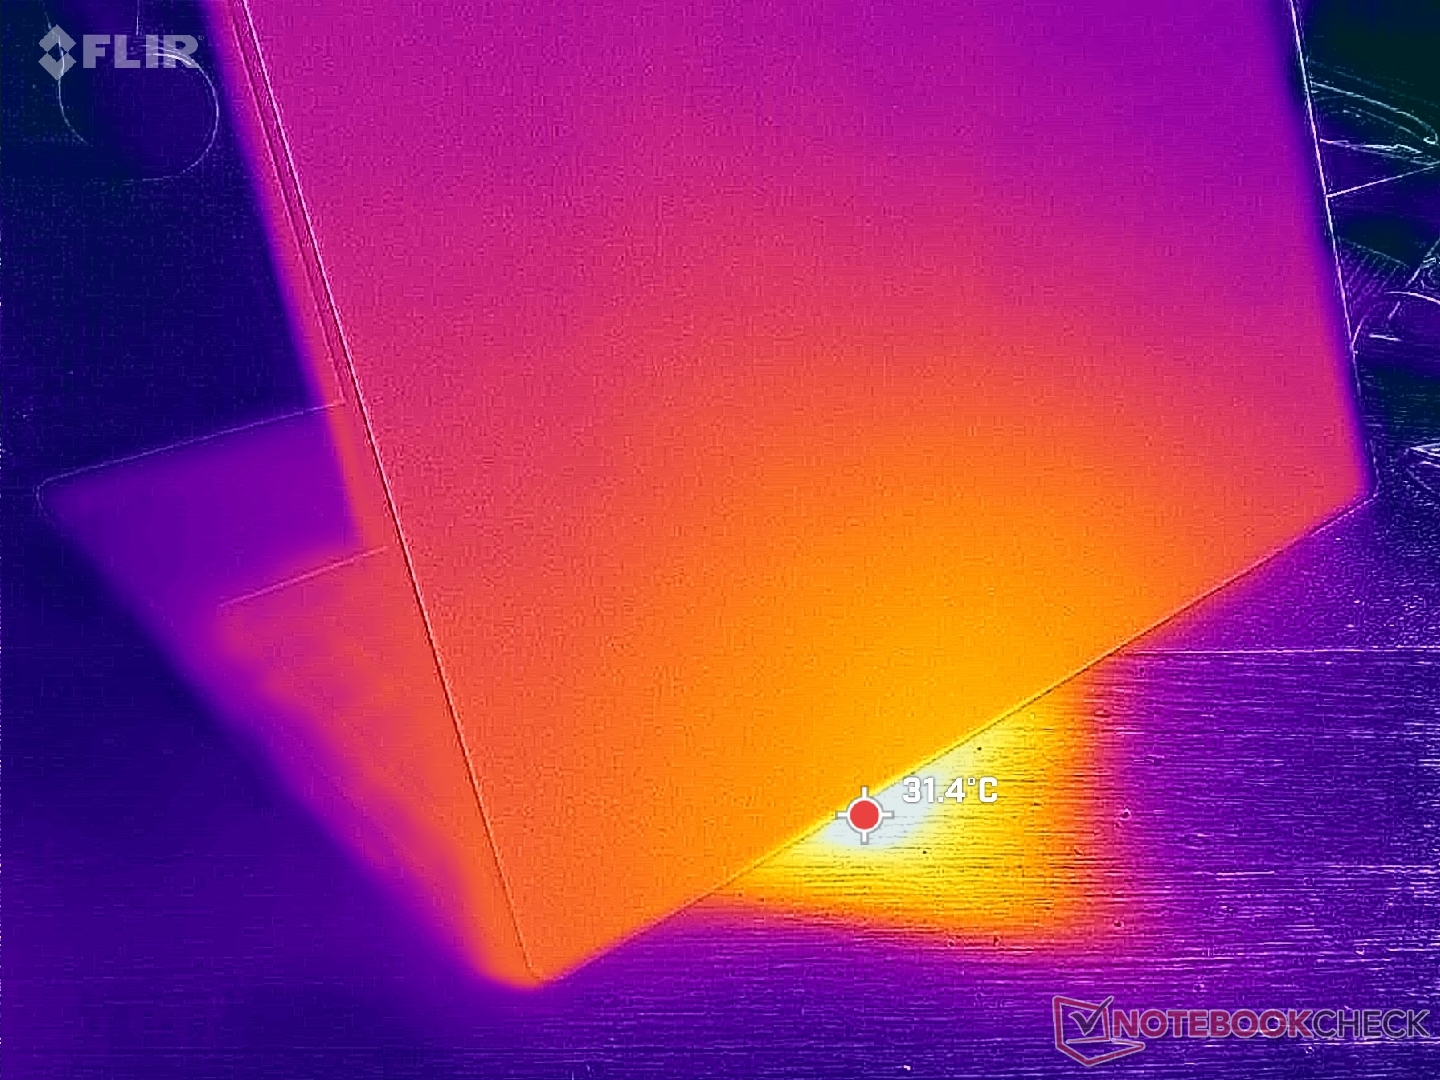
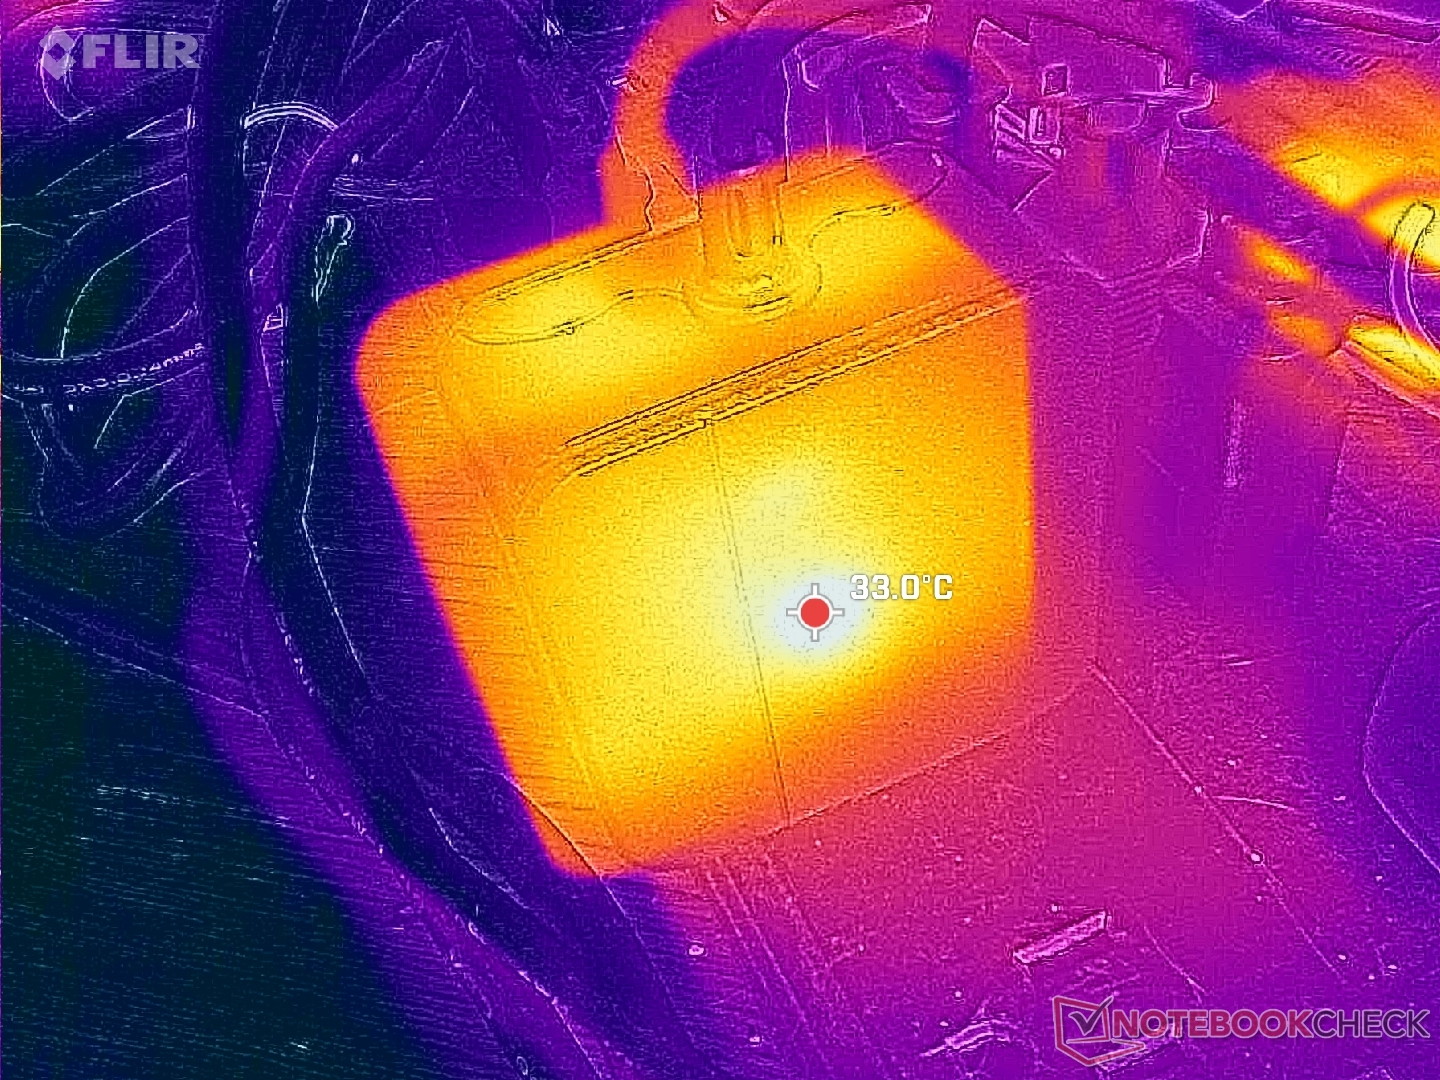
(+) The maximum temperature on the upper side is 31.8 °C / 89 F, compared to the average of 36.8 °C / 98 F, ranging from 21 to 71 °C for the class Multimedia.
(+) The bottom heats up to a maximum of 36.6 °C / 98 F, compared to the average of 39.1 °C / 102 F
(+) In idle usage, the average temperature for the upper side is 23.5 °C / 74 F, compared to the device average of 31.3 °C / 88 F.
(+) The palmrests and touchpad are cooler than skin temperature with a maximum of 22.8 °C / 73 F and are therefore cool to the touch.
(+) The average temperature of the palmrest area of similar devices was 28.7 °C / 83.7 F (+5.9 °C / 10.7 F).
| Thinkeagle VigoBook G7 AMD Ryzen 7 5700U, AMD Radeon RX Vega 8 (Ryzen 4000/5000) | Ninkear A15 Plus (16+512) AMD Ryzen 7 5700U, AMD Radeon RX Vega 8 (Ryzen 4000/5000) | Acer Aspire Vero AV15-53P Intel Core i7-1355U, Intel Iris Xe Graphics G7 96EUs | HP 250 G9 7N029ES Intel Core i3-1215U, Intel UHD Graphics 64EUs (Alder Lake 12th Gen) | Lenovo IdeaPad 3 15ABA7 AMD Ryzen 5 5625U, AMD Radeon RX Vega 7 | Dell Latitude 3520 Intel Core i5-1135G7, Intel Iris Xe Graphics G7 80EUs | |
|---|---|---|---|---|---|---|
| Heat | -1% | -22% | -9% | -15% | -21% | |
| Maximum Upper Side * (°C) | 31.8 | 37 -16% | 43 -35% | 35.1 -10% | 41.1 -29% | 37.5 -18% |
| Maximum Bottom * (°C) | 36.6 | 33 10% | 42.6 -16% | 44.8 -22% | 42.3 -16% | 49.7 -36% |
| Idle Upper Side * (°C) | 25.8 | 23.5 9% | 30 -16% | 25.7 -0% | 26.8 -4% | 29 -12% |
| Idle Bottom * (°C) | 26 | 28.1 -8% | 31.1 -20% | 26.5 -2% | 28.6 -10% | 30.1 -16% |
* ... smaller is better
Stress Test
Average CPU clock rate and temperature would stabilize at just 1.4 GHz and 52 W, respectively, when running Prime95 stress which is much lower than expected from a Ryzen 7 5700U. Package power draw is also very low at just under 10 W even on Performance mode when the CPU is capable of 15 W and greater.
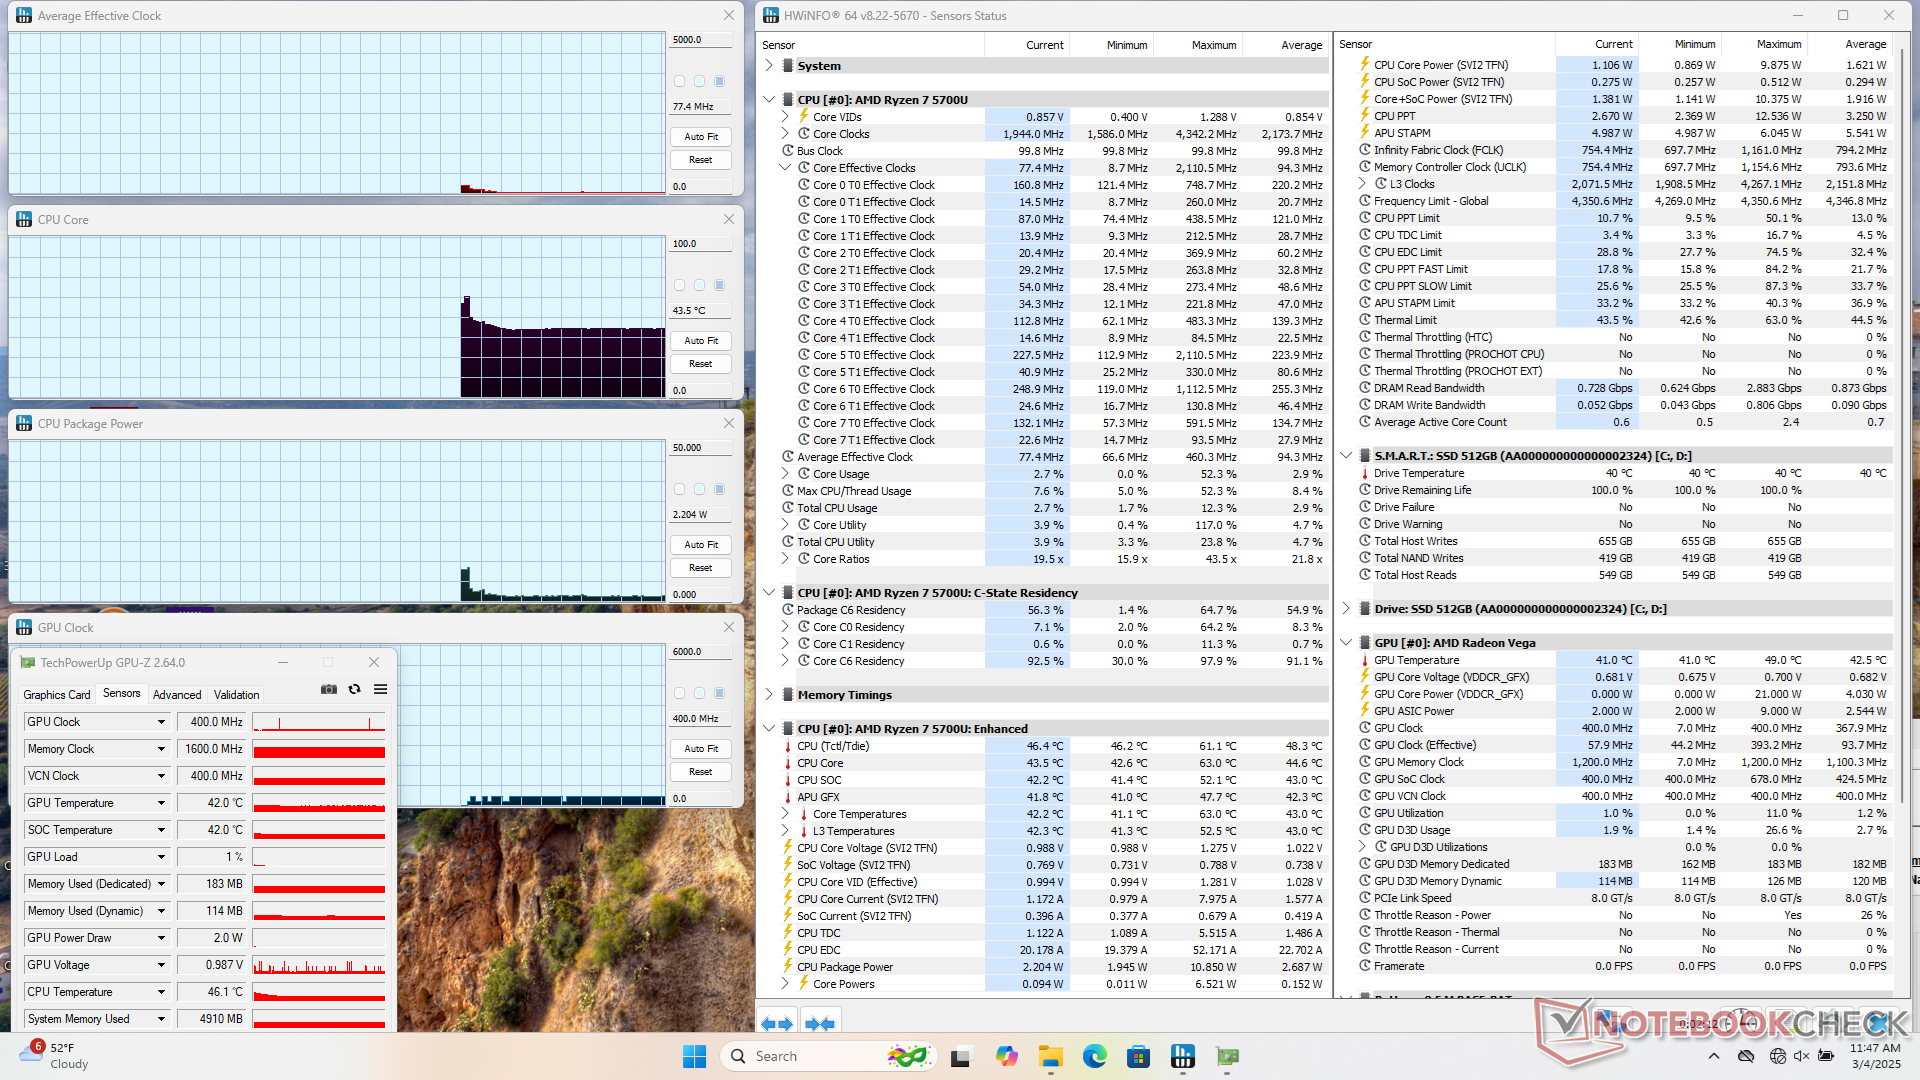
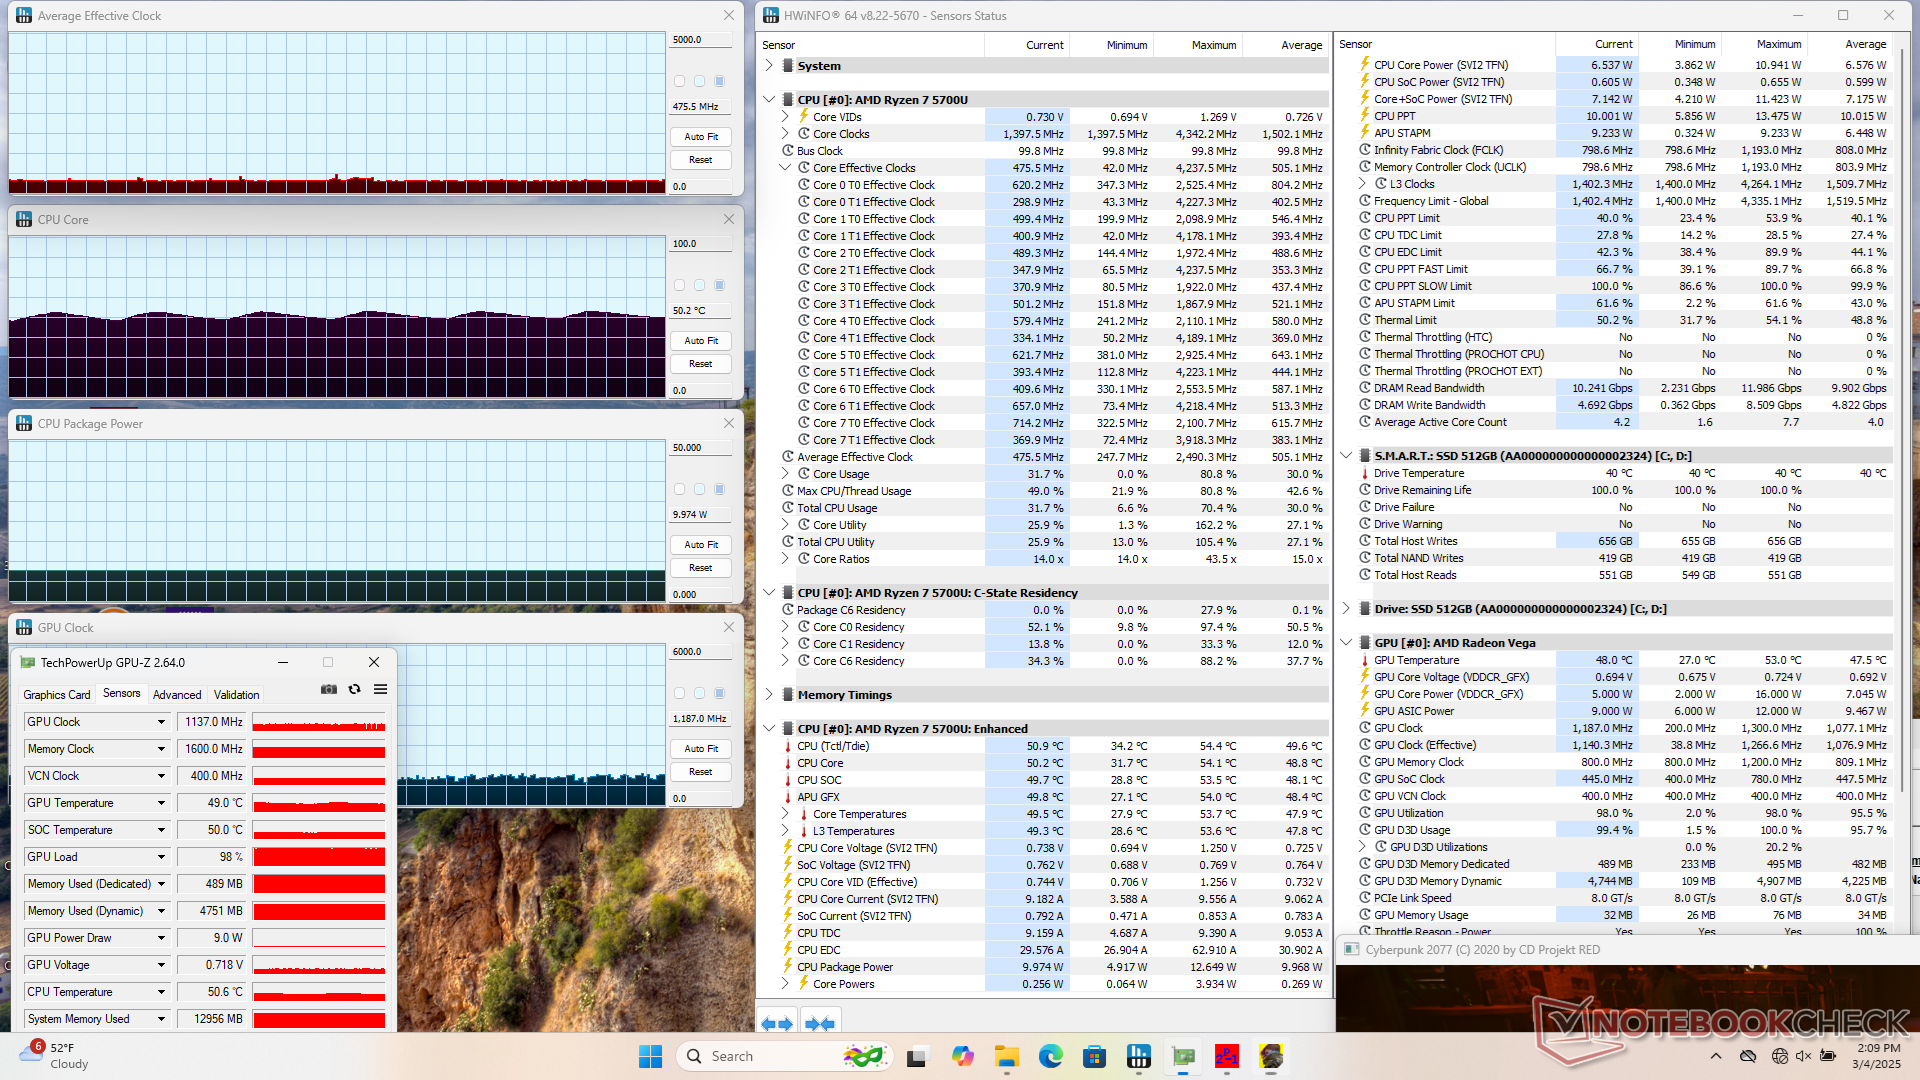
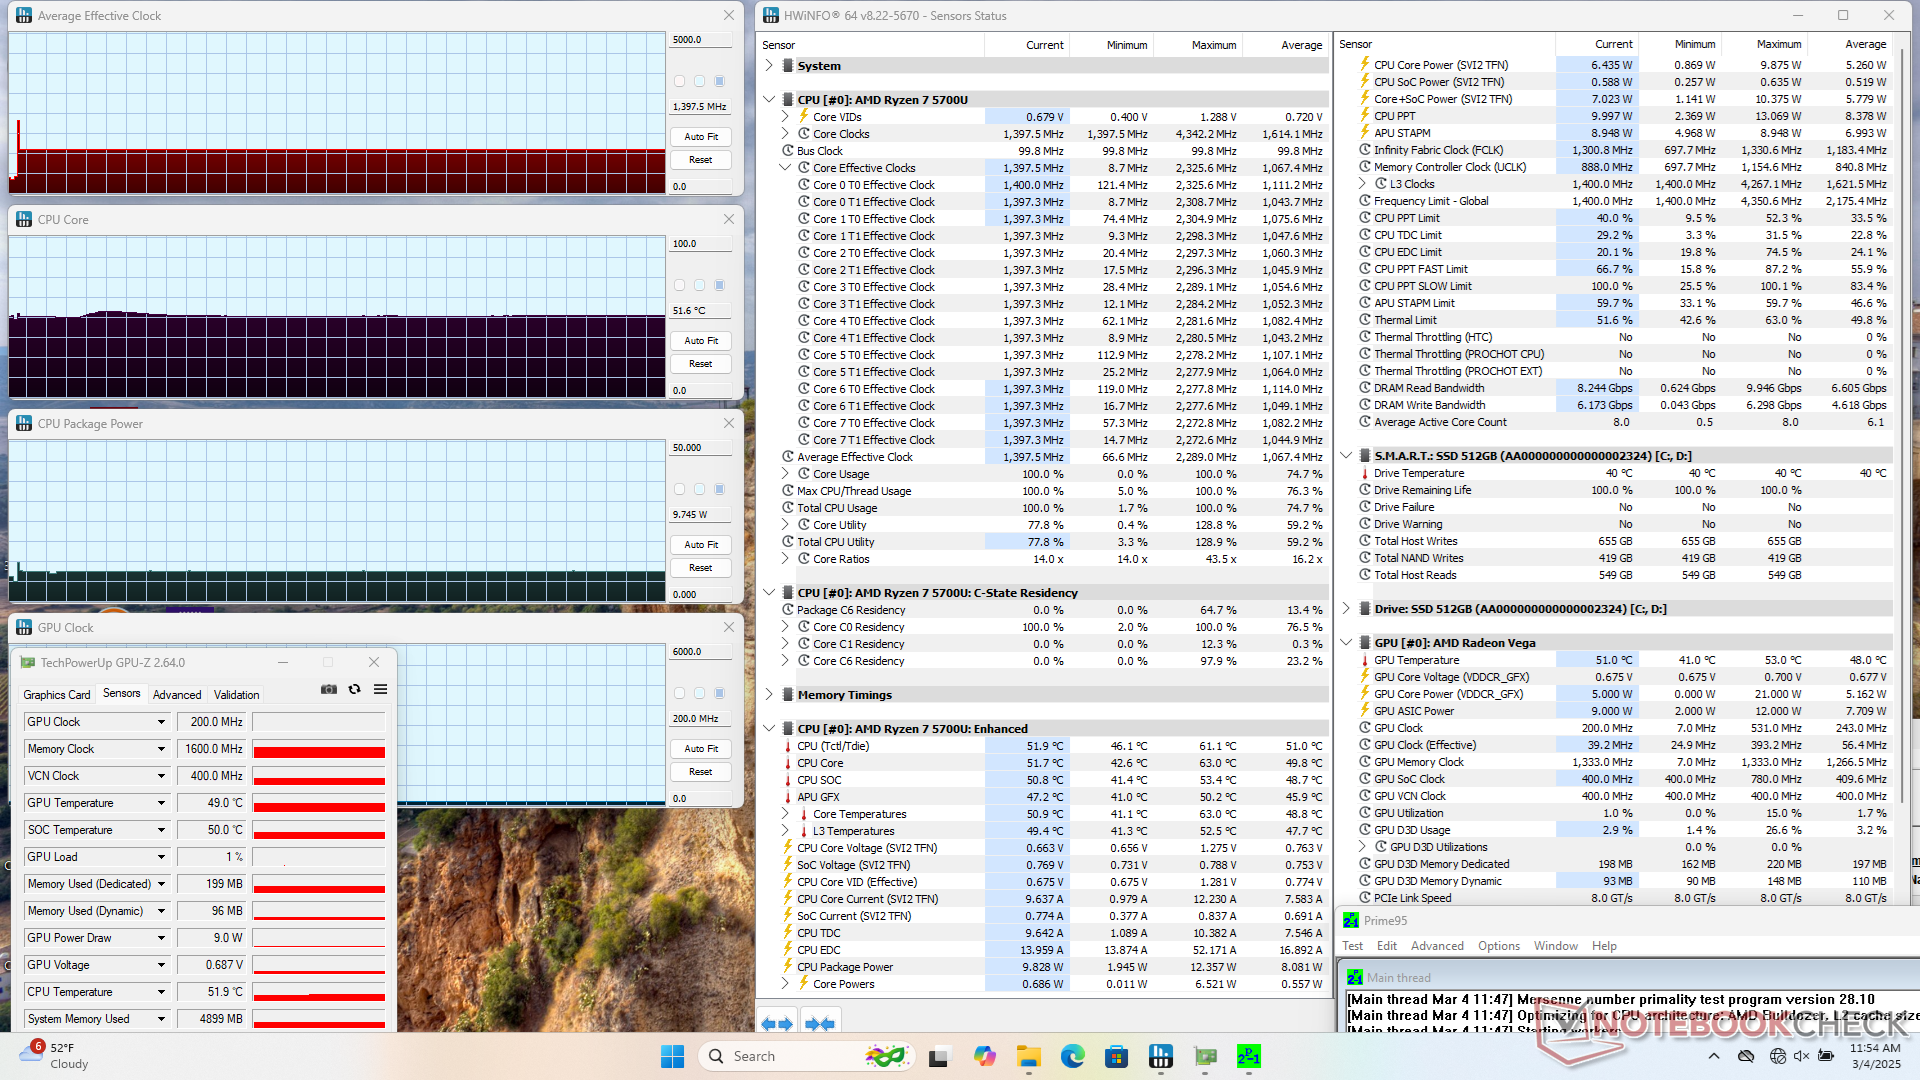
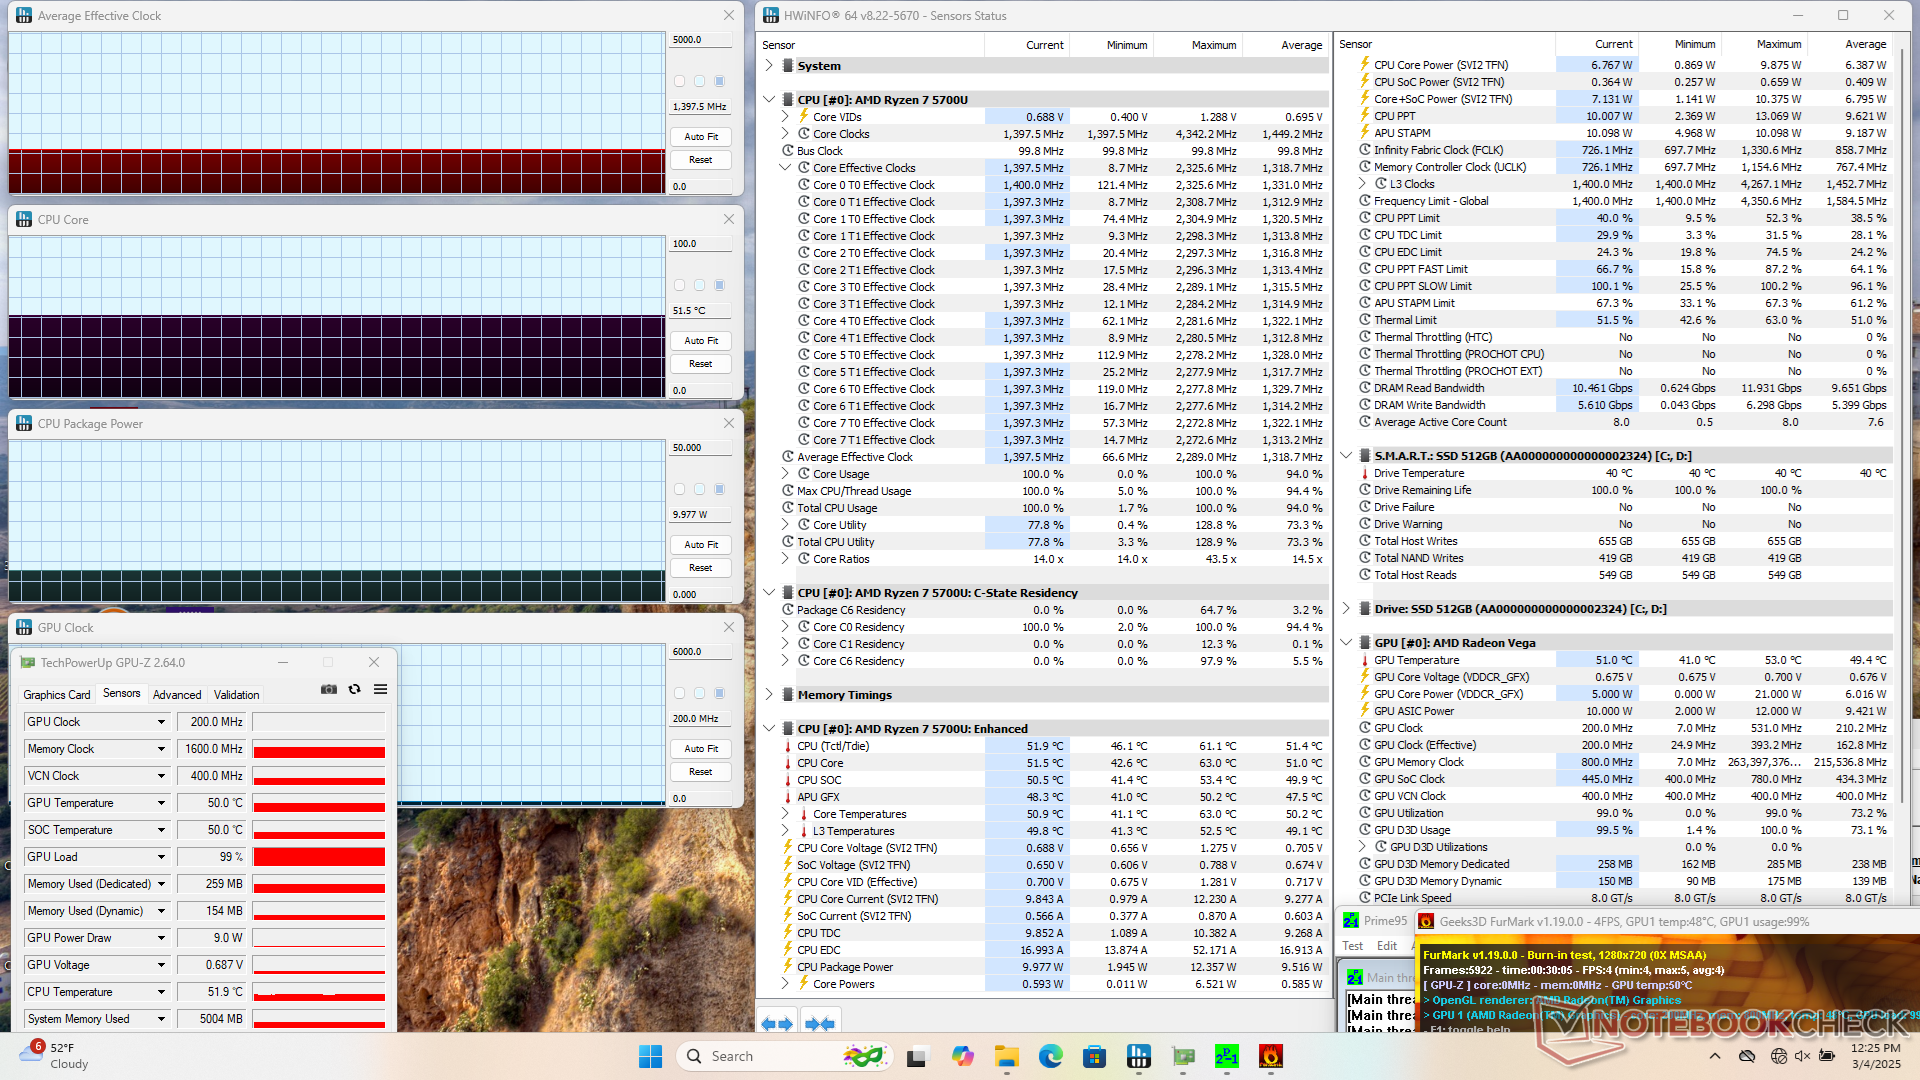
| Average CPU Clock (GHz) | GPU Clock (MHz) | Average CPU Temperature (°C) | |
| System Idle | -- | -- | 44 |
| Prime95 Stress | 1.4 | -- | 52 |
| Prime95 + FurMark Stress | 1.4 | 200 | 52 |
| Cyberpunk 2077 Stress | 0.5 | 1187 | 50 |
Speakers
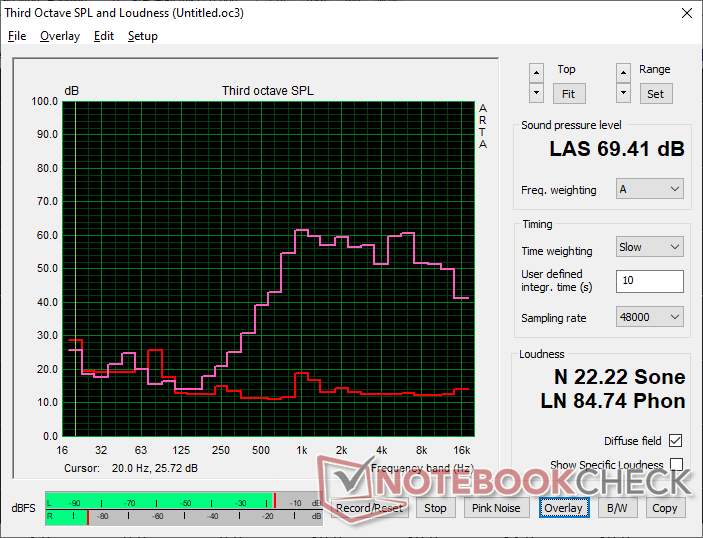
Thinkeagle VigoBook G7 audio analysis
(-) | not very loud speakers (69.4 dB)
Bass 100 - 315 Hz
(-) | nearly no bass - on average 33.2% lower than median
(+) | bass is linear (6% delta to prev. frequency)
Mids 400 - 2000 Hz
(±) | reduced mids - on average 9.6% lower than median
(±) | linearity of mids is average (14% delta to prev. frequency)
Highs 2 - 16 kHz
(+) | balanced highs - only 4.2% away from median
(±) | linearity of highs is average (10.4% delta to prev. frequency)
Overall 100 - 16.000 Hz
(-) | overall sound is not linear (37.8% difference to median)
Compared to same class
» 99% of all tested devices in this class were better, 1% similar, 0% worse
» The best had a delta of 5%, average was 17%, worst was 45%
Compared to all devices tested
» 95% of all tested devices were better, 1% similar, 5% worse
» The best had a delta of 4%, average was 24%, worst was 134%
Apple MacBook Pro 16 2021 M1 Pro audio analysis
(+) | speakers can play relatively loud (84.7 dB)
Bass 100 - 315 Hz
(+) | good bass - only 3.8% away from median
(+) | bass is linear (5.2% delta to prev. frequency)
Mids 400 - 2000 Hz
(+) | balanced mids - only 1.3% away from median
(+) | mids are linear (2.1% delta to prev. frequency)
Highs 2 - 16 kHz
(+) | balanced highs - only 1.9% away from median
(+) | highs are linear (2.7% delta to prev. frequency)
Overall 100 - 16.000 Hz
(+) | overall sound is linear (4.6% difference to median)
Compared to same class
» 0% of all tested devices in this class were better, 0% similar, 100% worse
» The best had a delta of 5%, average was 17%, worst was 45%
Compared to all devices tested
» 0% of all tested devices were better, 0% similar, 100% worse
» The best had a delta of 4%, average was 24%, worst was 134%
Energy Management
Power Consumption
Overall consumption is slightly less than the Core i3-powered HP 250 while providing slightly faster processor performance for better performance-per-watt.
| Off / Standby | |
| Idle | |
| Load |
|
Key:
min: | |
| Thinkeagle VigoBook G7 R7 5700U, Vega 8, , IPS, 1920x1080, 15.6" | Ninkear A15 Plus (16+512) R7 5700U, Vega 8, GOFATOO P110E-512GB, IPS, 1920x1080, 15.6" | Acer Aspire Vero AV15-53P i7-1355U, Iris Xe G7 96EUs, Kingston OM8SEP4512Q-AA, IPS, 1920x1080, 15.6" | HP 250 G9 7N029ES i3-1215U, UHD Graphics 64EUs, SK hynix HFS512GEJ9X125N, IPS, 1920x1080, 15.6" | Lenovo IdeaPad 3 15ABA7 R5 5625U, Vega 7, Micron 2450 512GB MTFDKCD512TFK, IPS, 1920x1080, 15.6" | Dell Latitude 3520 i5-1135G7, Iris Xe G7 80EUs, Kioxia BG5 KBG50ZNS256G, IPS, 1920x1080, 15.6" | |
|---|---|---|---|---|---|---|
| Power Consumption | -14% | -28% | -6% | -28% | -11% | |
| Idle Minimum * (Watt) | 4.1 | 4.8 -17% | 5.05 -23% | 3.6 12% | 5 -22% | 3.2 22% |
| Idle Average * (Watt) | 7.8 | 5.4 31% | 6.28 19% | 7.8 -0% | 8.7 -12% | 7.2 8% |
| Idle Maximum * (Watt) | 7.9 | 7.7 3% | 8.5 -8% | 8.1 -3% | 9.1 -15% | 7.8 1% |
| Load Average * (Watt) | 27.1 | 36.05 -33% | 42.184 -56% | 34.7 -28% | 41 -51% | 34 -25% |
| Cyberpunk 2077 ultra external monitor * (Watt) | 23.8 | |||||
| Cyberpunk 2077 ultra * (Watt) | 27.7 | |||||
| Load Maximum * (Watt) | 40 | 62 -55% | 69.5 -74% | 44.6 -12% | 55.7 -39% | 65 -63% |
| Witcher 3 ultra * (Watt) | 45.4 | 34.9 | 41.9 | 29.2 |
* ... smaller is better
Power Consumption Cyberpunk / Stress Test
Power Consumption external Monitor
Battery Life
Runtime is decent for the price and size category at 8.5 hours of real-world browsing.
| Thinkeagle VigoBook G7 R7 5700U, Vega 8, 57 Wh | Ninkear A15 Plus (16+512) R7 5700U, Vega 8, 64.9 Wh | Acer Aspire Vero AV15-53P i7-1355U, Iris Xe G7 96EUs, 54.4 Wh | HP 250 G9 7N029ES i3-1215U, UHD Graphics 64EUs, 41 Wh | Lenovo IdeaPad 3 15ABA7 R5 5625U, Vega 7, 45 Wh | Dell Latitude 3520 i5-1135G7, Iris Xe G7 80EUs, 54 Wh | |
|---|---|---|---|---|---|---|
| Battery runtime | 25% | 40% | -29% | 14% | 7% | |
| WiFi v1.3 (h) | 8.5 | 10.6 25% | 11.9 40% | 6 -29% | 9.7 14% | 9.1 7% |
| Load (h) | 2.5 | 0.9 | ||||
| Reader / Idle (h) | 21.7 | |||||
| H.264 (h) | 11.1 |
Notebookcheck Rating
Thinkeagle VigoBook G7
- 03/11/2025 v8
Allen Ngo
 Total Sustainability Score:
 Transparency
The selection of devices to be reviewed is made by our editorial team. The test sample was provided to the author as a loan by the manufacturer or retailer for the purpose of this review. The lender had no influence on this review, nor did the manufacturer receive a copy of this review before publication. There was no obligation to publish this review. As an independent media company, Notebookcheck is not subjected to the authority of manufacturers, retailers or publishers.
This is how Notebookcheck is testing
Every year, Notebookcheck independently reviews hundreds of laptops and smartphones using standardized procedures to ensure that all results are comparable. We have continuously developed our test methods for around 20 years and set industry standards in the process. In our test labs, high-quality measuring equipment is utilized by experienced technicians and editors. These tests involve a multi-stage validation process. Our complex rating system is based on hundreds of well-founded measurements and benchmarks, which maintains objectivity. Further information on our test methods can be found here.
