Notebookcheck Logo

Qualcomm Snapdragon 662 vs Qualcomm Snapdragon 450 vs Qualcomm Snapdragon 626

Qualcomm Snapdragon 662

► remove from comparison Qualcomm SD 662

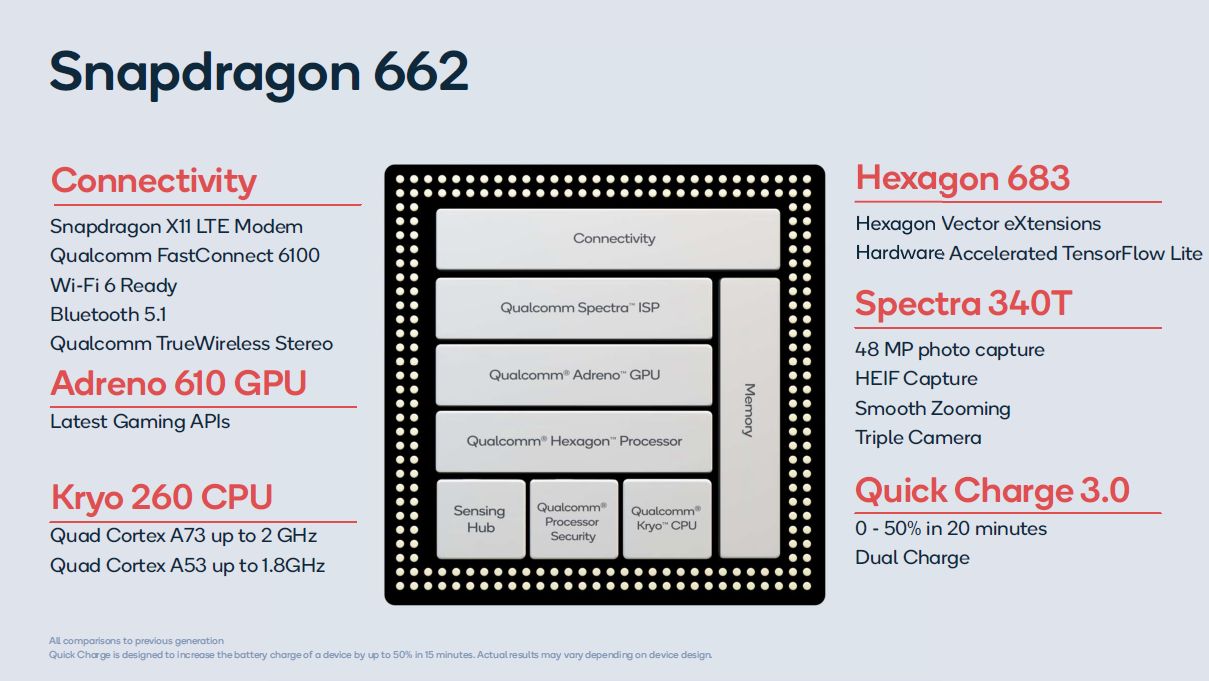
The Qualcomm Snapdragon 662 is a lower mid-range ARM-based SoC largely found in Android tablets and smartphones. It features 8 Kryo 260 cores (custom design, 64-Bit capable) that are divided in two clusters. A fast cluster of four cores with up to 2 GHz (Kryo 260 Gold - Cortex-A73 derivate) and a power saving efficiency cluster with up to 1.8 GHz (Kryo 260 Silver - Cortex A53 derivate). Both clusters can also be used together.

In addition to the 8 CPU cores, the SoC integrates a mid range Adreno 610 GPU with a LPDDR4 memory controller (dual-channel)  and supports Wi-Fi (802.11ac + MIMO, max. 867 Mbps), Bluetooth 5, and LTE (X12 LTE modem with up to 600 Mbps download and 150 Mbps upload).

Power Consumption

Thanks to the new 11 nm LPP process, the energy efficiency should be quite good.

Qualcomm Snapdragon 450

► remove from comparison Qualcomm SD 450

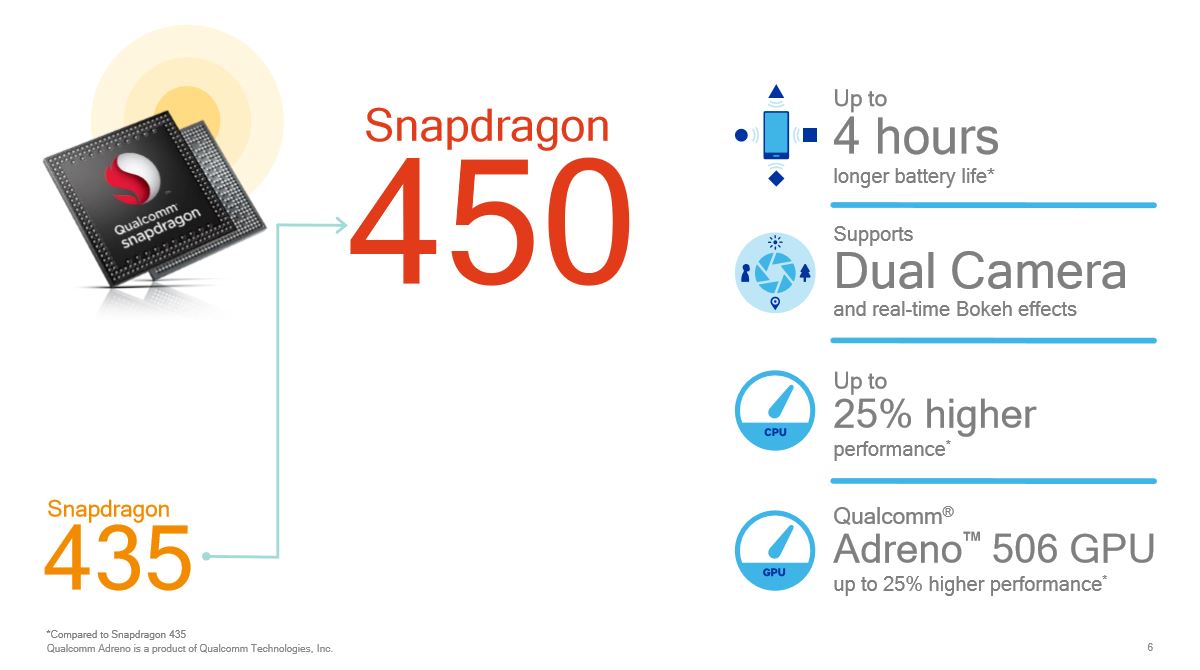
The Qualcomm Snapdragon 450 (SD450) is a lower mainstream SoC for (Android based) smartphones and tablets. It features eight ARM Cortex-A53 cores at up to 1.8 GHz and is already manufactured in the power efficient 14nm process. The integrated X9 LTE modem supports Cat. 7 with maximum transfer rates of 300 Mbps (downstream) and 150 Mbps (upstream). The SoC also includes an Adreno 506 GPU with support for Vulkan and OpenGL ES 3.1. WiFi 802.11ac (1x1, max 364 Mbps) and Bluetooth 4.1 are supported as well. The memory controller supports LPDDR3 (single channel) and the integrated video engine supports H.264 (encode and decode) and HEVC (only decode) in 1080p.

Qualcomm Snapdragon 626

► remove from comparison Qualcomm 626

The Qualcomm Snapdragon 626 (SD626) is a mid-range octa-core SoC with eight ARM Cortex-A53 cpu cores at up to 2.2 GHz, an Adreno 506 GPU, a DDR3L-1866 memory controller and a X9 LTE (Cat 7, 4G+, 300 Mbps down, 150 Mbps up) modem. Furthermore, the chip supports 802.11ac WiFi and Bluetooth 4.1. It is manufactured in 14nm FinFet. The processor performance should be a bit higher than the average Snapdragon 625, due to the 200 MHz higher maximum clock speed.

ModelQualcomm Snapdragon 662Qualcomm Snapdragon 450Qualcomm Snapdragon 626
SeriesQualcomm SnapdragonQualcomm SnapdragonQualcomm Snapdragon
CodenameKryo 260Cortex-A53Cortex-A53
Series: Snapdragon Cortex-A53
Qualcomm Snapdragon 6652.2 GHz8 / 8 cores Kryo 260
Qualcomm Snapdragon 662 « 1.8 - 2 GHz8 / 8 cores Kryo 260
Qualcomm Snapdragon 6602.2 GHz8 / 8 cores Kryo 260
Qualcomm Snapdragon 6361.8 GHz8 / 8 cores Kryo 260
Qualcomm Snapdragon 6302.2 GHz8 / 8 cores Cortex-A53
Qualcomm Snapdragon 6262.2 GHz8 / 8 cores Cortex-A53
Qualcomm Snapdragon 6252 GHz8 / 8 cores Cortex-A53
Qualcomm Snapdragon 4392 GHz8 / 8 cores Cortex-A53
Qualcomm Snapdragon 450 « 1.8 GHz8 / 8 cores Cortex-A53
Qualcomm Snapdragon 4292 GHz4 / 4 cores Cortex-A53
Qualcomm Snapdragon 617 MSM89521.5 GHz8 / 8 cores Cortex-A53
Qualcomm Snapdragon 616 MSM8939v21.7 GHz8 / 8 cores Cortex-A53
Qualcomm Snapdragon 615 MSM89391.7 GHz8 / 8 cores Cortex-A53
Qualcomm Snapdragon 610 MSM89361.7 GHz4 / 4 cores Cortex-A53
Qualcomm Snapdragon 4351.4 GHz8 / 8 cores Cortex-A53
Qualcomm Snapdragon 430 (MSM8937)1.4 GHz8 / 8 cores Cortex-A53
Qualcomm Snapdragon 415 MSM89291.4 GHz8 / 8 cores Cortex-A53
Qualcomm Snapdragon 425 (MSM8917)1.4 GHz4 / 4 cores Cortex-A53
Qualcomm Snapdragon 410 MSM89161.4 GHz4 / 4 cores Cortex-A53
Qualcomm Snapdragon 410 APQ80161.2 GHz4 / 4 cores Cortex-A53
Qualcomm Snapdragon 6302.2 GHz8 / 8 cores Cortex-A53
Qualcomm Snapdragon 626 « 2.2 GHz8 / 8 cores Cortex-A53
Qualcomm Snapdragon 6252 GHz8 / 8 cores Cortex-A53
Qualcomm Snapdragon 4392 GHz8 / 8 cores Cortex-A53
Qualcomm Snapdragon 4501.8 GHz8 / 8 cores Cortex-A53
Qualcomm Snapdragon 4292 GHz4 / 4 cores Cortex-A53
Qualcomm Snapdragon 617 MSM89521.5 GHz8 / 8 cores Cortex-A53
Qualcomm Snapdragon 616 MSM8939v21.7 GHz8 / 8 cores Cortex-A53
Qualcomm Snapdragon 615 MSM89391.7 GHz8 / 8 cores Cortex-A53
Qualcomm Snapdragon 610 MSM89361.7 GHz4 / 4 cores Cortex-A53
Qualcomm Snapdragon 4351.4 GHz8 / 8 cores Cortex-A53
Qualcomm Snapdragon 430 (MSM8937)1.4 GHz8 / 8 cores Cortex-A53
Qualcomm Snapdragon 415 MSM89291.4 GHz8 / 8 cores Cortex-A53
Qualcomm Snapdragon 425 (MSM8917)1.4 GHz4 / 4 cores Cortex-A53
Qualcomm Snapdragon 410 MSM89161.4 GHz4 / 4 cores Cortex-A53
Qualcomm Snapdragon 410 APQ80161.2 GHz4 / 4 cores Cortex-A53
Clock1800 - 2000 MHz1800 MHz2200 MHz
Cores / Threads8 / 88 / 88 / 8
Technology11 nm14 nm14 nm
FeaturesAdreno 610 GPU, X11 LTE Modem, Hexagon 683 DSP, Specra 340T ISPAdreno 506 GPU, X9 LTE Modem (300 / 150 Mbps)Adreno 506 GPU, 802.11ac WLAN, Bluetooth 4.1, LTE Cat. 7, Dual-Channel LPDDR3-1866 Memory Controller
iGPUQualcomm Adreno 610Qualcomm Adreno 506Qualcomm Adreno 506
ArchitectureARMARMARM
Announced
Manufacturerwww.qualcomm.comwww.qualcomm.comwww.qualcomm.com

Benchmarks

Performance Rating - Geekbench 5.5, PCM Work, Sling Shot Physics, Antutu v8 CPU - SD 662
0.5 pt (36%)
Performance Rating - Geekbench 5.5, PCM Work, Sling Shot Physics, Antutu v8 CPU - SD 450
0.2 pt (14%)
3DMark - 3DMark Ice Storm Extreme Physics
100%
1 SD 450 +
11735 Points (10%)
3DMark - 3DMark Ice Storm Unlimited Physics
min: 18647     avg: 19225     median: 19223.5 (16%)     max: 19804 Points
89%
626 +
min: 16939     avg: 17078     median: 17084 (14%)     max: 17204 Points
3DMark - 3DMark Sling Shot Extreme (ES 3.1) Unlimited Physics
min: 1588     avg: 2240     median: 2272 (27%)     max: 2534 Points
92%
626 +
min: 2045     avg: 2079     median: 2083.5 (25%)     max: 2105 Points
3DMark - 3DMark Sling Shot (ES 3.0) Unlimited Physics
min: 2146     avg: 2330     median: 2384 (27%)     max: 2502 Points
87%
626 +
min: 2065     avg: 2086     median: 2085.5 (24%)     max: 2107 Points
Geekbench 6.2 - Geekbench 6.2 Single-Core
100%
1 SD 662 +
min: 330     avg: 331.5     median: 331.5 (9%)     max: 333 Points
Geekbench 6.2 - Geekbench 6.2 Multi-Core
100%
1 SD 662 +
min: 1111     avg: 1129     median: 1129 (4%)     max: 1147 Points
42%
1 SD 450 +
min: 131     avg: 140.3     median: 131 (6%)     max: 159 Points
38%
1 SD 450 +
min: 493     avg: 631     median: 498 (1%)     max: 902 Points
Geekbench 5.0 - Geekbench 5.0 64 Bit Single-Core
100%
1 626 +
187 Points (1%)
Geekbench 5.0 - Geekbench 5.0 64 Bit Multi-Core
100%
1 626 +
1098 Points (3%)
Geekbench 4.4 - Geekbench 4.1 - 4.4 64 Bit Single-Core
1472 Points (15%)
63%
626 +
min: 907     avg: 926     median: 928.5 (9%)     max: 939 Points
Geekbench 4.4 - Geekbench 4.1 - 4.4 64 Bit Multi-Core
4938 Points (5%)
91%
626 +
min: 4369     avg: 4481     median: 4496.5 (5%)     max: 4562 Points
Geekbench 4.0 - Geekbench 4.0 64 Bit Single-Core
100%
1 SD 450 +
min: 709     avg: 733     median: 732.5 (10%)     max: 756 Points
121%
1 626 +
889 Points (12%)
Geekbench 4.0 - Geekbench 4.0 64 Bit Multi-Core
100%
1 SD 450 +
min: 3625     avg: 3691     median: 3690.5 (9%)     max: 3756 Points
118%
1 626 +
4362 Points (11%)
Geekbench 3 - Geekbench 3 64 Bit Multi-Core
100%
1 SD 450 +
min: 3963     avg: 3981     median: 3980.5 (6%)     max: 3998 Points
121%
1 626 +
4804 Points (8%)
Geekbench 3 - Geekbench 3 64 Bit Single-Core
100%
1 SD 450 +
707 Points (11%)
118%
1 626 +
837 Points (13%)
Geekbench 2 - 32 Bit - Geekbench Stream
100%
1 SD 450 +
min: 737     avg: 747     median: 746.5 (6%)     max: 756 Points
116%
1 626 +
868 Points (7%)
Geekbench 2 - 32 Bit - Geekbench Memory
100%
1 SD 450 +
min: 1708     avg: 2113     median: 2112.5 (19%)     max: 2517 Points
89%
1 626 +
1883 Points (17%)
Geekbench 2 - 32 Bit - Geekbench Floating Point
100%
1 SD 450 +
min: 5993     avg: 6011     median: 6010.5 (12%)     max: 6028 Points
125%
1 626 +
7485 Points (15%)
Geekbench 2 - 32 Bit - Geekbench Integer
100%
1 SD 450 +
min: 3340     avg: 3381     median: 3381 (7%)     max: 3422 Points
125%
1 626 +
4212 Points (8%)
Geekbench 2 - 32 Bit - Geekbench Total Score
100%
1 SD 450 +
min: 3683     avg: 3784     median: 3783.5 (10%)     max: 3884 Points
120%
1 626 +
4557 Points (12%)
Mozilla Kraken 1.1 - Kraken 1.1 Total Score *
min: 3779     avg: 4379     median: 4502 (5%)     max: 4650 ms
min: 11012     avg: 11506     median: 11492.5 (13%)     max: 11863 ms
95%
626 +
min: 7667     avg: 8504     median: 8761.5 (10%)     max: 8825 ms
Octane V2 - Octane V2 Total Score
min: 8893     avg: 9495     median: 9485.5 (9%)     max: 10247 Points
min: 3470     avg: 3981     median: 3997 (4%)     max: 4115 Points
50%
626 +
min: 4424     avg: 4760     median: 4705.5 (4%)     max: 5204 Points
WebXPRT 3 - WebXPRT 3 Score
100%
1 SD 662 +
min: 51     avg: 53.2     median: 52 (11%)     max: 59 Points
61%
1 SD 450 +
min: 28     avg: 31.3     median: 31.5 (7%)     max: 34 Points
AnTuTu v6 - AnTuTu v6 Total Score
100%
1 SD 450 +
min: 54731     avg: 57703     median: 57827.5 (20%)     max: 60077 Points
115%
1 626 +
min: 63428     avg: 66058     median: 66613 (23%)     max: 67578 Points
AnTuTu v7 - AnTuTu v7 MEM
100%
1 SD 450 +
min: 4090     avg: 5355     median: 5158 (16%)     max: 7614 Points
105%
1 626 +
5406 Points (17%)
AnTuTu v7 - AnTuTu v7 UX
100%
1 SD 450 +
min: 17204     avg: 19521     median: 19734 (24%)     max: 20891 Points
109%
1 626 +
21477 Points (26%)
AnTuTu v7 - AnTuTu v7 GPU
100%
1 SD 450 +
min: 11937     avg: 12110     median: 12147 (4%)     max: 12208 Points
113%
1 626 +
13693 Points (4%)
AnTuTu v7 - AnTuTu v7 CPU
100%
1 SD 450 +
min: 33473     avg: 34106     median: 33975 (21%)     max: 35092 Points
123%
1 626 +
41767 Points (26%)
AnTuTu v7 - AnTuTu v7 Total Score
100%
1 SD 450 +
min: 56497     avg: 69869     median: 71167 (13%)     max: 73468 Points
116%
1 626 +
82343 Points (15%)
AnTuTu v8 - AnTuTu v8 UX
100%
1 SD 662 +
min: 26857     avg: 35819     median: 37388 (31%)     max: 38718 Points
75%
1 SD 450 +
min: 26309     avg: 28038     median: 28107 (24%)     max: 29697 Points
AnTuTu v8 - AnTuTu v8 MEM
100%
1 SD 662 +
min: 32579     avg: 37486     median: 34946 (28%)     max: 46499 Points
45%
1 SD 450 +
min: 13168     avg: 16031     median: 15671 (13%)     max: 19253 Points
AnTuTu v8 - AnTuTu v8 GPU
100%
1 SD 662 +
min: 25724     avg: 33052     median: 33402 (6%)     max: 43315 Points
28%
1 SD 450 +
min: 9371     avg: 9408     median: 9408 (2%)     max: 9444 Points
AnTuTu v8 - AnTuTu v8 CPU
100%
1 SD 662 +
min: 68508     avg: 70945     median: 71065 (26%)     max: 72576 Points
55%
1 SD 450 +
min: 28376     avg: 35468     median: 38797 (14%)     max: 39230 Points
AnTuTu v8 - AnTuTu v8 Total Score
100%
1 SD 662 +
min: 167471     avg: 177411     median: 177145 (17%)     max: 185542 Points
51%
1 SD 450 +
min: 89022     avg: 92277     median: 90185 (9%)     max: 97624 Points
Antutu v9 - AnTuTu v9 Total Score
100%
1 SD 662 +
min: 194505     avg: 200601     median: 198172 (12%)     max: 211557 Points
Antutu v9 - AnTuTu v9 CPU
100%
1 SD 662 +
min: 64163     avg: 66339     median: 66230 (18%)     max: 68731 Points
AndEBench - AndEBench Java
0 Iter./s (0%)
AndEBench - AndEBench Native
0 Iter./s (0%)
PassMark PerformanceTest Mobile V1 - PerformanceTest Mobile V1 CPU Tests
100%
1 SD 662 +
16222 Points (2%)
628%
1 SD 450 +
101906 Points (13%)
PCMark for Android - PCM f. Android Storage 2.0 random write internal
100%
1 SD 662 +
min: 21.7     avg: 22.3     median: 22.3 (16%)     max: 22.9 MB/s
PCMark for Android - PCM f. Android Storage 2.0 seq write internal
100%
1 SD 662 +
min: 111.1     avg: 112.5     median: 112.5 (3%)     max: 113.8 MB/s
PCMark for Android - PCM f. Android Storage 2.0 random read internal
100%
1 SD 662 +
min: 15.3     avg: 15.5     median: 15.5 (19%)     max: 15.6 MB/s
PCMark for Android - PCM f. Android Storage 2.0 seq read internal
100%
1 SD 662 +
min: 403     avg: 414.5     median: 414.5 (12%)     max: 426 MB/s
PCMark for Android - PCM f. Android Storage 2.0 score
100%
1 SD 662 +
min: 10366     avg: 11330     median: 10740 (17%)     max: 12884 Points
PCMark for Android - PCM f. Android Work Score 3.0
100%
1 SD 662 +
min: 3195     avg: 5608     median: 5689.5 (26%)     max: 7554 Points
PCMark for Android - PCM f. Android Computer Vision
100%
1 SD 662 +
min: 3090     avg: 3167     median: 3201 (17%)     max: 3211 Points
67%
1 SD 450 +
min: 2140     avg: 2239     median: 2157 (11%)     max: 2583 Points
PCMark for Android - PCM f. Android Storage
100%
1 SD 662 +
min: 8075     avg: 8811     median: 8076 (17%)     max: 10283 Points
54%
1 SD 450 +
min: 3145     avg: 5094     median: 4391 (9%)     max: 7635 Points
PCMark for Android - PCM f. Android Work Score 2.0
min: 5866     avg: 6258     median: 6139 (40%)     max: 7184 Points
80%
626 +
min: 4660     avg: 4848     median: 4903 (32%)     max: 4924 Points
PCMark for Android - PCM f. Android Work Score
min: 7247     avg: 7986     median: 8000.5 (40%)     max: 8714 Points
73%
626 +
min: 5621     avg: 5849     median: 5839 (29%)     max: 6096 Points
PCMark for Android - PCM f. Android Work 2.0 Battery Life
100%
1 SD 450 +
652 min (12%)
CrossMark - CrossMark Overall
100%
1 SD 662 +
328 Points (13%)
Power Consumption - Geekbench 5.5 Power Consumption 150cd *
100%
1 SD 662 +
min: 3.34     avg: 3.6     median: 3.6 (2%)     max: 3.83 Watt
Power Consumption - Idle Power Consumption 150cd 1min *
100%
1 SD 662 +
min: 1.32     avg: 1.6     median: 1.6 (2%)     max: 1.953 Watt

Average Benchmarks Qualcomm Snapdragon 662 → 100% n=9

Average Benchmarks Qualcomm Snapdragon 450 → 70% n=9

Average Benchmarks Qualcomm Snapdragon 626 → 80% n=9

- Range of benchmark values for this graphics card
- Average benchmark values for this graphics card
* Smaller numbers mean a higher performance
1 This benchmark is not used for the average calculation

v1.27
log 10. 21:42:19

#0 checking url part for id 12771 +0s ... 0s

#1 checking url part for id 9946 +0s ... 0s

#2 checking url part for id 9196 +0s ... 0s

#3 not redirecting to Ajax server +0s ... 0s

#4 did not recreate cache, as it is less than 5 days old! Created at Mon, 10 Jun 2024 05:38:24 +0200 +0.001s ... 0.001s

#5 composed specs +0.027s ... 0.028s

#6 did output specs +0s ... 0.029s

#7 getting avg benchmarks for device 12771 +0.018s ... 0.046s

#8 got single benchmarks 12771 +0.033s ... 0.079s

#9 getting avg benchmarks for device 9946 +0.013s ... 0.092s

#10 got single benchmarks 9946 +0.039s ... 0.132s

#11 getting avg benchmarks for device 9196 +0.003s ... 0.135s

#12 got single benchmarks 9196 +0.009s ... 0.144s

#13 got avg benchmarks for devices +0s ... 0.144s

#14 No cached benchmark found, getting uncached values +0.203s ... 0.347s

#15 No cached benchmark found, getting uncached values +0.002s ... 0.349s

#16 min, max, avg, median took s +0.042s ... 0.391s

#17 return log +0s ... 0.391s

Please share our article, every link counts!
> Expert Reviews and News on Laptops, Smartphones and Tech Innovations > Benchmarks / Tech > Processor Comparison - Head 2 Head
Redaktion, 2017-09- 8 (Update: 2023-07- 1)