Notebookcheck Logo

AMD Ryzen 9 7900 vs Intel Core i7-11700K vs Intel Core i7-11700

AMD Ryzen 9 7900

► remove from comparison AMD R9 7900

The AMD Ryzen 9 79 00 is a high-end desktop processorfrom the Raphael series with 12 cores and hyperthreading (SMT), which means it can process up to 24 threads simultaneously. Launched in early 2023, the Ryzen 9 7900 is the fastest 12-core processor with 65 watts TDP.

The Ryzen 9 7900 clocks at 3.7 GHz base clock and reaches up to 5.4 GHz on one core in Turbo mode. This is also the difference to the higher clocked Ryzen 9 7900X.

At first glance, the internal structure of the processor has not changed fundamentally. The AMD Ryzen 9 7900 is still based on the chiplet design consisting of two CCD clusters, each containing a CCX with 8 cores. However, the manufacturing process has been scaled down to 5 nm, which ensures higher clock rates. There is also the IO die, which contains the memory controller and the iGPU, among other things. This is now manufactured in a 6 nm structure width.

The AMD Ryzen 9 7900 can impress in games thanks to the significantly improved IPC.

Intel Core i7-11700K

► remove from comparison Intel i7-11700K

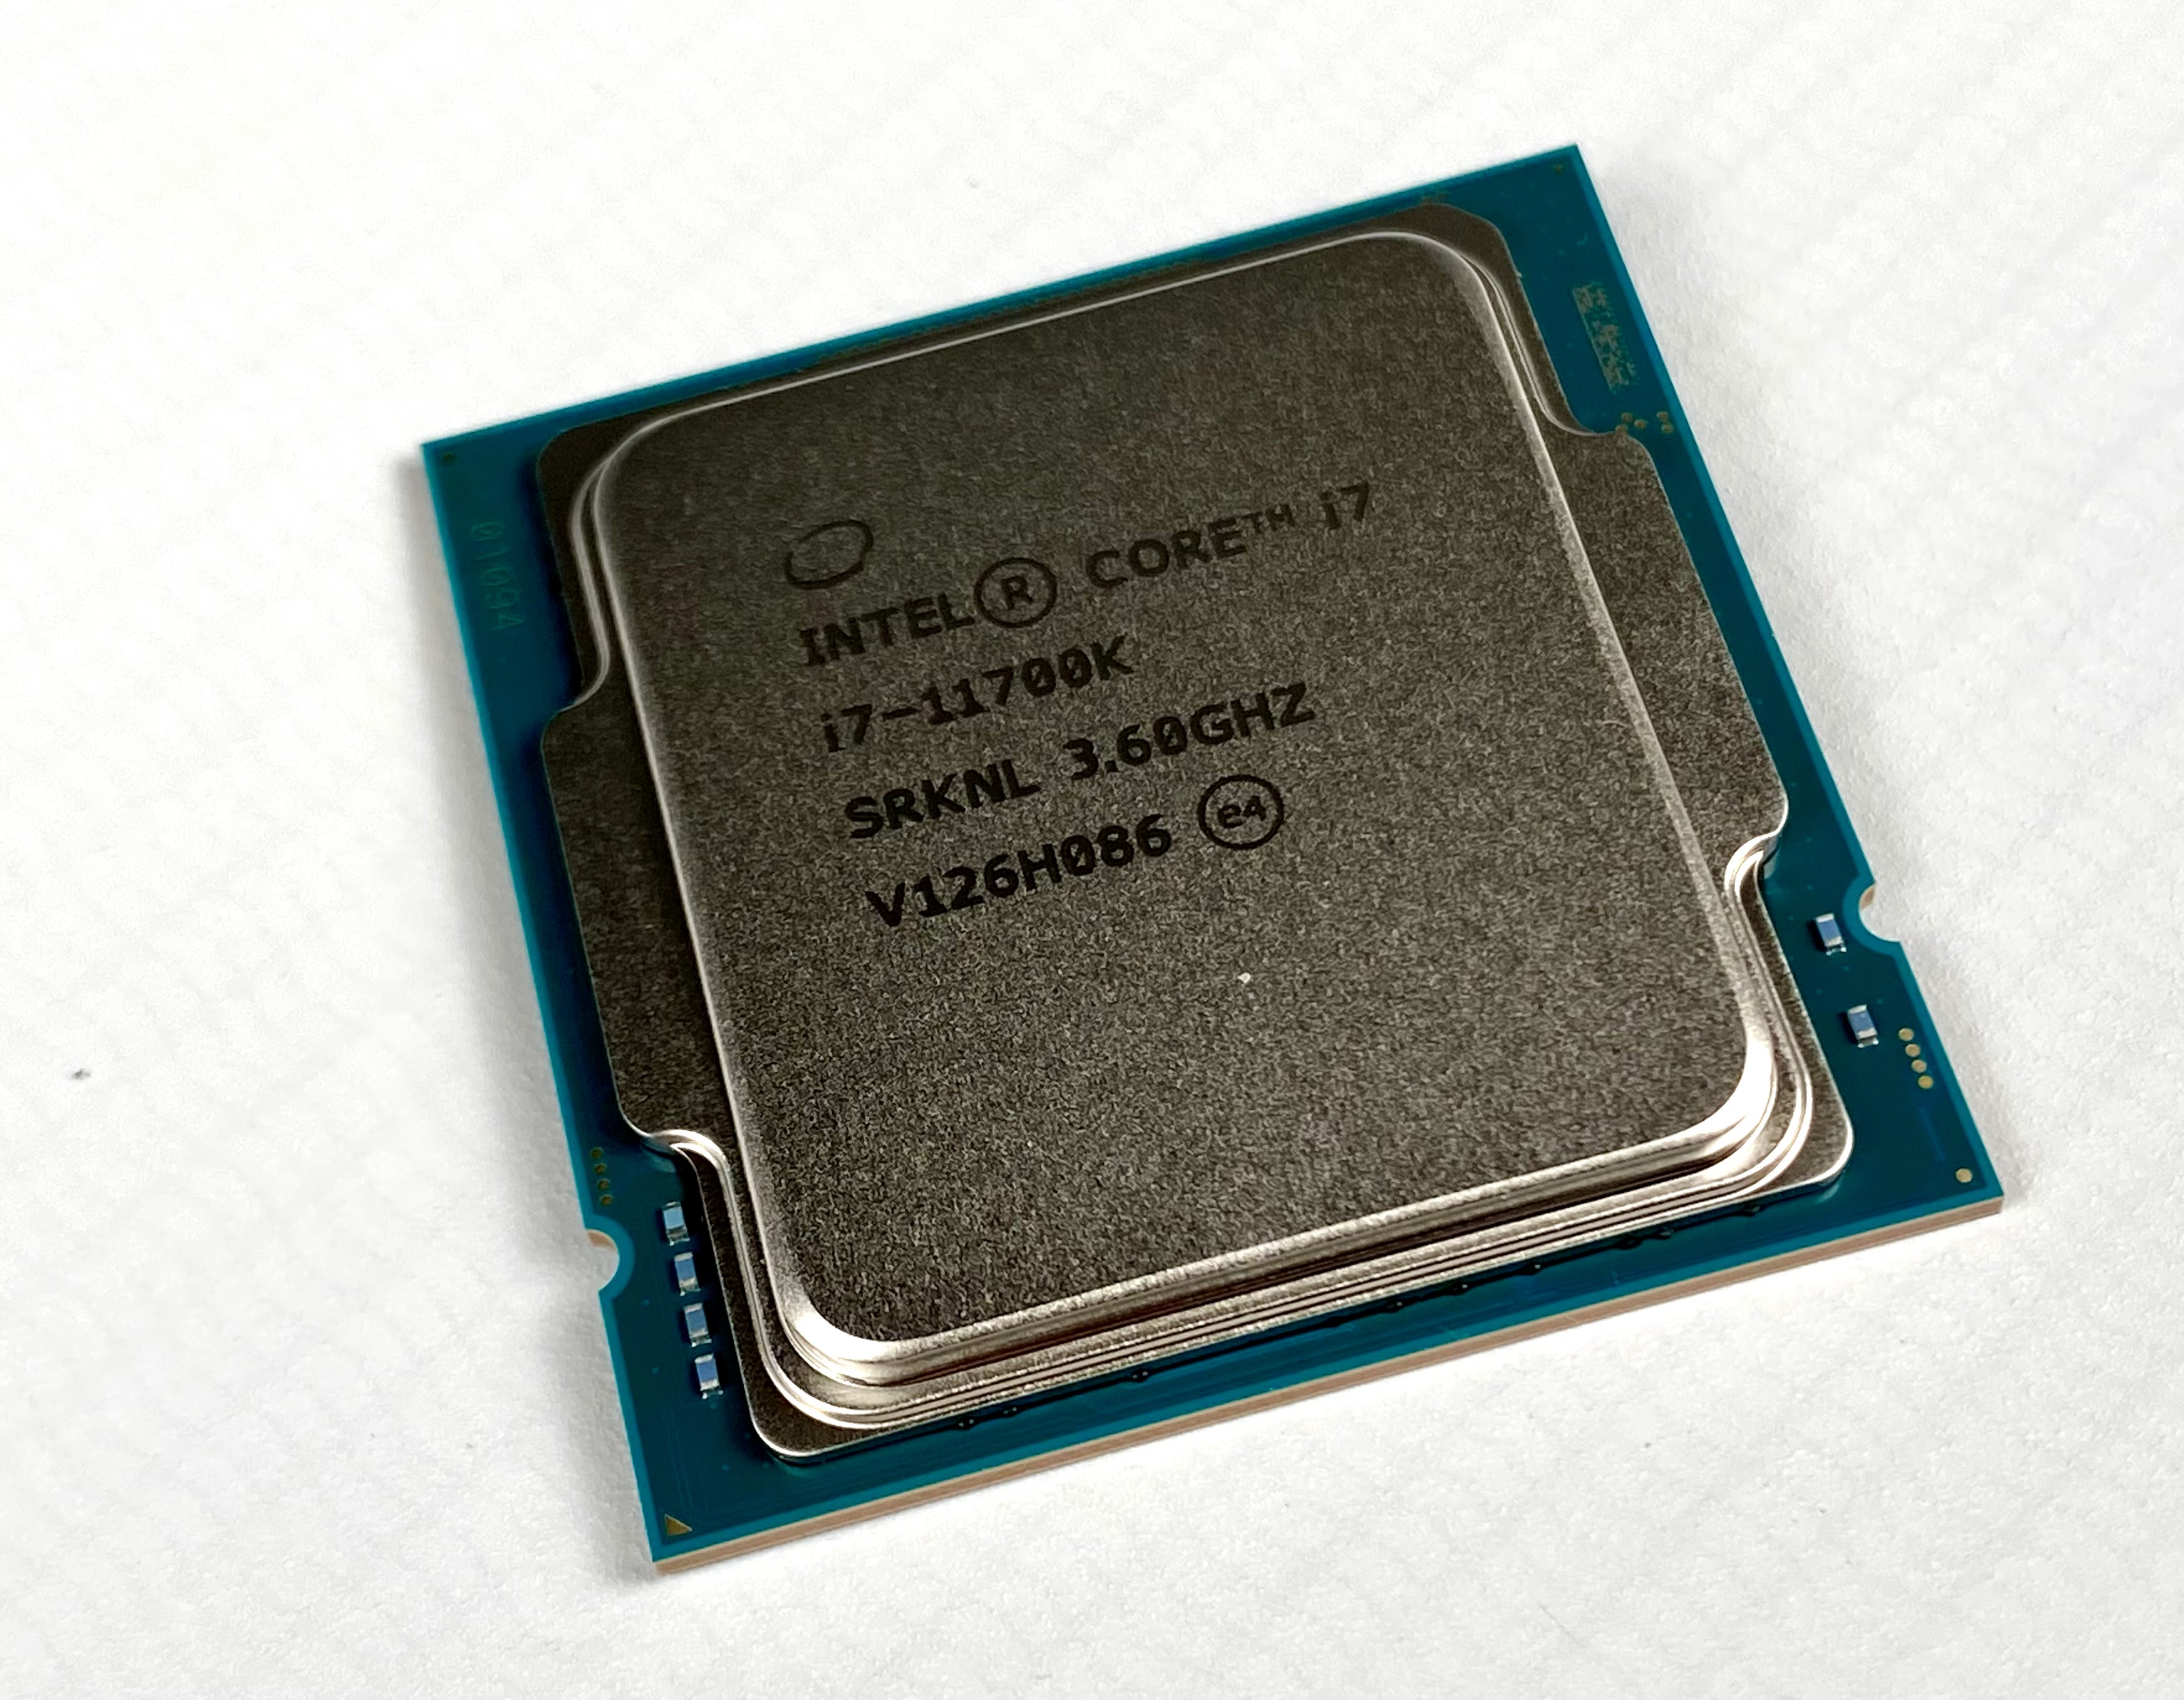
The Intel Core i7-11700K is a high-end desktop CPU based on the Rocket Lake architecture. The CPU offers 8 cores and 16 threads clocked at 3.6 - 4.9 GHz. The TDP is rated at 125 Watt (PL1, power limit sustained load) but the PL2 is set to around 250 Watt for short term boosts (up to 56 seconds). 

The Sunny Cove processor cores (known from the Ice Lake mobile CPUs) offer larger caches and an improved IPC (up to 19%). Furthermore, the chip also includes (partly) integrated WiFi 6E and Thunderbolt 4. The platform supports PCIe 4.0 and Intel DL Boost for AI acceleration.

The faster Rocket Lake-S CPUs also integrate a new Intel UHD Graphics 750 that is based on the current Intel Xe architecture (e.g. mobile Tiger Lake).

The CPU is manufactured on an old 14 nm process like the Comet Lake predecessors.

Intel Core i7-11700

► remove from comparison Intel i7-11700

The Intel Core i7-11700 is a high-end desktop CPU based on the Rocket Lake architecture. The CPU offers 8 cores and 16 threads clocked at 2.5 - 4.9 GHz. The TDP is rated at 65 Watt (PL1, power limit sustained load) but the PL2 is set to around 224 Watt for short term boosts (up to 56 seconds). 

The Sunny Cove processor cores (known from the Ice Lake mobile CPUs) offer larger caches and an improved IPC (up to 19%). Furthermore, the chip also includes (partly) integrated WiFi 6E and Thunderbolt 4. The platform supports PCIe 4.0 and Intel DL Boost for AI acceleration.

The faster Rocket Lake-S CPUs also integrate a new Intel UHD Graphics 750 that is based on the current Intel Xe architecture (e.g. mobile Tiger Lake).

The CPU is manufactured on the old 14 nm process like the Comet Lake predecessors.

ModelAMD Ryzen 9 7900Intel Core i7-11700KIntel Core i7-11700
CodenameRaphael (Zen4)Rocket LakeRocket Lake
SeriesAMD Raphael (Zen 4, Ryzen 7000)Intel Rocket LakeIntel Rocket Lake
Series: Rocket Lake Rocket Lake
AMD Ryzen 9 7950X3D4.2 - 5.7 GHz16 / 32 cores128 MB L3
AMD Ryzen 9 7900X4.7 - 5.6 GHz12 / 24 cores64 MB L3
AMD Ryzen 9 7900 « 3.7 - 5.4 GHz12 / 24 cores64 MB L3
AMD Ryzen 7 7700X4.5 - 5.4 GHz8 / 16 cores32 MB L3
AMD Ryzen 7 77003.8 - 5.3 GHz8 / 16 cores32 MB L3
AMD Ryzen 7 7800X3D4.2 - 5 GHz8 / 16 cores96 MB L3
AMD Ryzen 5 7600X4.7 - 5.3 GHz6 / 12 cores32 MB L3
AMD Ryzen 5 76003.8 - 5.1 GHz6 / 12 cores32 MB L3
Intel Core i9-11900K3.5 - 5.3 GHz8 / 16 cores16 MB L3
Intel Core i7-11700K « 3.6 - 5 GHz8 / 16 cores16 MB L3
Intel Core i7-117002.5 - 4.9 GHz8 / 16 cores16 MB L3
Intel Core i5-11600K3.9 - 4.9 GHz6 / 12 cores12 MB L3
Intel Core i5-11400F2.6 - 4.4 GHz6 / 12 cores12 MB L3
Intel Core i5-11400T1.3 - 3.7 GHz6 / 12 cores12 MB L3
Intel Core i9-11900K3.5 - 5.3 GHz8 / 16 cores16 MB L3
Intel Core i7-11700K3.6 - 5 GHz8 / 16 cores16 MB L3
Intel Core i7-11700 « 2.5 - 4.9 GHz8 / 16 cores16 MB L3
Intel Core i5-11600K3.9 - 4.9 GHz6 / 12 cores12 MB L3
Intel Core i5-11400F2.6 - 4.4 GHz6 / 12 cores12 MB L3
Intel Core i5-11400T1.3 - 3.7 GHz6 / 12 cores12 MB L3
Clock3700 - 5400 MHz3600 - 5000 MHz2500 - 4900 MHz
L1 Cache768 KB640 KB640 KB
L2 Cache12 MB4 MB4 MB
L3 Cache64 MB16 MB16 MB
Cores / Threads12 / 248 / 168 / 16
TDP65 Watt125 Watt65 Watt
Transistors9.9 Million
Technology5 nm14 nm14 nm
Voltage0.650 - 1.475V V
Die Size262 mm2276 mm2
max. Temp.95 °C100 °C100 °C
SocketAM5 (LGA 1718)LGA1200LGA1200
FeaturesMMX(+), SSE, SSE2, SSE3, SSSE3, SSE4.1, SSE4.2, SSE4A, x86-64, AMD-V, AES, AVX, AVX2, AVX512F, FMA3, SHA, Precision Boost 2DDR4-3200 RAM, PCIe 4, 8 GT/s bus, DL Boost, GNA, vPro, MMX, SSE, SSE2, SSE3, SSSE3, SSE4.1, SSE4.2, AVX, AVX2, AVX-512, BMI2, ABM, FMA, ADX, VMX, SMX, SMEP, SMAP, MPX, EIST, TM1, TM2, HT, Turbo, SST, AES-NI, RDRAND, RDSEED, SHADDR4-3200 RAM, PCIe 4, 8 GT/s bus, DL Boost, GNA, vPro, MMX, SSE, SSE2, SSE3, SSSE3, SSE4.1, SSE4.2, AVX, AVX2, AVX-512, BMI2, ABM, FMA, ADX, VMX, SMX, SMEP, SMAP, MPX, EIST, TM1, TM2, HT, Turbo, SST, AES-NI, RDRAND, RDSEED, SHA
iGPUAMD Radeon Graphics (Ryzen 7000) ( - 2200 MHz)Intel UHD Graphics Xe 750 32EUs (Rocket Lake) (350 - 1300 MHz)Intel UHD Graphics 750 (350 - 1300 MHz)
Architecturex86x86x86
Announced
Manufacturerwww.amd.comark.intel.comark.intel.com

Benchmarks

Performance Rating - CB R15 + R20 + 7-Zip + X265 + Blender + 3DM11 CPU - R9 7900
46.1 pt (77%)
Restrict / Search: Model: Max. age: years
Performance Rating - CB R15 + R20 + 7-Zip + X265 + Blender + 3DM11 CPU - i7-11700K
36.8 pt (61%)
Restrict / Search: Model: Max. age: years
Performance Rating - CB R15 + R20 + 7-Zip + X265 + Blender + 3DM11 CPU - i7-11700
35.2 pt (59%)
Restrict / Search: Model: Max. age: years
Cinebench R23 - Cinebench R23 Multi Core
24776 Points (23%)
14281 Points (13%)
10287 Points (10%)
Cinebench R23 - Cinebench R23 Single Core
1966 Points (83%)
1558 Points (66%)
1529 Points (64%)
Cinebench R20 - Cinebench R20 CPU (Single Core)
762 Points (83%)
min: 580     avg: 588     median: 588 (64%)     max: 596 Points
579 Points (63%)
Cinebench R20 - Cinebench R20 CPU (Multi Core)
9703 Points (24%)
min: 5082     avg: 5361     median: 5361 (13%)     max: 5640 Points
3986 Points (10%)
Cinebench R15 - Cinebench R15 CPU Multi 64 Bit
4020 Points (25%)
min: 2265     avg: 2299     median: 2299 (15%)     max: 2333 Points
1767 Points (11%)
Cinebench R15 - Cinebench R15 CPU Single 64 Bit
315 Points (87%)
240 Points (66%)
233 Points (65%)
Cinebench R11.5 - Cinebench R11.5 CPU Multi 64 Bit
45.3 Points (59%)
25.6 Points (33%)
19.8 Points (26%)
Cinebench R11.5 - Cinebench R11.5 CPU Single 64 Bit
3.7 Points (87%)
2.9 Points (68%)
2.8 Points (66%)
Cinebench R10 - Cinebench R10 Rend. Single (32bit)
8339 Points (50%)
9621 Points (58%)
9493 Points (57%)
Cinebench R10 - Cinebench R10 Rend. Multi (32bit)
60934 Points (44%)
58342 Points (42%)
51493 Points (37%)
Cinebench R10 - Cinebench R10 Rend. Multi (64bit)
68932 Points (44%)
Cinebench R10 - Cinebench R10 Rend. Single (64bit)
12748 Points (16%)
wPrime 2.10 - wPrime 2.0 1024m *
100%
1 R9 7900 +
46.8 s (1%)
115.5 s (1%)
wPrime 2.10 - wPrime 2.0 32m *
3 s (1%)
4.8 s (1%)
4.2 s (1%)
WinRAR - WinRAR 4.0
100%
1 R9 7900 +
10154 Points (16%)
5962 Points (9%)
7-Zip 18.03 - 7-Zip 18.03 Multi Thread 4 runs
112881 MIPS (65%)
57129 MIPS (33%)
44752 MIPS (26%)
7-Zip 18.03 - 7-Zip 18.03 Single Thread 4 runs
7936 MIPS (94%)
6157 MIPS (73%)
5810 MIPS (68%)
X264 HD Benchmark 4.0 - x264 Pass 2
207 fps (5%)
128 fps (3%)
93.1 fps (2%)
X264 HD Benchmark 4.0 - x264 Pass 1
355.5 fps (9%)
292.5 fps (7%)
267.2 fps (7%)
HWBOT x265 Benchmark v2.2 - HWBOT x265 4k Preset
31.2 fps (55%)
16.3 fps (29%)
12.6 fps (22%)
TrueCrypt - TrueCrypt Serpent
2 GB/s (59%)
1.2 GB/s (35%)
1.1 GB/s (32%)
TrueCrypt - TrueCrypt Twofish
3.1 GB/s (53%)
1.9 GB/s (33%)
1.8 GB/s (31%)
TrueCrypt - TrueCrypt AES
21.5 GB/s (56%)
12.7 GB/s (33%)
12 GB/s (31%)
Blender - Blender 3.3 Classroom CPU *
100%
1 R9 7900 +
199 Seconds (3%)
Blender - Blender 2.79 BMW27 CPU *
125 Seconds (1%)
221 Seconds (2%)
295 Seconds (2%)
R Benchmark 2.5 - R Benchmark 2.5 *
0.4 sec (8%)
0.5 sec (11%)
0.5 sec (11%)
3DMark 06 - CPU - 3DMark 06 - CPU
19451 Points (41%)
16388 Points (35%)
14738 Points (31%)
Super Pi mod 1.5 XS 1M - Super Pi mod 1.5 XS 1M *
6.7 s (1%)
20.2 s (4%)
6.9 s (1%)
Super Pi mod 1.5 XS 2M - Super Pi mod 1.5 XS 2M *
100%
1 R9 7900 +
13.9 s (1%)
15.1 s (1%)
Super Pi Mod 1.5 XS 32M - Super Pi mod 1.5 XS 32M *
329 s (1%)
685 s (3%)
387.7 s (2%)
3DMark Vantage - 3DM Vant. Perf. CPU no Physx
61978 Points (48%)
3DMark 11 - 3DM11 Performance Physics
26325 Points (65%)
17324 Points (43%)
18083 Points (45%)
3DMark - 3DMark Ice Storm Physics
70388 Points (57%)
77844 Points (63%)
3DMark - 3DMark Ice Storm Extreme Physics
77687 Points (63%)
3DMark - 3DMark Ice Storm Unlimited Physics
78896 Points (63%)
3DMark - 3DMark Cloud Gate Physics
18593 Points (47%)
18042 Points (46%)
3DMark - 3DMark Fire Strike Standard Physics
25557 Points (46%)
25831 Points (46%)
3DMark - 3DMark Time Spy CPU
100%
1 R9 7900 +
14817 Points (62%)
11243 Points (47%)
Geekbench 6.5 - Geekbench 6.5 Single-Core
2990 Points (72%)
2585 Points (63%)
2173 Points (53%)
Geekbench 6.5 - Geekbench 6.5 Multi-Core
15725 Points (61%)
11679 Points (45%)
8087 Points (31%)
Geekbench 6.0 - Geekbench 6.0 Single-Core
100%
1 R9 7900 +
min: 2848     avg: 2859     median: 2858.5 (91%)     max: 2869 Points
Geekbench 6.0 - Geekbench 6.0 Multi-Core
100%
1 R9 7900 +
min: 16864     avg: 16913     median: 16912.5 (69%)     max: 16961 Points
Geekbench 5.5 - Geekbench 5.1 - 5.5 64 Bit Single-Core
2203 Points (84%)
min: 1721     avg: 1766     median: 1765.5 (67%)     max: 1810 Points
1681 Points (64%)
Geekbench 5.5 - Geekbench 5.1 - 5.5 64 Bit Multi-Core
17880 Points (32%)
min: 10269     avg: 10787     median: 10786.5 (19%)     max: 11304 Points
9760 Points (17%)
Geekbench 5.0 - Geekbench 5.0 64 Bit Single-Core
100%
1 R9 7900 +
2096 Points (9%)
1677 Points (7%)
Geekbench 5.0 - Geekbench 5.0 64 Bit Multi-Core
100%
1 R9 7900 +
17581 Points (55%)
9706 Points (31%)
Geekbench 4.4 - Geekbench 4.1 - 4.4 64 Bit Single-Core
100%
1 R9 7900 +
8861 Points (88%)
7173 Points (72%)
Geekbench 4.4 - Geekbench 4.1 - 4.4 64 Bit Multi-Core
100%
1 R9 7900 +
65241 Points (64%)
37795 Points (37%)
Mozilla Kraken 1.1 - Kraken 1.1 Total Score *
452 ms (1%)
603 ms (1%)
601 ms (1%)
Sunspider - Sunspider 1.0 Total Score *
124.2 ms (1%)
Octane V2 - Octane V2 Total Score
71212 Points (52%)
WebXPRT 4 - WebXPRT 4 Score
100%
1 R9 7900 +
302 Points (83%)
WebXPRT 3 - WebXPRT 3 Score
366 Points (66%)
254 Points (46%)
256 Points (46%)
CrossMark - CrossMark Overall
2322 Points (87%)
1775 Points (66%)
1701 Points (64%)
Power Consumption - Prime95 Power Consumption - external Monitor *
100%
1 R9 7900 +
203 Watt (35%)
210 Watt (36%)
110.5 Watt (19%)
Power Consumption - Cinebench R15 Multi Power Consumption - external Monitor *
100%
1 R9 7900 +
196.9 Watt (36%)
244 Watt (45%)
174.1 Watt (32%)
Power Consumption - Idle Power Consumption - external Monitor *
100%
1 R9 7900 +
106.9 Watt (71%)
19 Watt (13%)
Power Consumption - Power Efficiency - Cinebench R15 Multi external Monitor
100%
1 R9 7900 +
20.4 Points per Watt (15%)
9.6 Points per Watt (7%)
10.1 Points per Watt (8%)

Average Benchmarks AMD Ryzen 9 7900 → 100% n=32

Average Benchmarks Intel Core i7-11700K → 69% n=32

Average Benchmarks Intel Core i7-11700 → 66% n=32

- Range of benchmark values for this graphics card
red legend - Average benchmark values for this graphics card
* Smaller numbers mean a higher performance
1 This benchmark is not used for the average calculation

v1.34
log 01. 23:02:23

#0 ran 0s before starting gpusingle class +0s ... 0s

#1 checking url part for id 15014 +0s ... 0s

#2 checking url part for id 12999 +0s ... 0s

#3 checking url part for id 14525 +0s ... 0s

#4 redirected to Ajax server, took 1759352543s time from redirect:0 +0s ... 0s

#5 did not recreate cache, as it is less than 5 days old! Created at Wed, 01 Oct 2025 05:17:55 +0200 +0s ... 0s

#6 composed specs +0.006s ... 0.006s

#7 did output specs +0s ... 0.006s

#8 getting avg benchmarks for device 15014 +0.006s ... 0.012s

#9 got single benchmarks 15014 +0.005s ... 0.017s

#10 getting avg benchmarks for device 12999 +0.004s ... 0.022s

#11 got single benchmarks 12999 +0.005s ... 0.027s

#12 getting avg benchmarks for device 14525 +0.004s ... 0.031s

#13 got single benchmarks 14525 +0.005s ... 0.036s

#14 got avg benchmarks for devices +0s ... 0.036s

#15 min, max, avg, median took s +0.069s ... 0.105s

#16 return log +0s ... 0.105s

Please share our article, every link counts!
Mail Logo
> Expert Reviews and News on Laptops, Smartphones and Tech Innovations > Benchmarks / Tech > Processor Comparison - Head 2 Head
Redaktion, 2017-09- 8 (Update: 2023-07- 1)