Notebookcheck Logo

AMD Ryzen 3 4300U vs Intel Core i5-L16G7

AMD Ryzen 3 4300U

► remove from comparison AMD R3 4300U

The AMD Ryzen 3 4300U is a processor for thin and light laptops based on the Renoir family. The 4300U integrates four cores based on the Zen 2 microarchitecture (quad core CPU). They are clocked at 2.7 (guaranteed base clock) to 3.7 GHz (Turbo) without SMT / Hyperthreading support (4 threads). The chip is manufactured on the modern 7 nm TSMC process and partly thanks to it AMD advertises a 2x improved performance per Watt for the Renoir chips. Compared to the faster Ryzen 5 4000 CPUs (e.g., Ryzen 5 4600U), the Ryzen 3 only offers 4 cores and lower Turbo clock speeds.

In addition to the four CPU cores, the APU also has the Radeon RX Vega 5 integrated graphics card with 5 CUs and up to 1400 MHz. The dual channel memory controller supports DDR4-3200 and energy efficient LPDDR4-4266 RAM. Furthermore, 4 MB of Level 3 cache can be found on the chip. See our hub page on the Renoir Processors for more information.

Performance

The average 4300U in our database matches the Core i5-1035G4 and the Core i5-11300H, both quad-core chips, in multi-thread performance. Technically a lower mid-range CPU, this Ryzen is light years ahead of Intel Pentiums and AMD Athlons that so many sub-US$500 laptops ship with.

Your mileage may vary depending on how high the CPU power limits are and how competent the cooling solution of our system is.

Power consumption

The Ryzen 3 series chip has a default TDP (also known as the long-term power limit) of 15 W, a value that laptop manufacturers are free to change to anything between 10 W and 25 W with performance and clock speeds changing accordingly as a result. By going for the lowest value, it is possible to build passively cooled tablets, laptops, mini-PCs around this APU.

The 7 nm TSMC process the Ryzen 3 4300U is manufactured on makes for average, as of mid 2023, energy efficiency.

Intel Core i5-L16G7

► remove from comparison Intel i5-L16G7

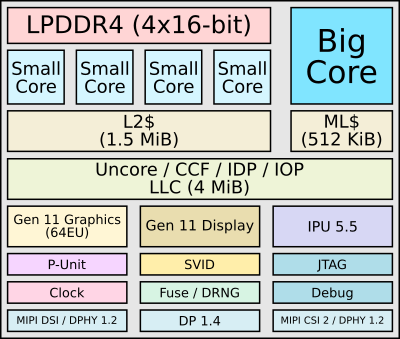
The Core i5-L16G7 is an SoC with 5 processor cores based on the Lakefield architecture. It uses one fast Sunny Cove core (known from Ice-Lake CPUs but without AVX512) with up to 3 GHz and 4 small Tremont cores (Atom / Celeron) with up to 2.8 GHz. Using all 5 cores, the CPU can reach up to 1.8 GHz, base clock speed is 1.4 GHz. The CPU does not support HyperThreading / SMT. The rest of the SoC is similar to the Ice Lake chips, like the Gen 11 graphics card with 64 EUs (similar to the Iris Plus G7 but only clocked at 500 MHz and using the UHD Graphics name).

Performance

The average L16G7 in our database is in the same league as the Pentium N6000 and also the Core i3-1110G4, as far as multi-thread benchmark scores are concerned. This kind of performance is only sufficient for basic day-to-day activities as of late 2023.

Your mileage may vary depending on how competent the cooling solution of your laptop is and how high the CPU power limits are.

With a specified TDP of 7 Watt (PL1, 9.5 Watt PL2), the CPU is well suited for thin and light laptops and Windows based tablets. / 2-in-1. Intel claims that the standby power was greatly reduced (91% better compared to the i7-8500Y with 2.5 mW). The SoC is manufactured in 10nm and uses the Intel Foveros 3D Packaging technology. Foveros is used to stack the in 22FFL manufactured I/O die, the compute die in 10nm and up to 8 GB LPDDR4X-4267.

ModelAMD Ryzen 3 4300UIntel Core i5-L16G7
SeriesAMD Renoir (Ryzen 4000 APU)Intel Lakefield
CodenameRenoir-U (Zen 2)Lakefield
Series: Lakefield Lakefield
AMD Ryzen 7 4980U compare2 - 4.4 GHz8 / 16 cores8 MB L3
AMD Ryzen 7 4800U compare1.8 - 4.2 GHz8 / 16 cores8 MB L3
AMD Ryzen 7 4700U compare2 - 4.1 GHz8 / 8 cores8 MB L3
AMD Ryzen 5 4680U compare2.2 - 4 GHz6 / 12 cores8 MB L3
AMD Ryzen 5 4600U compare2.1 - 4 GHz6 / 12 cores8 MB L3
AMD Ryzen 5 4500U compare2.3 - 4 GHz6 / 6 cores8 MB L3
AMD Ryzen 3 4300U « 2.7 - 3.7 GHz4 / 4 cores4 MB L3
Intel Core i5-L16G7 « 1.4 - 3 GHz5 / 5 cores
Intel Core i3-L13G4 compare0.8 - 2.8 GHz5 / 5 cores4 MB L3
Clock2700 - 3700 MHz1400 - 3000 MHz
L1 Cache256 KB
L2 Cache2 MB
L3 Cache4 MB
Cores / Threads4 / 45 / 5
TDP15 Watt7 Watt
Technology7 nm10 nm
max. Temp.105 °C100 °C
SocketFP6CSP1016
FeaturesDDR4-3200/LPDDR4-4266 RAM, PCIe 3, MMX, SSE, SSE2, SSE3, SSSE3, SSE4A, SSE4.1, SSE4.2, AVX, AVX2, BMI2, ABM, FMA, ADX, SMEP, SMAP, CPB, AES-NI, RDRAND, RDSEED, SHA, SMELPDDR4x-4266 RAM, PCIe 3, 4 GT/s bus, MMX, SSE, SSE2, SSE3, SSSE3, SSE4.1, SSE4.2, VMX, SMEP, SMAP, EIST, TM1, TM2, Turbo, SST, AES-NI, RDRAND, RDSEED, SHA
iGPUAMD Radeon RX Vega 5 ( - 1400 MHz)Intel UHD Graphics G7 (Lakefield GT2 64 EU) (200 - 500 MHz)
Architecturex86x86
Announced
Manufacturerwww.amd.comark.intel.com
$281 U.S.

Benchmarks

Performance Rating - CB R15 + R20 + 7-Zip + X265 + Blender + 3DM11 CPU - R3 4300U
28.4 pt (39%)
Performance Rating - CB R15 + R20 + 7-Zip + X265 + Blender + 3DM11 CPU - i5-L16G7
21.1 pt (29%)
Cinebench R23 - Cinebench R23 Multi Core
3571 Points (3%)
1810 Points (2%)
Cinebench R23 - Cinebench R23 Single Core
1074 Points (46%)
710 Points (30%)
Cinebench R20 - Cinebench R20 CPU (Single Core)
min: 412     avg: 420.3     median: 422 (47%)     max: 427 Points
min: 276     avg: 282.5     median: 282.5 (31%)     max: 289 Points
Cinebench R20 - Cinebench R20 CPU (Multi Core)
min: 1432     avg: 1537     median: 1571 (4%)     max: 1609 Points
min: 609     avg: 648     median: 647.5 (2%)     max: 686 Points
Cinebench R15 - Cinebench R15 CPU Multi 64 Bit
min: 545     avg: 563     median: 562.5 (4%)     max: 580 Points
255 Points (2%)
Cinebench R15 - Cinebench R15 CPU Single 64 Bit
min: 162.8     avg: 163.9     median: 163.9 (49%)     max: 165 Points
min: 88.3     avg: 89.5     median: 89.5 (27%)     max: 90.7 Points
Cinebench R11.5 - Cinebench R11.5 CPU Multi 64 Bit
3.2 Points (4%)
Cinebench R11.5 - Cinebench R11.5 CPU Single 64 Bit
1.4 Points (35%)
Cinebench R10 - Cinebench R10 Rend. Single (32bit)
4079 Points (25%)
Cinebench R10 - Cinebench R10 Rend. Multi (32bit)
9003 Points (7%)
wPrime 2.10 - wPrime 2.0 1024m *
879 s (10%)
wPrime 2.10 - wPrime 2.0 32m *
28.6 s (6%)
WinRAR - WinRAR 4.0
2397 Points (4%)
7-Zip 18.03 - 7-Zip 18.03 Multli Thread 4 runs
min: 15043     avg: 15824     median: 15824 (9%)     max: 16605 MIPS
min: 7230     avg: 7587     median: 7586.5 (4%)     max: 7943 MIPS
7-Zip 18.03 - 7-Zip 18.03 Single Thread 4 runs
min: 4014     avg: 4064     median: 4063.5 (49%)     max: 4113 MIPS
min: 3174     avg: 3211     median: 3211 (38%)     max: 3248 MIPS
X264 HD Benchmark 4.0 - x264 Pass 2
35 fps (12%)
X264 HD Benchmark 4.0 - x264 Pass 1
172.3 fps (40%)
HWBOT x265 Benchmark v2.2 - HWBOT x265 4k Preset
min: 4.37     avg: 4.9     median: 4.9 (9%)     max: 5.36 fps
min: 1.44     avg: 1.5     median: 1.5 (3%)     max: 1.48 fps
TrueCrypt - TrueCrypt Serpent
0.3 GB/s (0%)
TrueCrypt - TrueCrypt Twofish
0.6 GB/s (10%)
TrueCrypt - TrueCrypt AES
3.2 GB/s (8%)
Blender - Blender 3.3 Classroom CPU *
min: 1310     avg: 1414     median: 1413.5 (18%)     max: 1517 Seconds
Blender - Blender 2.79 BMW27 CPU *
min: 868     avg: 888     median: 887.5 (6%)     max: 907 Seconds
min: 1897     avg: 2027     median: 2026.5 (14%)     max: 2156 Seconds
R Benchmark 2.5 - R Benchmark 2.5 *
min: 0.652     avg: 0.7     median: 0.7 (14%)     max: 0.686 sec
min: 0.897     avg: 0.9     median: 0.9 (20%)     max: 0.987 sec
3DMark 06 - CPU - 3DMark 06 - CPU
6068 Points (13%)
Super Pi mod 1.5 XS 1M - Super Pi mod 1.5 XS 1M *
11.7 s (3%)
Super Pi mod 1.5 XS 2M - Super Pi mod 1.5 XS 2M *
25.9 s (1%)
Super Pi Mod 1.5 XS 32M - Super Pi mod 1.5 XS 32M *
622 s (3%)
3DMark Vantage - 3DM Vant. Perf. CPU no Physx
20566 Points (18%)
3DMark 11 - 3DM11 Performance Physics
6487 Points (18%)
min: 2926     avg: 3015     median: 3015 (8%)     max: 3104 Points
3DMark - 3DMark Ice Storm Physics
57907 Points (47%)
3DMark - 3DMark Ice Storm Extreme Physics
63885 Points (52%)
3DMark - 3DMark Ice Storm Unlimited Physics
66341 Points (56%)
3DMark - 3DMark Cloud Gate Physics
5660 Points (14%)
min: 2831     avg: 2834     median: 2834 (7%)     max: 2837 Points
3DMark - 3DMark Fire Strike Standard Physics
8220 Points (15%)
min: 4138     avg: 4306     median: 4305.5 (8%)     max: 4473 Points
3DMark - 3DMark Time Spy CPU
2874 Points (12%)
Geekbench 5.5 - Geekbench 5.1 - 5.4 64 Bit Single-Core
min: 1027     avg: 1047     median: 1046.5 (44%)     max: 1066 Points
min: 797     avg: 827     median: 826.5 (35%)     max: 856 Points
Geekbench 5.5 - Geekbench 5.1 - 5.4 64 Bit Multi-Core
min: 3330     avg: 3439     median: 3438.5 (6%)     max: 3547 Points
min: 1441     avg: 1634     median: 1633.5 (3%)     max: 1826 Points
Geekbench 5.0 - Geekbench 5.0 64 Bit Single-Core
1036 Points (5%)
Geekbench 5.0 - Geekbench 5.0 64 Bit Multi-Core
3358 Points (11%)
Geekbench 4.4 - Geekbench 4.1 - 4.4 64 Bit Single-Core
4517 Points (45%)
Geekbench 4.4 - Geekbench 4.1 - 4.4 64 Bit Multi-Core
13503 Points (15%)
Geekbench 4.0 - Geekbench 4.0 64 Bit Single-Core
4404 Points (60%)
Geekbench 4.0 - Geekbench 4.0 64 Bit Multi-Core
12789 Points (31%)
Geekbench 3 - Geekbench 3 32 Bit Multi-Core
13134 Points (23%)
Geekbench 3 - Geekbench 3 32 Bit Single-Core
4042 Points (79%)
Geekbench 3 - Geekbench 3 64 Bit Multi-Core
13741 Points (22%)
Geekbench 3 - Geekbench 3 64 Bit Single-Core
4291 Points (64%)
Geekbench 2 - 32 Bit - Geekbench Stream
8680 Points (70%)
Geekbench 2 - 32 Bit - Geekbench Memory
6660 Points (60%)
Geekbench 2 - 32 Bit - Geekbench Floating Point
14171 Points (28%)
Geekbench 2 - 32 Bit - Geekbench Integer
11775 Points (24%)
Geekbench 2 - 32 Bit - Geekbench Total Score
11281 Points (30%)
Mozilla Kraken 1.1 - Kraken 1.1 Total Score *
min: 907     avg: 974     median: 973.5 (1%)     max: 1040 ms
min: 1252     avg: 1278     median: 1277.5 (1%)     max: 1303 ms
Sunspider - Sunspider 1.0 Total Score *
102.5 ms (1%)
Octane V2 - Octane V2 Total Score
33152 Points (30%)
min: 31228     avg: 32455     median: 32455 (29%)     max: 33682 Points
WebXPRT 4 - WebXPRT 4 Score
152.3 Points (44%)
WebXPRT 3 - WebXPRT 3 Score
min: 185     avg: 194     median: 194 (40%)     max: 203 Points
min: 121     avg: 124.5     median: 124.5 (26%)     max: 128 Points
CrossMark - CrossMark Overall
871 Points (33%)
Power Consumption - Prime95 Power Consumption - external Monitor *
33.4 Watt (6%)
Power Consumption - Cinebench R15 Multi Power Consumption - external Monitor *
31.7 Watt (6%)
Power Consumption - Cinebench R15 Multi Power Efficiency - external Monitor
18.3 Points per Watt (14%)

Average Benchmarks AMD Ryzen 3 4300U → 100% n=23

Average Benchmarks Intel Core i5-L16G7 → 60% n=23

- Range of benchmark values for this graphics card
- Average benchmark values for this graphics card
* Smaller numbers mean a higher performance
1 This benchmark is not used for the average calculation

Add one or more devices and compare

In the following list you can select (and also search for) devices that should be added to the comparison. You can select more than one device.

restrict list:

show all (including archived), 2024, 2023
v1.26
log 26. 21:31:27

#0 checking url part for id 11697 +0s ... 0s

#1 checking url part for id 12215 +0s ... 0s

#2 not redirecting to Ajax server +0s ... 0s

#3 did not recreate cache, as it is less than 5 days old! Created at Thu, 25 Apr 2024 05:38:32 +0200 +0.001s ... 0.001s

#4 composed specs +0.025s ... 0.026s

#5 did output specs +0s ... 0.026s

#6 getting avg benchmarks for device 11697 +0.016s ... 0.042s

#7 got single benchmarks 11697 +0.017s ... 0.059s

#8 getting avg benchmarks for device 12215 +0.014s ... 0.073s

#9 got single benchmarks 12215 +0.008s ... 0.081s

#10 got avg benchmarks for devices +0s ... 0.081s

#11 min, max, avg, median took s +0.221s ... 0.303s

#12 return log +0.022s ... 0.325s

Please share our article, every link counts!
> Expert Reviews and News on Laptops, Smartphones and Tech Innovations > Benchmarks / Tech > Processor Comparison - Head 2 Head
Redaktion, 2017-09- 8 (Update: 2023-07- 1)