Notebookcheck Logo

Mediatek Helio G99 vs HiSilicon Kirin 820

Mediatek Helio G99

► remove from comparison Mediatek Helio G99

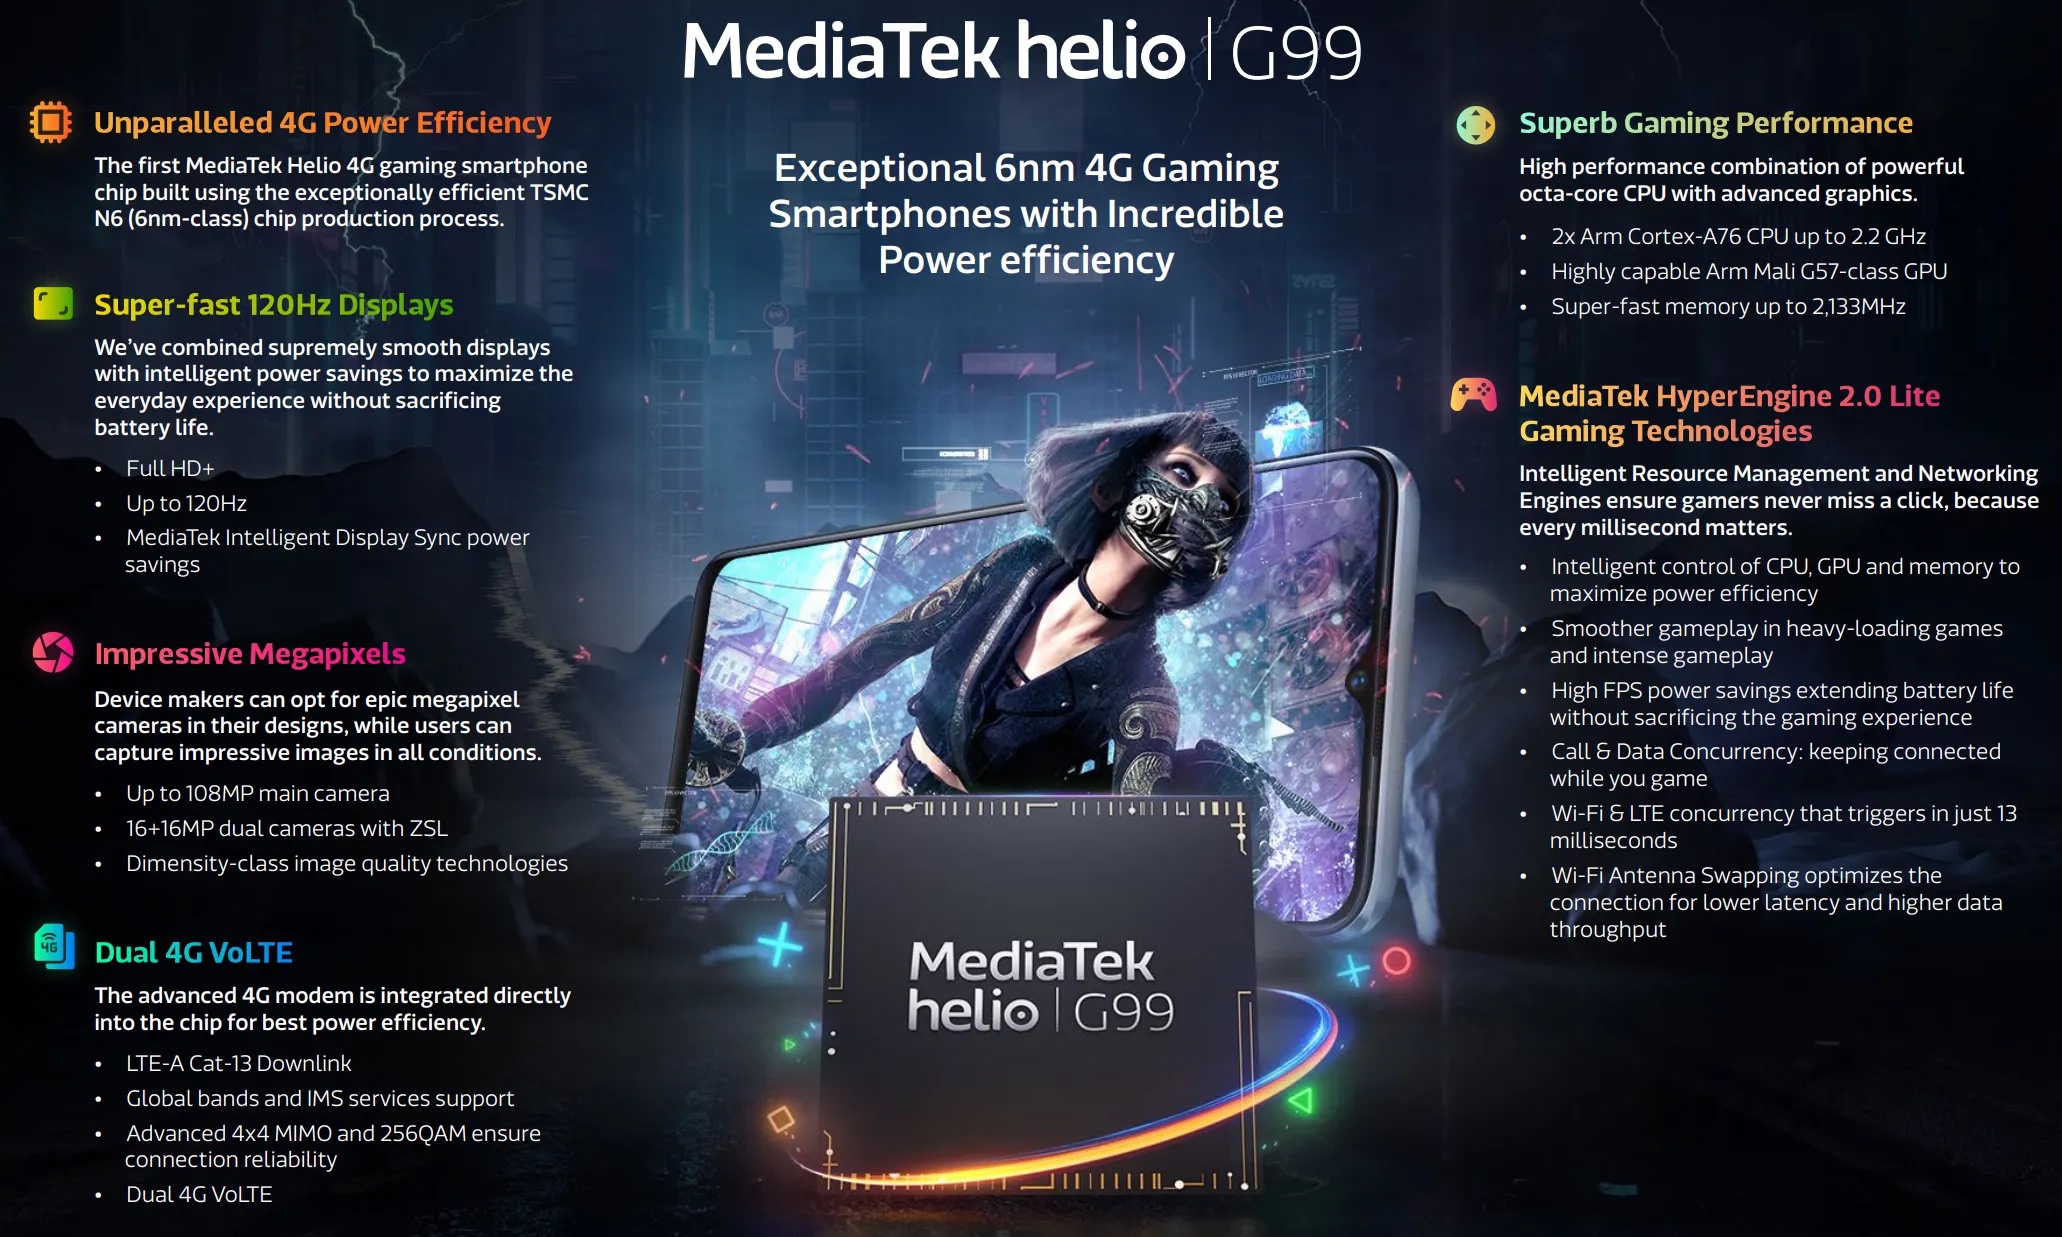
The Mediatek Helio G99 is a mainstream ARM SoC for smartphones (mainly Android based) that was introduced in 2022. It is manufactured in a 6 nm FinFET process and is equipped with 2x big ARM Cortex-A76 cores with up to 2.2 GHz and 6x small and power efficient ARM Cortex-A55 cores (max. 2 GHz) in two clusters (bigLITTLE). The chip integrates an ARM Mali-G57 MC2 (two cores). Compared to the older Helio G96, the G99 is manufactured in the more recent 6nm process and clocks higher.

Furthermore, the integrated LTE / 4G modem supports Cat-13 download speeds. Wi-Fi 5 is also integrated (a/b/g/n/ac). The memory controller supportsLPDDR4x with up to 4,266 Mbps.

HiSilicon Kirin 820

► remove from comparison HiSilicon Kirin 820

The HiSilicon Kirin 820 is a ARM-based mid-range Octa-Core-SoC for Android based smartphones and tablets. It was announced mid 2020 and contains 8 processor cores. One fast ARM Cortex-A76 core with up to 2.36 GHz, three addition A76 cores at up to 2.22 (as the old Kirin 810) and four efficiency Cortex-A55 cores at up to 1.88 GHz. Furthermore, the SoC integrates a 5G modem and a fast mid-range ARM Mali-G57 MP6 graphics card. For AI acceleration, the Kirin 820 integrates a DaVinci NPU.

The performance of the CPU part in our tests was slightly higher than the old Kirin 810 (thanks to the fast performance core). Huawei advertises 27% performance advantage for the CPU. The NPU and GPU have bigger performance gains with 73% and 38% more power.

The chip should also integrate Bluetooth 5 and WiFi 6.

The SoC is manufactured in the modern 7nm process at TSMC and therefore should be very energy efficient.

ModelMediatek Helio G99HiSilicon Kirin 820
CodenameCortex-A76 / A55Cortex-A76/-A55
SeriesMediatek Mediatek Helio G
Series: Mediatek Helio G Cortex-A76 / A55
Mediatek Helio G100 compare2 - 2.2 GHz8 / 8 cores Cortex-A76 / A55
Mediatek Helio G99 « 2 - 2.2 GHz8 / 8 cores Cortex-A76 / A55
Mediatek Helio G96 compare2 - 2.05 GHz8 / 8 cores Cortex-A76 / A55
Mediatek Helio G95 compare2 - 2.05 GHz8 / 8 cores Cortex-A76 / A55
Mediatek Helio G90T compare2.05 GHz8 / 8 cores Cortex-A76 / A55
Clock2000 - 2200 MHz1840 - 2360 MHz
Cores / Threads8 / 8
2 x 2.2 GHz ARM Cortex-A76
6 x 2.0 GHz ARM Cortex-A55
8 / 8
Technology6 nm7 nm
Features2x Cortex-A76, 6x Cortex-A55, 4G LTE Cat-12/13, 64MP AI-Camera support, LPDDR3/LPDDR4x-2133, eMMC 5.1, UFS 2.1, Beidou, Galileo, Glonass, GPS, Wi-Fi 5 (a/b/g/n/ac), AI Accelerator up to 1 TMACs, H.264 / H.265 / HEVC video encoding (4k30)ARM Mali-G52 MP6 GPU, 1x Cortex-A76 up to 2.36 GHz, 3x A76 nup to 2.2 GHz, 4x A55 up to 1.84 GHz, big.LITTLE, 5G TDD/FDD, Bluetooth 5, WiFi 6, AGPS, Glonass, Baidou
iGPUARM Mali-G57 MP2ARM Mali-G57 MP6
ArchitectureARMARM
Announced
Manufacturerwww.mediatek.comwww.hisilicon.com

Benchmarks

Performance Rating - Geekbench 5.5, PCM Work, Sling Shot Physics, Antutu v8 CPU - Kirin 820
0.9 pt (67%)
Restrict / Search: Model: Max. age: years
3DMark - 3DMark Ice Storm Unlimited Physics
41610 Points (33%)
4642 Points (44%)
3DMark - 3DMark Sling Shot (ES 3.0) Unlimited Physics
min: 3438     avg: 3596     median: 3630.5 (41%)     max: 3685 Points
4637 Points (53%)
Geekbench 6.0 - Geekbench 6.0 Single-Core
min: 714     avg: 717     median: 717 (23%)     max: 720 Points
Geekbench 6.0 - Geekbench 6.0 Multi-Core
min: 1916     avg: 1941     median: 1940.5 (8%)     max: 1965 Points
642 Points (22%)
2434 Points (4%)
Geekbench 5.0 - Geekbench 5.0 64 Bit Single-Core
555 Points (2%)
Geekbench 5.0 - Geekbench 5.0 64 Bit Multi-Core
1921 Points (6%)
Geekbench 4.4 - Geekbench 4.1 - 4.4 64 Bit Single-Core
min: 2512     avg: 2620     median: 2672 (27%)     max: 2675 Points
3113 Points (31%)
Geekbench 4.4 - Geekbench 4.1 - 4.4 64 Bit Multi-Core
min: 7018     avg: 7608     median: 7896 (8%)     max: 7911 Points
9860 Points (10%)
Geekbench 4.0 - Geekbench 4.0 64 Bit Single-Core
2625 Points (29%)
Geekbench 4.0 - Geekbench 4.0 64 Bit Multi-Core
min: 7492     avg: 7532     median: 7531.5 (10%)     max: 7571 Points
Geekbench 3 - Geekbench 3 64 Bit Multi-Core
min: 7124     avg: 7934     median: 7933.5 (12%)     max: 8743 Points
0 Points (0%)
Geekbench 3 - Geekbench 3 64 Bit Single-Core
min: 2334     avg: 2555     median: 2555 (38%)     max: 2776 Points
0 Points (0%)
Geekbench 2 - 32 Bit - Geekbench Stream
4235 Points (22%)
Geekbench 2 - 32 Bit - Geekbench Memory
5223 Points (36%)
Geekbench 2 - 32 Bit - Geekbench Floating Point
17014 Points (33%)
Geekbench 2 - 32 Bit - Geekbench Integer
7277 Points (15%)
Geekbench 2 - 32 Bit - Geekbench Total Score
9969 Points (26%)
Mozilla Kraken 1.1 - Kraken 1.1 Total Score *
min: 1600     avg: 1973     median: 1932.3 (2%)     max: 2443.7 ms
2254 ms (3%)
Octane V2 - Octane V2 Total Score
min: 17228     avg: 22118     median: 22384 (15%)     max: 26476 Points
19727 Points (13%)
WebXPRT 4 - WebXPRT 4 Score
min: 39     avg: 74.2     median: 81 (21%)     max: 89 Points
WebXPRT 3 - WebXPRT 3 Score
min: 80     avg: 95.4     median: 93.5 (17%)     max: 112 Points
115 Points (21%)
AnTuTu v8 - AnTuTu v8 UX
68406 Points (57%)
AnTuTu v8 - AnTuTu v8 MEM
52226 Points (42%)
AnTuTu v8 - AnTuTu v8 GPU
117476 Points (22%)
AnTuTu v8 - AnTuTu v8 CPU
131099 Points (47%)
AnTuTu v8 - AnTuTu v8 Total Score
369207 Points (36%)
Antutu v9 - AnTuTu v9 Total Score
min: 229468     avg: 317183     median: 319204 (16%)     max: 375956 Points
Antutu v9 - AnTuTu v9 CPU
min: 83150     avg: 98532     median: 100624 (25%)     max: 106860 Points
Antutu v10 - AnTuTu v10 Total Score
min: 383511     avg: 403419     median: 401641 (12%)     max: 422936 Points
Antutu v10 - AnTuTu v10 CPU
min: 120432     avg: 131716     median: 131438 (13%)     max: 140012 Points
PassMark PerformanceTest Mobile V1 - PerformanceTest Mobile V1 CPU Tests
238069 Points (31%)
PCMark for Android - PCM f. Android Storage 2.0 random write internal
min: 30.8     avg: 56     median: 63.7 (41%)     max: 71.8 MB/s
PCMark for Android - PCM f. Android Storage 2.0 seq write internal
min: 184.1     avg: 571     median: 681 (19%)     max: 830 MB/s
PCMark for Android - PCM f. Android Storage 2.0 random read internal
min: 17.6     avg: 33.8     median: 40.4 (20%)     max: 45.4 MB/s
PCMark for Android - PCM f. Android Storage 2.0 seq read internal
min: 719.36     avg: 789     median: 796 (20%)     max: 858 MB/s
PCMark for Android - PCM f. Android Storage 2.0 score
min: 14042     avg: 22881     median: 26431 (12%)     max: 28259 Points
PCMark for Android - PCM f. Android Computer Vision
8006 Points (42%)
PCMark for Android - PCM f. Android Storage
22692 Points (48%)
PCMark for Android - PCM f. Android Work Score 2.0
9527 Points (62%)
PCMark for Android - PCM f. Android Work Score
13099 Points (66%)

Average Benchmarks Mediatek Helio G99 → 100% n=11

Average Benchmarks HiSilicon Kirin 820 → 95% n=11

- Range of benchmark values for this graphics card
red legend - Average benchmark values for this graphics card
* Smaller numbers mean a higher performance
1 This benchmark is not used for the average calculation

Add one or more devices and compare

In the following list you can select (and also search for) devices that should be added to the comparison. You can select more than one device.

restrict list:
v1.35
log 13. 09:06:45

#0 ran 0s before starting gpusingle class +0s ... 0s

#1 checking url part for id 14649 +0s ... 0s

#2 checking url part for id 12581 +0s ... 0s

#3 redirected to Ajax server, took 1768291605s time from redirect:0 +0s ... 0s

#4 did not recreate cache, as it is less than 5 days old! Created at Tue, 13 Jan 2026 05:18:34 +0100 +0s ... 0s

#5 composed specs +0.004s ... 0.004s

#6 did output specs +0s ... 0.004s

#7 getting avg benchmarks for device 14649 +0.001s ... 0.005s

#8 got single benchmarks 14649 +0.027s ... 0.032s

#9 getting avg benchmarks for device 12581 +0.003s ... 0.036s

#10 got single benchmarks 12581 +0.004s ... 0.04s

#11 got avg benchmarks for devices +0s ... 0.04s

#12 No cached benchmark found, getting uncached values +0.01s ... 0.051s

#13 No cached benchmark found, getting uncached values +0.001s ... 0.051s

#14 min, max, avg, median took s +0.014s ... 0.065s

#15 return log +0.001s ... 0.066s

Please share our article, every link counts!
Mail Logo
Google Logo Add as a preferred
source on Google
> Expert Reviews and News on Laptops, Smartphones and Tech Innovations > Benchmarks / Tech > Processor Comparison - Head 2 Head
Redaktion, 2017-09- 8 (Update: 2023-07- 1)