GeForce RTX 2070 Super & RTX 2080 Super Performance Review

We got a glimpse of the new power-efficient Max-Q designs in the middle of April (see article), and although there was a bit of a coronavirus-related delay, we finally have the first Super devices with the faster Max-P variants in our labs. These new Super devices are the MSI GE66 Raider 10SFS with RTX 2070 Super and the Asus ROG Strix Scar 17 G732LXS with RTX 2080 Super, and they will serve as the basis for our performance test.
Test System
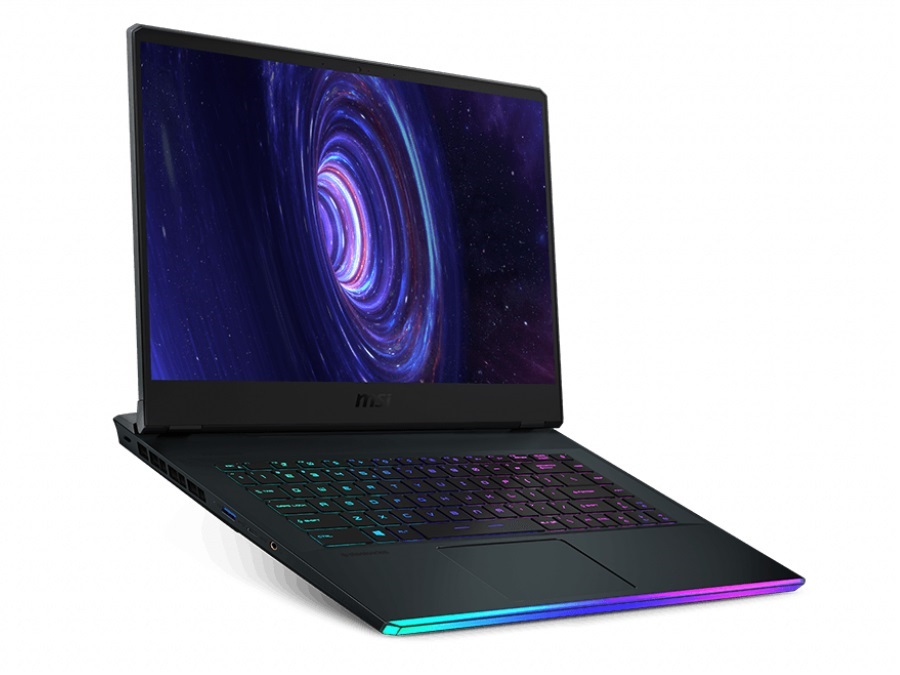
MSI GE66 Raider 10SFS
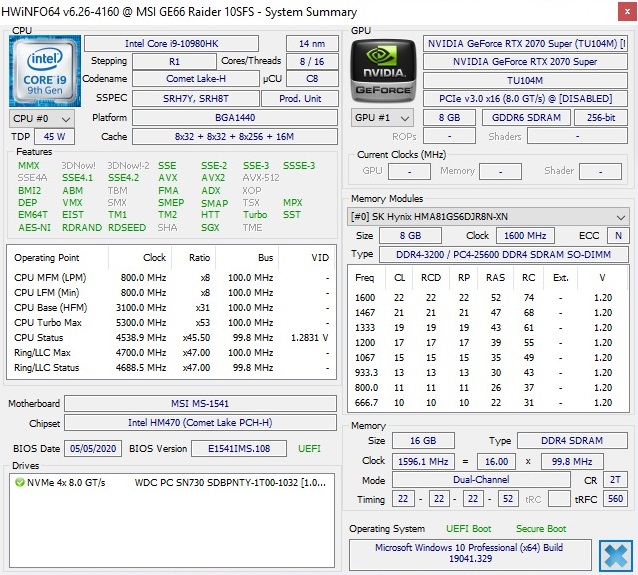
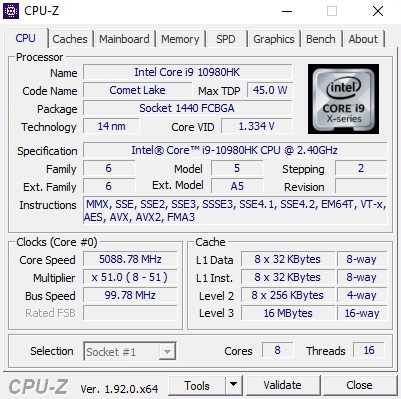
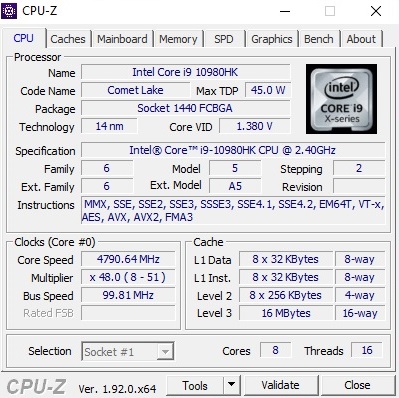
The GE66 Raider stands out visually from the old GE65 and is based on the design of its much heavier 17-inch counterpart, the GT76 Titan. The 10SFS model sports a Core i9-10980HK, which is currently the best laptop CPU from Intel's Comet Lake generation. The 10SFS model also has 2x 8 GB DDR4-3200 RAM in dual-channel mode. The operating system (Windows 10 Pro 64-bit) is located on a 1 TB NVMe SSD. ForceWare 446.14 was installed as a graphics driver on the test device.
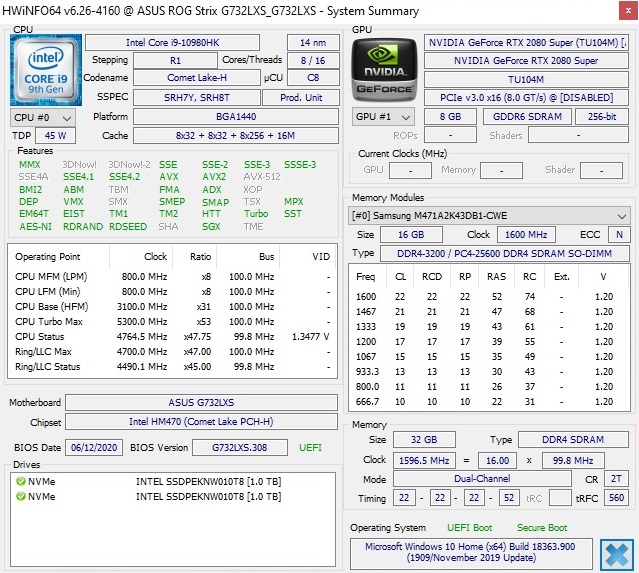
Asus ROG Strix Scar 17 G732LXS
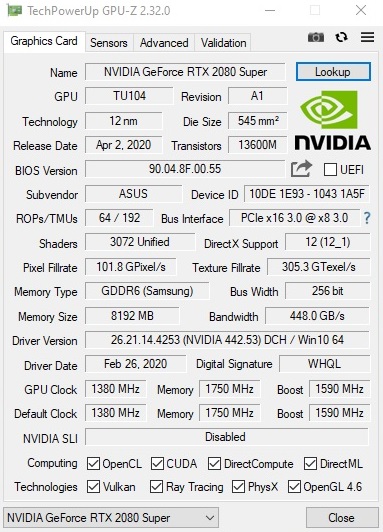
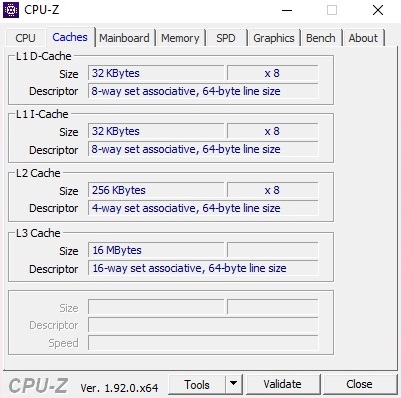
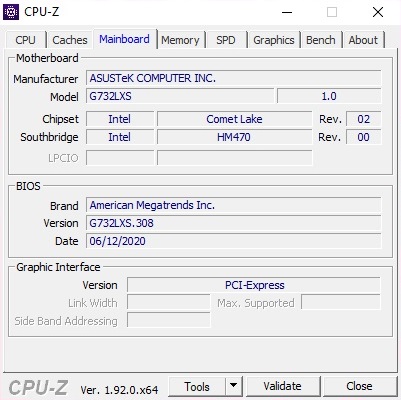
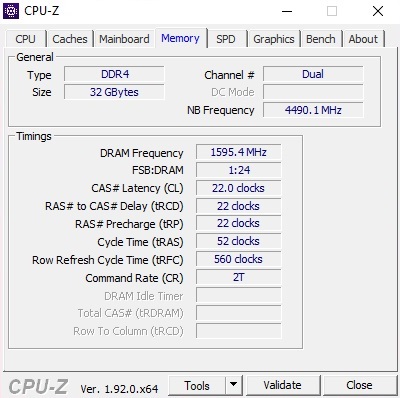
If you prefer a larger display, the Asus ROG Strix Scar 17, which we tested the best model of, is a good choice. This model, the G732LXS, offers a lush 2x 16 GB DDR4-3200 RAM (again dual-channel) and two 1 TB SSDs, which form a RAID-0 network together and house an installation of Windows 10 Home 64-bit. The package is rounded off by - the MSI GE66 sends its regards – a Core i9-10980HK. The ForceWare 442.53 preinstalled by Asus was used as the GPU driver.

Specifications
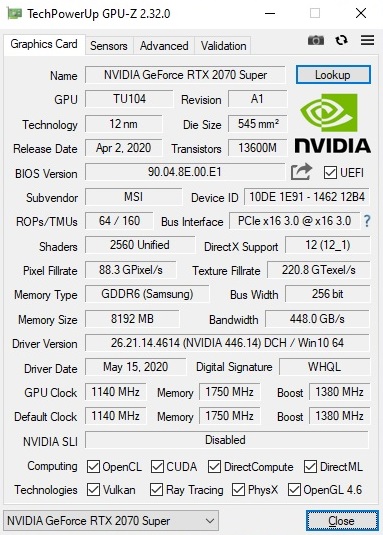
Users shouldn’t expect any significant improvements from the Super chips. Although Nvidia has made a few tiny changes compared to the standard versions, the most important specifications and features are largely the same or at least very similar to previous chips. While the RTX 2070 Super has 256 more shader units (2,560 vs 2,304 @RTX 2070), the RTX 2080 Super only has 128 more CUDA cores (3,072 vs 2,944 @RTX 2080). As you can see in the table below, the clock speeds have even been slightly reduced. The reduction primarily affects the RTX 2070 Super. The GDDR6 video memory is still 8 GB in size and connected via a 256-bit interface.
| Graphics Card | GeForce RTX 2070 | GeForce RTX 2070 Super | GeForce RTX 2080 | GeForce RTX 2080 Super |
|---|---|---|---|---|
| Shader Units | 2304 | 2560 | 2944 | 3072 |
| Core Clock Speed Base | 1215 MHz | 1140 MHz | 1380 MHz (150 Watt) | 1365 MHz (150 Watt) |
| Core Clock Speed Turbo | 1440 MHz | 1380 MHz | 1590 MHz (150 Watt) | 1560 MHz (150 Watt) |
| VRAM | 8 GB GDDR6 | 8 GB GDDR6 | 8 GB GDDR6 | 8 GB GDDR6 |
| Memory Bus Width | 256 Bit | 256 Bit | 256 Bit | 256 Bit |
| Memory Speed | 14000 MHz | 14000 MHz | 14000 MHz | 14000 MHz |
Important note: Similar to the last generation, there are several TDP versions of the RTX 2080 Super (more information can be found on the GPU page), some of which perform notably different. Depending on the laptop, the Super version can be slower than the normal RTX 2080. You can see this very clearly in the gaming benchmarks using the MSI GT76 (200 watts vs. 150 watts TDP). The results of the XMG Ultra 15, which appear in the benchmarks below, are a nice comparison because its GPU has an identical TDP to the RTX 2080 inside of the MSI GT76.
Benchmarks
DirectX 11
| 3DMark - 1920x1080 Fire Strike Graphics | |
| Asus Strix Scar 17 G732LXS | |
| Schenker XMG Ultra 15 | |
| MSI GE66 Raider 10SFS | |
| Acer Predator Triton 500 PT515-52-70N3 | |
| Gigabyte Aero 17 HDR XB | |
| Schenker XMG Ultra 15 | |
DirectX 12
| 3DMark - 2560x1440 Time Spy Graphics | |
| Asus Strix Scar 17 G732LXS | |
| Schenker XMG Ultra 15 | |
| Acer Predator Triton 500 PT515-52-70N3 | |
| MSI GE66 Raider 10SFS | |
| Gigabyte Aero 17 HDR XB | |
| Schenker XMG Ultra 15 | |
Ray tracing
| 3DMark - 2560x1440 Port Royal Graphics | |
| Asus Strix Scar 17 G732LXS | |
| Schenker XMG Ultra 15 | |
| Acer Predator Triton 500 PT515-52-70N3 | |
| MSI GE66 Raider 10SFS | |
| Gigabyte Aero 17 HDR XB | |
| Schenker XMG Ultra 15 | |
Gaming Benchmarks
Full HD (1920x1080)
| Control - 1920x1080 High Quality Preset | |
| MSI GT76 Titan DT 9SG | |
| Asus Strix Scar 17 G732LXS | |
| MSI GE66 Raider 10SFS | |
| Acer Predator Triton 500 PT515-52-70N3 | |
| MSI GP65 Leopard 9SF | |
| Gigabyte Aero 17 HDR XB | |
| Call of Duty Modern Warfare 2019 - 1920x1080 Maximum Settings AA:T2X Filmic SM | |
| MSI GT76 Titan DT 9SG | |
| Asus Strix Scar 17 G732LXS | |
| Acer Predator Triton 500 PT515-52-70N3 | |
| MSI GE66 Raider 10SFS | |
| MSI GP65 Leopard 9SF | |
| Gigabyte Aero 17 HDR XB | |
| Battlefield V - 1920x1080 Ultra Preset | |
| Schenker XMG Ultra 15 | |
| Asus Strix Scar 17 G732LXS | |
| MSI GE66 Raider 10SFS | |
| Gigabyte Aero 17 HDR XB | |
| Schenker XMG Ultra 15 | |
| Acer Predator Triton 500 PT515-52-70N3 | |
| Metro Exodus - 1920x1080 Ultra Quality AF:16x | |
| Asus Strix Scar 17 G732LXS | |
| MSI GT76 Titan DT 9SG | |
| MSI GE66 Raider 10SFS | |
| Acer Predator Triton 500 PT515-52-70N3 | |
| Gigabyte Aero 17 HDR XB | |
| Schenker XMG Neo 17 | |
QHD (2560x1440)
| Control - 2560x1440 High Quality Preset | |
| MSI GT76 Titan DT 9SG | |
| Asus Strix Scar 17 G732LXS | |
| MSI GE66 Raider 10SFS | |
| Acer Predator Triton 500 PT515-52-70N3 | |
| MSI GP65 Leopard 9SF | |
| Gigabyte Aero 17 HDR XB | |
| Call of Duty Modern Warfare 2019 - 2560x1440 Maximum Settings AA:T2X Filmic SM | |
| MSI GT76 Titan DT 9SG | |
| Asus Strix Scar 17 G732LXS | |
| Acer Predator Triton 500 PT515-52-70N3 | |
| MSI GP65 Leopard 9SF | |
| MSI GE66 Raider 10SFS | |
| Gigabyte Aero 17 HDR XB | |
| Battlefield V - 2560x1440 Ultra Preset | |
| Schenker XMG Ultra 15 | |
| Asus Strix Scar 17 G732LXS | |
| MSI GE66 Raider 10SFS | |
| Gigabyte Aero 17 HDR XB | |
| Acer Predator Triton 500 PT515-52-70N3 | |
| Schenker XMG Ultra 15 | |
| Metro Exodus - 2560x1440 Ultra Quality AF:16x | |
| Asus Strix Scar 17 G732LXS | |
| MSI GT76 Titan DT 9SG | |
| MSI GT76 Titan DT 9SG | |
| MSI GE66 Raider 10SFS | |
| Acer Predator Triton 500 PT515-52-70N3 | |
| Gigabyte Aero 17 HDR XB | |
| Schenker XMG Neo 17 | |
UHD (3840x2160)
| Control - 3840x2160 High Quality Preset | |
| MSI GT76 Titan DT 9SG | |
| Asus Strix Scar 17 G732LXS | |
| MSI GE66 Raider 10SFS | |
| Acer Predator Triton 500 PT515-52-70N3 | |
| MSI GP65 Leopard 9SF | |
| Gigabyte Aero 17 HDR XB | |
| Call of Duty Modern Warfare 2019 - 3840x2160 Maximum Settings AA:T2X Filmic SM | |
| MSI GT76 Titan DT 9SG | |
| Asus Strix Scar 17 G732LXS | |
| Acer Predator Triton 500 PT515-52-70N3 | |
| MSI GP65 Leopard 9SF | |
| MSI GE66 Raider 10SFS | |
| Gigabyte Aero 17 HDR XB | |
| Battlefield V - 3840x2160 Ultra Preset | |
| Asus Strix Scar 17 G732LXS | |
| Schenker XMG Ultra 15 | |
| MSI GE66 Raider 10SFS | |
| Acer Predator Triton 500 PT515-52-70N3 | |
| Gigabyte Aero 17 HDR XB | |
| Schenker XMG Ultra 15 | |
| Metro Exodus - 3840x2160 Ultra Quality AF:16x | |
| MSI GT76 Titan DT 9SG | |
| Asus Strix Scar 17 G732LXS | |
| MSI GE66 Raider 10SFS | |
| Acer Predator Triton 500 PT515-52-70N3 | |
| Gigabyte Aero 17 HDR XB | |
| Schenker XMG Neo 17 | |
Ray tracing
| Control - 1920x1080 High Quality Preset & High Ray Tracing Preset (DX12) | |
| MSI GT76 Titan DT 9SG | |
| Asus Strix Scar 17 G732LXS | |
| MSI GE66 Raider 10SFS | |
| Acer Predator Triton 500 PT515-52-70N3 | |
| MSI GP65 Leopard 9SF | |
| Gigabyte Aero 17 HDR XB | |
| Call of Duty Modern Warfare 2019 - 1920x1080 Maximum Settings with Raytracing AA:T2X Filmic SM | |
| MSI GT76 Titan DT 9SG | |
| Asus Strix Scar 17 G732LXS | |
| Acer Predator Triton 500 PT515-52-70N3 | |
| Gigabyte Aero 17 HDR XB | |
| MSI GE66 Raider 10SFS | |
| MSI GP65 Leopard 9SF | |
| Battlefield V - 1920x1080 Ultra Preset DXR | |
| Asus Strix Scar 17 G732LXS | |
| MSI GE66 Raider 10SFS | |
| Schenker XMG Ultra 15 | |
| Acer Predator Triton 500 PT515-52-70N3 | |
| Gigabyte Aero 17 HDR XB | |
| Schenker XMG Ultra 15 | |
| Metro Exodus - 1920x1080 Ultra Quality DXR AF:16x | |
| Asus Strix Scar 17 G732LXS | |
| MSI GT76 Titan DT 9SG | |
| Acer Predator Triton 500 PT515-52-70N3 | |
| MSI GE66 Raider 10SFS | |
| MSI GP65 Leopard 9SF | |
| Gigabyte Aero 17 HDR XB | |
Conclusion
The results for the new Super Turing GPUs were, in our opinion, not very super. While the RTX 2070 Super is, in ideal circumstances, up to 20% better than the RTX 2070 (though 10% is more realistic), the RTX 2080 Super can only set its performance apart from the RTX 2080 by a maximum of 10% when using models that have the same TDP. Unfortunately, very few laptop manufacturers state the TDP version used in their products, so customers will normally be in the dark about this. In any case, the TDP has a greater influence on the speed of the RTX 2080 than the type of GPU (Super vs. non-Super), which is somewhat disappointing in our eyes.
