Notebookcheck Logo

Qualcomm Adreno 740 vs Qualcomm Adreno 644

Qualcomm Adreno 740

► remove from comparison Qualcomm Adreno 740

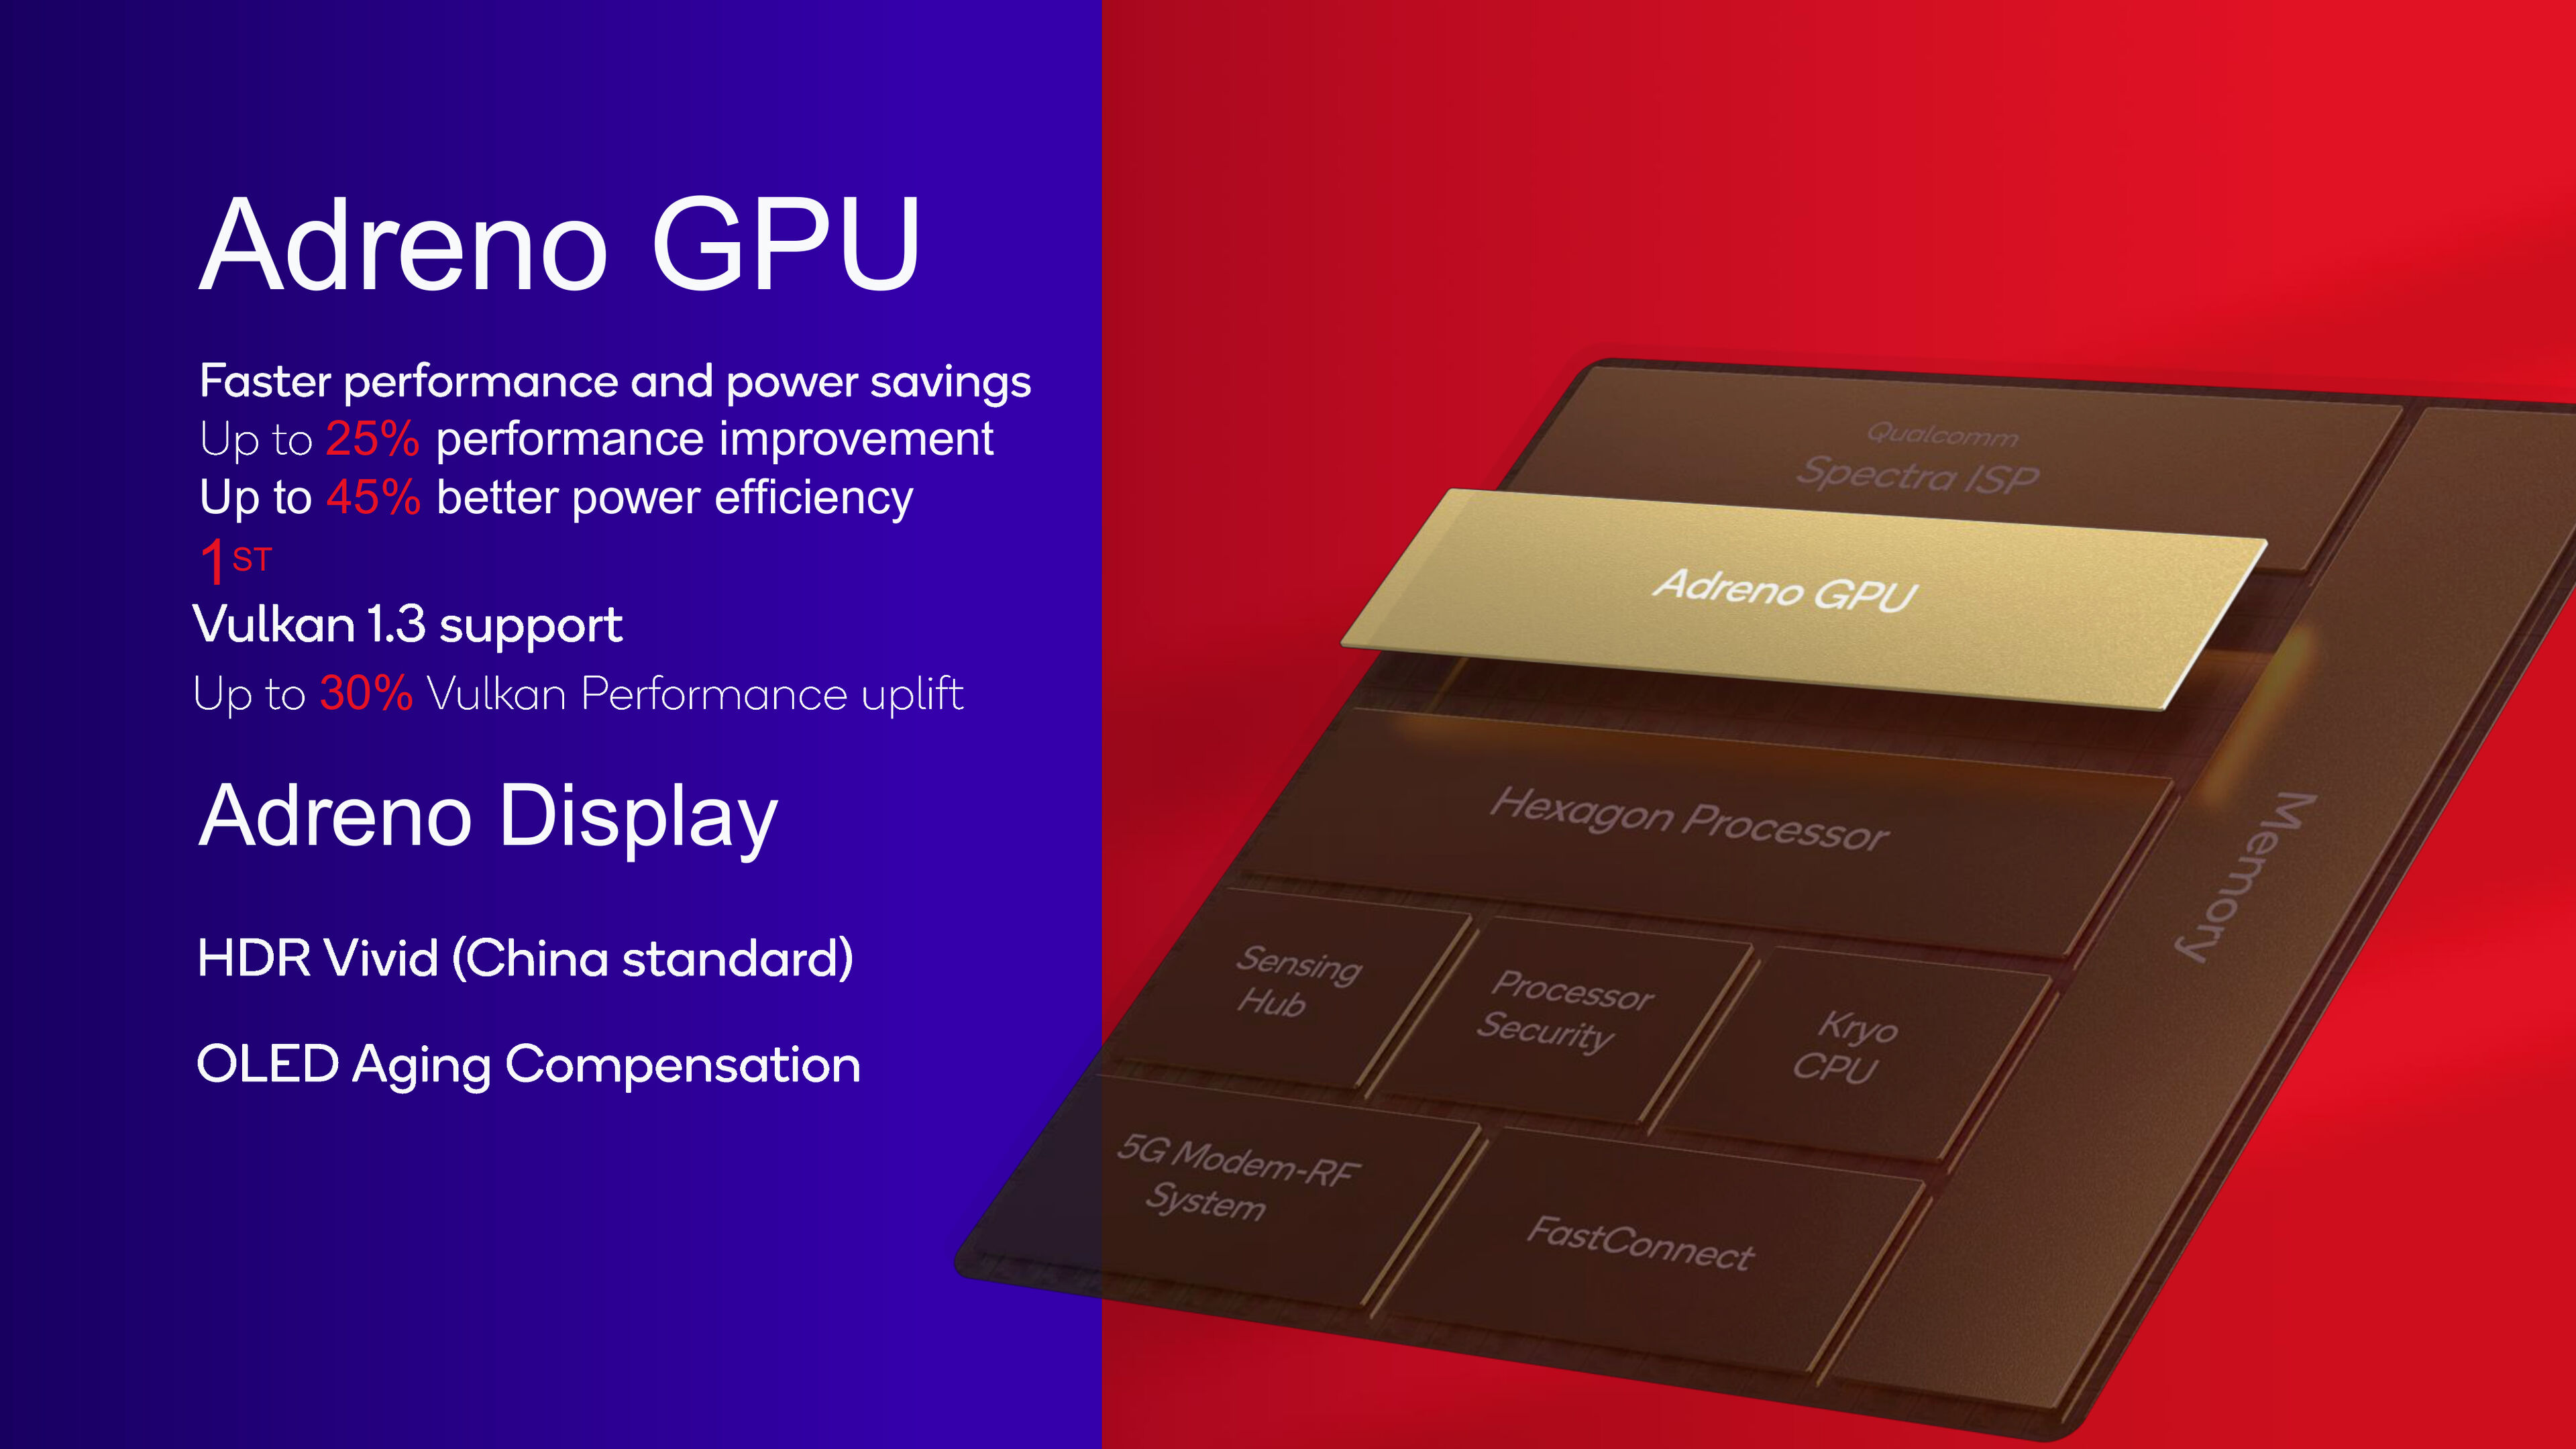
The Qualcomm Adreno 740 is a smartphone and tablet GPU that is integrated within the Qualcomm Snapdragon 8 Gen 2 SoC. The chip will be available starting early 2023 and will be used mainly in high-end Android devices. 

According to Qualcomm, the Adreno GPU offers a 25% improved performance compared to the Adreno 730 predecessor in the Snapdragon 8 Gen 1. First benchmarks show that the Adreno GPU can even beat the Apple A16 GPU (iPhone 14 Pro series) in synthetic benchmarks. Therefore, the Adreno 740 is the fastest graphics chip for smartphones in 2022.

The iGPU supports hardware accelerated ray tracing and a game post processing accelerator (for bloom, depth of field and motion blur). Another first, is the support for Vulkan 1.3.

The Snapdragon 8 Gen 2 is produced in the modern 4nm process at TSMC.

Qualcomm Adreno 644

► remove from comparison Qualcomm Adreno 644

The Qualcomm Adreno 644 is a smartphone and tablet GPU that is integrated within the Qualcomm Snapdragon 7 Gen 1 SoC. The chip was announced mid 2022 and was available in early 2023 in upper mid-range Android smartphones.

According to Qualcomm, the Adreno 644 GPU offers a 20% improved performance over the Adreno 642, its predecessor, which is integrated in the Snapdragon 780G SoC. This is also thanks to the fast LPDDR5 with 3200 MHz. In our benchmarks with the Mi 13 Lite however, the performance was only on par with the old Adreno 642.

The Adreno 644 supports OpenCL 2.0 FP, OpenGL ES 3.2 and Vulkan 1.1.

The Snapdragon 7 Gen 1 is manufactured in the modern 4nm process with EUV at Samsung that should provide a good power efficiency.

Qualcomm Adreno 740Qualcomm Adreno 644
Adreno 600 Series
Adreno 750 compare
Adreno 740
Adreno 735 compare @ 0.8 GHz
Adreno 732 compare
Adreno 730 compare @ 0.8 GHz
Adreno 725 compare @ 0.8 GHz
Adreno 720 compare @ 0.8 GHz
Adreno 710 compare @ 0.8 GHz
Adreno 660 compare
Adreno 650 compare @ 0.25 - 0.67 GHz
Adreno 690 compare
Adreno 685 compare
Adreno 680 compare
Adreno 644
Adreno 643 compare @ 0.81 GHz
Adreno 642 compare
Adreno 642L compare
Adreno 640 compare
Adreno 630 compare
Adreno 620 compare
Adreno 619 compare
Adreno 619L compare
Adreno 618 compare
Adreno 616 compare
Adreno 613 compare @ 0.96 GHz
Adreno 612 compare
Adreno 610 compare
Shared Memoryyesyes
APIOpenGL ES 3.2, Vulkan 1.3OpenGL ES 3.2
technology4 nm4 nm
FeaturesOpenGL ES 3.2, OpenCL 2.0, DirectX 12, Vulkan 1.1OpenGL ES 3.2, OpenCL 2.0, DirectX 12, Vulkan 1.1
Date of Announcement16.11.2022 07.05.2021
PredecessorAdreno 642
CPU in Adreno 740GPU Base SpeedGPU Boost / Turbo
Qualcomm Snapdragon 8 Gen 2 for Galaxy8 x 2000 MHz? MHz? MHz
Qualcomm Snapdragon 8 Gen 28 x 2000 MHz? MHz? MHz
min. - max.? MHz? MHz
CPU in Adreno 644GPU Base SpeedGPU Boost / Turbo
Qualcomm Snapdragon 7 Gen 18 x 1800 MHz? MHz? MHz

Benchmarks

min: 6303     avg: 6921     median: 6953.5 (30%)     max: 7472 Points
min: 8656     avg: 8893     median: 8751 (19%)     max: 9414 Points
3DMark - 3DMark Sling Shot Extreme (ES 3.1) Unlimited
min: 10839     avg: 14511     median: 14696.5 (62%)     max: 16291 Points
min: 5501     avg: 6187     median: 6286 (26%)     max: 6466 Points
3DMark - 3DMark Sling Shot Extreme (ES 3.1) Unlimited Graphics
min: 18010     avg: 24115     median: 24891.5 (62%)     max: 26802 Points
min: 6767     avg: 7042     median: 7023 (17%)     max: 7388 Points
min: 6114     avg: 6700     median: 6700 (60%)     max: 7285 Points
min: 8410     avg: 8641     median: 8487 (51%)     max: 9025 Points
min: 5090     avg: 5524     median: 5565 (27%)     max: 5876 Points
min: 5779     avg: 6156     median: 6159.5 (21%)     max: 6524 Points
3DMark - 3DMark Wild Life Unlimited
min: 9805     avg: 13918     median: 14012 (7%)     max: 14789 Points
min: 3035     avg: 3133     median: 3137 (2%)     max: 3184 Points
3DMark - 3DMark Wild Life Extreme Unlimited
min: 3088     avg: 3641     median: 3700 (4%)     max: 3900 Points
GFXBench - GFXBench 5.0 4K Aztec Ruins High Tier Offscreen
min: 18     avg: 29.3     median: 30 (11%)     max: 33 fps
GFXBench - GFXBench 5.0 Aztec Ruins High Tier Offscreen
min: 24     avg: 60.8     median: 62.5 (11%)     max: 72 fps
GFXBench - GFXBench 5.0 Aztec Ruins Normal Tier Offscreen
min: 82     avg: 147.5     median: 155.5 (12%)     max: 181 fps
GFXBench - GFXBench Car Chase Offscreen
min: 67     avg: 120.2     median: 126 (12%)     max: 166 fps
min: 37     avg: 38.2     median: 38 (4%)     max: 40 fps
GFXBench 3.1 - GFXBench Manhattan ES 3.1 Offscreen
min: 108     avg: 199.4     median: 213 (5%)     max: 226 fps
min: 52     avg: 62.4     median: 65 (1%)     max: 67 fps
GFXBench 3.0 - GFXBench 3.0 Manhattan Offscreen
min: 115     avg: 277.5     median: 288 (12%)     max: 346 fps
min: 86     avg: 89.2     median: 88 (4%)     max: 94 fps
GFXBench (DX / GLBenchmark) 2.7
GFXBench T-Rex HD Offscreen C24Z16 + Qualcomm Adreno 740
GFXBench (DX / GLBenchmark) 2.7 - GFXBench T-Rex HD Offscreen C24Z16
min: 301     avg: 456.8     median: 480.5 (4%)     max: 502 fps
GFXBench T-Rex HD Offscreen C24Z16 + Qualcomm Adreno 644
min: 147     avg: 150.2     median: 148 (1%)     max: 158 fps
Antutu v9 - AnTuTu v9 GPU
min: 449271     avg: 555498     median: 570026 (57%)     max: 590837 Points
min: 174679     avg: 177977     median: 175343 (18%)     max: 187645 Points
170281 Points (14%)
Basemark GPU 1.2 - Basemark GPU 1.2 Vulkan Official Medium Offscreen 1080
min: 208.55     avg: 211     median: 210.4 (5%)     max: 214.17 fps
min: 50.74     avg: 51.7     median: 51.7 (1%)     max: 52.63 fps
min: 2448     avg: 2513     median: 2497 (1%)     max: 2610 Points
min: 2650     avg: 2776     median: 2729.5 (1%)     max: 2993 Points
PassMark PerformanceTest Mobile V1 - PerformanceTest Mobile V1 2D Graphics Tests
30029 Points (10%)
PassMark PerformanceTest Mobile V1 - PerformanceTest Mobile V1 3D Graphics Tests
42541 Points (70%)
Power Consumption - GFXBench Aztec Ruins Normal Tier Offscreen Power Consumption 150cd *
min: 3.83     avg: 9.5     median: 9.7 (4%)     max: 14.5 Watt
min: 4.19     avg: 4.8     median: 4.6 (2%)     max: 5.9 Watt

Average Benchmarks Qualcomm Adreno 740 → 100% n=20

Average Benchmarks Qualcomm Adreno 644 → 30% n=20

- Range of benchmark values for this graphics card
red legend - Average benchmark values for this graphics card
* Smaller numbers mean a higher performance
1 This benchmark is not used for the average calculation

Game Benchmarks

The following benchmarks stem from our benchmarks of review laptops. The performance depends on the used graphics memory, clock rate, processor, system settings, drivers, and operating systems. So the results don't have to be representative for all laptops with this GPU. For detailed information on the benchmark results, click on the fps number.

Diablo Immortal

Diablo Immortal

2022
low Medium
100%
Adreno 740:
60 60 60 60 60 ~ 60 fps
70%
Adreno 644:
42  fps
ultra Ultra
100%
Adreno 740:
60 60 60 ~ 60 fps
75%
Adreno 644:
45  fps
Genshin Impact

Genshin Impact

2020
low
100%
Adreno 740:
58.5 60.1 ~ 59 fps
med.
100%
Adreno 740:
60.1  fps
ultra
100%
Adreno 740:
59 59.2 59.6 60 60 60 ~ 60 fps
Armajet

Armajet

2020
high
100%
Adreno 740:
59 60 60 60 60 61 63 117 119 120 ~ 78 fps
86%
Adreno 644:
45 89 ~ 67 fps
PUBG Mobile

PUBG Mobile

2018
low
100%
Adreno 740:
60 60 60 60 60 60 60 87.5 87.8 89 90 90 ~ 72 fps
83%
Adreno 644:
60 60 ~ 60 fps
med.
100%
Adreno 740:
60 60 60 60 ~ 60 fps
67%
Adreno 644:
40  fps
high
100%
Adreno 740:
56.8 59 59.3 60 60 60 60 60 60 60 60 60 60 60 60 60 60 60 ~ 60 fps
67%
Adreno 644:
40 40 40 40 40 ~ 40 fps
ultra
100%
Adreno 740:
39.5 40 40 40 40 40 40 40 40 40 40 40 40 40 40 40 ~ 40 fps
World of Tanks Blitz

World of Tanks Blitz

2018
high
100%
Adreno 740:
60  fps
Dead Trigger 2

Dead Trigger 2

2013
high
100%
Adreno 740:
116  fps
52%
Adreno 644:
60  fps
Asphalt 9: Legends

Asphalt 9: Legends

2013
low
100%
Adreno 740:
60  fps
high
100%
Adreno 740:
60  fps
Subway Surfers

Subway Surfers

2012
high
100%
Adreno 740:
120  fps
51%
Adreno 644:
60 61 ~ 61 fps

Average Gaming Qualcomm Adreno 740 → 100%

Average Gaming 30-70 fps → 100%

Average Gaming Qualcomm Adreno 644 → 69%

Average Gaming 30-70 fps → 69%

Qualcomm Adreno 740Qualcomm Adreno 644
lowmed.highultraQHD4Klowmed.highultraQHD4K
Diablo Immortal60604245
Genshin Impact5960.160
Armajet7867
PUBG Mobile72606040604040
World of Tanks Blitz60
Dead Trigger 211660
Asphalt 9: Legends6060
Subway Surfers12061
Qualcomm Adreno 740Qualcomm Adreno 644
lowmed.highultraQHD4Klowmed.highultraQHD4K
< 30 fps
< 60 fps
< 120 fps
≥ 120 fps

1
3


2


5
1

1
2


< 30 fps
< 60 fps
< 120 fps
≥ 120 fps

1
1

1


1
3

1


For more games that might be playable and a list of all games and graphics cards visit our Gaming List

Add one or more devices and compare

In the following list you can select (and also search for) devices that should be added to the comparison. You can select more than one device.

restrict list:
v1.33
log 19. 16:06:19

#0 ran 0s before starting gpusingle class +0s ... 0s

#1 checking url part for id 11440 +0s ... 0s

#2 checking url part for id 11580 +0s ... 0s

#3 redirected to Ajax server, took 1752933979s time from redirect:0 +0s ... 0s

#4 did not recreate cache, as it is less than 5 days old! Created at Sat, 19 Jul 2025 13:29:00 +0200 +0s ... 0s

#5 composed specs +0.03s ... 0.03s

#6 did output specs +0s ... 0.03s

#7 start showIntegratedCPUs +0s ... 0.03s

#8 getting avg benchmarks for device 11440 +0.015s ... 0.045s

#9 got single benchmarks 11440 +0.03s ... 0.075s

#10 getting avg benchmarks for device 11580 +0s ... 0.075s

#11 got single benchmarks 11580 +0.007s ... 0.083s

#12 got avg benchmarks for devices +0s ... 0.083s

#13 No cached benchmark found, getting uncached values +0.004s ... 0.087s

#14 No cached benchmark found, getting uncached values +0.001s ... 0.088s

#15 min, max, avg, median took s +0.014s ... 0.102s

#16 before gaming benchmark output +0s ... 0.102s

#17 Got 118 rows for game benchmarks. +0.022s ... 0.123s

#18 composed SQL query for gamebenchmarks +0s ... 0.123s

#19 got data and put it in $dataArray +0s ... 0.124s

#20 benchmarks composed for output. +0.003s ... 0.127s

#21 calculated avg scores. +0s ... 0.127s

#22 return log +0.001s ... 0.128s

Please share our article, every link counts!
Mail Logo
> Expert Reviews and News on Laptops, Smartphones and Tech Innovations > Benchmarks / Tech > Graphics Card Comparison - Head 2 Head
Redaktion, 2017-09- 8 (Update: 2023-07- 1)