Notebookcheck Logo

Apple A10 Fusion GPU / PowerVR vs Qualcomm Adreno 680 vs Qualcomm Adreno 690

Apple A10 Fusion GPU / PowerVR

► remove from comparison Imagination A10 Fusion GPU

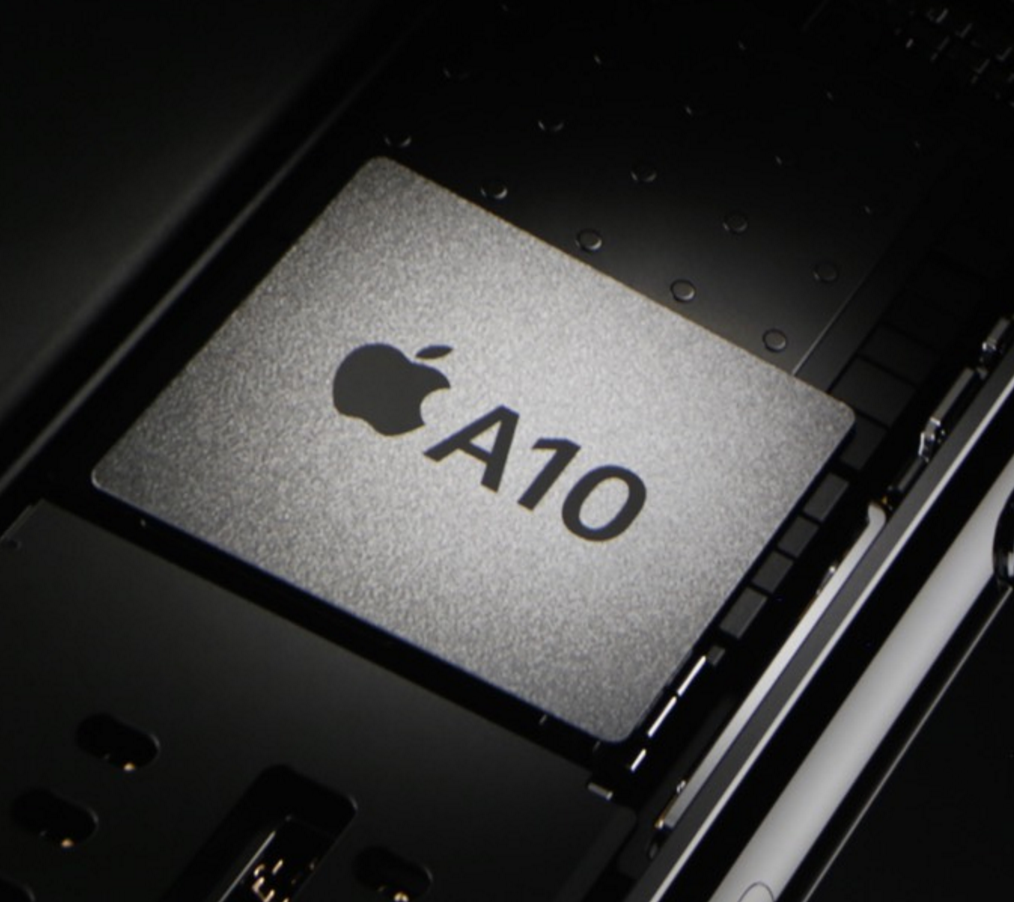
The Apple A10 Fusion / PowerVRMulticore graphics card included in the Apple A10 Fusion SoC that can be found in the Apple iPhone 7 and 7 Plus smartphones. Most likely based on PowerVR technology and according to apple 40% faster than the A9 while using only 2/3 of the power. The only technical detail that is known, is the core count (6) so far.

Qualcomm Adreno 680

► remove from comparison

The Qualcomm Adreno 680 is an integrated graphics card in the Qualcomm Snapdragon 8cx SoC for Windows laptops. According to Qualcomm it is 2x faster than the previous Adreno 630 in the Snapdragon 850 for Windows PCs with a 60% improved efficiency (thanks to the 7nm process). The performance should be similar to a Intel UHD Graphics 620 (e.g. in a 8th gen Core i5) when running native ARM64 compiled Windows apps and games. Running emulated 32 bit games (64 bit games compiled for AMD/Intel are not supported), the performance is notably slower.

Qualcomm Adreno 690

► remove from comparison Qualcomm Adreno 690

The Qualcomm Adreno 690 is an integrated graphics card in the Qualcomm Snapdragon 8cx Gen 3 SoC for Windows laptops. According to Qualcomm, the 690 is up to 60% faster than the previous generation. In our tests with the Lenovo ThinkPad X13s, the Adreno 690 was only on par with a low en Intel UHD Graphics iGPU and not well suited for 3D games.

The chip is manufactured in 5nm at Samsung (5LPE) and suited for fanless laptops.

Apple A10 Fusion GPU / PowerVRQualcomm Adreno 680Qualcomm Adreno 690
ArchitecturePowerVR Rogue
Shared Memorynoyesyes
Date of Announcement08.09.2016 06.12.2018 06.12.2018
Adreno 600 Series
Adreno 660
Adreno 650 @ 0.25 - 0.67 GHz
Adreno 690
Adreno 685
Adreno 680
Adreno 644
Adreno 643 @ 0.81 GHz
Adreno 642
Adreno 642L
Adreno 640
Adreno 630
Adreno 620
Adreno 619
Adreno 619L
Adreno 618
Adreno 616
Adreno 613 @ 0.96 GHz
Adreno 612
Adreno 610
Adreno 660
Adreno 650 @ 0.25 - 0.67 GHz
Adreno 690
Adreno 685
Adreno 680
Adreno 644
Adreno 643 @ 0.81 GHz
Adreno 642
Adreno 642L
Adreno 640
Adreno 630
Adreno 620
Adreno 619
Adreno 619L
Adreno 618
Adreno 616
Adreno 613 @ 0.96 GHz
Adreno 612
Adreno 610
APIDirectX 12DirectX 12
Power Consumption7 Watt7 Watt
technology7 nm5 nm
CPU in A10 Fusion GPUGPU Base SpeedGPU Boost / Turbo
Apple A10 Fusion4 x 2340 MHz900 MHz? MHz
CPU in Adreno 680GPU Base SpeedGPU Boost / Turbo
Qualcomm Snapdragon 8cx Gen 2 5G8 x 3150 MHz, 7 W? MHz? MHz
Qualcomm Snapdragon 8cx8 x 2840 MHz, 7 W? MHz? MHz
min. - max.? MHz? MHz
CPU in Adreno 690GPU Base SpeedGPU Boost / Turbo
Qualcomm Snapdragon 8cx Gen 38 x 2400 MHz, 7 W? MHz? MHz

Benchmarks

Performance Rating - 3DMark 11 + Fire Strike + Time Spy - Adreno 690
1.1 pt (3%)
0.05576 -95%
0.0842 -92%
0.192 -82%
0.3143 -71%
Qualcomm Adreno 690
1.097
...
0.3143 -71%
max:
33.3 2936%
0%
100%
Restrict / Search: Model: Max. age: years
3DMark - 3DMark Time Spy Score
909 Points (2%)
3DMark - 3DMark Time Spy Graphics
811 Points (2%)
3DMark - 3DMark Ice Storm Unlimited Graphics
min: 48421     avg: 60793     median: 63386 (6%)     max: 65558 Points
3DMark - 3DMark Cloud Gate Score
min: 8602     avg: 9818     median: 9818 (9%)     max: 11034 Points
3DMark - 3DMark Cloud Gate Graphics
min: 13768     avg: 16708     median: 16707.5 (4%)     max: 19647 Points
3DMark - 3DMark Fire Strike Standard Score
min: 2758     avg: 2835     median: 2834.5 (4%)     max: 2911 Points
3DMark - 3DMark Fire Strike Standard Graphics
min: 2837     avg: 2933     median: 2932.5 (3%)     max: 3028 Points
3DMark - 3DMark Ice Storm Graphics
14652 Points (2%)
3DMark - 3DMark Sling Shot (ES 3.0) Unlimited
min: 3293     avg: 3639     median: 3584 (16%)     max: 4190 Points
3DMark - 3DMark Sling Shot (ES 3.0) Unlimited Graphics
min: 5141     avg: 6059     median: 5859 (13%)     max: 7253 Points
3DMark - 3DMark Sling Shot Extreme (ES 3.1) Unlimited
min: 2317     avg: 2626     median: 2616.5 (11%)     max: 2955 Points
3DMark - 3DMark Sling Shot Extreme (ES 3.1) Unlimited Graphics
min: 2919     avg: 3443     median: 3500.5 (9%)     max: 3852 Points
3DMark - 3DMark Sling Shot (ES 3.0)
min: 2964     avg: 3227     median: 3034 (27%)     max: 3672 Points
3DMark - 3DMark Sling Shot (ES 3.0) Graphics
min: 4057     avg: 4991     median: 5030 (30%)     max: 6095 Points
3DMark - 3DMark Sling Shot Extreme (ES 3.1)
min: 2367     avg: 2574     median: 2621 (13%)     max: 2735 Points
3DMark - 3DMark Sling Shot Extreme (ES 3.1) Graphics
min: 2949     avg: 3316     median: 3318 (11%)     max: 3682 Points
3DMark - 3DMark Wild Life Extreme Unlimited
3067 Points (4%)
3DMark 11 - 3DM11 Performance Score
min: 1650     avg: 1847     median: 1847 (2%)     max: 2044 Points
min: 3063     avg: 3085     median: 3077 (4%)     max: 3115 Points
3DMark 11 - 3DM11 Performance GPU
min: 1593     avg: 1936     median: 1935.5 (1%)     max: 2278 Points
min: 2898     avg: 2930     median: 2912 (2%)     max: 2979 Points
Cinebench R10 Cinebench R10 Shading (32bit) + Qualcomm Adreno 680
Cinebench R10 - Cinebench R10 Shading (32bit)
353 Points (0%)
Cinebench R10 Shading (32bit) + Qualcomm Adreno 690
558 Points (0%)
Cinebench R15
Cinebench R15 OpenGL 64 Bit + Qualcomm Adreno 690
Cinebench R15 - Cinebench R15 OpenGL 64 Bit
min: 13.4     avg: 13.7     median: 13.7 (1%)     max: 14 fps
Cinebench R15 OpenGL Ref. Match 64 Bit + Qualcomm Adreno 690
Cinebench R15 - Cinebench R15 OpenGL Ref. Match 64 Bit
98 % (98%)
GFXBench - GFXBench 5.0 Aztec Ruins High Tier Offscreen
10.8 fps (2%)
GFXBench - GFXBench 5.0 Aztec Ruins Normal Tier Offscreen
min: 29.1     avg: 30     median: 30 (2%)     max: 30.8 fps
GFXBench - GFXBench Car Chase Offscreen
min: 25.1     avg: 26     median: 26 (2%)     max: 26.8 fps
GFXBench 3.1 - GFXBench Manhattan ES 3.1 Offscreen
min: 39.3     avg: 41.4     median: 41.8 (1%)     max: 42.7 fps
GFXBench 3.0 - GFXBench 3.0 Manhattan Offscreen
min: 52     avg: 58.9     median: 59.7 (2%)     max: 62.6 fps
GFXBench (DX / GLBenchmark) 2.7
GFXBench T-Rex HD Offscreen C24Z16 + Apple A10 Fusion GPU / PowerVR
GFXBench (DX / GLBenchmark) 2.7 - GFXBench T-Rex HD Offscreen C24Z16
min: 92     avg: 111.5     median: 114.2 (1%)     max: 125 fps
GFXBench T-Rex HD Offscreen C24Z16 + Qualcomm Adreno 680
140.2 fps (1%)
ComputeMark v2.1 - ComputeMark v2.1 Result
1890 Points (2%)
PassMark PerformanceTest Mobile V1 - PerformanceTest Mobile V1 2D Graphics Tests
min: 5495     avg: 5971     median: 5970.5 (2%)     max: 6446 Points
PassMark PerformanceTest Mobile V1 - PerformanceTest Mobile V1 3D Graphics Tests
min: 2017     avg: 2018     median: 2017.5 (3%)     max: 2018 Points
Power Consumption - Furmark Stress Test Power Consumption - external Monitor *
12.6 Watt (2%)
min: 17     avg: 19.7     median: 19.7 (3%)     max: 22.3 Watt
Power Consumption - The Witcher 3 Power Consumption - external Monitor *
15.8 Watt (2%)
Power Consumption - Witcher 3 Power Consumption *
16.4 Watt (4%)

Average Benchmarks Apple A10 Fusion GPU / PowerVR → 0% n=0

Average Benchmarks Qualcomm Adreno 680 → 0% n=0

Average Benchmarks Qualcomm Adreno 690 → 0% n=0

- Range of benchmark values for this graphics card
red legend - Average benchmark values for this graphics card
* Smaller numbers mean a higher performance
1 This benchmark is not used for the average calculation

Game Benchmarks

The following benchmarks stem from our benchmarks of review laptops. The performance depends on the used graphics memory, clock rate, processor, system settings, drivers, and operating systems. So the results don't have to be representative for all laptops with this GPU. For detailed information on the benchmark results, click on the fps number.

F1 22

F1 22

2022
low 1920x1080
Adreno 690:
26  fps
med. 1920x1080
Adreno 690:
22.5  fps
high 1920x1080
Adreno 690:
17  fps
ultra 1920x1080
Adreno 690:
12.6  fps
PUBG Mobile

PUBG Mobile

2018
low
100%
A10 Fusion GPU:
29  fps
med.
100%
A10 Fusion GPU:
29  fps
high
100%
A10 Fusion GPU:
28 29 ~ 29 fps
World of Tanks Blitz

World of Tanks Blitz

2018
low
100%
A10 Fusion GPU:
59  fps
high
100%
A10 Fusion GPU:
59 59 ~ 59 fps
Arena of Valor

Arena of Valor

2018
low
100%
A10 Fusion GPU:
29 58 ~ 44 fps
ultra
100%
A10 Fusion GPU:
29 58 58 59 ~ 51 fps
Shadow Fight 3

Shadow Fight 3

2018
low
100%
A10 Fusion GPU:
29  fps
high
100%
A10 Fusion GPU:
59  fps
Battle Bay

Battle Bay

2018
high
100%
A10 Fusion GPU:
59 59 ~ 59 fps
low 1280x720
Adreno 690:
0 (!) 20.7 21.3 ~ 14 fps
med. 1920x1080
Adreno 690:
0 (!) 18 18.9 ~ 12 fps
high 1920x1080
Adreno 690:
0 (!) 16.1 16.3 ~ 11 fps
4K 3840x2160
Adreno 690:
0 (!)  fps
low 1280x720
Adreno 690:
19  fps
med. 1920x1080
Adreno 690:
12.3  fps
high 1920x1080
Adreno 690:
7.3  fps
low 1280x720
Adreno 690:
57.1 57.5 58.7 ~ 58 fps
med. 1366x768
Adreno 690:
54.5 54.5 55.2 ~ 55 fps
high 1920x1080
Adreno 690:
38.8 45.9 47 ~ 44 fps
ultra 1920x1080
Adreno 690:
29.4 40.2 40.7 ~ 37 fps
low 1024x768
Adreno 690:
0 (!) 35 38.6 ~ 25 fps
med. 1366x768
Adreno 690:
0 (!) 31.5 ~ 16 fps
high 1920x1080
Adreno 690:
0 (!) 19.1 ~ 10 fps
ultra 1920x1080
Adreno 690:
0 (!) 8.5 ~ 4 fps
4K 3840x2160
Adreno 690:
0 (!)  fps
GTA V

GTA V

2015
low 1024x768
Adreno 690:
29.9  fps
Asphalt 8: Airborne

Asphalt 8: Airborne

2013
high
100%
A10 Fusion GPU:
29  fps
Asphalt 9: Legends

Asphalt 9: Legends

2013
high
100%
A10 Fusion GPU:
29 29 33 ~ 30 fps

Average Gaming Apple A10 Fusion GPU / PowerVR → 100%

Average Gaming 30-70 fps → 100%

Apple A10 Fusion GPU / PowerVRQualcomm Adreno 680Qualcomm Adreno 690
lowmed.highultraQHD4Klowmed.highultraQHD4Klowmed.highultraQHD4K
F1 222622.51712.6
X-Plane 11.11141211
Final Fantasy XV Benchmark1912.37.29
Dota 2 Reborn58554437
The Witcher 32516104
GTA V29.9
Apple A10 Fusion GPU / PowerVRQualcomm Adreno 680Qualcomm Adreno 690
lowmed.highultraQHD4Klowmed.highultraQHD4Klowmed.highultraQHD4K
< 30 fps
< 60 fps
< 120 fps
≥ 120 fps


< 30 fps
< 60 fps
< 120 fps
≥ 120 fps


< 30 fps
< 60 fps
< 120 fps
≥ 120 fps
5
1

4
1

4
1

2
1


For more games that might be playable and a list of all games and graphics cards visit our Gaming List

v1.33
log 02. 08:18:32

#0 ran 0s before starting gpusingle class +0s ... 0s

#1 checking url part for id 7455 +0s ... 0s

#2 checking url part for id 9846 +0s ... 0s

#3 checking url part for id 11411 +0s ... 0s

#4 redirected to Ajax server, took 1751437112s time from redirect:0 +0s ... 0s

#5 did not recreate cache, as it is less than 5 days old! Created at Tue, 01 Jul 2025 05:20:42 +0200 +0s ... 0s

#6 composed specs +0.015s ... 0.015s

#7 did output specs +0s ... 0.015s

#8 start showIntegratedCPUs +0s ... 0.015s

#9 getting avg benchmarks for device 7455 +0.015s ... 0.031s

#10 got single benchmarks 7455 +0.005s ... 0.036s

#11 getting avg benchmarks for device 9846 +0s ... 0.036s

#12 got single benchmarks 9846 +0.005s ... 0.04s

#13 getting avg benchmarks for device 11411 +0.004s ... 0.044s

#14 got single benchmarks 11411 +0.005s ... 0.049s

#15 got avg benchmarks for devices +0s ... 0.049s

#16 min, max, avg, median took s +0.017s ... 0.066s

#17 before gaming benchmark output +0s ... 0.066s

#18 Got 61 rows for game benchmarks. +0.005s ... 0.072s

#19 composed SQL query for gamebenchmarks +0s ... 0.072s

#20 got data and put it in $dataArray +0s ... 0.072s

#21 benchmarks composed for output. +0.004s ... 0.076s

#22 calculated avg scores. +0s ... 0.076s

#23 return log +0s ... 0.076s

Please share our article, every link counts!
Mail Logo
> Expert Reviews and News on Laptops, Smartphones and Tech Innovations > Benchmarks / Tech > Graphics Card Comparison - Head 2 Head
Redaktion, 2017-09- 8 (Update: 2023-07- 1)