Apple iPod Touch 2019 Review: A music player for gamers
")
While smartphones effectively killed off MP3 players, Apple keeps quietly updating the iPod Touch every so often. The little music player can do more than just play MP3s though, with it doubling as a game console, a digital assistant and a useful secondary camera. In short, the iPod Touch offers many of the core features that the iPhone does but at a fraction of the price.
The iPod Touch is now on its 7th generation, with Apple equipping it with an Apple A10 Fusion SoC along with 2 GB of RAM. The device comes pre-loaded with iOS 12 on its 32 GB of storage too. The core questions that we are seeking to answer in this review are as follows:
- Can the iPod Touch 2019 play current games?
- For whom is the iPod Touch an alternative to the iPhone?
- What are the differences between the 7th and 6th generation iPod Touch devices?
- Does the iPod Touch 2019 have usable cameras?
- How fast is the Apple A10 Fusion in the iPod Touch 2019?
Naturally, we will cover other areas like its design, connectivity, display and speakers. We will compare the iPod Touch 2019 against its bigger iPhone siblings, along with some comparably priced Android smartphones.
Case
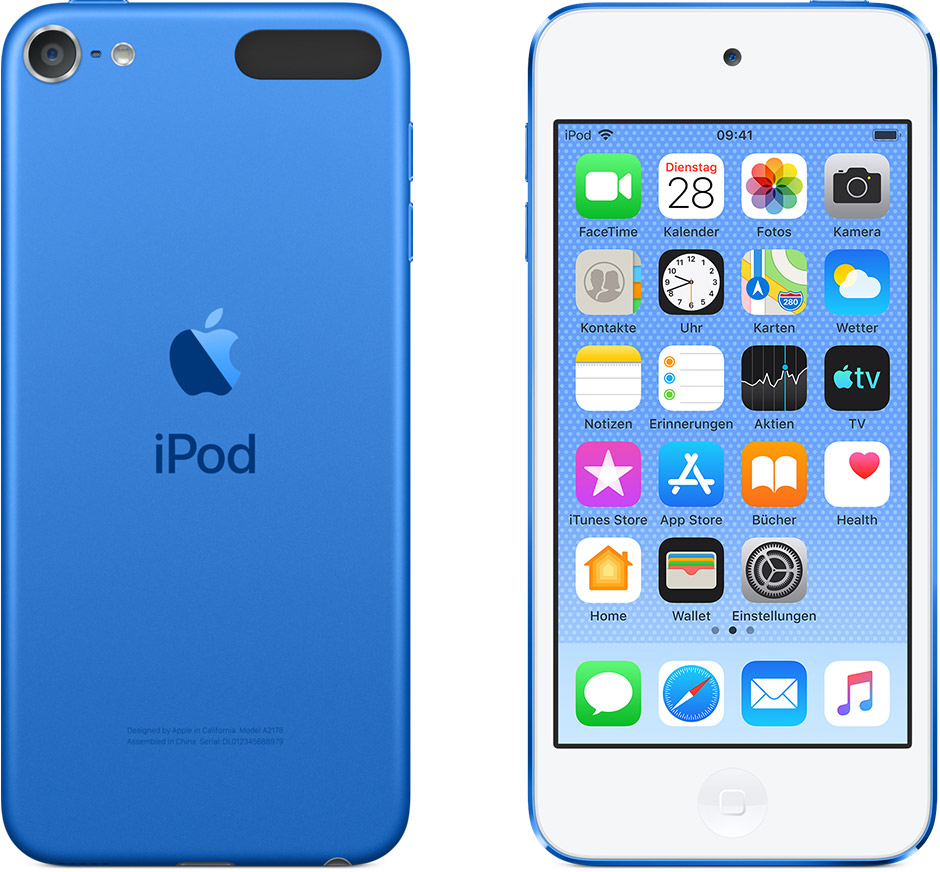
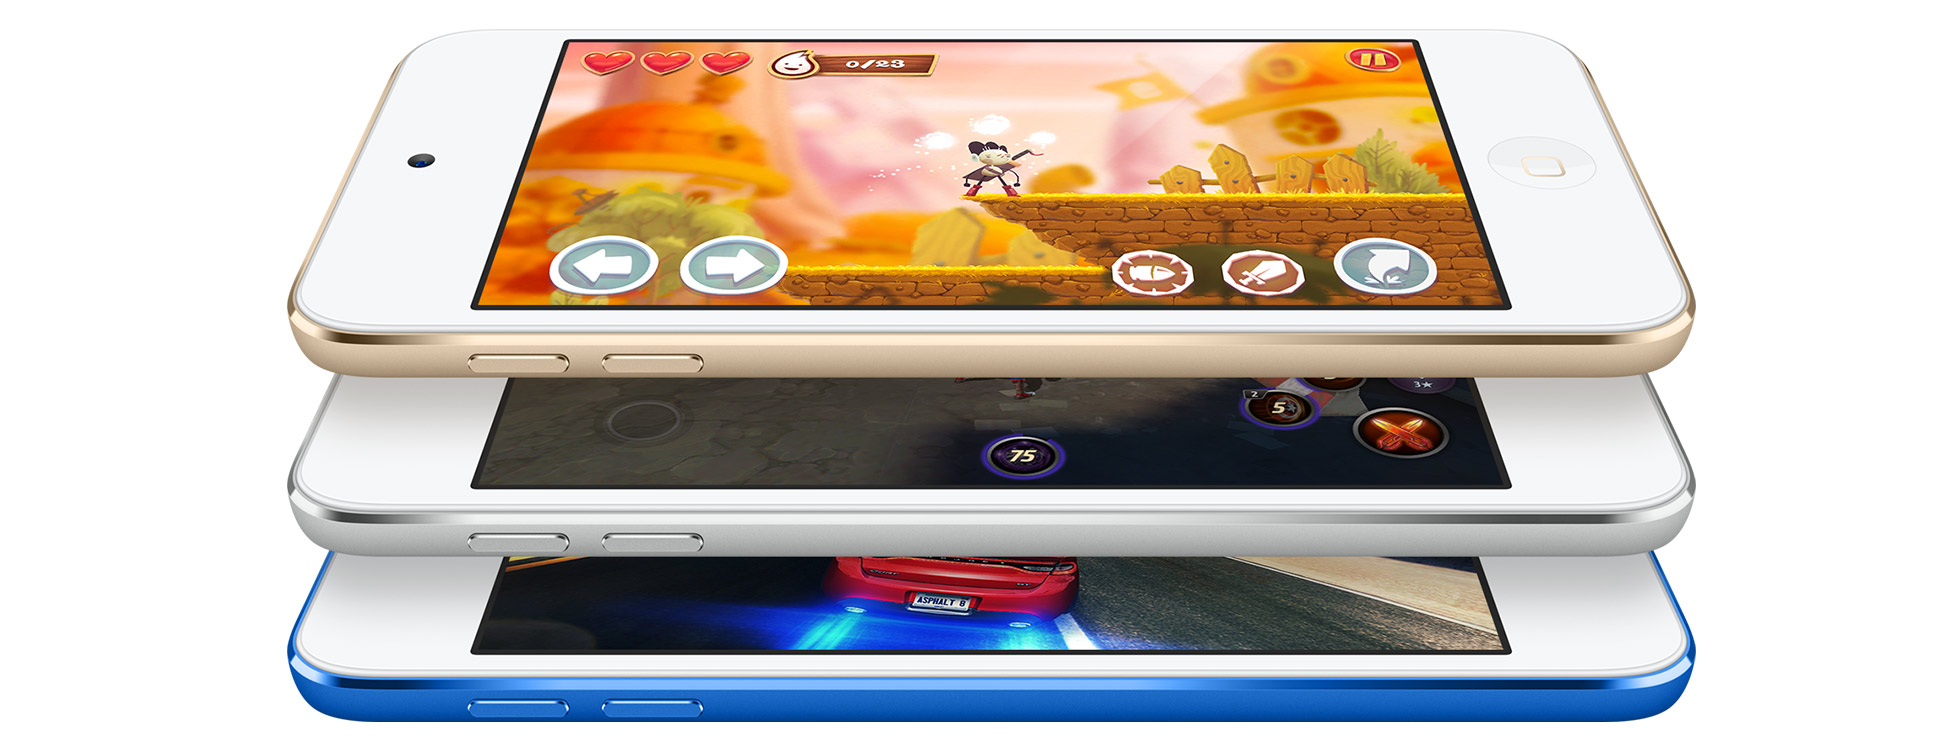
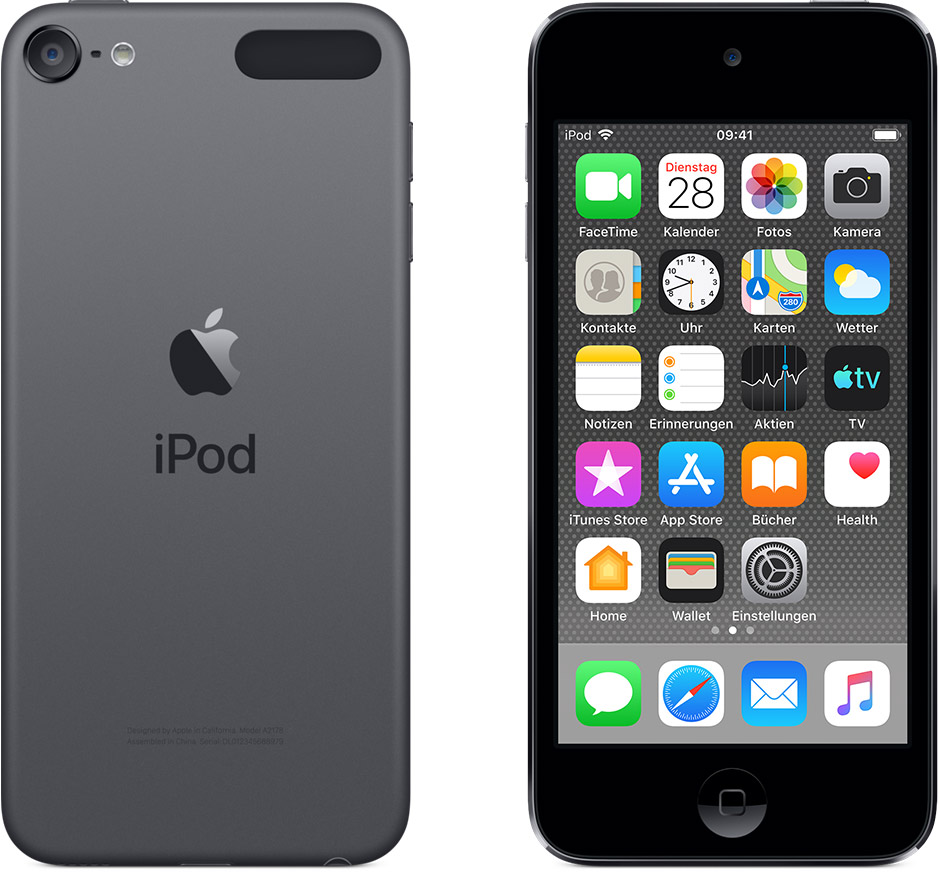
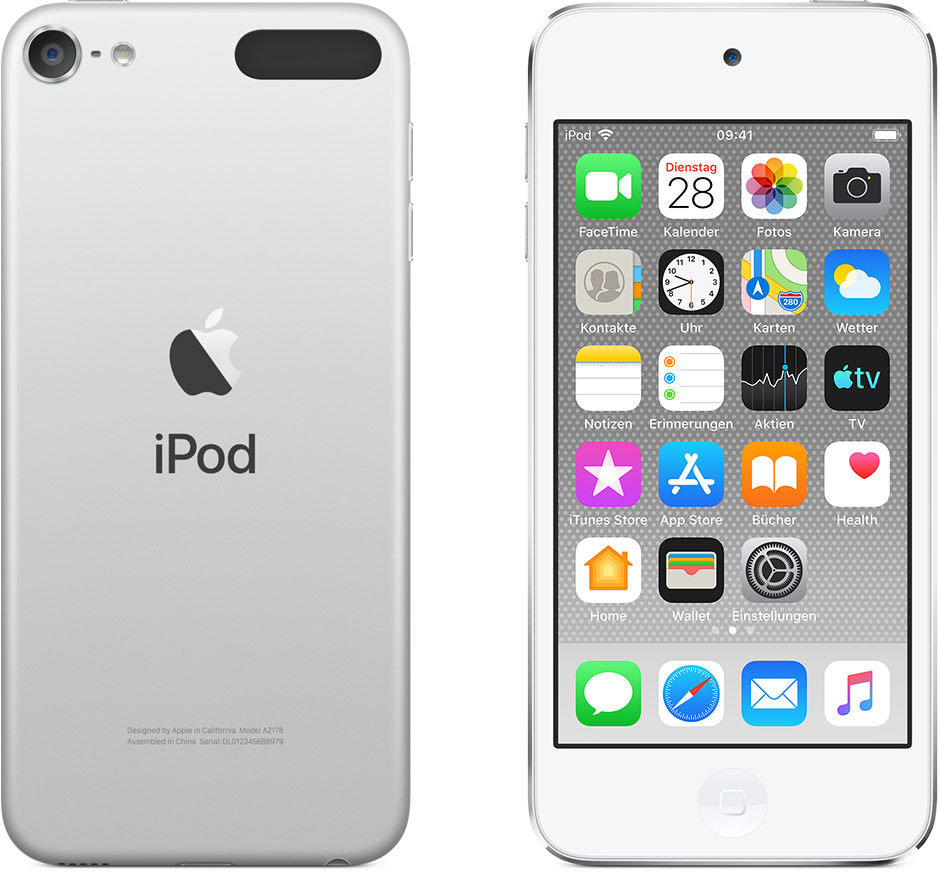
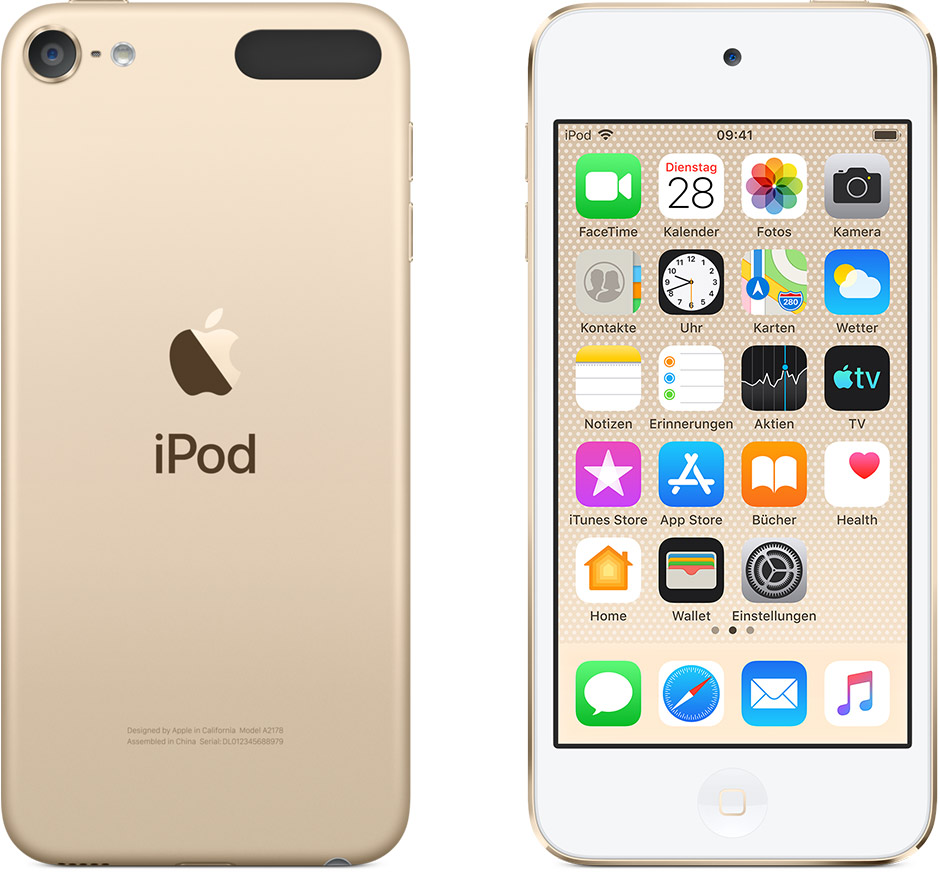
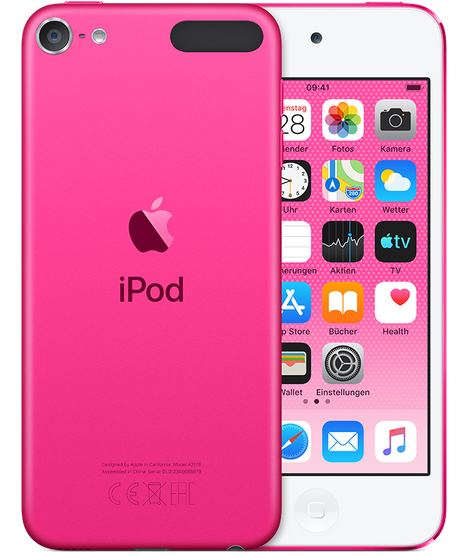
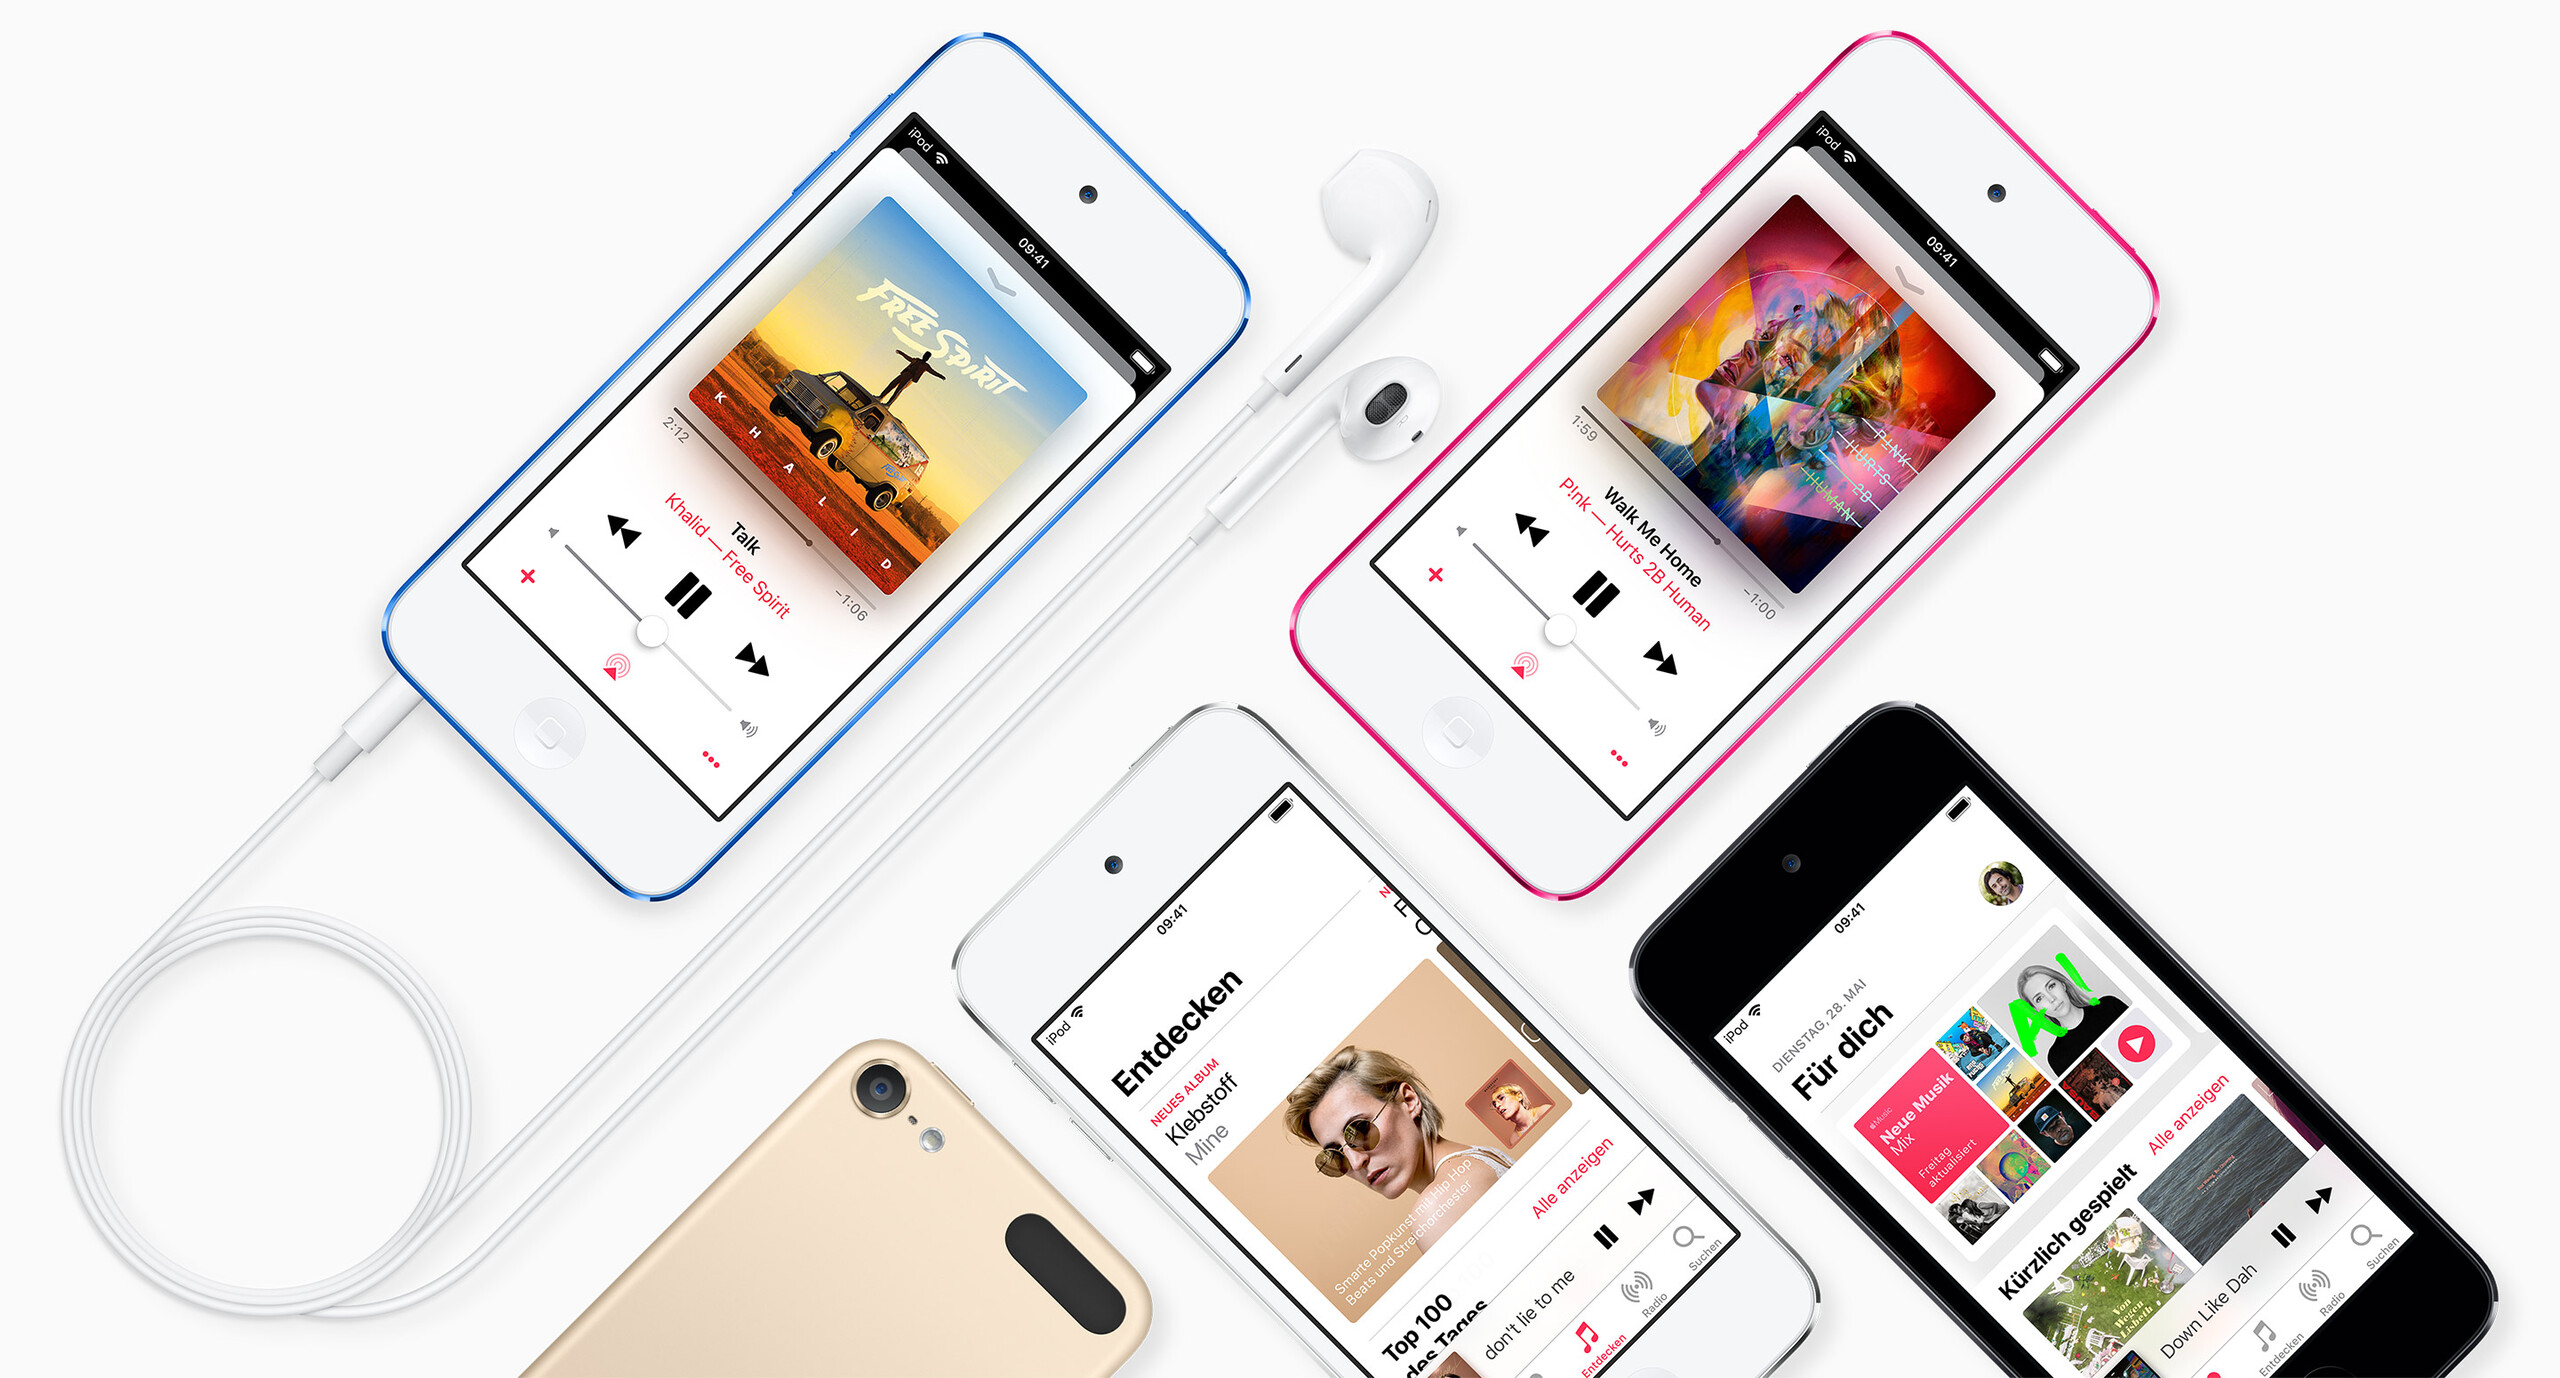
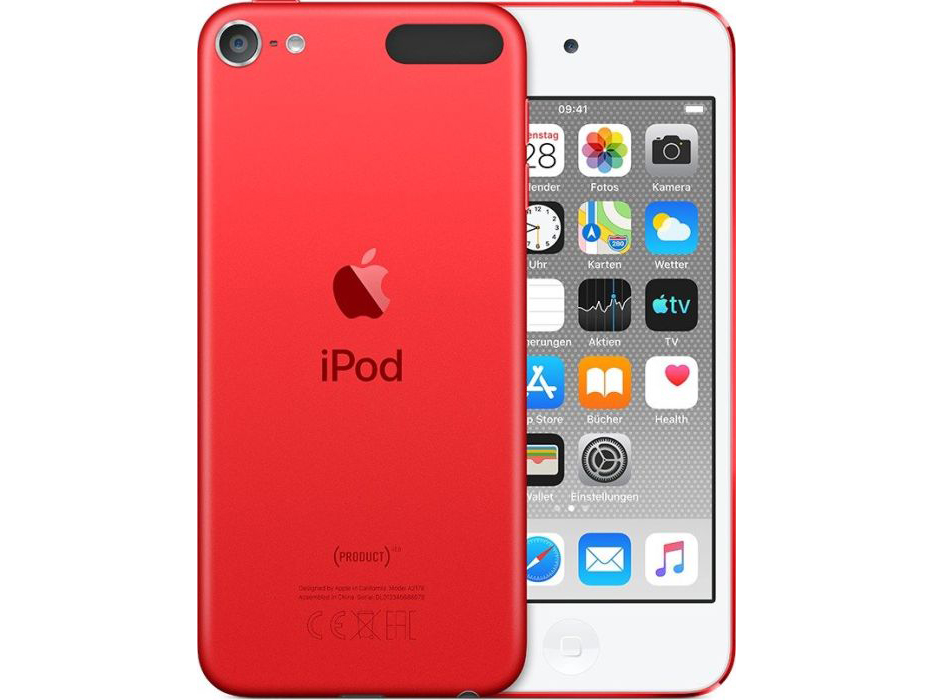
The iPod Touch 2019 comes in an array of colours, unlike its iPhone siblings. Apple currently sells the device in blue, gold, pink, silver, space grey and red, the latter of which carries the (PRODUCT)RED branding. Apple still donates up to 50% of its profits from (PRODUCT)RED sales to the organisation of the same name, which seeks to help eliminate HIV/AIDS in eight African countries.
Visually, little appears to have changed between generations, with the iPod Touch 2019 losing some of the certification logos that adorned the back of its predecessor. The device has the same screen size, footprint and weight as the 6th generation iPod Touch, with its 4-inch display yielding a 62% screen-to-body ratio. This is woefully low by modern standards, with the home button of old iPhones reinforcing the iPod Touch’s outdated looks.
The matte aluminium back case still feels premium though, especially considering that the device starts at US$199. Few Android smartphones are as well-built at this price. The black plastic cut-out looks ugly though and somewhat ruins the premium aesthetic. The cover reminds us of a dual-camera array. However, it is for the Wi-Fi antenna, which would struggle to operate through the metal chassis. We still do not understand why Apple decided against colour matching the cover though.
Connectivity
The iPod Touch comes in a choice of three storage options. Apple includes 32 GB in the base model, with there being 128 GB of storage in the midrange variant and 256 GB in the US$399 version. Charging US$200 more for an additional 224 GB of storage is extortionate, especially as the device does not support expandable storage. The prices and storage options are as follows:
| Model | Storage | Price |
|---|---|---|
| Entry-level | 32 GB | US$199 |
| Midrange | 128 GB | US$299 |
| Top of the range | 256 GB | US$399 |
iCloud is an alternative if you plan to only use your iPod Touch on a Wi-Fi network, but additional storage is pricey too. In short, the 32 GB model will run out of storage quickly if you install a few large games and store music locally.
Each model comes with 2 GB of RAM though. Apple includes a 3.5 mm jack too, a rarity among its current mobile offerings. The biggest difference between the iPod Touch 2019 and older iPhones is the lack of mobile connectivity. The iPod Touch does not have a SIM-card slot, which makes it incompatible with services that require a mobile number, like WhatsApp.
Software
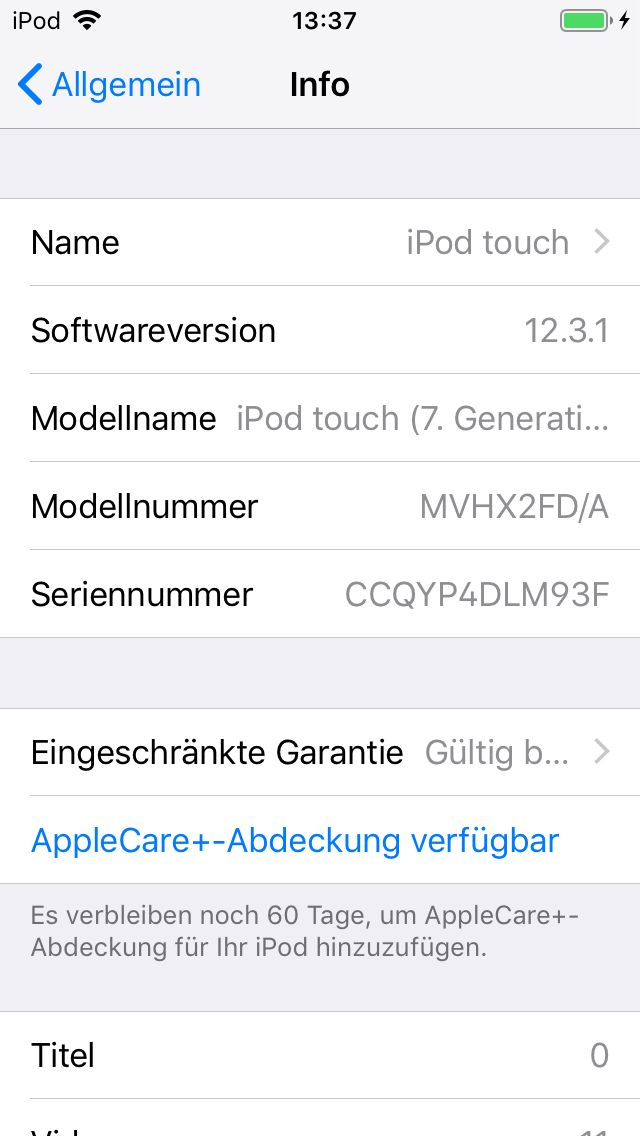
The iPod Touch 2019 comes with iOS 12 preinstalled, currently the latest version of the OS at the time of writing. Apple will roll out iOS 13 to the device too, but this will not be extended to the last generation iPod Touch. The iPod Touch 2019 will be the only model to receive iOS 13.
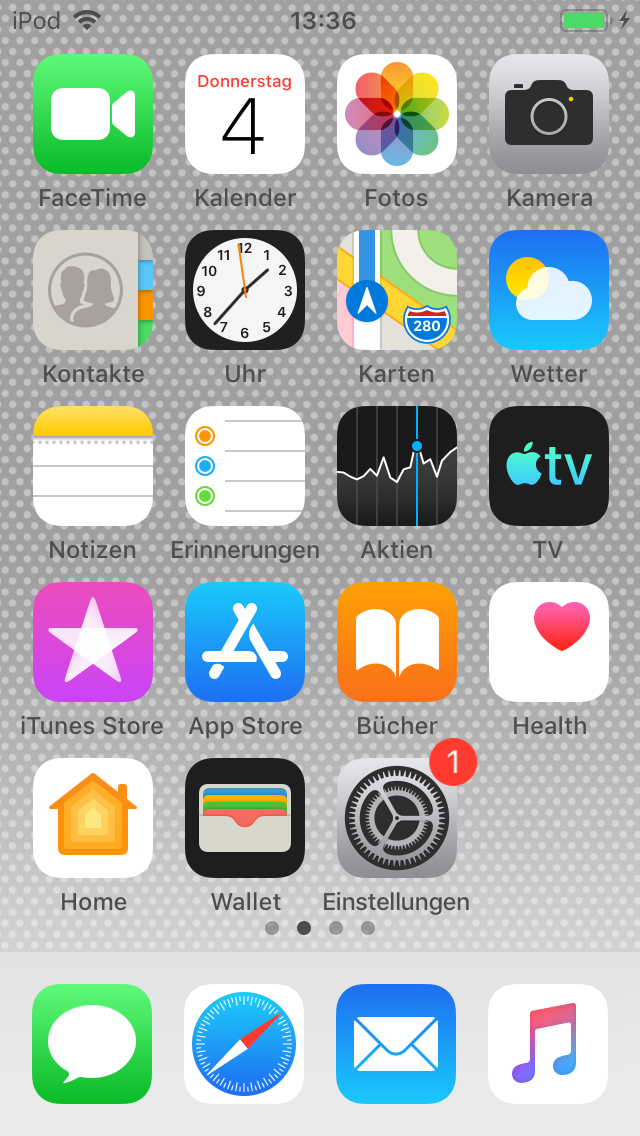
Apple does not preinstall any bloatware, but it does include in-house apps like GarageBand, Keynote and its Health App. The iPod Touch 2019 comes with the Apple App Store too, giving it access to tens of thousands of apps and making it almost as versatile as an iPhone.
You can also use the iTunes Backup and Restore service to transfer your data from another iPod, iPhone or iPad to the iPod Touch 2019. The process works well and is one of the more impressive aspects of iOS in our opinion.
Disappointingly, Apple still restricts people to syncing the iPod Touch via iTunes. You can import photos via iPhoto on Mac but copying photos or music to the device requires using iTunes. The media player converts MP3 files to Apple’s AAC format too, of which we are not fans. You could use music-streaming services like Apple Music, Deezer or Spotify should you not have a desktop PC or laptop.
Communication & GPS
The iPod Touch 2019 supports all modern Wi-Fi standards up to 802.11ac. It also supports Bluetooth 4.1, which is now rather outdated. Our review unit could not match the iPhone 7 or Galaxy A40 in our iperf3 Client Wi-Fi tests with our Linksys EA8500 reference router, but it still averaged over 150 Mb/s in both the tests we conducted.
| Networking | |
| iperf3 transmit AX12 | |
| Apple iPhone 7 (Klaus I211) | |
| Samsung Galaxy A40 | |
| Apple iPod Touch 2019 | |
| Nokia 4.2 | |
| iperf3 receive AX12 | |
| Apple iPhone 7 (Klaus I211) | |
| Samsung Galaxy A40 | |
| Apple iPod Touch 2019 | |
| Nokia 4.2 | |
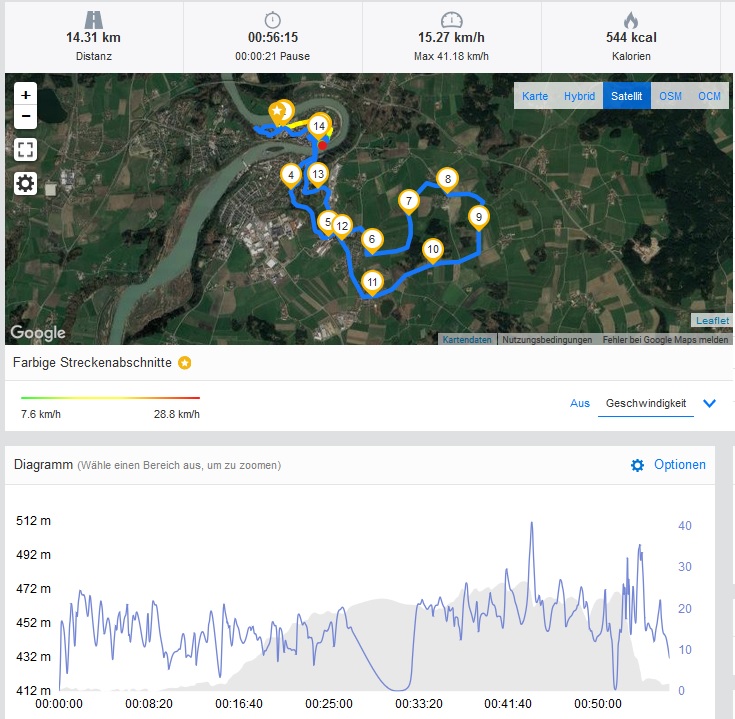
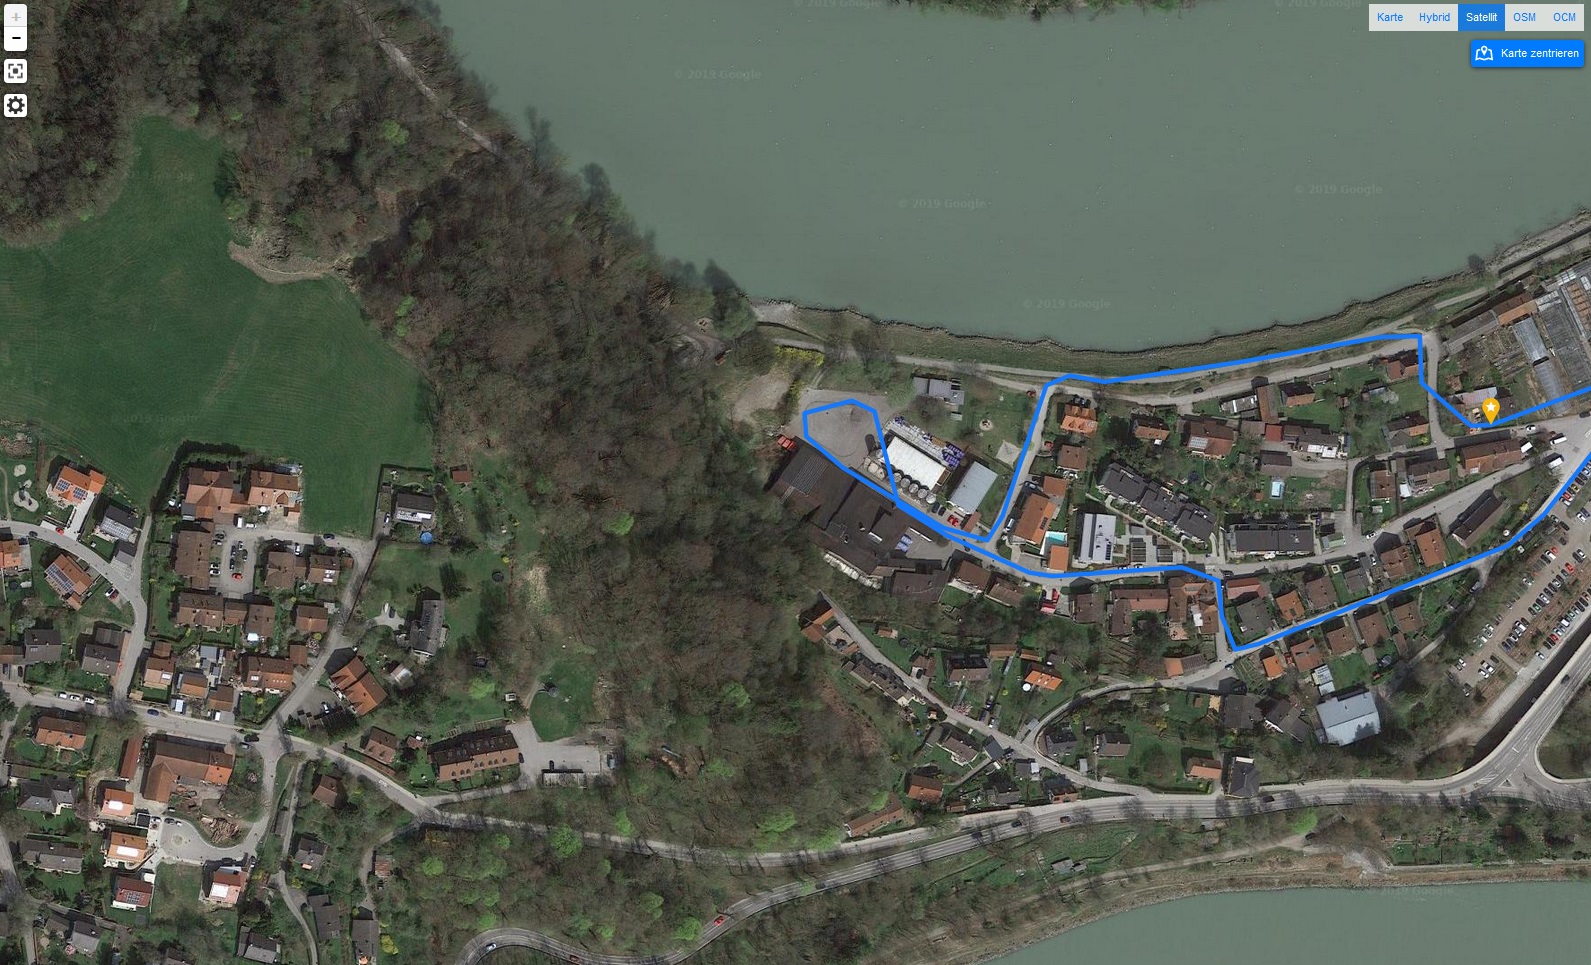
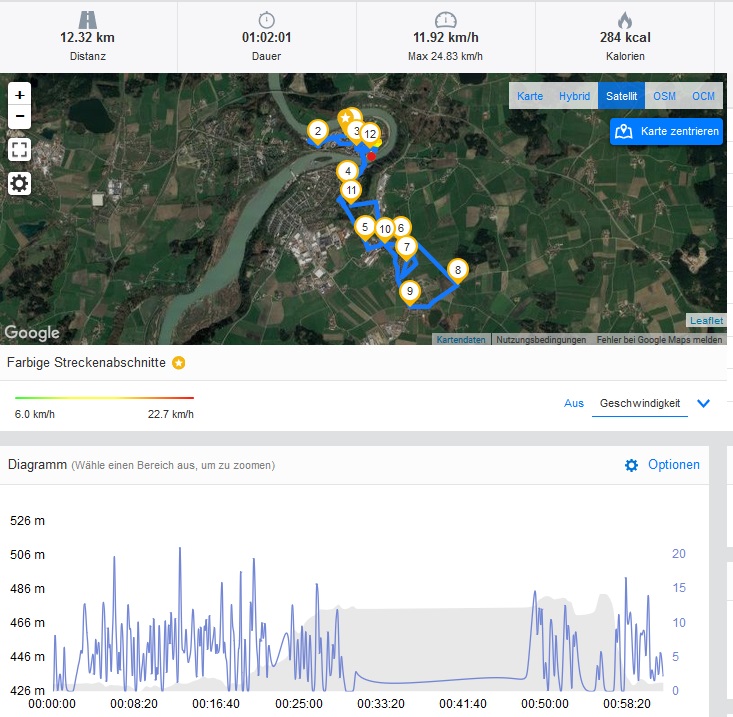
Apple does not include a GPS module, but the iPod Touch can use Wi-Fi networks to approximate your location. The preinstalled Apple Maps app worked well during our tests, although the device will be unable to find you if there are no nearby Wi-Fi networks.
Correspondingly, our review unit could not plot our route accurately during our obligatory bike ride. The iPod Touch 2019 claimed we had cycled about 2 km less than our reference bike computer, the Garmin Edge 520, had recorded. As the screenshots below demonstrate, the iPod Touch 2019 cannot be relied on for providing accurate location data.


Cameras

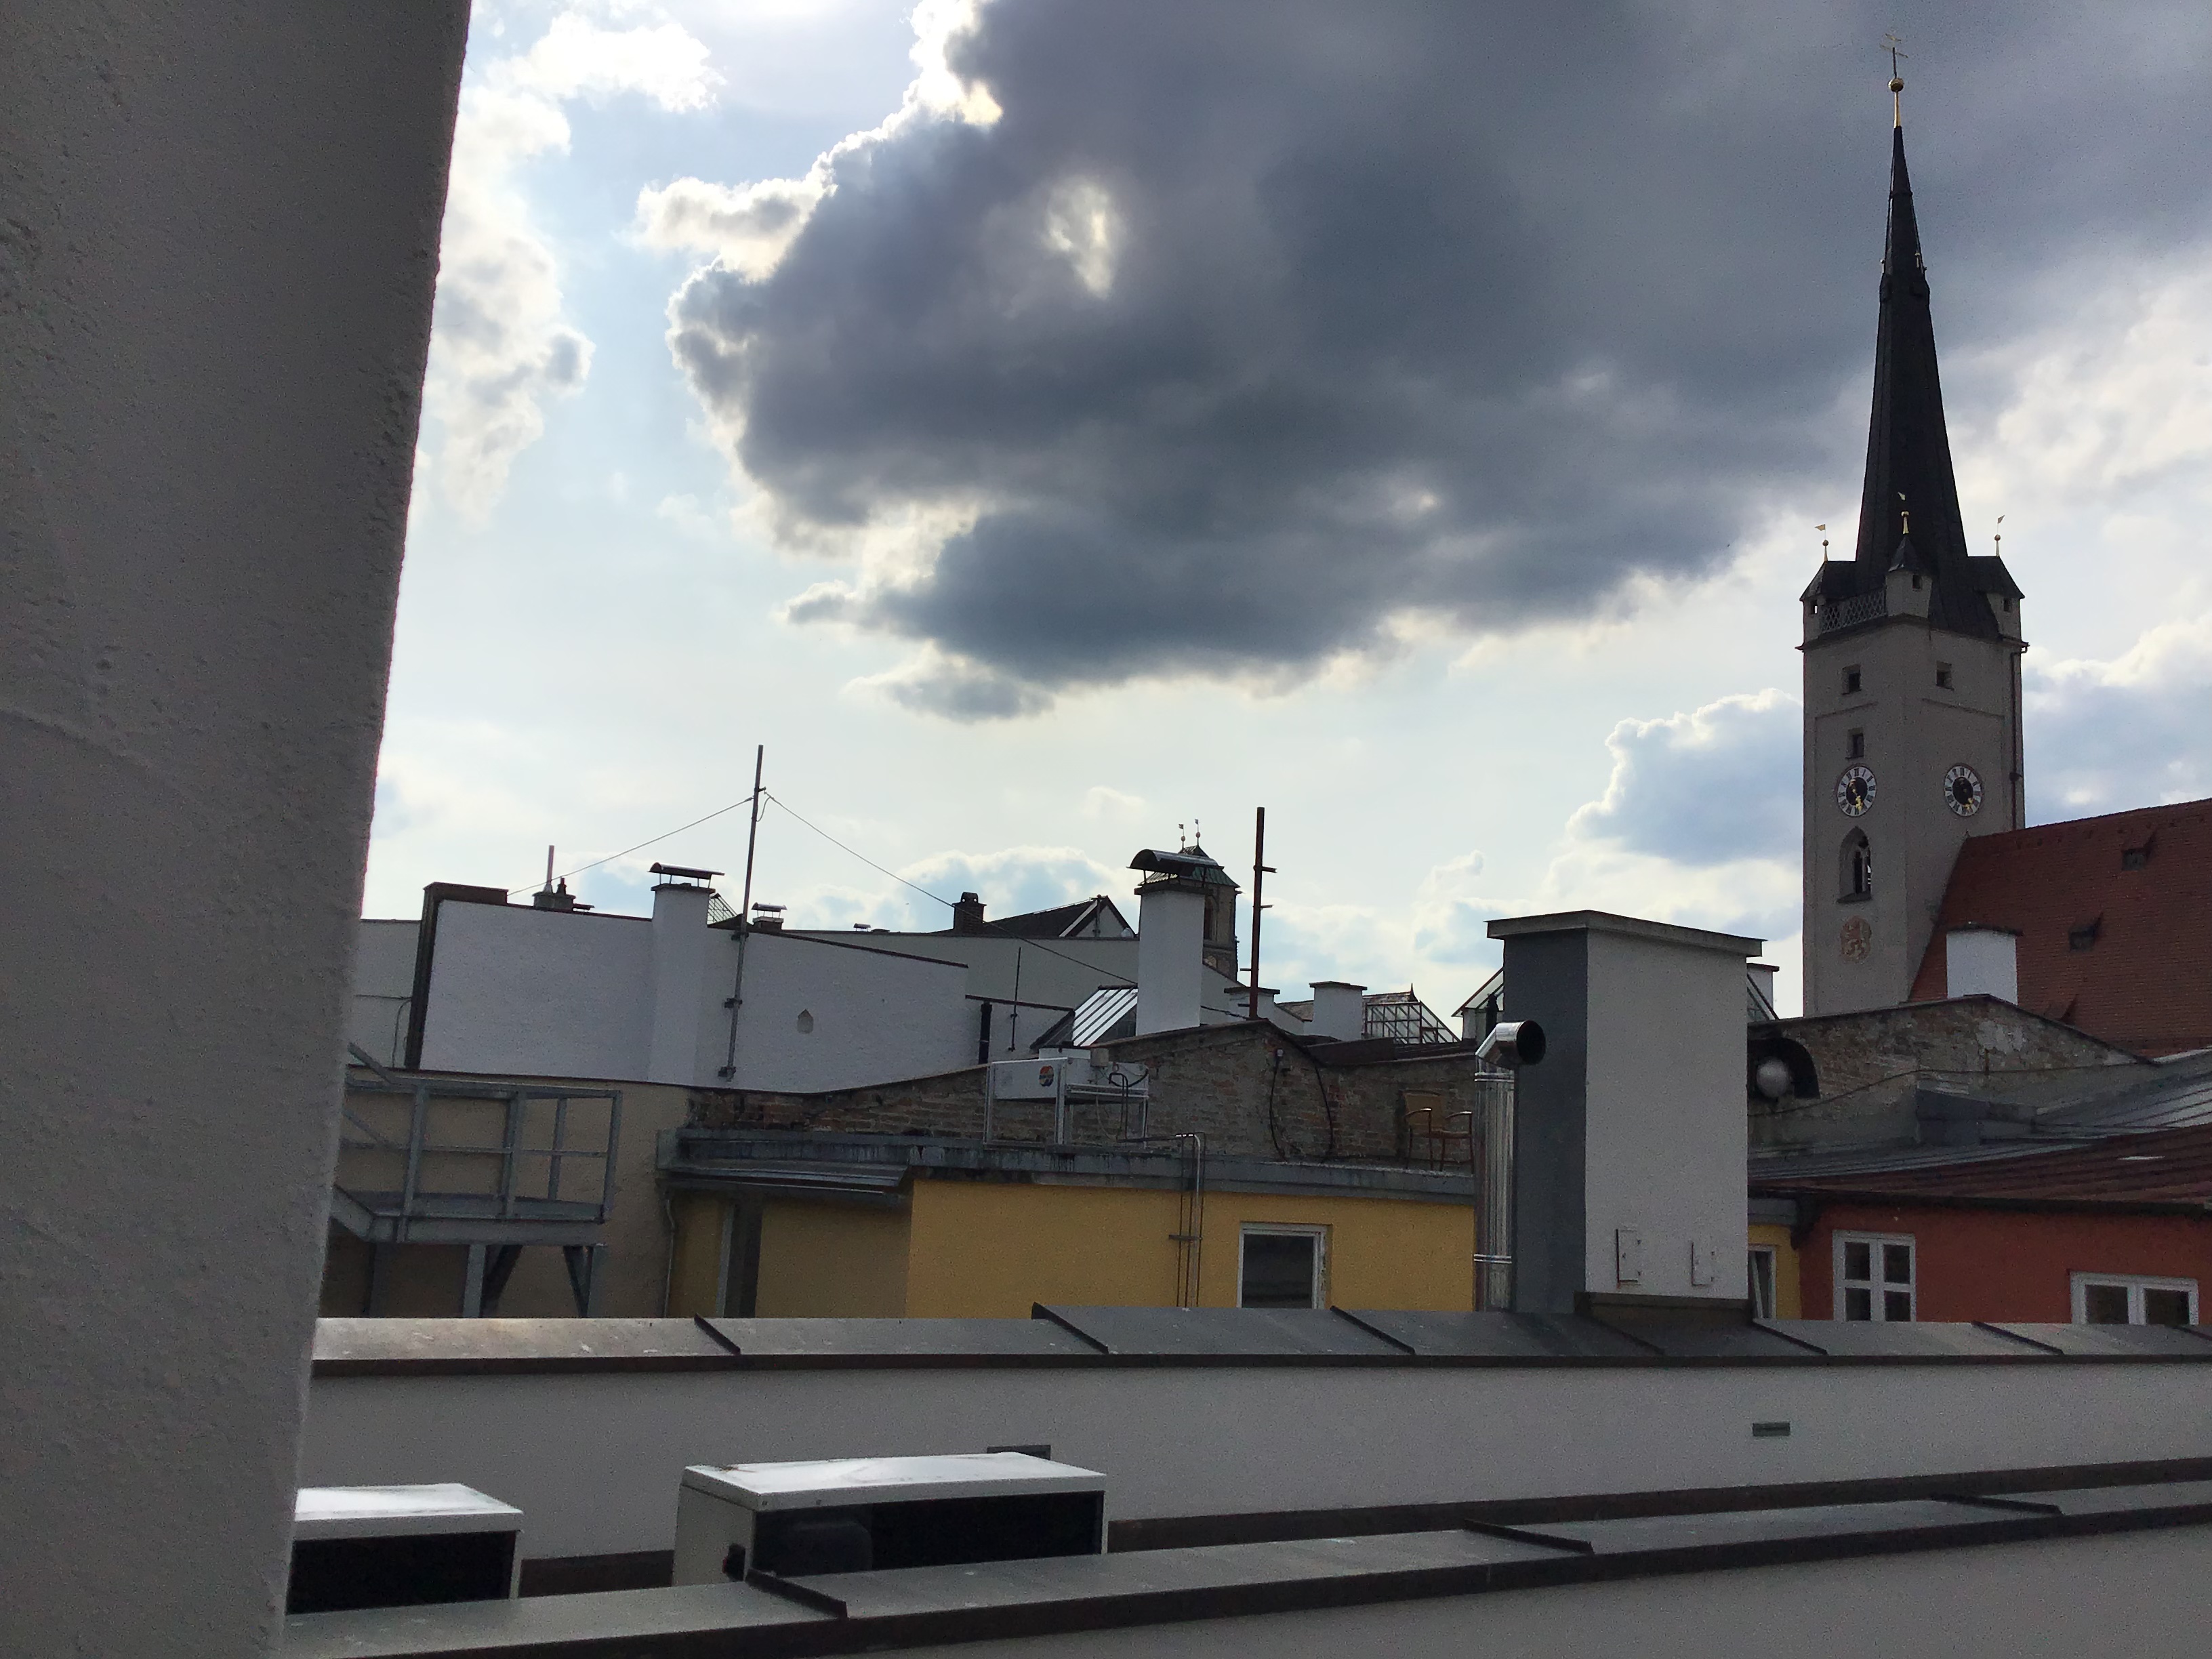
We did not think we would ever be reviewing a device with a 1.2 MP camera again, but here we are. The iPod Touch 2019 has an 8 MP rear-facing camera too, but its front-facing sensor is surprisingly good considering its measly MP count. Photos look washed-out, but they are pleasingly sharp if you do not zoom in too far. Overall, the front-facing camera is good enough for using services like FaceTime.
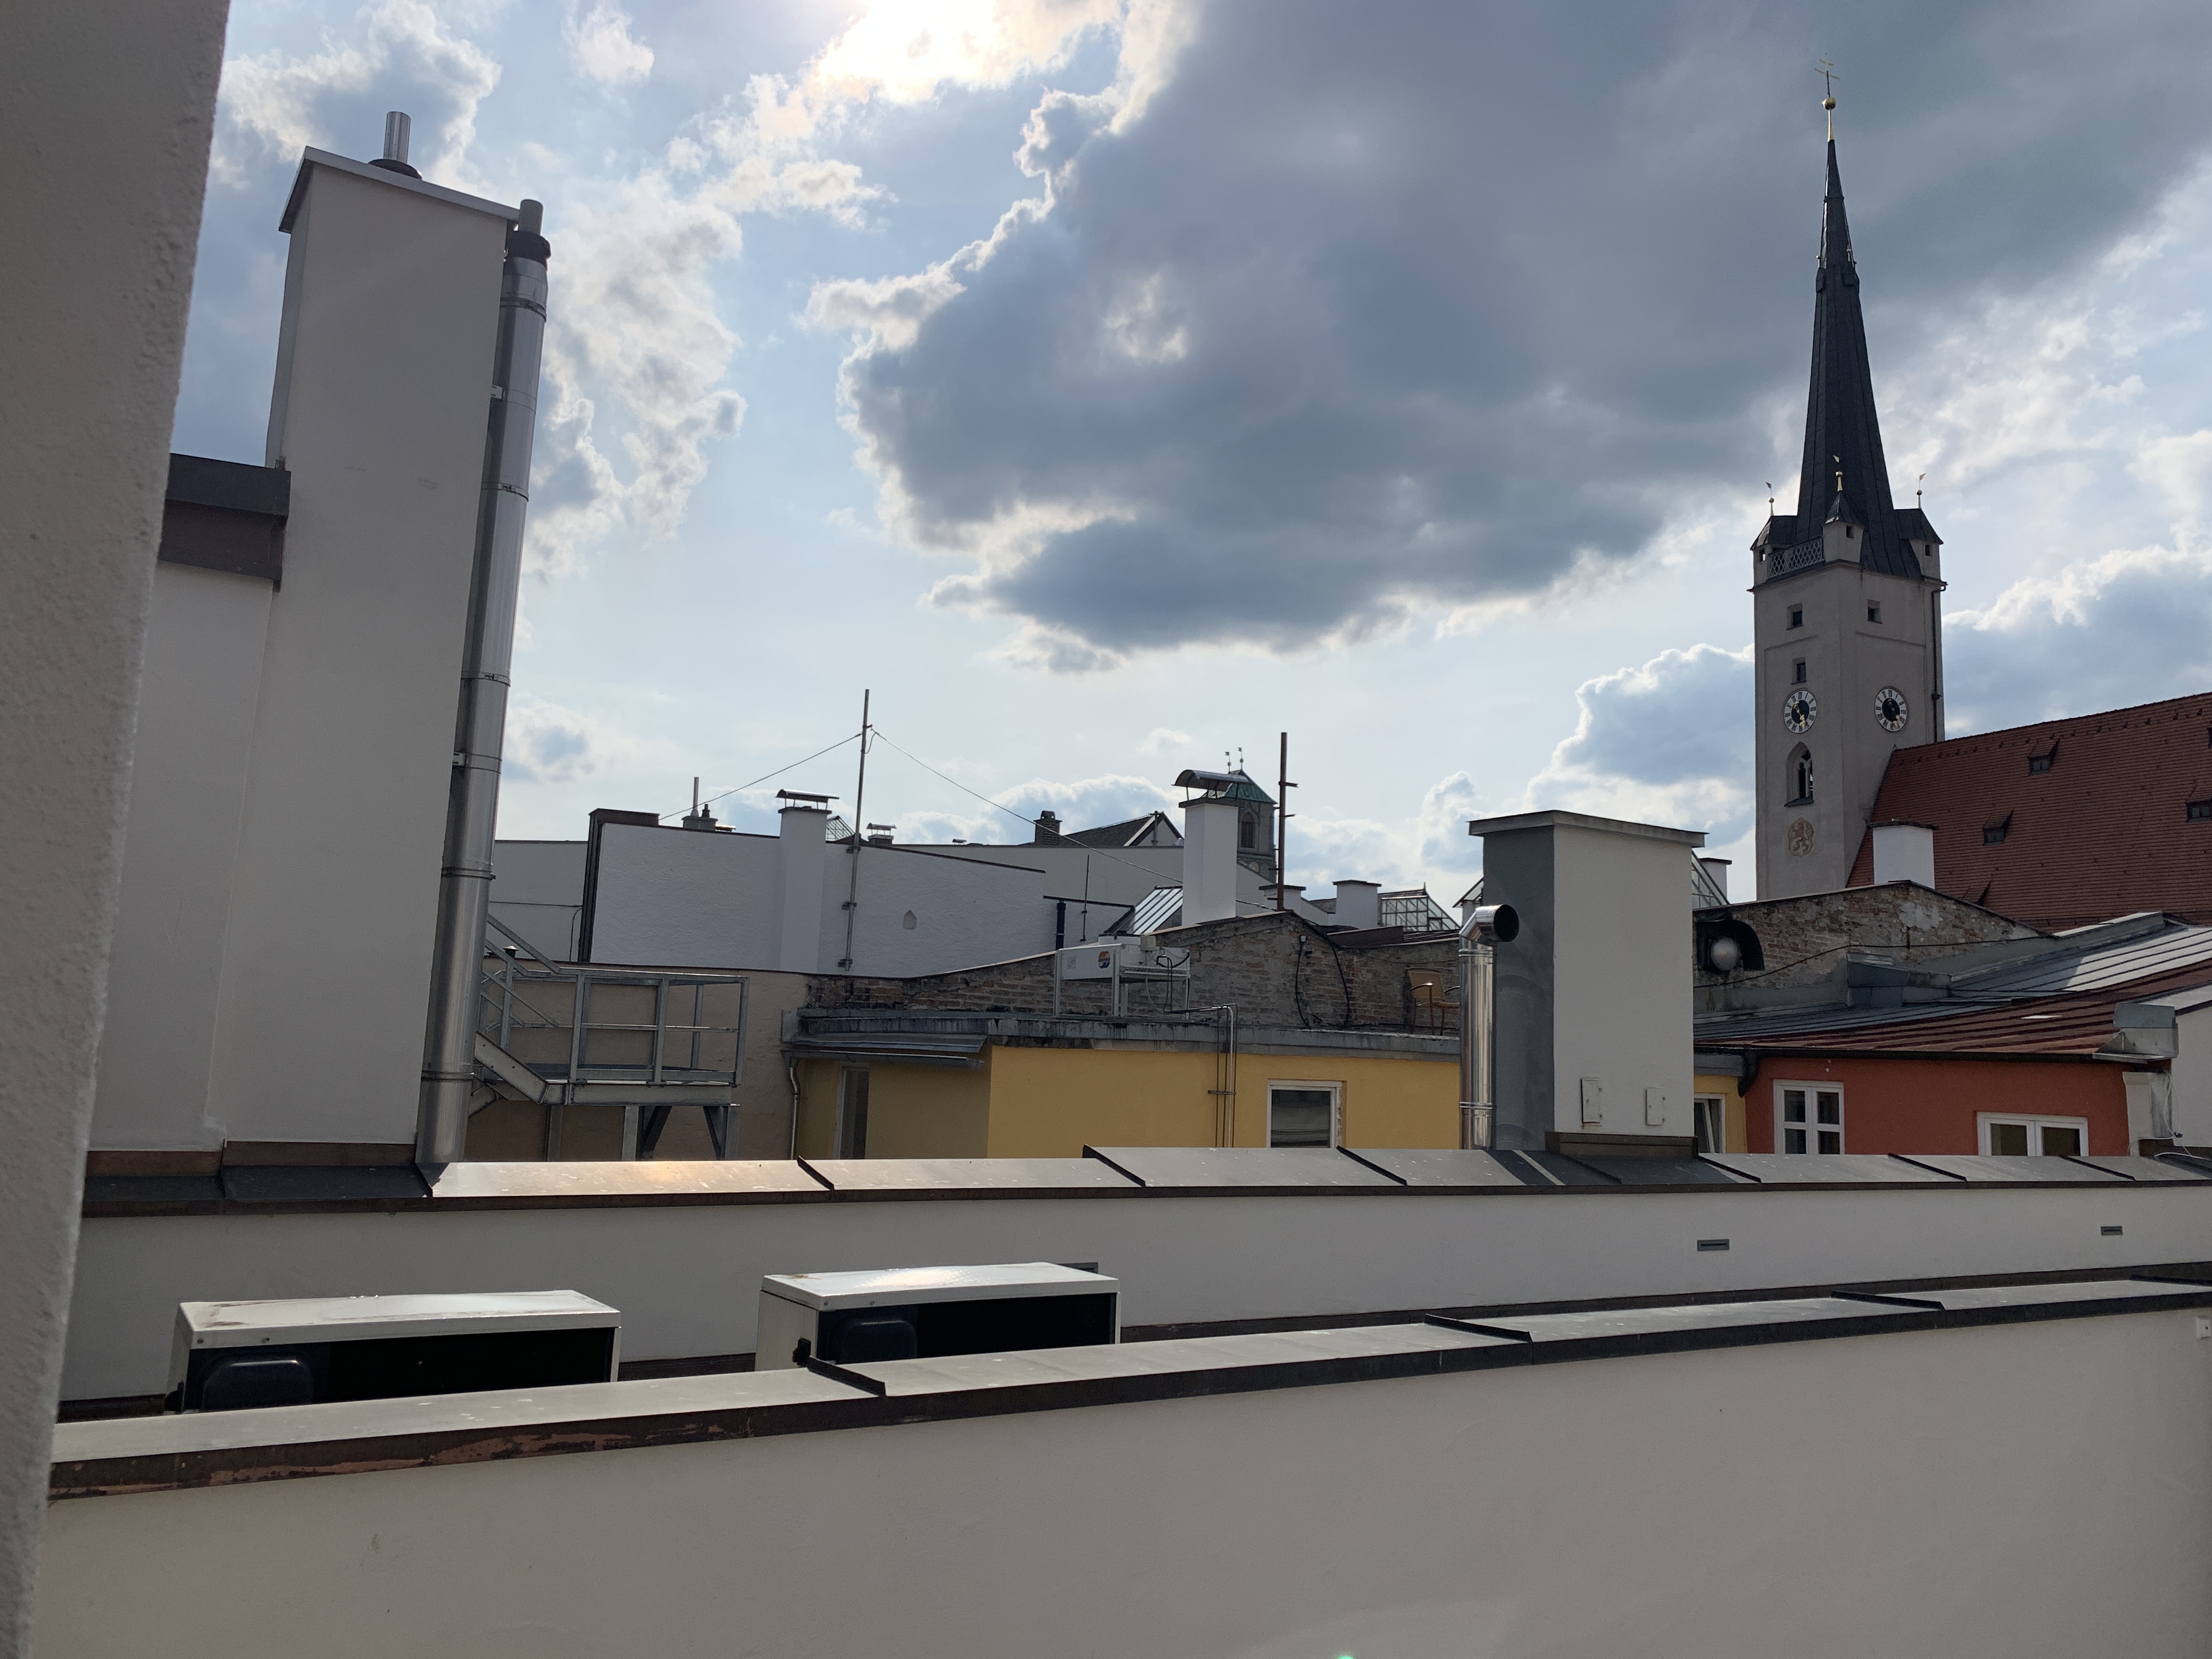
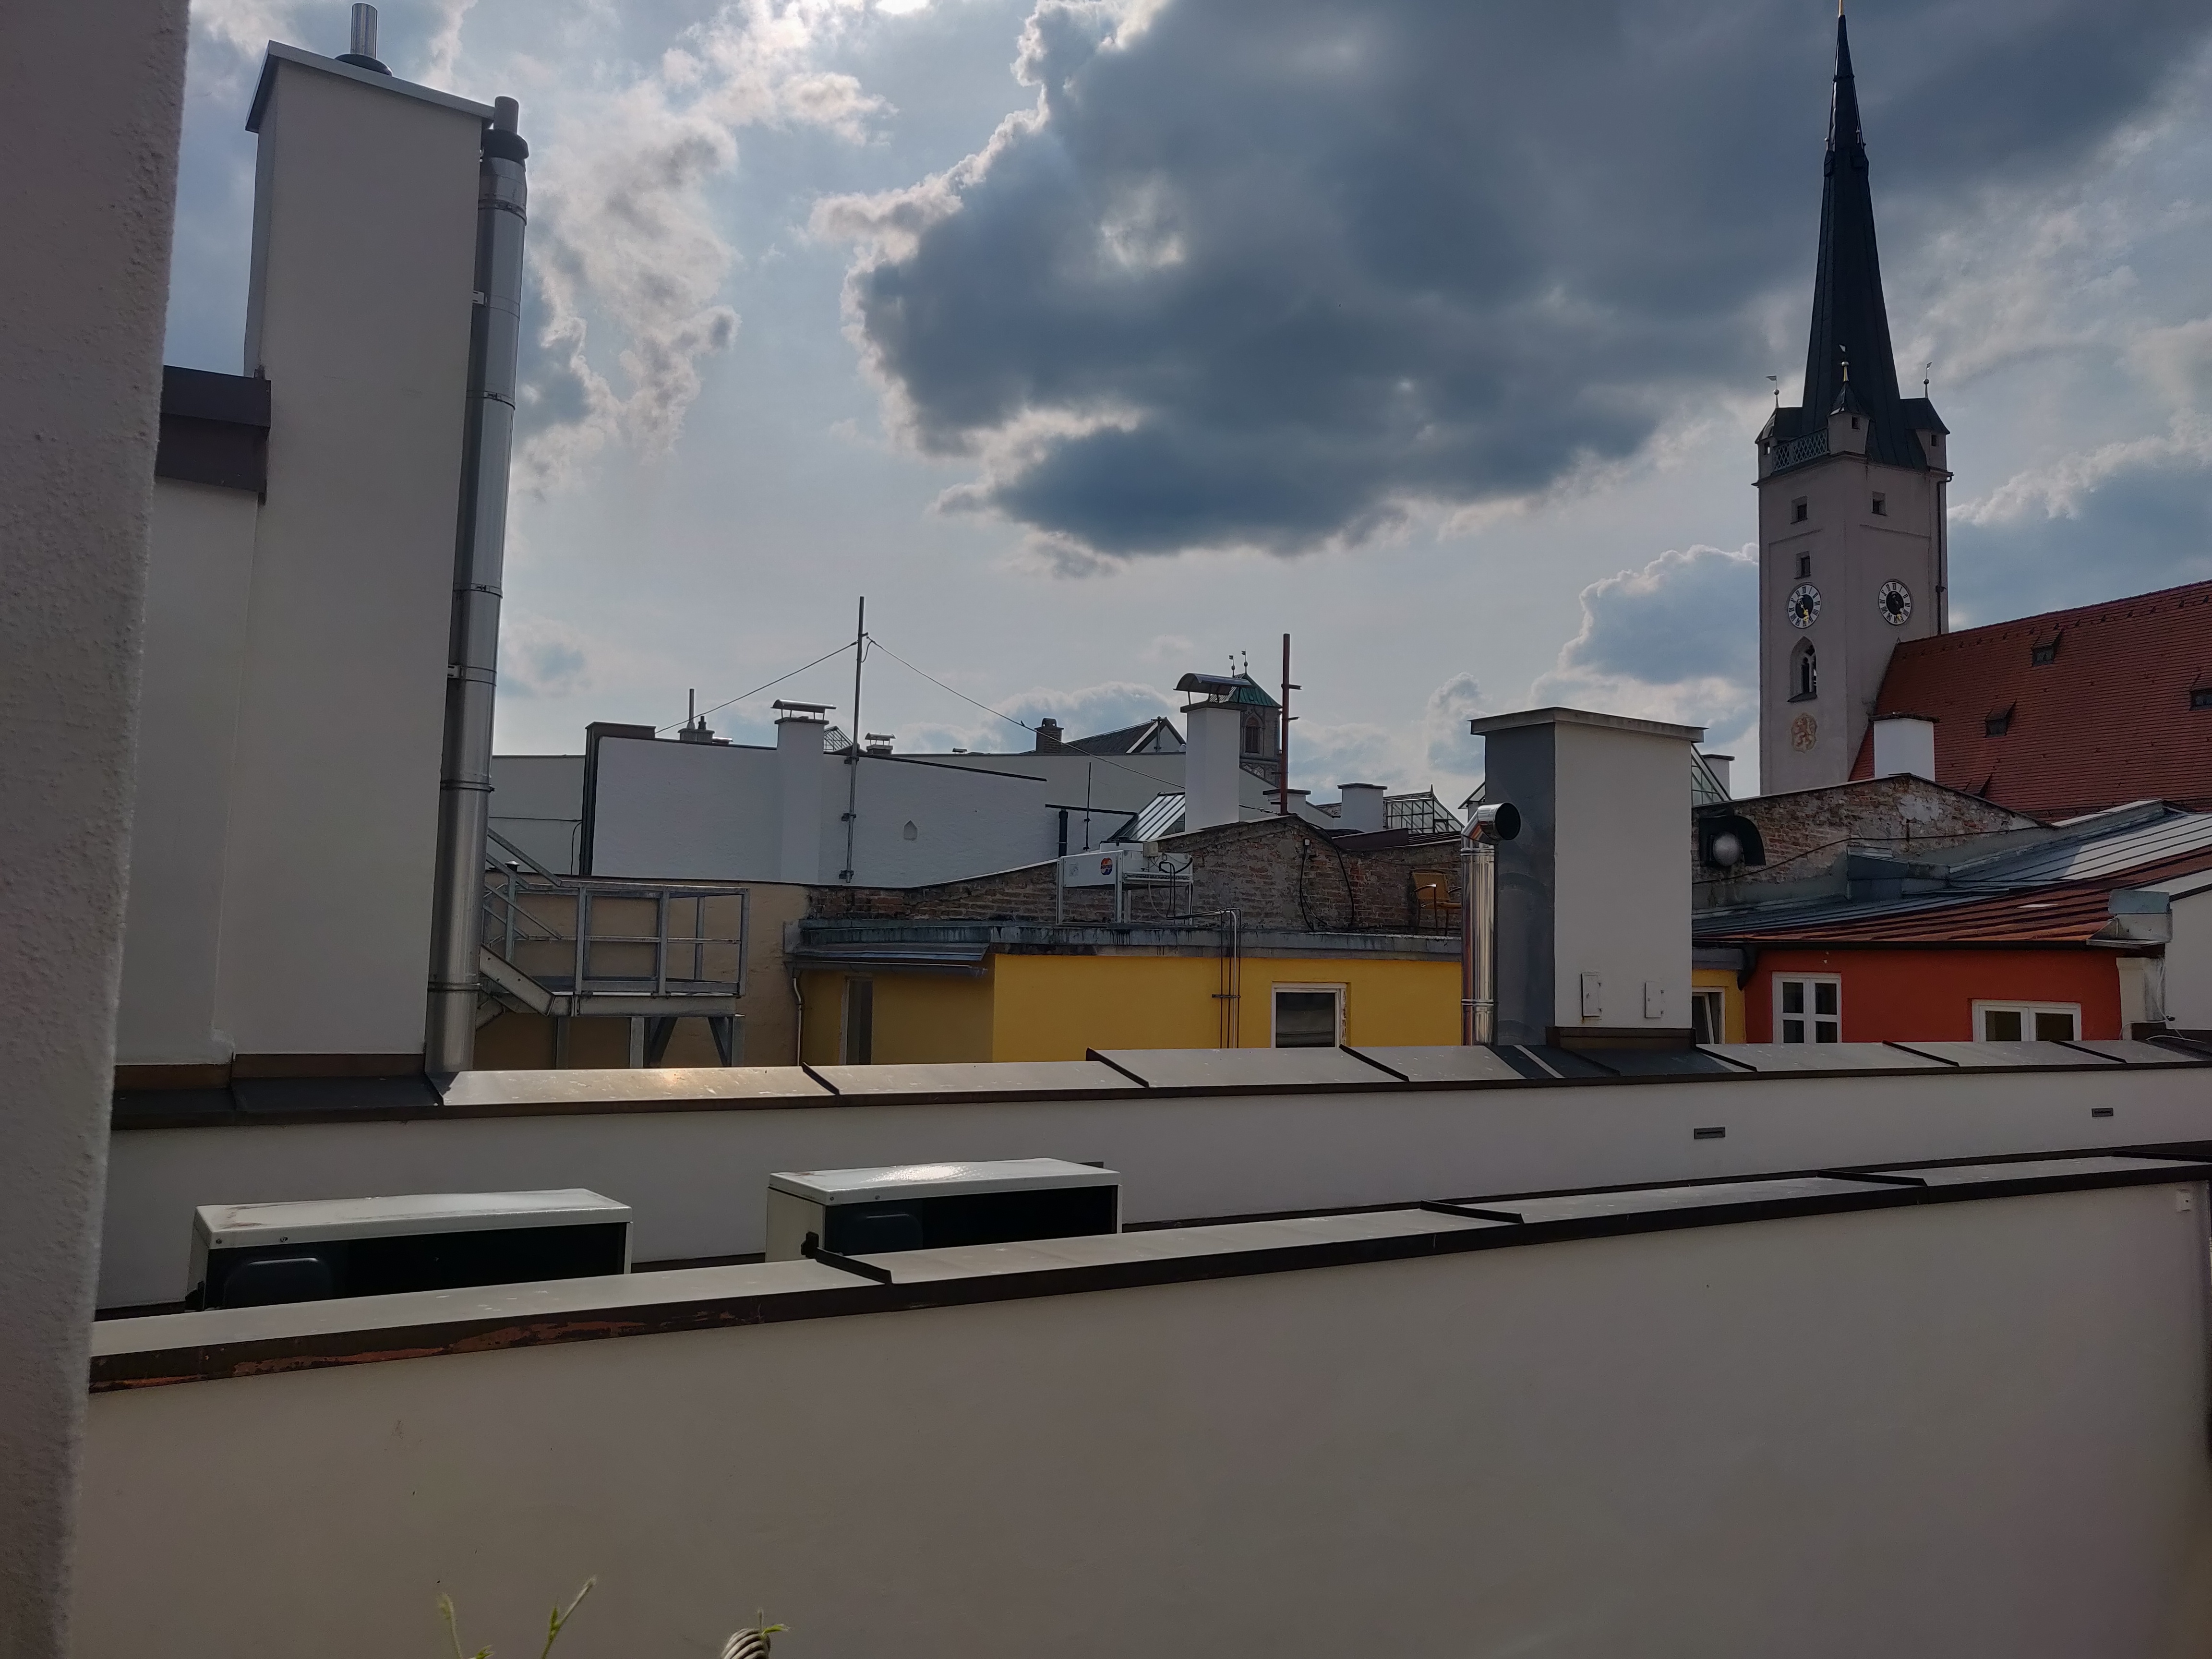
The rear-facing camera will win no awards either, but its LED flash helps it in low-light shots. Naturally, the iPod Touch 2019 cannot compete with modern flagships, but the 8 MP sensor is not a complete potato. Incidentally, the iPod Touch 2019 can record videos in up to 1080p at 30 FPS.


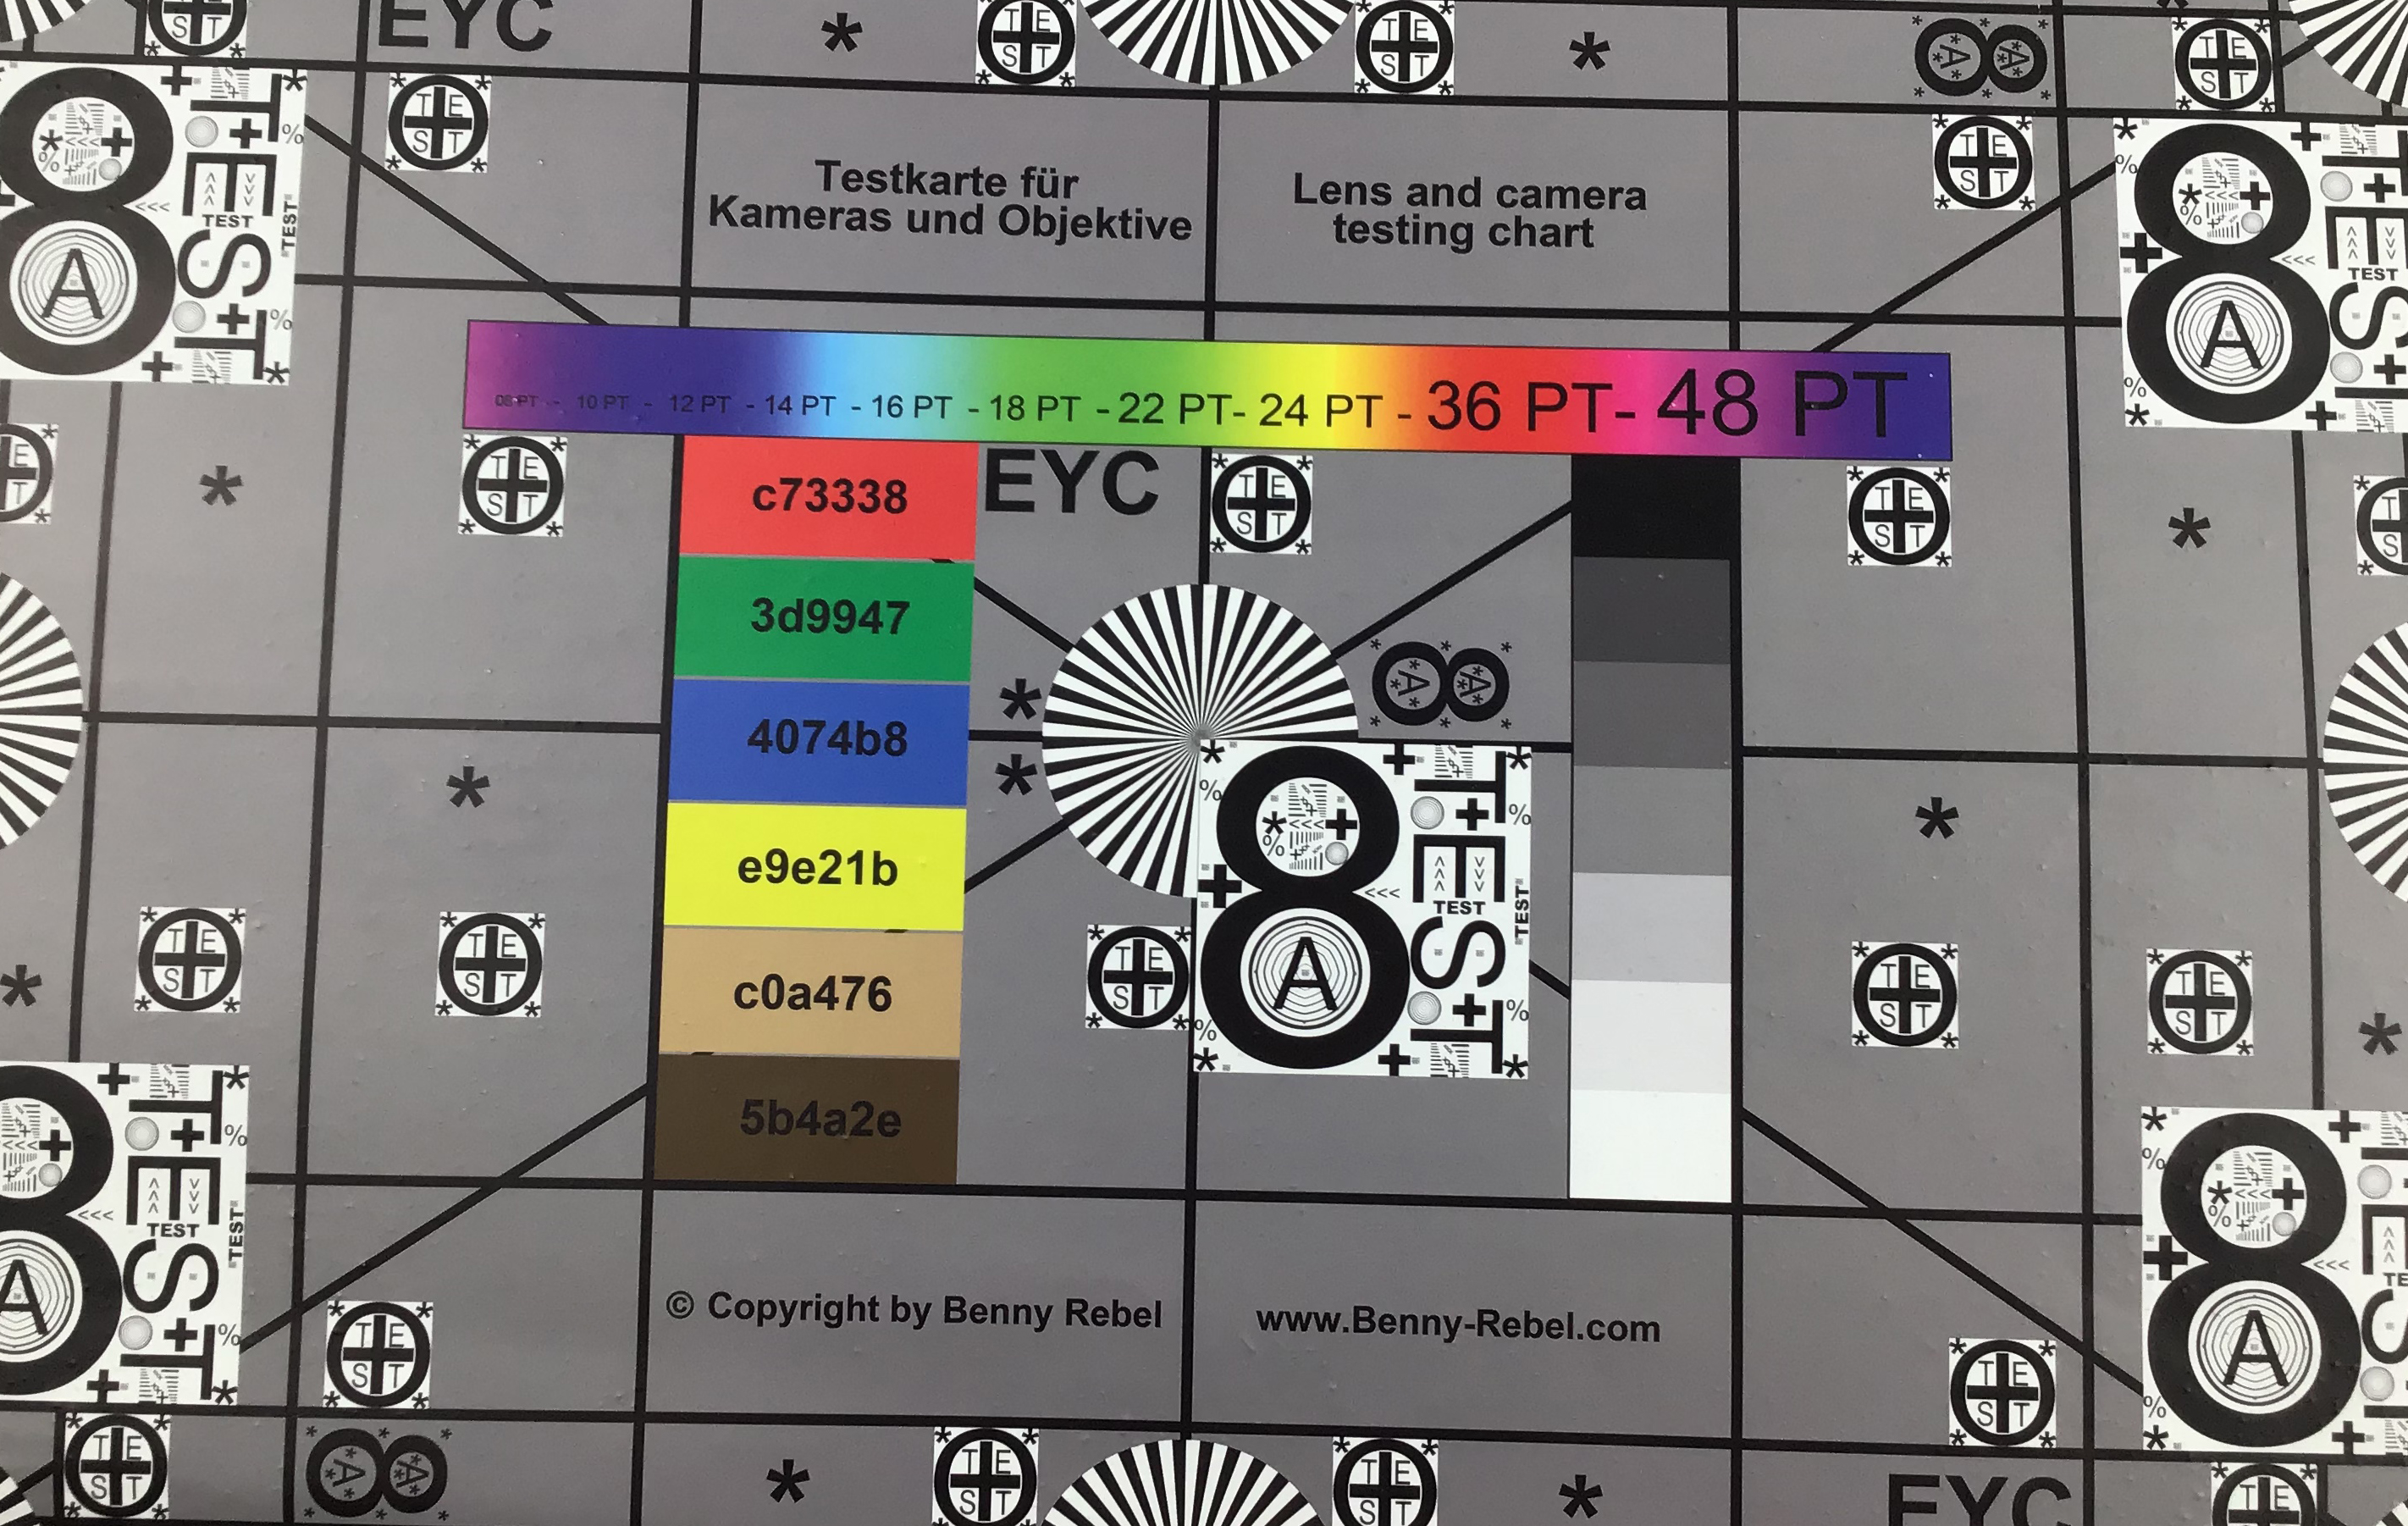
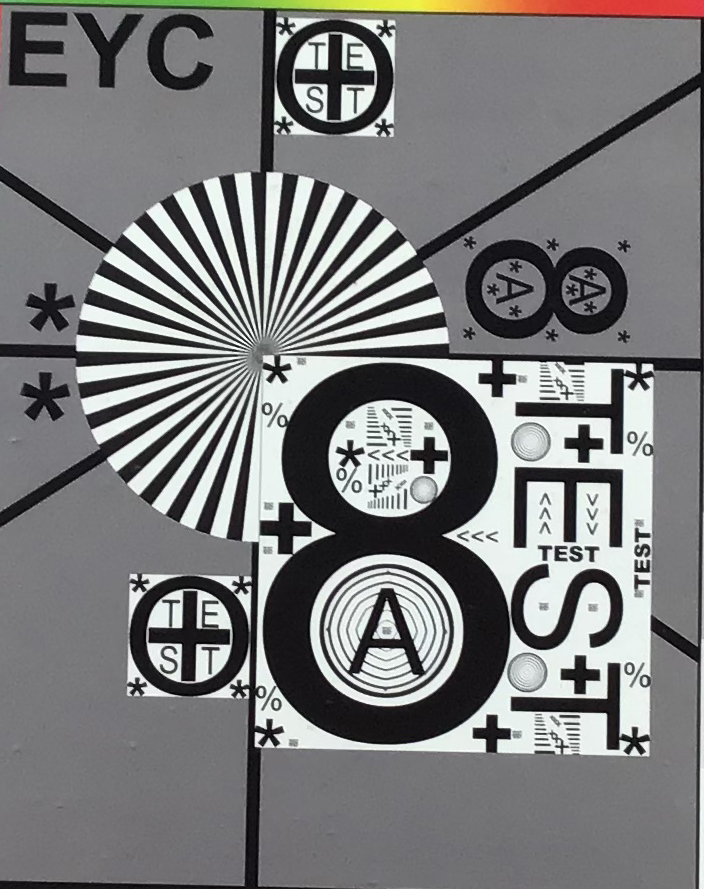
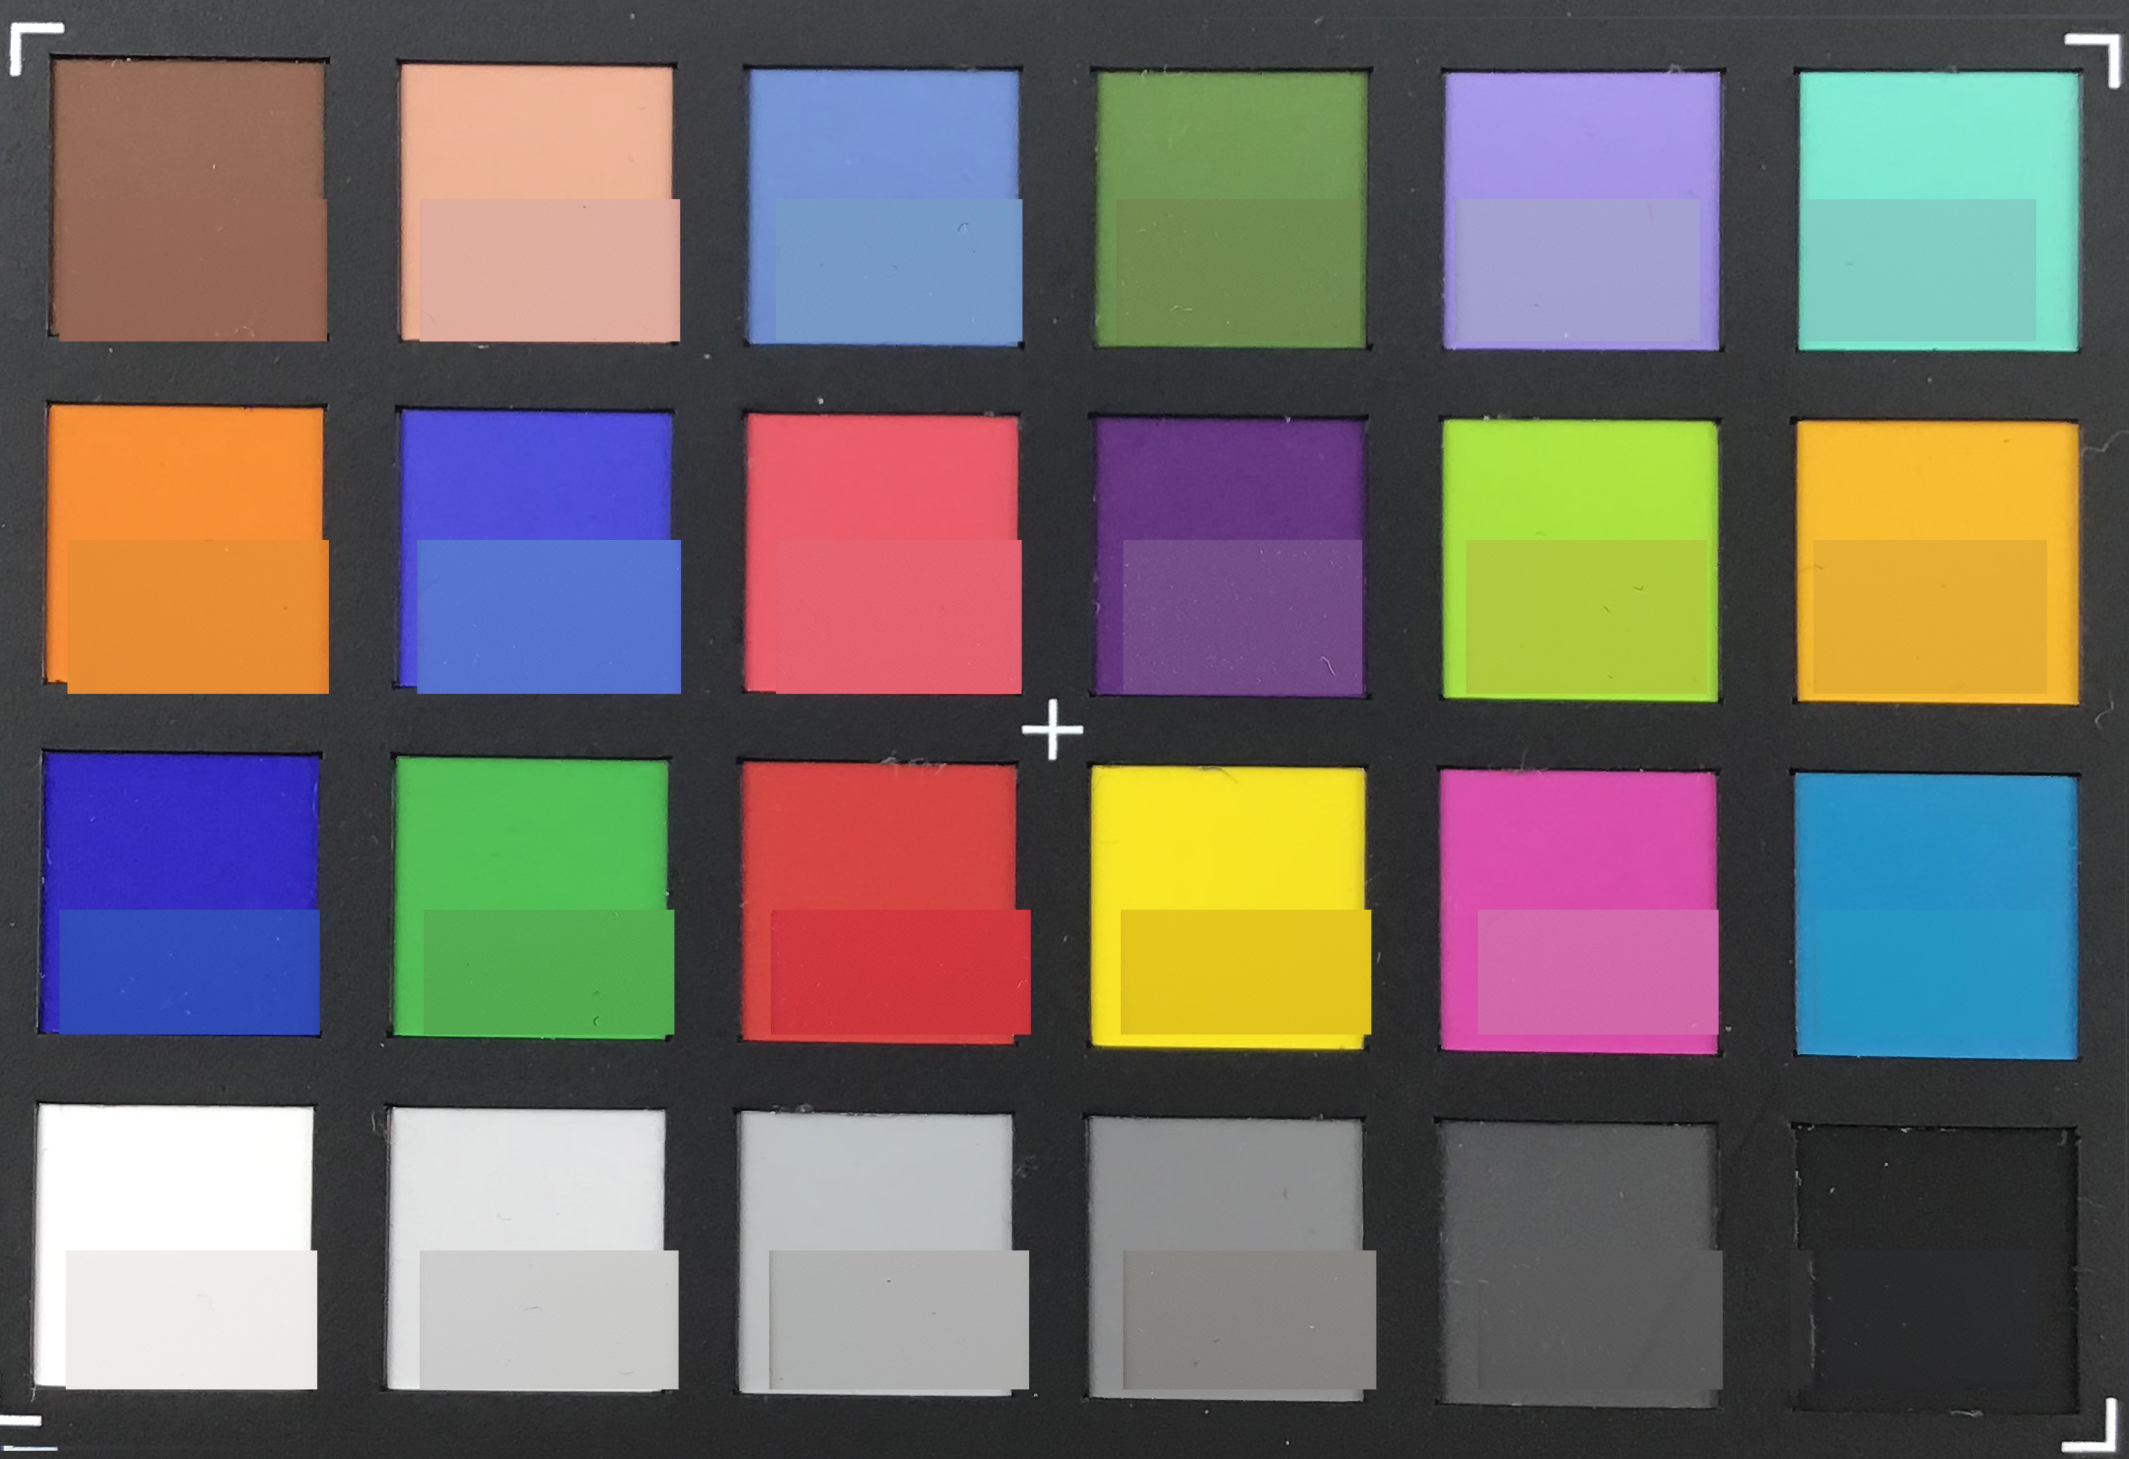
We also subjected the rear-facing sensor to further camera tests under controlled lighting conditions. Again, the iPod Touch 2019 impressed us, with it reproducing most ColorChecker Passport reference colours accurately. Our test chart looks sharp too, with details being preserved nicely.
Accessories & Warranty
Apple includes only a few accessories with the iPod Touch 2019. Our review unit arrived with a USB Type-A to Lightning cable and a set of wired 3.5 mm headphones, but no charger. The former sound rather good for bundled headphones though.
The iPod Touch 2019 supports other Apple accessories like its AirPods should you prefer using wireless headphones. The device comes with a 24-month limited warranty too. Please see our Guarantees, Return Policies & Warranties FAQ for country-specific information.
Input Devices & Operation
The iPod Touch 2019 has, as all recent Apple devices do, an accurate and precise touchscreen. We found it tricky to press some small UI buttons though, with the 4-inch display making them even tinier than they would be on something like an iPhone 7. We noticed this while typing in portrait mode, for instance, but we doubt it will bother most people in daily use.
The physical home button is back, but did it ever leave? You will probably identify with the former if you use a modern iPhone and the latter if you have a 6th generation iPod Touch, but it still provides clear acoustic and haptic feedback either way. There is no fingerprint scanner though.
The other physical buttons remain in the same place too, with the volume buttons adorning the top-left of the device. Meanwhile, the power button sits on the top edge of the frame, which is somewhat of a throwback. All three buttons are well-machined and provide pleasant feedback when pressed. There is no mute switch though.
Display

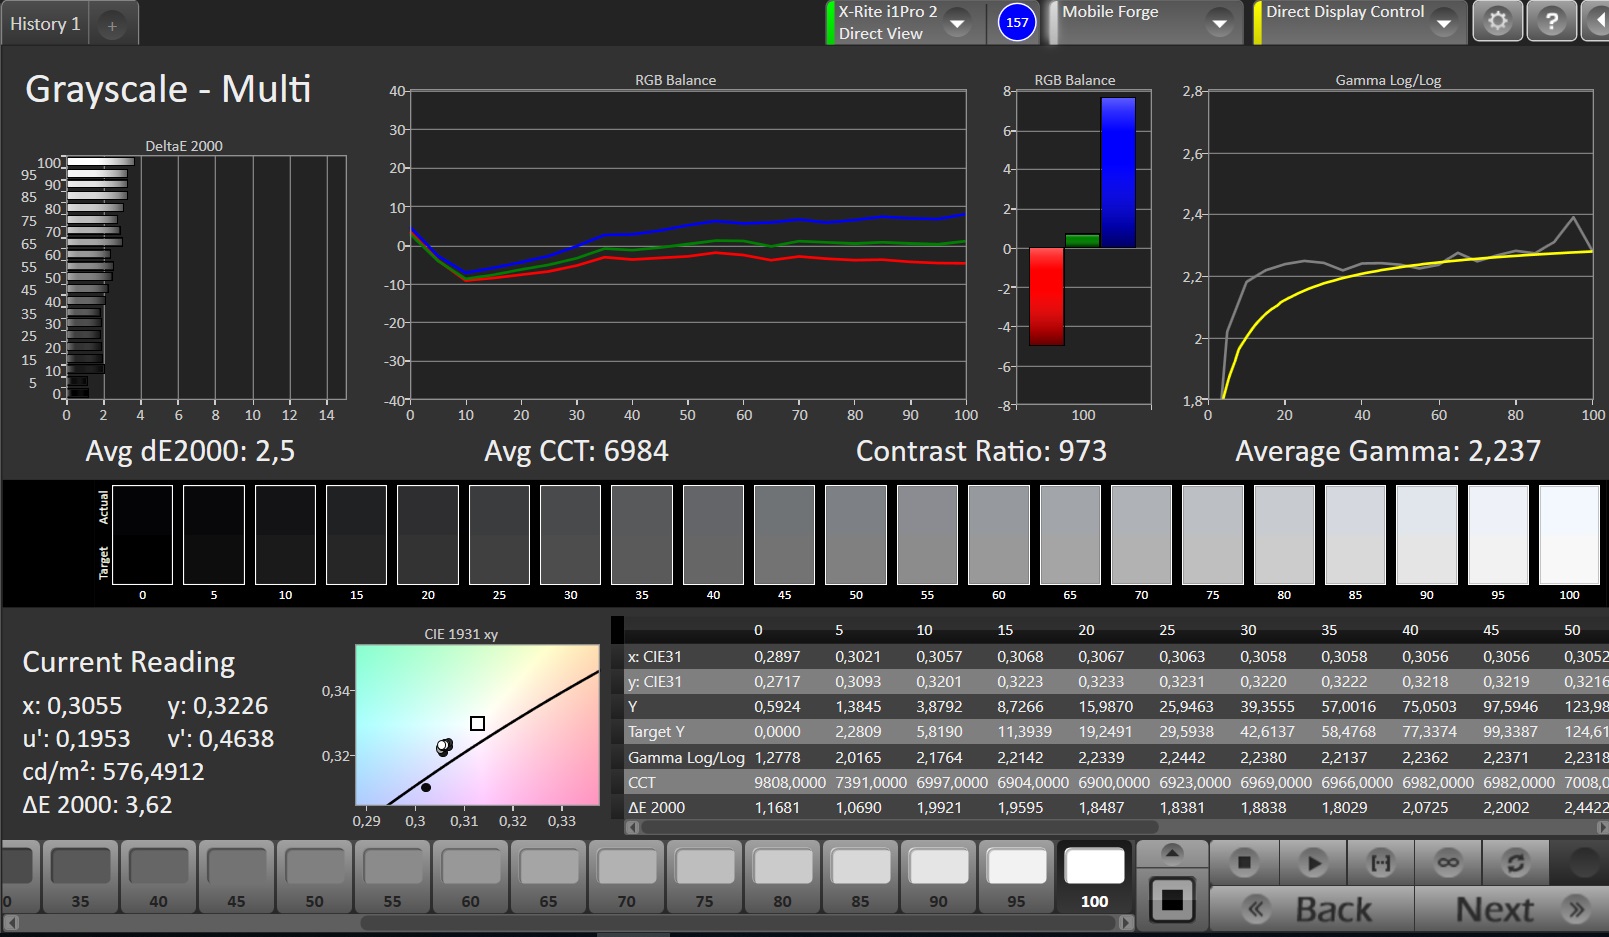
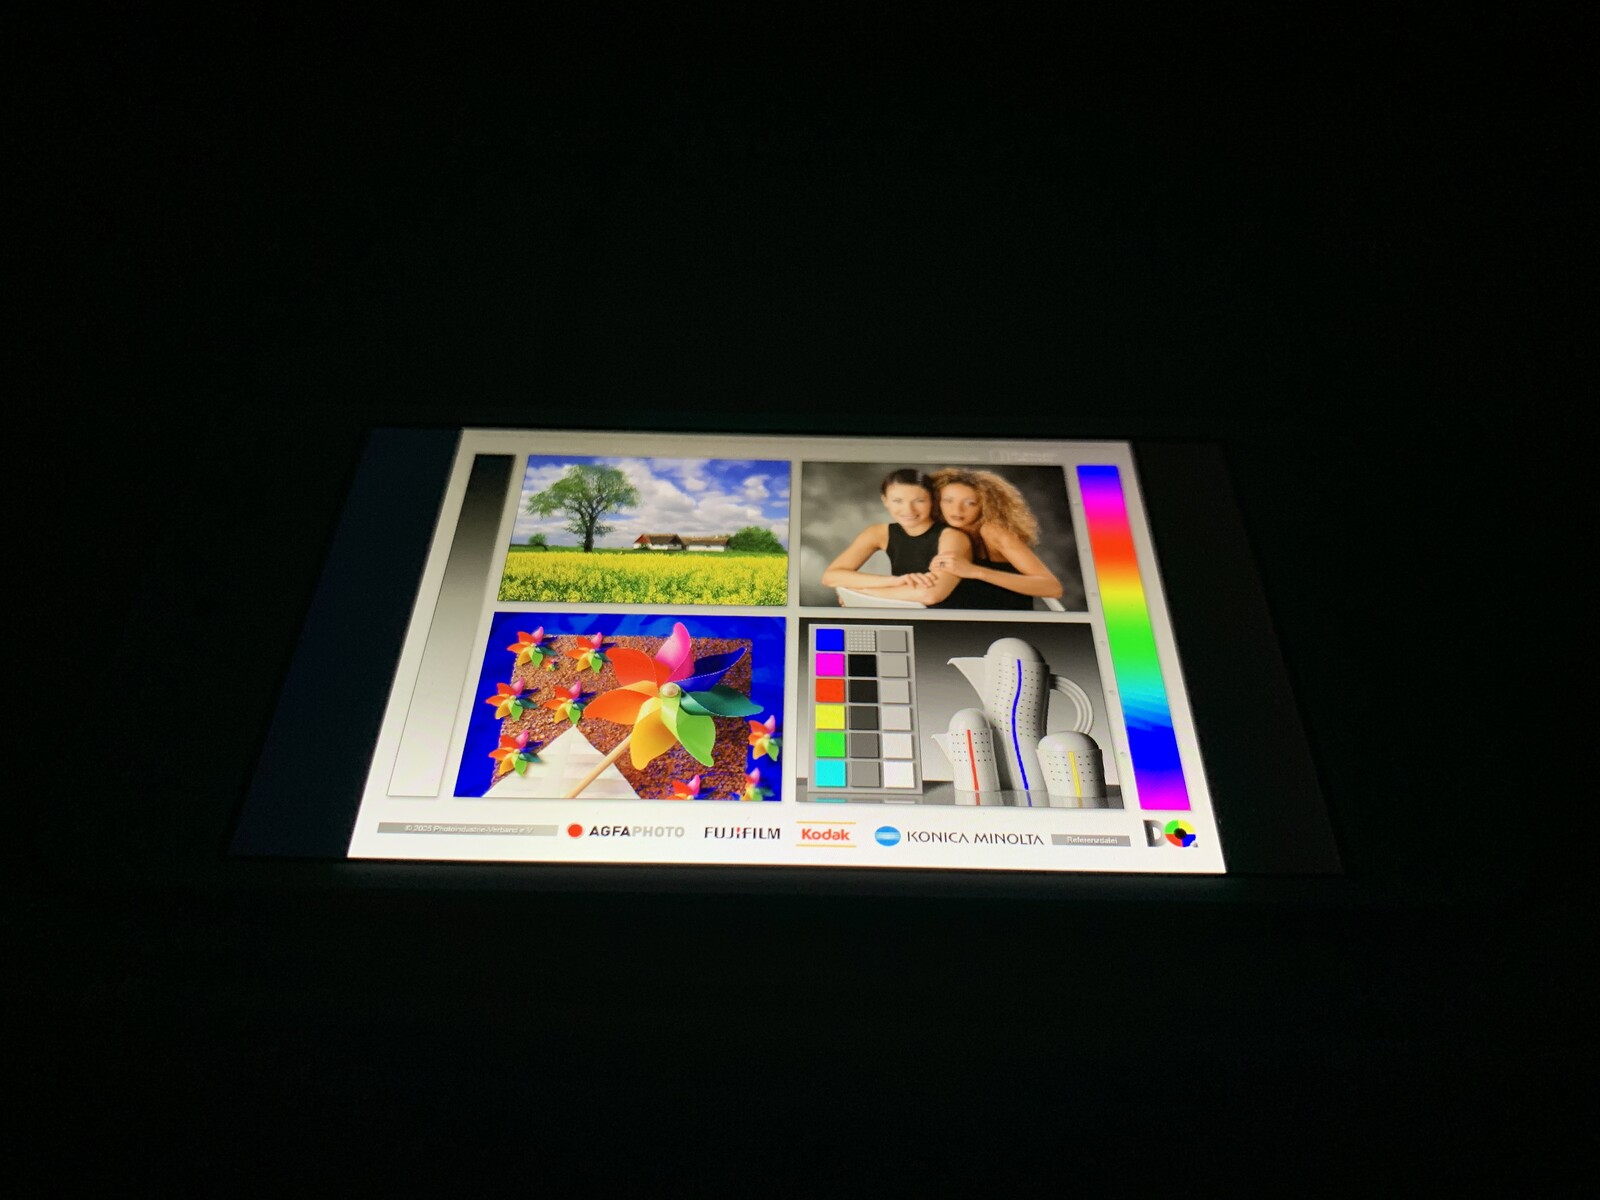
Apple is not known for using high-resolution displays in its smartphones, but the 640p panel in the iPod Touch 2019 is woefully low resolution by today’s standards. The display does get pleasingly bright though, with it achieving an average maximum luminosity of 559 cd/ m² according to X-Rite i1Pro 2. This makes the iPod Touch 2019 brighter than all but the iPhone XR and iPhone 8 of our comparison devices and streets ahead of comparably priced Android smartphones like the Nokia 4.2. The panel is 94% evenly lit too, which puts the iPod Touch 2019 ahead of all our Apple comparison devices.
| |||||||||||||||||||||||||
Brightness Distribution: 94 %
Center on Battery: 581 cd/m²
Contrast: 908:1 (Black: 0.64 cd/m²)
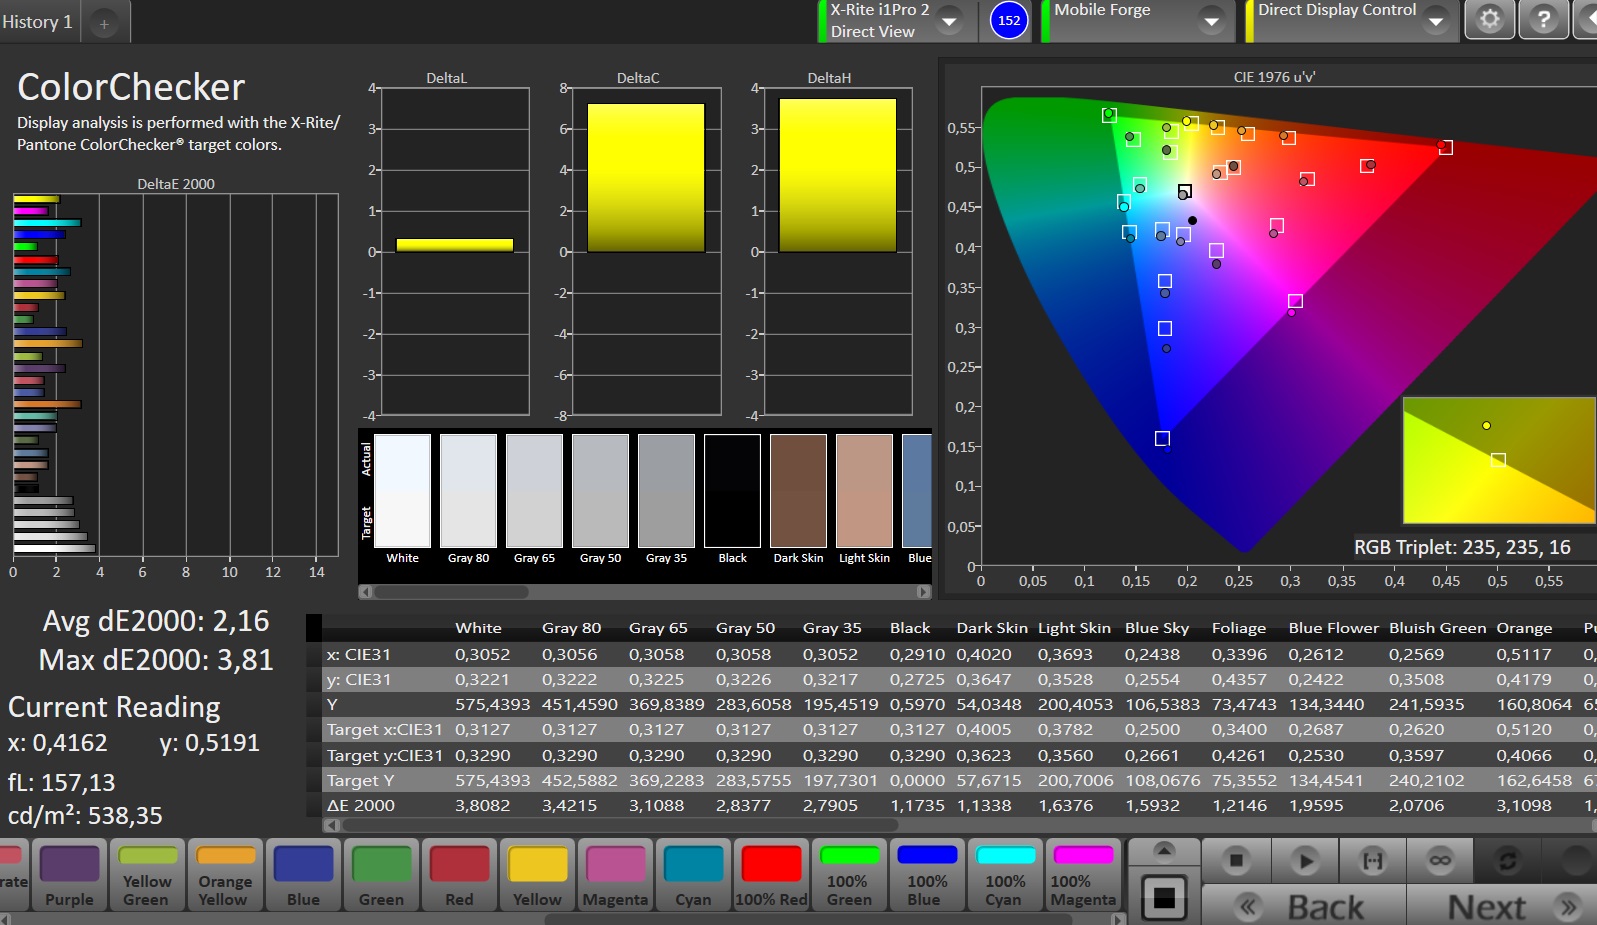
ΔE ColorChecker Calman: 2.16 | ∀{0.5-29.43 Ø4.73}
ΔE Greyscale Calman: 2.5 | ∀{0.09-98 Ø4.97}
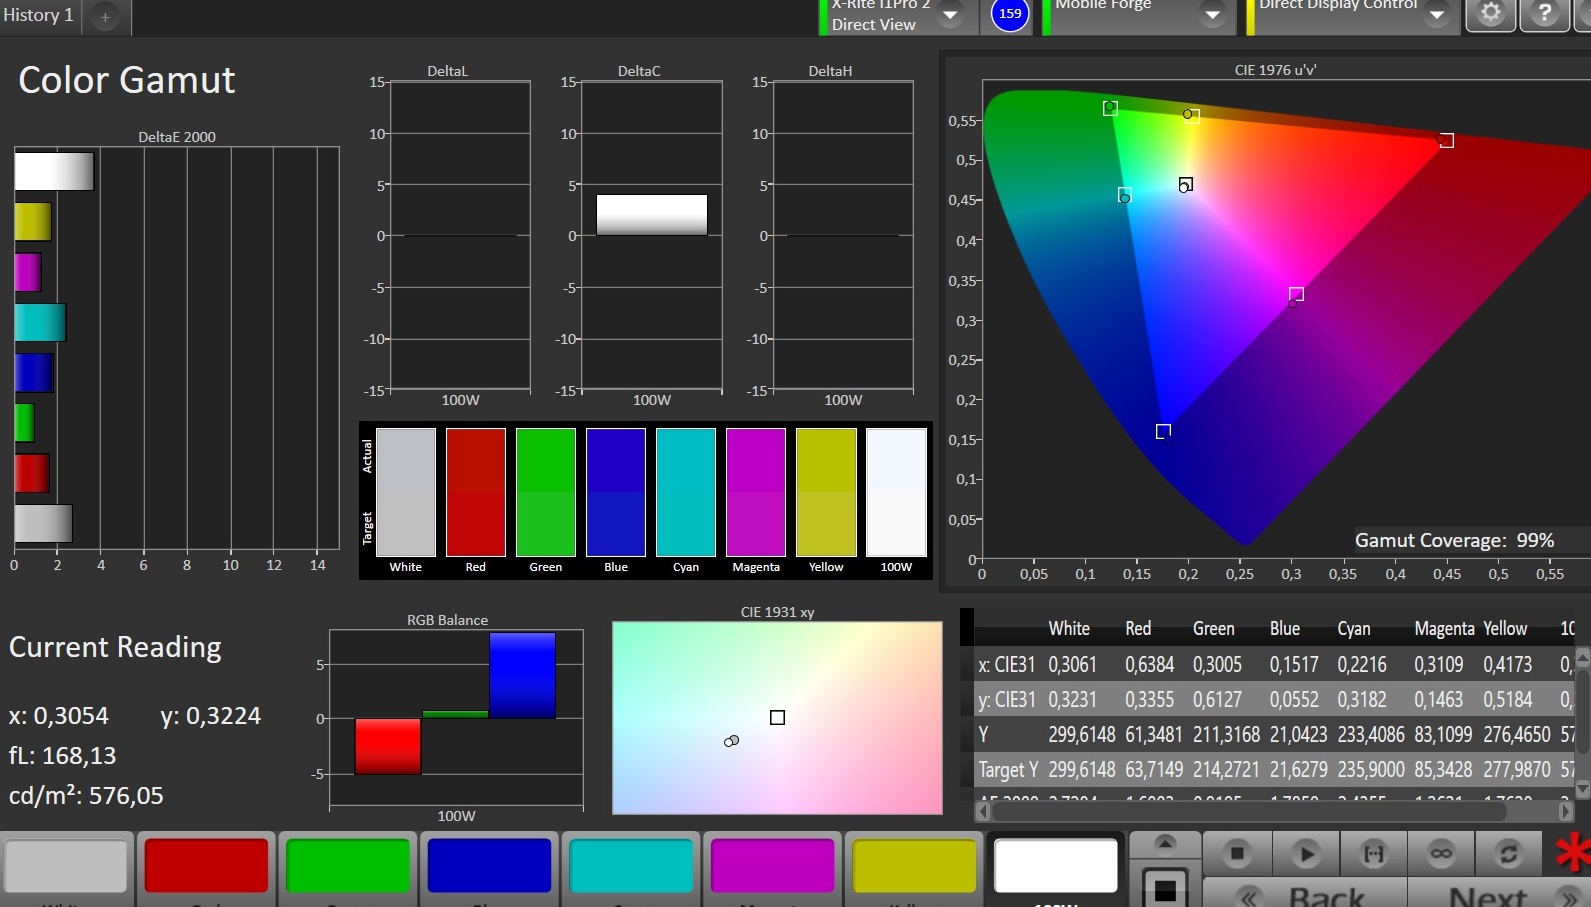
99% sRGB (Calman 2D)
Gamma: 2.237
CCT: 6984 K
| Apple iPod Touch 2019 IPS, 1136x640, 4" | Apple iPhone 7 IPS, 1334x750, 4.7" | Apple iPhone XR IPS, 1792x828, 6.1" | Apple iPhone 8 IPS True Tone, 1334x750, 4.7" | Samsung Galaxy A40 Super AMOLED, 2340x1080, 5.9" | Nokia 4.2 IPS, 1520x720, 5.7" | |
|---|---|---|---|---|---|---|
| Screen | 26% | 33% | 26% | -101% | -49% | |
| Brightness middle (cd/m²) | 581 | 556 -4% | 672 16% | 604 4% | 358 -38% | 445 -23% |
| Brightness (cd/m²) | 559 | 519 -7% | 641 15% | 580 4% | 370 -34% | 424 -24% |
| Brightness Distribution (%) | 94 | 90 -4% | 92 -2% | 91 -3% | 94 0% | 91 -3% |
| Black Level * (cd/m²) | 0.64 | 0.34 47% | 0.35 45% | 0.44 31% | 0.26 59% | |
| Contrast (:1) | 908 | 1635 80% | 1920 111% | 1373 51% | 1712 89% | |
| Colorchecker dE 2000 * | 2.16 | 1.3 40% | 1.3 40% | 1.2 44% | 7.4 -243% | 5.9 -173% |
| Colorchecker dE 2000 max. * | 3.81 | 2.6 32% | 2.7 29% | 2.3 40% | 12.5 -228% | 9.3 -144% |
| Greyscale dE 2000 * | 2.5 | 1.9 24% | 2.2 12% | 1.6 36% | 4 -60% | 6.8 -172% |
| Gamma | 2.237 98% | 2.26 97% | 2.3 96% | 2.25 98% | 2.084 106% | 2.2 100% |
| CCT | 6984 93% | 6818 95% | 6868 95% | 6688 97% | 7078 92% | 8443 77% |
| Color Space (Percent of AdobeRGB 1998) (%) | 63.15 | |||||
| Color Space (Percent of sRGB) (%) | 99.71 |
* ... smaller is better
Screen Flickering / PWM (Pulse-Width Modulation)
| Screen flickering / PWM detected | 100 Hz | ≤ 20 % brightness setting | 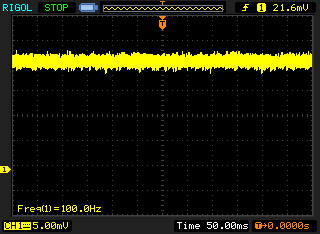 |
The display backlight flickers at 100 Hz (worst case, e.g., utilizing PWM) Flickering detected at a brightness setting of 20 % and below. There should be no flickering or PWM above this brightness setting. The frequency of 100 Hz is very low, so the flickering may cause eyestrain and headaches after extended use. In comparison: 52 % of all tested devices do not use PWM to dim the display. If PWM was detected, an average of 7798 (minimum: 5 - maximum: 343500) Hz was measured. | |||
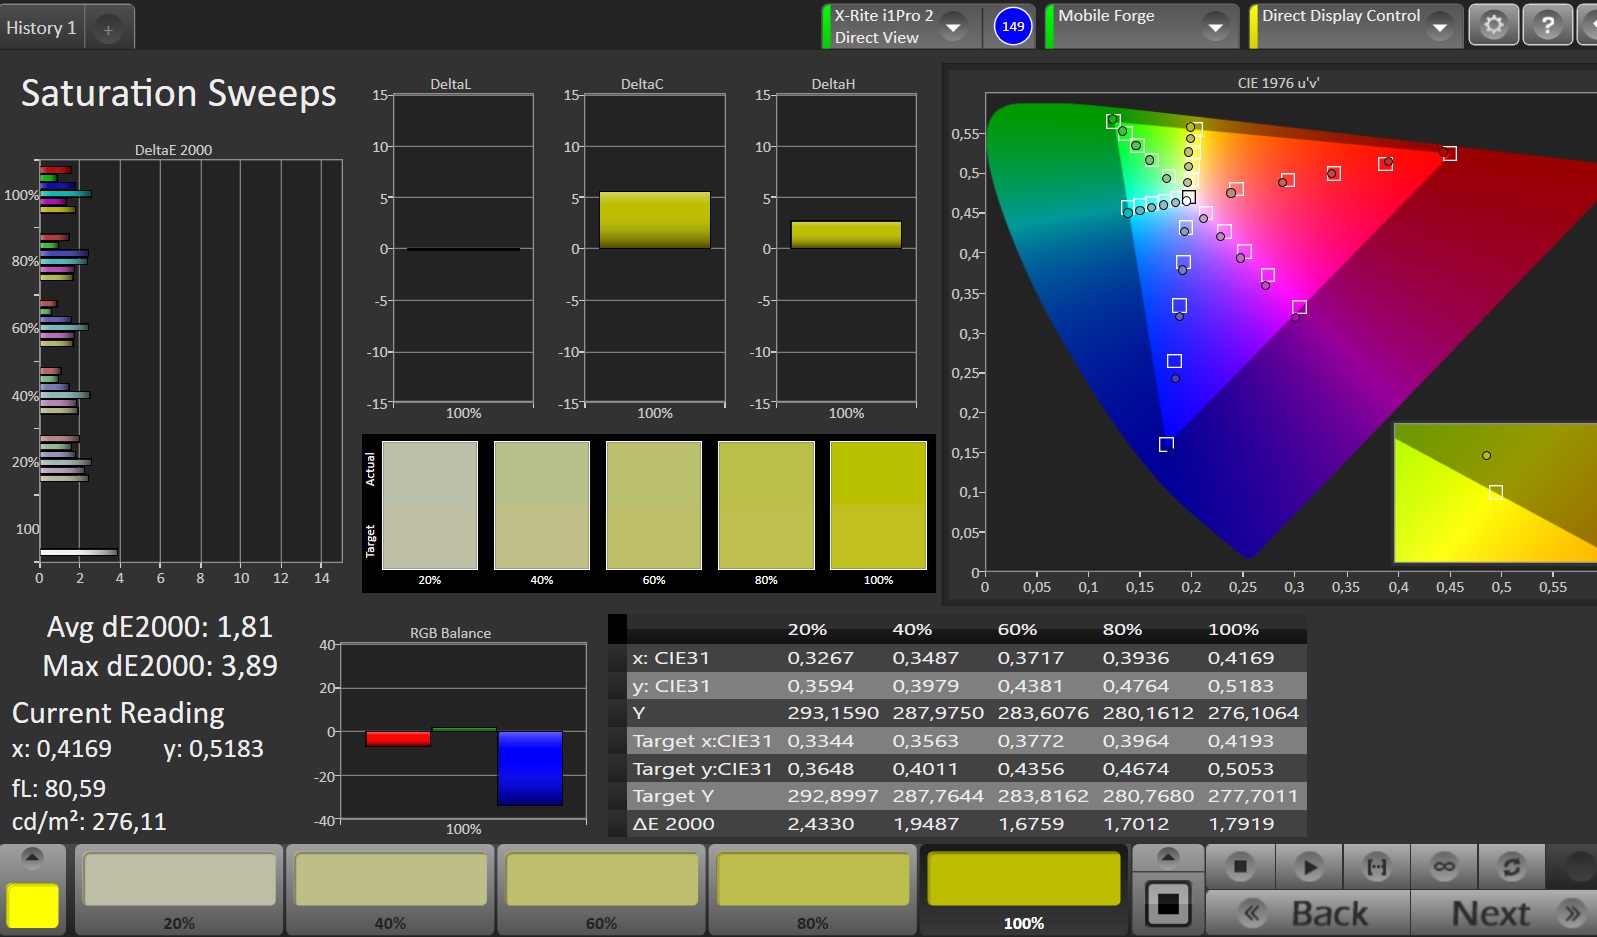
The display also has decent colour accuracy, although its black value is a touch high at 0.64 cd/m², which negatively impacts its contrast ratio too. Our review unit’s DeltaE deviations are impressive though, as is the display’s colour temperature. The former are close to ideal and much better than what the Galaxy A40 or Nokia 4.2 achieve.
Display Response Times
| ↔ Response Time Black to White | ||
|---|---|---|
| 24 ms ... rise ↗ and fall ↘ combined | ↗ 9 ms rise | 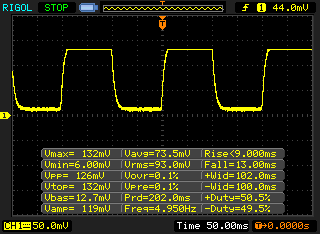 |
| ↘ 13 ms fall | ||
| The screen shows good response rates in our tests, but may be too slow for competitive gamers. In comparison, all tested devices range from 0.1 (minimum) to 240 (maximum) ms. » 54 % of all devices are better. This means that the measured response time is worse than the average of all tested devices (19.9 ms). | ||
| ↔ Response Time 50% Grey to 80% Grey | ||
| 46 ms ... rise ↗ and fall ↘ combined | ↗ 23 ms rise | 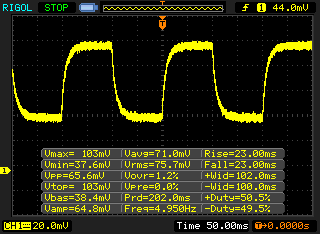 |
| ↘ 23 ms fall | ||
| The screen shows slow response rates in our tests and will be unsatisfactory for gamers. In comparison, all tested devices range from 0.165 (minimum) to 636 (maximum) ms. » 79 % of all devices are better. This means that the measured response time is worse than the average of all tested devices (31.1 ms). | ||
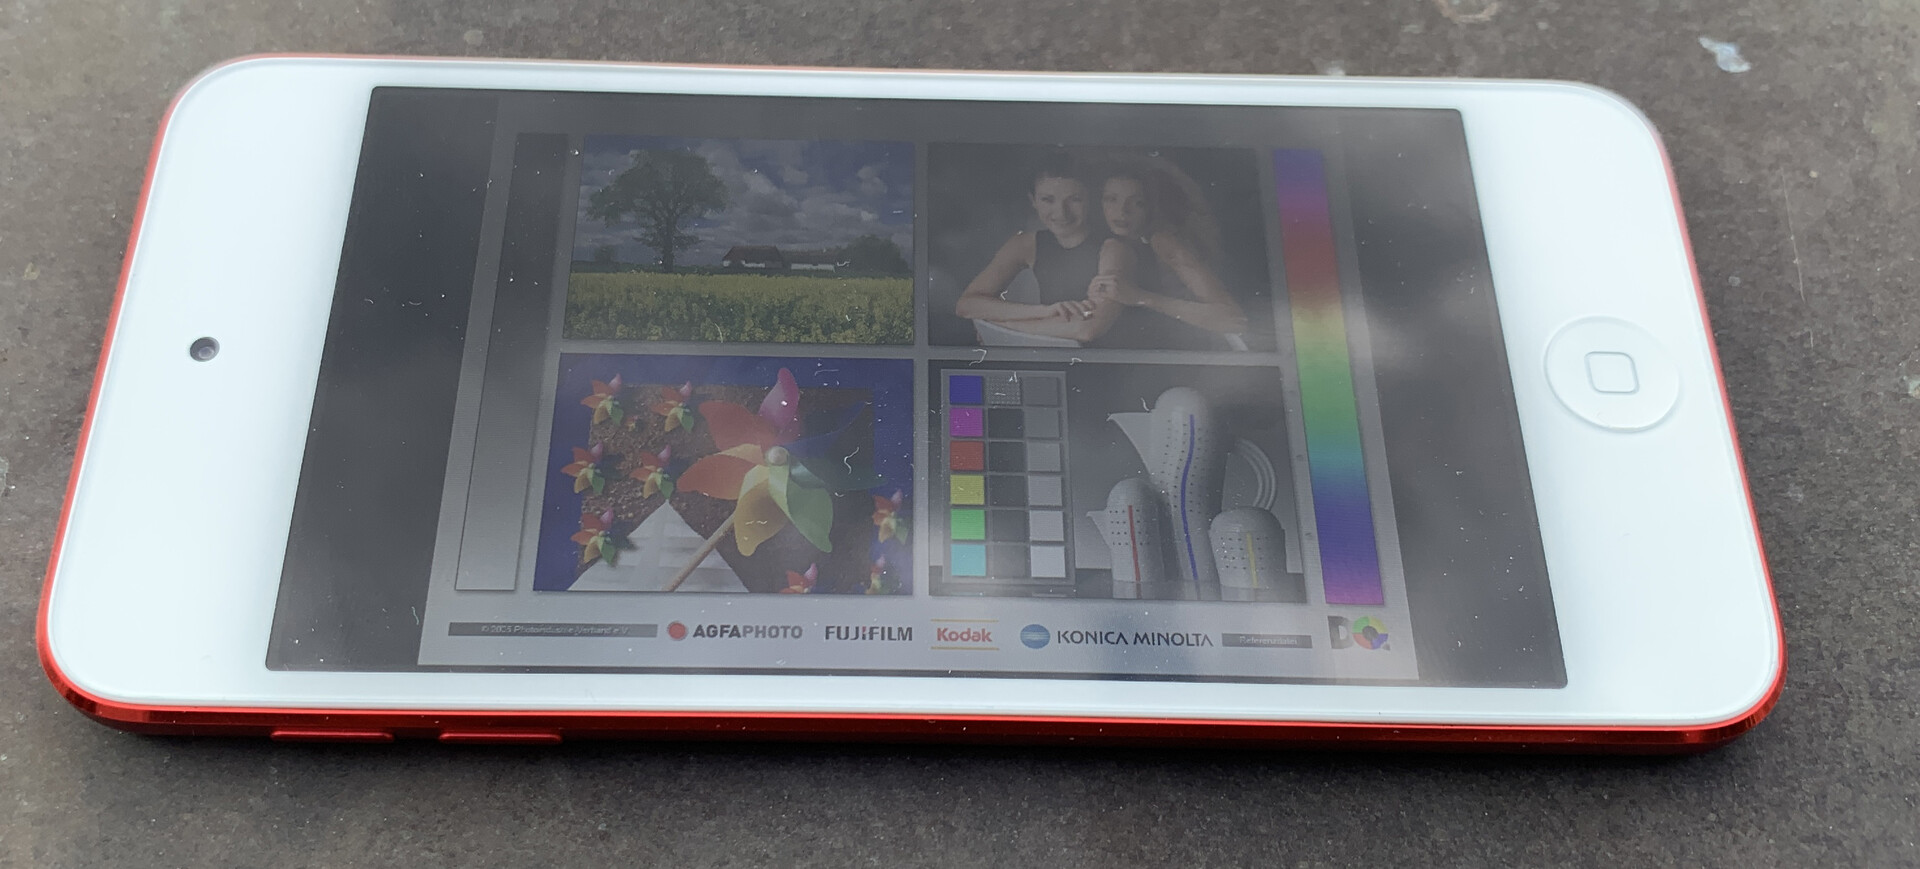
The iPod Touch 2019 has stable viewing angles and is easy to use outdoors. The display has a reflective glass finish that catches the light on sunny days, but its high maximum brightness means that it should remain readable even in bright sunlight.
Performance
Apple equips the iPod Touch 2019 with its in-house A10 Fusion SoC, a chipset we last saw in the iPhone 7. However, not all A10 Fusion SoCs are made equal, as Apple downclocks the one in the iPod Touch 2019 to 1.6 GHz. By contrast, the SoC in the iPhone 7 can reach up to 2.3 GHz, giving it a 30% performance advantage in synthetic benchmarks.
With that said, the iPod Touch 2019 consistently outperforms the Nokia 4.2 and Galaxy A40, underlining just how powerful the over two-year-old A10 Fusion is. The cheapest version of the iPod Touch is a bargain if one solely looks at performance.
| AnTuTu v7 - Total Score (sort by value) | |
| Apple iPod Touch 2019 | |
| Apple iPhone 7 | |
| Samsung Galaxy A40 | |
| Nokia 4.2 | |
| Average Apple A10 Fusion (160578 - 210596, n=4) | |
| Basemark ES 3.1 / Metal - offscreen Overall Score (sort by value) | |
| Apple iPod Touch 2019 | |
| Apple iPhone 7 | |
| Apple iPhone 7 | |
| Apple iPhone XR | |
| Samsung Galaxy A40 | |
| Nokia 4.2 | |
| Average Apple A10 Fusion (1059 - 1693, n=5) | |
| Average of class Smartphone (544 - 7731, n=24, last 2 years) | |
Our review unit performed well in browser benchmarks, although it falls well short of the iPhone 7 and its successors. Again, the iPod Touch 2019 holds its own against comparably priced Android smartphones.
| Jetstream 2 - 2.0 Total | |
| Average of class Smartphone (59.7 - 423, n=127, last 2 years) | |
| Average Apple A10 Fusion (54.2 - 76.2, n=2) | |
| Apple iPod Touch 2019 (Safari 12) | |
| Samsung Galaxy A40 (Chrome 73) | |
| Nokia 4.2 (Chrome 74) | |
| Octane V2 - Total Score | |
| Average of class Smartphone (2800 - 126661, n=157, last 2 years) | |
| Apple iPhone XR (Safari Mobile 12.0) | |
| Apple iPhone 8 | |
| Average Apple A10 Fusion (19783 - 27967, n=5) | |
| Apple iPhone 7 (Safari Mobile 10.0) | |
| Apple iPod Touch 2019 (Safari 12) | |
| Samsung Galaxy A40 (Chrome 73) | |
| Nokia 4.2 (Chrome 74) | |
| Mozilla Kraken 1.1 - Total | |
| Nokia 4.2 (Chrome 74) | |
| Samsung Galaxy A40 (Chrome 73) | |
| Apple iPod Touch 2019 (Safari 12) | |
| Average Apple A10 Fusion (1026 - 1531, n=5) | |
| Apple iPhone 7 (Safari Mobile 10.0) | |
| Average of class Smartphone (257 - 28190, n=135, last 2 years) | |
| Apple iPhone 8 | |
| Apple iPhone XR (Safari Mobile 12.0) | |
* ... smaller is better
Unfortunately, we were unable to objectively assess the speed of our review unit’s internal storage. All our usual benchmarks proved incompatible for some reason, but subjectively the device always handled tasks well and loaded apps without delay. We never experienced any lags or slowdowns either.
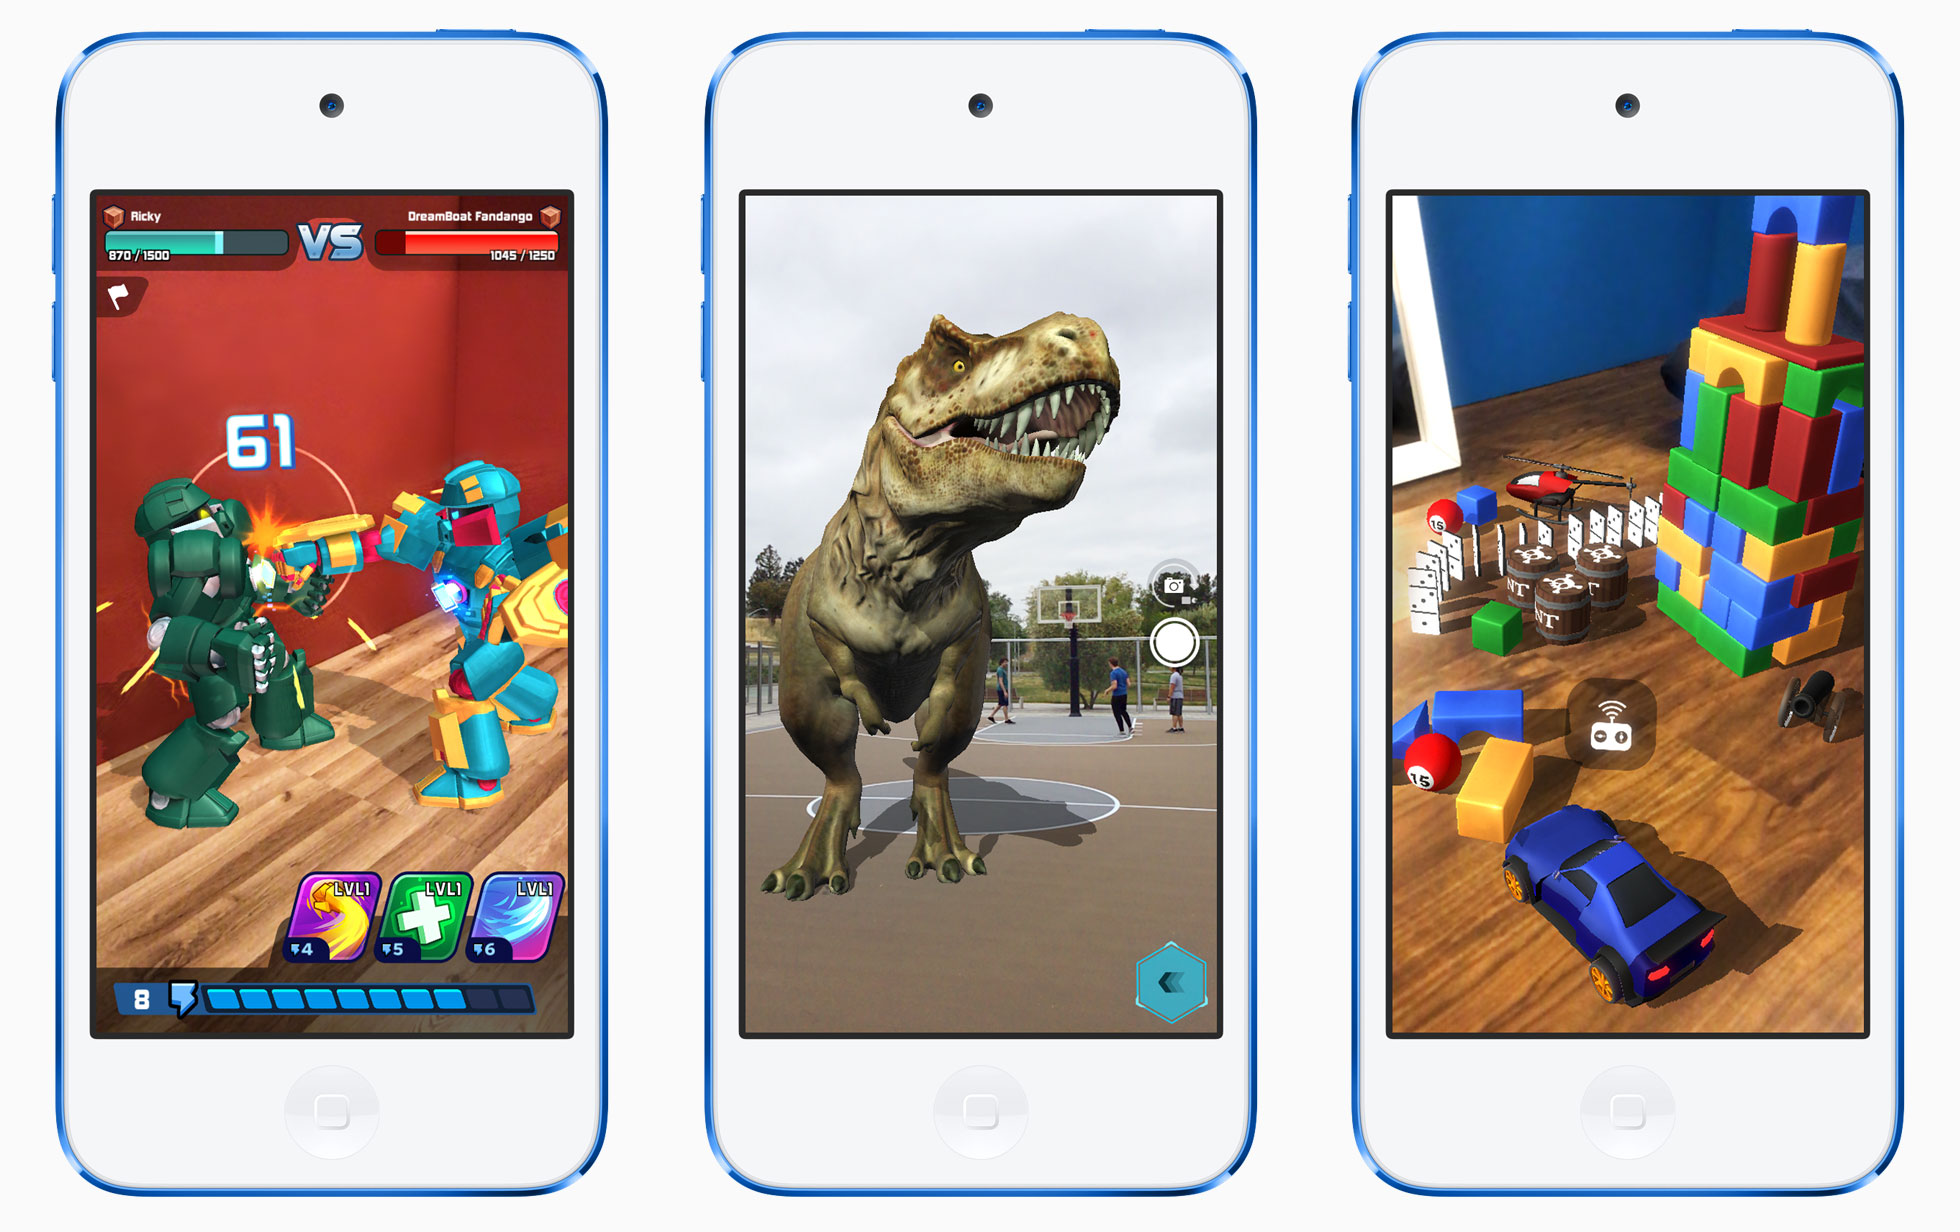
Games
The A10 Fusion GPU still proved competent in our gaming tests, with the iPod Touch 2019 averaging around 30 FPS in Asphalt 9: Legends and Arena of Valor. The small display can make some small in-game objects difficult to spot if you are acclimatised to using a modern smartphone, with our review unit feeling cramped in our hands. People with large hands may struggle to see the display through their fingers too.
The touchscreen and associated sensors worked well during our Temple Run 2 tests. The former offers too much resistance for our tastes, but this is only a minor gripe. Overall, the iPod Touch 2019 is a surprisingly good mobile gaming device.


Emissions
Temperature
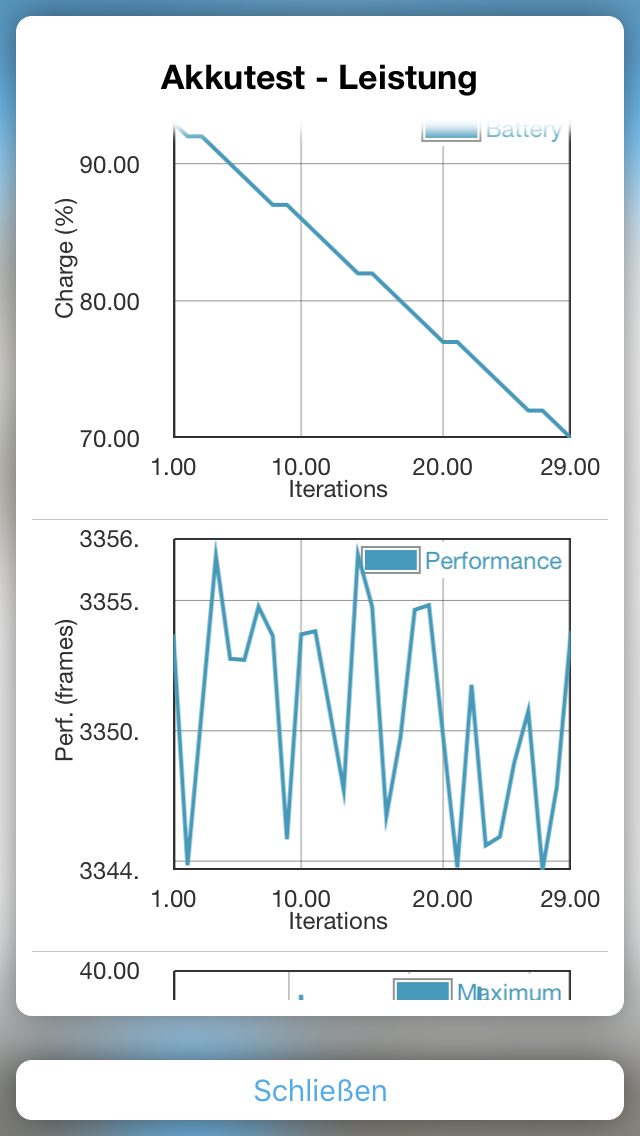
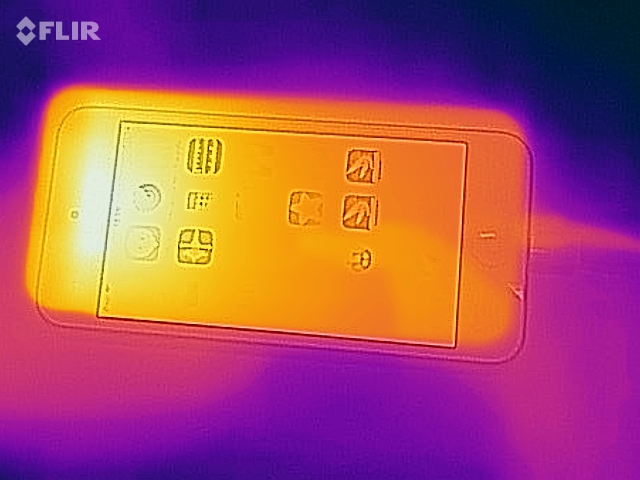
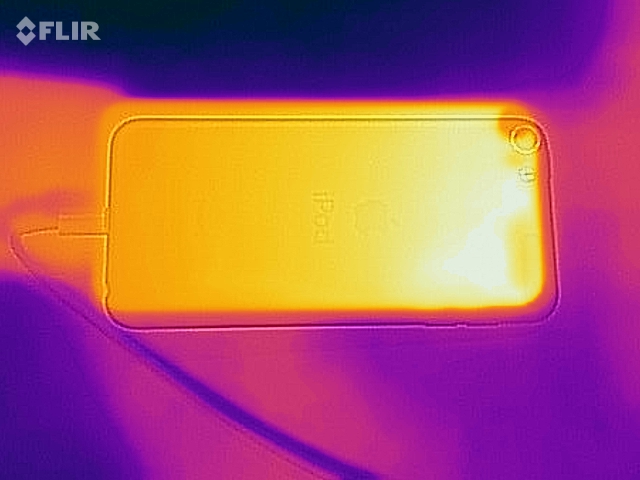
Most of our review unit runs coolly when idling, although the top third of the display averages around 35 °C, which is a touch hot. The same area exceeds 45°C under load with two areas exceeding 48 °C, temperatures we would typically expect from a gaming laptop and not a multimedia player. This makes the iPod Touch 2019 uncomfortable to hold during prolonged gaming sessions or when using resource-heavy apps.
You should not experience these surface temperatures while playing videos or listening to music though. Likewise, GFXBench battery tests demonstrate that the SoC does not throttle even under sustained load.
(-) The maximum temperature on the upper side is 48.4 °C / 119 F, compared to the average of 35.3 °C / 96 F, ranging from 21.9 to 247 °C for the class Smartphone.
(±) The bottom heats up to a maximum of 44.7 °C / 112 F, compared to the average of 34 °C / 93 F
(+) In idle usage, the average temperature for the upper side is 31.7 °C / 89 F, compared to the device average of 32.9 °C / 91 F.
Speakers
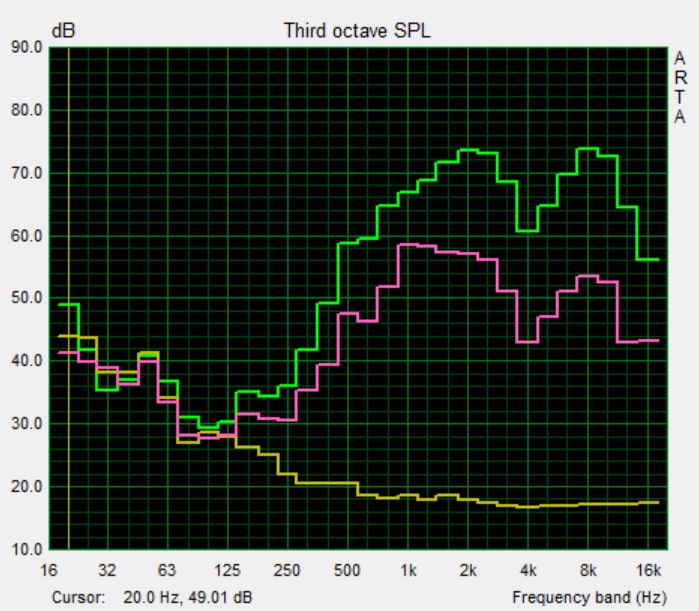
The iPod Touch 2019 has a mono speaker, which gets surprisingly loud. The one in our review unit reached a maximum of 81.8 dB(A) in our tests, although it sounds a little thin. The speaker in the iPhone 7, for example, does a better job at reproducing bass tones than the one in the iPod Touch 2019 can, but the latter’s speaker is still listenable. It is not enjoyable to our ears, but it is good enough for occasional use.
Ultimately, external audio equipment will deliver a better listening experience than the mono speaker ever could. The iPod Touch 2019 has a 3.5 mm jack, a Lightning port and Bluetooth for connecting headphones or speakers, all of which worked perfectly during our tests.
Apple iPod Touch 2019 audio analysis
(±) | speaker loudness is average but good (81.8 dB)
Bass 100 - 315 Hz
(-) | nearly no bass - on average 64.9% lower than median
(+) | bass is linear (0% delta to prev. frequency)
Mids 400 - 2000 Hz
(-) | nearly no mids - on average 64.9% lower than median
(+) | mids are linear (0% delta to prev. frequency)
Highs 2 - 16 kHz
(-) | nearly no highs - on average 64.9% lower than median
(+) | highs are linear (0% delta to prev. frequency)
Overall 100 - 16.000 Hz
(-) | overall sound is not linear (131.6% difference to median)
Compared to same class
» 99% of all tested devices in this class were better, 1% similar, 0% worse
» The best had a delta of 11%, average was 34%, worst was 134%
Compared to all devices tested
» 100% of all tested devices were better, 0% similar, 0% worse
» The best had a delta of 4%, average was 24%, worst was 134%
Apple iPhone 7 audio analysis
(+) | speakers can play relatively loud (83.1 dB)
Bass 100 - 315 Hz
(-) | nearly no bass - on average 21.8% lower than median
(±) | linearity of bass is average (9.5% delta to prev. frequency)
Mids 400 - 2000 Hz
(+) | balanced mids - only 4.3% away from median
(+) | mids are linear (6% delta to prev. frequency)
Highs 2 - 16 kHz
(±) | higher highs - on average 5.9% higher than median
(±) | linearity of highs is average (8.2% delta to prev. frequency)
Overall 100 - 16.000 Hz
(±) | linearity of overall sound is average (20.9% difference to median)
Compared to same class
» 39% of all tested devices in this class were better, 8% similar, 53% worse
» The best had a delta of 11%, average was 34%, worst was 134%
Compared to all devices tested
» 57% of all tested devices were better, 8% similar, 36% worse
» The best had a delta of 4%, average was 24%, worst was 134%
Power Management
Power Consumption
The iPod Touch 2019 is a comparatively economic device with its down-clocked A10 Fusion SoC consuming around 20% less than it does in the iPhone 7. None of our comparison devices hold a candle to the iPod Touch 2019 here, with Android smartphones like the Nokia 4.2 and Galaxy A40 averaging 38% and 79% higher power consumption than our review unit.
| Off / Standby | |
| Idle | |
| Load |
|
Key:
min: | |
| Apple iPod Touch 2019 1043 mAh | Apple iPhone 7 1960 mAh | Apple iPhone XR 2942 mAh | Apple iPhone 8 1821 mAh | Samsung Galaxy A40 3100 mAh | Nokia 4.2 3000 mAh | Average Apple A10 Fusion | Average of class Smartphone | |
|---|---|---|---|---|---|---|---|---|
| Power Consumption | -20% | -74% | -27% | -79% | -38% | -175% | -76% | |
| Idle Minimum * (Watt) | 0.7 | 0.54 23% | 0.61 13% | 0.54 23% | 0.8 -14% | 0.74 -6% | 1.282 ? -83% | 0.875 ? -25% |
| Idle Average * (Watt) | 0.9 | 1.51 -68% | 2.67 -197% | 1.63 -81% | 1.4 -56% | 1.9 -111% | 3.79 ? -321% | 1.47 ? -63% |
| Idle Maximum * (Watt) | 1.2 | 1.54 -28% | 2.69 -124% | 1.67 -39% | 2.3 -92% | 2.21 -84% | 4.22 ? -252% | 1.659 ? -38% |
| Load Average * (Watt) | 2.6 | 3.75 -44% | 4.34 -67% | 2.74 -5% | 7.4 -185% | 3.04 -17% | 6.99 ? -169% | 6.8 ? -162% |
| Load Maximum * (Watt) | 5.9 | 5.01 15% | 5.66 4% | 7.78 -32% | 8.6 -46% | 4.15 30% | 8.97 ? -52% | 11.3 ? -92% |
* ... smaller is better
Battery Life
Apple promises that the iPod Touch 2019 can get up to 40 hours of music playback and 8 hours of video playback from its tiny 1,043 mAh battery. These estimates usually do not reflect real-world usage, but our review unit achieved a runtime of 8:04 hours in our practical Wi-Fi battery life, so 8 hours of video playback is plausible. We conduct this test by running a script that simulates the load required to render websites while leaving the display at 150 cd/m².
Apple’s decision to throttle the SoC is a blessing for battery life, with the iPod Touch 2019 needing recharging just 33 minutes sooner than the iPhone 7 despite having almost a 50% smaller battery. None of our other comparison devices come close to the iPod Touch here.
Our review unit takes a few hours to charge, for reference. Unfortunately, it does not support quick charging like newer iPhones and Android smartphones do.
| Apple iPod Touch 2019 1043 mAh | Apple iPhone 7 1960 mAh | Apple iPhone XR 2942 mAh | Samsung Galaxy A40 3100 mAh | Nokia 4.2 3000 mAh | |
|---|---|---|---|---|---|
| Battery runtime | 6% | 88% | 32% | 43% | |
| WiFi v1.3 (h) | 8.1 | 8.6 6% | 15.2 88% | 10.7 32% | 11.6 43% |
| Reader / Idle (h) | 29.5 | 49.5 | 28.2 | ||
| H.264 (h) | 12 | 16.9 | 13.8 | ||
| Load (h) | 2.1 | 4.5 | 4.6 |
Pros
Cons
Verdict
The iPod Touch is much more than just a music player. Its Wi-Fi connectivity and App Store support make it almost as flexible in many areas as an iPhone or another smartphone. You can check emails, stream movies, take decent photos and download the latest apps or games, which suits some people perfectly.
Of course, the iPod Touch has no LTE modem, which restricts it to connecting to just Wi-Fi networks. Likewise, it has no earpiece, so it cannot make VoIP calls unless you have headphones with an inline microphone connected. The former may not be any issue for many people, as most streaming services let you download content in advance. It is frustrating that services like WhatsApp will not work as you need a mobile phone number.
More than just music: The Apple iPod Touch 2019 (7th generation) is a flexible device but only for people who prefer small devices and do not need mobile connectivity.
The iPod Touch has other drawbacks too. Its small touchscreen does not respond well with big fingers, while the inclusion of just a home button and no gesture controls feels outdated after having used modern iPhones, iPads or Android devices. Moreover, we are not fans of Apple charging up to US$200 more for additional storage.
The US$399 256 GB model offers poor value for money in our opinion with the US$299 128 GB model being a hard sell too. However, the US$199 32 GB model could be a good choice for some people, with it running an up-to-date version of iOS and having more power than many comparably priced Android smartphones. The device even handles gaming well and achieved decent runtimes in our battery life tests. Overall, the iPod Touch 2019 7th generation would be well suited for someone who prefers small devices and can overlook its several shortcomings.
Price comparison

