Notebookcheck Logo

AMD A10-9620P vs Intel Core i5-7500T

AMD A10-9620P

► remove from comparison AMD A10-9620P

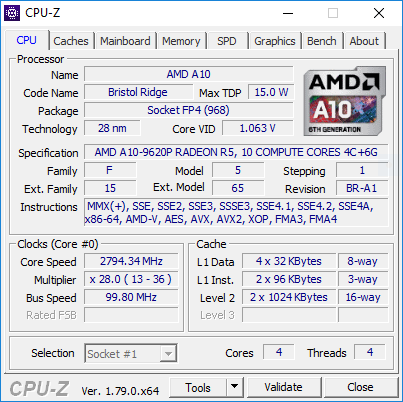
The AMD A10-9620P is a mid-range APU of the Bristol Ridge series (7th generation of APUs) with 4 CPU-cores (two Excavator modules) clocked at 2.5 - 3.4 GHz. In our tests the A10-9620P even hit 3.6 GHz.

It was announced in 2017 and is based on the same silicon as Carrizo but with more and refined features. It is a ULV-chip with a TDP of 15 Watt and integrates a Radeon R5 graphics card (384 shader cores / 6 compute cores) and a dual-channel DDR4-18600 memory controller. As Carrizo its a full featured SoC that offers all I/O ports on the chip.

The A10-9620P is a bit faster than the old 15-Watt top model of Carrizo, the FX-8800P. See our Bristol Ridge article for more information on the architecture and improvements compared to Carrizo.

Intel Core i5-7500T

► remove from comparison Intel i5-7500T

The Intel Core i5-7500T is a power efficient desktop quad-core based on the Kaby Lake architecture. It was announced early 2017 and offers four cores and no HyperThreading (only 4 threads). The CPU clocks between 2.7 and 3.3 GHz. The integrated Intel HD Graphics 630 graphics card offers 24 EUs clocked at 350 to 1100 MHz. The TDP is specified at only 35 Watt and therefore even lower than mobile HQ quad cores (45 Watt). Thats why the CPU is also used in some laptops.

ModelAMD A10-9620PIntel Core i5-7500T
SeriesAMD Bristol RidgeIntel Kaby Lake
CodenameBristol RidgeKaby Lake
Series: Kaby Lake Kaby Lake
AMD FX-9830P compare3 - 3.7 GHz4 / 4 cores
AMD PRO A12-9830B compare3 - 3.7 GHz4 / 4 cores
AMD FX-9800P compare2.7 - 3.6 GHz4 / 4 cores
AMD PRO A12-9800B compare2.7 - 3.6 GHz4 / 4 cores
AMD A12-9720P compare2.7 - 3.6 GHz4 / 4 cores
AMD A12-9700P compare2.5 - 3.4 GHz4 / 4 cores
AMD A10-9620P « 2.5 - 3.4 GHz4 / 4 cores
AMD A10-9600P compare2.4 - 3.3 GHz4 / 4 cores
AMD PRO A8-9600B compare2.4 - 3.3 GHz4 / 4 cores
Intel Core i7-7700K compare4.2 - 4.5 GHz4 / 8 cores8 MB L3
Intel Core i7-7700 compare3.6 - 4.2 GHz4 / 8 cores8 MB L3
Intel Xeon E3-1535M v6 compare3.1 - 4.2 GHz4 / 8 cores8 MB L3
Intel Core i7-7920HQ compare3.1 - 4.1 GHz4 / 8 cores8 MB L3
Intel Core i7-7700T compare2.9 - 3.8 GHz4 / 8 cores8 MB L3
Intel Core i5-7600K compare3.8 - 4.2 GHz4 / 4 cores8 MB L3
Intel Xeon E3-1505M v6 compare3 - 4 GHz4 / 8 cores8 MB L3
Intel Core i7-7820HQ compare2.9 - 3.9 GHz4 / 8 cores8 MB L3
Intel Core i7-7820HK compare2.9 - 3.9 GHz4 / 8 cores8 MB L3
Intel Core i7-7700HQ compare2.8 - 3.8 GHz4 / 8 cores6 MB L3
Intel Core i5-7500 compare3.4 - 3.8 GHz4 / 4 cores6 MB L3
Intel Core i5-7440HQ compare2.8 - 3.8 GHz4 / 4 cores6 MB L3
Intel Core i7-7567U compare3.5 - 4 GHz2 / 4 cores4 MB L3
Intel Core i7-7660U compare2.5 - 4 GHz2 / 4 cores4 MB L3
Intel Core i7-7600U compare2.8 - 3.9 GHz2 / 4 cores4 MB L3
Intel Core i5-7300HQ compare2.5 - 3.5 GHz4 / 4 cores6 MB L3
Intel Core i5-7500T « 2.7 - 3.3 GHz4 / 4 cores6 MB L3
Intel Core i5-7287U compare3.3 - 3.7 GHz2 / 4 cores4 MB L3
Intel Core i7-7560U compare2.4 - 3.8 GHz2 / 4 cores4 MB L3
Intel Core i5-7267U compare3.1 - 3.5 GHz2 / 4 cores4 MB L3
Intel Core i5-7360U compare2.3 - 3.6 GHz2 / 4 cores4 MB L3
Intel Core i7-7500U compare2.7 - 3.5 GHz2 / 4 cores4 MB L3
Intel Core i5-7300U compare2.6 - 3.5 GHz2 / 4 cores3 MB L3
Intel Core i5-7260U compare2.2 - 3.4 GHz2 / 4 cores4 MB L3
Intel Core i5-7200U compare2.5 - 3.1 GHz2 / 4 cores3 MB L3
Intel Core i3-7100H compare3 GHz2 / 4 cores3 MB L3
Intel Core i3-7167U compare2.8 GHz2 / 4 cores3 MB L3
Intel Core i7-7Y75 compare1.3 - 3.6 GHz2 / 4 cores4 MB L3
Intel Core i5-7Y57 compare1.2 - 3.3 GHz2 / 4 cores4 MB L3
Intel Core i5-7Y54 compare1.2 - 3.2 GHz2 / 4 cores4 MB L3
Intel Core i3-7100U compare2.4 GHz2 / 4 cores3 MB L3
Intel Core m3-7Y32 compare1 - 3 GHz2 / 4 cores4 MB L3
Intel Pentium Gold 4415U compare2.3 GHz2 / 4 cores2 MB L3
Intel Core m3-7Y30 compare1 - 2.6 GHz2 / 4 cores4 MB L3
Intel Celeron 3965U compare2.2 GHz2 / 2 cores2 MB L3
Intel Core i3-7020U compare2.3 GHz2 / 4 cores3 MB L3
Intel Celeron 3867U compare1.8 GHz2 / 2 cores2 MB L3
Intel Celeron 3865U compare1.8 GHz2 / 2 cores2 MB L3
Intel Pentium Gold 4425Y compare1.7 GHz2 / 4 cores2 MB L3
Intel Pentium Gold 4415Y compare1.6 GHz2 / 4 cores2 MB L3
Intel Pentium Gold 4410Y compare1.5 GHz2 / 4 cores2 MB L3
Intel Celeron 3965Y compare1.5 GHz2 / 2 cores2 MB L3
Clock2500 - 3400 MHz2700 - 3300 MHz
L2 Cache2 MB1 MB
Cores / Threads4 / 44 / 4
TDP15 Watt35 Watt
Transistors3100 Million
Technology28 nm14 nm
Die Size250 mm2
max. Temp.90 °C
SocketFP4FCLGA1151
FeaturesDual-Channel DDR3/DDR4-1866 Memory Controller, PCIe 3.0 x8DDR3(L)-1600/DDR4-2400 Memory Controller, AVX, AVX2, AES-NI, TSX-NI, Quick Sync, Virtualization, vPro
iGPUAMD Radeon R5 (Bristol Ridge) ( - 758 MHz)Intel HD Graphics 630 (350 - 1100 MHz)
Architecturex86x86
Announced
L1 Cache256 KB
L3 Cache6 MB
$202 U.S.
Manufacturerark.intel.com

Benchmarks

Cinebench R15 - Cinebench R15 CPU Multi 64 Bit
230 Points (1%)
512 Points (3%)
Cinebench R15 - Cinebench R15 CPU Single 64 Bit
72 Points (22%)
129 Points (39%)
Cinebench R11.5 - Cinebench R11.5 CPU Multi 64 Bit
2.7 Points (3%)
5.9 Points (8%)
Cinebench R11.5 - Cinebench R11.5 CPU Single 64 Bit
0.8 Points (20%)
1.5 Points (37%)
Cinebench R10 - Cinebench R10 Rend. Single (32bit)
2277 Points (14%)
5002 Points (30%)
Cinebench R10 - Cinebench R10 Rend. Multi (32bit)
7420 Points (5%)
13614 Points (10%)
wPrime 2.10 - wPrime 2.0 1024m *
470.9 s (6%)
333.2 s (4%)
wPrime 2.10 - wPrime 2.0 32m *
14.4 s (3%)
10.5 s (2%)
WinRAR - WinRAR 4.0
1329 Points (2%)
X264 HD Benchmark 4.0 - x264 Pass 2
16.3 fps (6%)
X264 HD Benchmark 4.0 - x264 Pass 1
76.6 fps (18%)
TrueCrypt - TrueCrypt Serpent
0.3 GB/s (0%)
TrueCrypt - TrueCrypt Twofish
0.4 GB/s (8%)
TrueCrypt - TrueCrypt AES
2.7 GB/s (7%)
Super Pi mod 1.5 XS 1M - Super Pi mod 1.5 XS 1M *
18.2 s (4%)
12 s (3%)
Super Pi mod 1.5 XS 2M - Super Pi mod 1.5 XS 2M *
40.3 s (2%)
26.6 s (1%)
Super Pi Mod 1.5 XS 32M - Super Pi mod 1.5 XS 32M *
977 s (4%)
629 s (3%)
3DMark 11 - 3DM11 Performance Physics
2399 Points (6%)
6740 Points (18%)
3DMark - 3DMark Ice Storm Physics
22553 Points (18%)
33605 Points (27%)
3DMark - 3DMark Ice Storm Extreme Physics
24032 Points (19%)
50218 Points (41%)
3DMark - 3DMark Ice Storm Unlimited Physics
51843 Points (44%)
3DMark - 3DMark Cloud Gate Physics
2338 Points (6%)
4748 Points (12%)
3DMark - 3DMark Fire Strike Standard Physics
3175 Points (6%)
6773 Points (12%)
Sunspider - Sunspider 1.0 Total Score *
83.2 ms (1%)

Average Benchmarks AMD A10-9620P → 100% n=16

Average Benchmarks Intel Core i5-7500T → 173% n=16

- Range of benchmark values for this graphics card
- Average benchmark values for this graphics card
* Smaller numbers mean a higher performance
1 This benchmark is not used for the average calculation

Add one or more devices and compare

In the following list you can select (and also search for) devices that should be added to the comparison. You can select more than one device.

restrict list:

show all (including archived), 2024, 2023
v1.26
log 18. 00:01:07

#0 checking url part for id 9188 +0s ... 0s

#1 checking url part for id 9320 +0s ... 0s

#2 not redirecting to Ajax server +0s ... 0s

#3 did not recreate cache, as it is less than 5 days old! Created at Fri, 17 May 2024 11:21:47 +0200 +0.001s ... 0.001s

#4 composed specs +0.027s ... 0.028s

#5 did output specs +0s ... 0.028s

#6 getting avg benchmarks for device 9188 +0.003s ... 0.031s

#7 got single benchmarks 9188 +0.01s ... 0.041s

#8 getting avg benchmarks for device 9320 +0.003s ... 0.044s

#9 got single benchmarks 9320 +0.008s ... 0.052s

#10 got avg benchmarks for devices +0s ... 0.052s

#11 min, max, avg, median took s +0.138s ... 0.191s

#12 return log +0.022s ... 0.213s

Please share our article, every link counts!
> Expert Reviews and News on Laptops, Smartphones and Tech Innovations > Benchmarks / Tech > Processor Comparison - Head 2 Head
Redaktion, 2017-09- 8 (Update: 2023-07- 1)