


Schenker Key 14 review - 100 W RTX 4060 in a compact multimedia laptop
Small but powerful.
With the Key 14, Schenker has a compact 14-inch notebook in its range that features a pre-calibrated 120 Hz display and a choice of fast dedicated graphics cards from Nvidia. We tested the SKU built around the GeForce RTX 4060 Laptop with a TGP of 100 watts.Andreas Osthoff, 👁 Andreas Osthoff, ✓ Hariharan Gunasekaran (translated by DeepL / Ninh Duy) Published 🇩🇪 🇫🇷 ...
Verdict - Key 14 offers good performance and maintenance options, but there are also weak points
The Schenker Key 14 is a fast 14-inch multimedia laptop available with 100-watt variants of the GeForce RTX 4060 or alternatively RTX 4070. RAM is upgradeable here, supporting a maximum of 96 GB. Overall performance is good and remains stable even under continuous load, although the two fans can become quite loud during heavy use. In terms of connectivity, all essential standards are supported, including Thunderbolt 4, a Gigabit Ethernet port, and an optional Wi-Fi 7 module.
In many other aspects, however, the Key is fairly average. While its case is sturdy and well-made, the rough plastic frame around the display feels somewhat out of place. The keyboard is comfortable but could benefit from slightly more key travel, and the battery life isn’t setting new records any time soon. The 120 Hz flicker-free matte IPS display offers good overall image quality, but its brightness is lower than what the competition has to offer, reaching just over 300 nits.
In Germany, the Key 14 starts from €1,699 (~$1,780) with the RTX 4060, and there are lots of SKUs on offer as well as lots of upgrade options which is a clear plus point. As for other options, for €1,799 one can purchase an Asus Zephyrus G14 with the RTX 4060, which offers a better overall package but is limited to 16 GB of soldered RAM. Dell's XPS 14 lags behind with its slower RTX 4050 and limited connectivity options. The Asus TUF Gaming 14 stands out with its faster AMD processor but isn't entirely free of issues, either. These include soldered memory and high emissions.
Pros
Cons
Price and availability
In Germany, the Key 14 (M24) can be configured and ordered from Bestware starting from 1,699 euros.
Possible competitors in comparison
Image | Model / Review | Price | Weight | Height | Display |
|---|---|---|---|---|---|
1. 82.8% 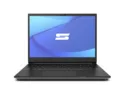 | SCHENKER Key 14 (M24) Intel Core Ultra 7 155H ⎘ NVIDIA GeForce RTX 4060 Laptop GPU ⎘ 32 GB Memory, 1024 GB SSD | Amazon: 1. $72.78 Onerbl AC-DC Adapter for Cha... 2. $68.99 PowerHOOD 20V AC/DC Adapter ... List Price: 1890€ | 1.7 kg | 19.9 mm | 14.00" 2880x1800 243 PPI IPS |
2. 80.3% 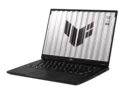 | Asus TUF Gaming A14 FA401WV-WB94 AMD Ryzen AI 9 HX 370 ⎘ NVIDIA GeForce RTX 4060 Laptop GPU ⎘ 16 GB Memory, 1024 GB SSD | Amazon: List Price: 1500 USD | 1.5 kg | 19.9 mm | 14.00" 2560x1600 216 PPI IPS |
3. 86.3% v7 (old)  | Dell XPS 14 2024 OLED Intel Core Ultra 7 155H ⎘ NVIDIA GeForce RTX 4050 Laptop GPU ⎘ 32 GB Memory, 1024 GB SSD | Amazon: $2,399.00 List Price: 2949€ | 1.8 kg | 19 mm | 14.50" 3200x2000 260 PPI OLED |
4. 93% v7 (old) 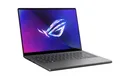 | Asus ROG Zephyrus G14 2024 GA403U AMD Ryzen 9 8945HS ⎘ NVIDIA GeForce RTX 4070 Laptop GPU ⎘ 32 GB Memory, 1024 GB SSD | Amazon: 1. $58.99 ANFRLE 180W AC Charger Compa... 2. $56.99 180W 20V 9A Adapter for Asus... 3. $59.99 180W AC Charger for Asus ROG... List Price: 2499€ | 1.5 kg | 16.3 mm | 14.00" 2880x1800 243 PPI OLED |
5. 80.3%  | Acer Nitro 14 AN14-41-R3MX AMD Ryzen 5 8645HS ⎘ NVIDIA GeForce RTX 4060 Laptop GPU ⎘ 16 GB Memory, 512 GB SSD | Amazon: $1,153.14 List Price: 1450 Euro | 2 kg | 22.84 mm | 14.50" 2560x1600 208 PPI IPS |
Table of Contents
The Key 14 from Schenker is a powerful multimedia laptop featuring an Intel Meteor Lake processor paired with a dedicated GeForce RTX 4060 Laptop or even an RTX 4070 Laptop GPU. The base model with the RTX 4060 starts at €1,699 and includes a high-resolution 120 Hz IPS display. Our test configuration, which has 32 GB of RAM, a 1 TB SSD, the optional Wi-Fi 7 module, and a three-year warranty, is priced at approximately €1,900. Additionally, we received the RTX 4070-toting variant to run some benchmarks and gaming tests on.
Specifications
Case and Connectivity
With its black and silver design, the Key 14 boasts a subtle and professional appearance that blends effortlessly into work environments. The lid and base (both made out of aluminum) are not fingerprint magnets, but the dark plastic palm rest that has a somewhat rubbery feel to it does require regular cleaning. The screen bezel is made out of rougher plastics, which gives it a slightly cheap appearance. Additionally, display bezels are relatively wide for a modern device (especially at the top and bottom). Both the build quality and stability are good, with minimal flexing on the top of the base unit and no creaking when attempting to twist it. The screen portion of the laptop is somewhat more flexible, though we were unable to cause any image distortions to appear. The hinges are well-tuned, offering sufficient resistance (better than the Vision 14), but the maximum opening angle is limited to just 130 degrees.
The bottom cover can be removed, providing access to fans, battery, M.2 2280 SSD, socketed WLAN module, and two RAM slots. This is a distinct advantage of the Schenker over many competitors, as it allows for seamless RAM upgrades to up to 96 GB. Our SKU is equipped with the optional Intel Wi-Fi 7 module that delivers significantly higher transfer rates than Wi-Fi 6 alternatives when paired with a compatible router. We recorded speeds ranging from 2.6 to 4.1 Gbit/s, a substantial improvement over the ~1.7 Gbit/s achieved over Wi-Fi 6. The Full HD webcam does its job and also supports facial recognition via Windows Hello.
The Key 14 excels in connectivity, offering all the essential standards including Thunderbolt 4, HDMI 2.1 and even a Gigabit Ethernet port—an increasingly rare feature in this size class. The distribution of ports is well thought out, and the Key also supports charging via USB-C at up to 100 watts.


Weighing 1.75 kg (3.85 pounds) and measuring just under 2 cm in height, the Key 14 positions itself in the middle of its comparison group. The included 180-watt power adapter tips the scales at 430 grams.


| SD Card Reader | |
| average JPG Copy Test (av. of 3 runs) | |
| Asus ROG Zephyrus G14 2024 GA403U (Angelbird AV Pro V60) | |
| Dell XPS 14 2024 OLED (Angelbird AV Pro V60) | |
| Average of class Multimedia (21.1 - 198, n=44, last 2 years) | |
| SCHENKER Key 14 (M24) (Angelbird AV Pro V60) | |
| Asus TUF Gaming A14 FA401WV-WB94 (Angelbird AV Pro V60) | |
| Acer Nitro 14 AN14-41-R3MX (AV PRO microSD 128 GB V60) | |
| maximum AS SSD Seq Read Test (1GB) | |
| Asus TUF Gaming A14 FA401WV-WB94 (Angelbird AV Pro V60) | |
| Dell XPS 14 2024 OLED (Angelbird AV Pro V60) | |
| Asus ROG Zephyrus G14 2024 GA403U (Angelbird AV Pro V60) | |
| Average of class Multimedia (27.4 - 262, n=44, last 2 years) | |
| SCHENKER Key 14 (M24) (Angelbird AV Pro V60) | |
| Acer Nitro 14 AN14-41-R3MX (AV PRO microSD 128 GB V60) | |
| Networking | |
| SCHENKER Key 14 (M24) | |
| iperf3 transmit AXE11000 | |
| iperf3 receive AXE11000 | |
| iperf3 transmit GT-BE19000 WiFi7 | |
| iperf3 receive GT-BE19000 WiFi7 | |
| Asus TUF Gaming A14 FA401WV-WB94 | |
| iperf3 transmit AXE11000 | |
| iperf3 receive AXE11000 | |
| iperf3 transmit AXE11000 6GHz | |
| iperf3 receive AXE11000 6GHz | |
| Dell XPS 14 2024 OLED | |
| iperf3 transmit AXE11000 | |
| iperf3 receive AXE11000 | |
| Asus ROG Zephyrus G14 2024 GA403U | |
| iperf3 transmit AXE11000 | |
| iperf3 receive AXE11000 | |
| Acer Nitro 14 AN14-41-R3MX | |
| iperf3 transmit AXE11000 | |
| iperf3 receive AXE11000 | |
| iperf3 transmit AXE11000 6GHz | |
| iperf3 receive AXE11000 6GHz | |

 NVIDIA GeForce RTX 4060 Laptop GPU, Ultra 7 155H, Samsung 990 Pro 1 TB")
 NVIDIA GeForce RTX 4060 Laptop GPU, Ultra 7 155H, Samsung 990 Pro 1 TB")
Sustainability
Schenker Technologies does not provide CO² footprint information for the Key 14. The packaging mainly consists of recyclable materials which is a plus.
Input devices - Comfortable keyboard
The black color keyboard features white backlighting and relatively small 15 x 15 mm keys with generous spacing between them. While the key travel is fairly limited, the keyboard is comfortable to use overall thanks to how precise and relatively quiet keystrokes tend to be. The small arrow keys may take some getting used to. The dedicated Page Up and Page Down keys are a helpful addition.
The laptop's clickpad is sufficiently large at 12.1 x 7.3 cm and complies with Microsoft's Precision standard. It offers good gliding properties and works just fine in day-to-day use. The lower area of the pad can be clicked mechanically, which produces a rather loud noise.


Display - IPS with 120 Hz and calibration


The matte 14-inch IPS display delivers sharp images thanks to its high resolution of 2,880 x 1,800 pixels (16:10 aspect ratio). Its color reproduction is totally acceptable, despite the lack of the brilliance that OLED panels have. There is no PWM flickering here, either.
Bright areas appear slightly grainy upon closer inspection which isn't really noticeable in everyday use. The 120 Hz refresh rate enables fluid motion, and response times are good, too. Slight halos can be seen at the edges when the screen is displaying a dark image. There are no issues with viewing angle stability.
The manufacturer specifies a brightness of 300 cd/m², which our test device's panel actually exceeds with an average of 317 cd/m². Its black level is very low, resulting in a high maximum contrast ratio. Indoors, the decent brightness combined with matte surface allows one to interact with the display effortlessly; however, the competition offers higher brightness levels. The Key would be a lot more suitable for outdoor use if it had a brighter screen.
| |||||||||||||||||||||||||
Brightness Distribution: 94 %
Center on Battery: 325 cd/m²
Contrast: 2708:1 (Black: 0.12 cd/m²)
ΔE ColorChecker Calman: 1.8 | ∀{0.5-29.43 Ø4.81}
calibrated: 1.4
ΔE Greyscale Calman: 2.5 | ∀{0.09-98 Ø5.1}
72.4% AdobeRGB 1998 (Argyll 3D)
97.4% sRGB (Argyll 3D)
70.3% Display P3 (Argyll 3D)
Gamma: 2.15
CCT: 7017 K
| SCHENKER Key 14 (M24) TL140ADXP24-0, IPS, 2880x1800, 14", 120 Hz | Asus TUF Gaming A14 FA401WV-WB94 BOE NE140QDM-NX7, IPS, 2560x1600, 14", 165 Hz | Dell XPS 14 2024 OLED SDC41A2, OLED, 3200x2000, 14.5", 120 Hz | Asus ROG Zephyrus G14 2024 GA403U ATNA40CU05-0, OLED, 2880x1800, 14", 120 Hz | Acer Nitro 14 AN14-41-R3MX AU Optronics B145QAN01.J, IPS, 2560x1600, 14.5", 120 Hz | |
|---|---|---|---|---|---|
| Display | -6% | 21% | 23% | 2% | |
| Display P3 Coverage (%) | 70.3 | 65.1 -7% | 98.5 40% | 99.6 42% | 72.7 3% |
| sRGB Coverage (%) | 97.4 | 94 -3% | 100 3% | 100 3% | 97.6 0% |
| AdobeRGB 1998 Coverage (%) | 72.4 | 65.6 -9% | 87.2 20% | 89.9 24% | 74.7 3% |
| Response Times | 72% | 98% | 98% | 41% | |
| Response Time Grey 50% / Grey 80% * (ms) | 38.5 ? | 10.7 ? 72% | 0.7 ? 98% | 0.62 ? 98% | 22.3 ? 42% |
| Response Time Black / White * (ms) | 24.6 ? | 7.1 ? 71% | 0.77 ? 97% | 0.68 ? 97% | 14.8 ? 40% |
| PWM Frequency (Hz) | 480 | 960 ? | |||
| Screen | -53% | 12% | 225% | -86% | |
| Brightness middle (cd/m²) | 325 | 455.8 40% | 351 8% | 423 30% | 415 28% |
| Brightness (cd/m²) | 317 | 436 38% | 353 11% | 424 34% | 395 25% |
| Brightness Distribution (%) | 94 | 93 -1% | 97 3% | 98 4% | 89 -5% |
| Black Level * (cd/m²) | 0.12 | 0.38 -217% | 0.01 92% | 0.34 -183% | |
| Contrast (:1) | 2708 | 1199 -56% | 42300 1462% | 1221 -55% | |
| Colorchecker dE 2000 * | 1.8 | 3.39 -88% | 1.7 6% | 0.7 61% | 4.5 -150% |
| Colorchecker dE 2000 max. * | 3.4 | 7.3 -115% | 2.2 35% | 1.8 47% | 10.7 -215% |
| Colorchecker dE 2000 calibrated * | 1.4 | 1.67 -19% | 0.8 43% | 1.8 -29% | |
| Greyscale dE 2000 * | 2.5 | 3.9 -56% | 3.1 -24% | 0.8 68% | 7.2 -188% |
| Gamma | 2.15 102% | 2.17 101% | 2.12 104% | 2.18 101% | 2.15 102% |
| CCT | 7017 93% | 7340 89% | 6616 98% | 6505 100% | 6541 99% |
| Total Average (Program / Settings) | 4% /
-25% | 44% /
28% | 115% /
159% | -14% /
-49% |
* ... smaller is better
We measured the panel's parameters with the professional CalMAN software using the Default profile. Grayscale test reveals a slight blue cast and a slightly too-cool color temperature. For colors however, deviations from sRGB reference colors are below the threshold of 3 meaning they are displayed in a natural enough way.
With our calibration profile applied (the file is available for free download above), some slight improvements are evident to the grayscale and the colors. Either way, the panel covers the sRGB spectrum in its entirety meaning image editing is no problem with the Schenker.


Display Response Times
| ↔ Response Time Black to White | ||
|---|---|---|
| 24.6 ms ... rise ↗ and fall ↘ combined | ↗ 11.9 ms rise |  |
| ↘ 12.6 ms fall | ||
| The screen shows good response rates in our tests, but may be too slow for competitive gamers. In comparison, all tested devices range from 0.1 (minimum) to 240 (maximum) ms. » 56 % of all devices are better. This means that the measured response time is worse than the average of all tested devices (20.4 ms). | ||
| ↔ Response Time 50% Grey to 80% Grey | ||
| 38.5 ms ... rise ↗ and fall ↘ combined | ↗ 17.2 ms rise |  |
| ↘ 21.3 ms fall | ||
| The screen shows slow response rates in our tests and will be unsatisfactory for gamers. In comparison, all tested devices range from 0.165 (minimum) to 636 (maximum) ms. » 57 % of all devices are better. This means that the measured response time is worse than the average of all tested devices (31.9 ms). | ||
Screen Flickering / PWM (Pulse-Width Modulation)
| Screen flickering / PWM not detected |  | ||
In comparison: 53 % of all tested devices do not use PWM to dim the display. If PWM was detected, an average of 8253 (minimum: 5 - maximum: 343500) Hz was measured. | |||


Performance - Core Ultra mated to up to 96 GB RAM


Testing conditions
The Key 14 comes with the latest Command Center 3.0, offering a range of settings and three energy profiles: Quiet, Entertainment, and Performance. Each profile has several sub-profiles, and there is also the option to manually adjust fan curves. To achieve the maximum GPU power target of 100 watts, the Performance profile with Turbo sub-profile must be used, which is what we activated for the performance tests below.
Processor
The processor used is the Core Ultra 7 155H from the Meteor Lake generation. Schenker allows it to consume as much as 65 watts; the figure end up stabilizing at 54 watts. As a result, processor performance is relatively consistent here, even when under sustained load.
That being said, the competition built around AMD's Ryzen CPUs deliver higher multi-core performance, with the Ryzen AI 9 HX 370 being notably faster than the Core Ultra 7.
On battery, the processor consumes a maximum of 45 watts to stabilize at 40 watts a while later. This results in a performance reduction of around 14% in multi-core tests compared to mains operation. Additional CPU benchmarks are available in our tech section.
Cinebench R15 Multi loop
Cinebench R23: Multi Core | Single Core
Cinebench R20: CPU (Multi Core) | CPU (Single Core)
Cinebench R15: CPU Multi 64Bit | CPU Single 64Bit
Blender: v2.79 BMW27 CPU
7-Zip 18.03: 7z b 4 | 7z b 4 -mmt1
Geekbench 6.4: Multi-Core | Single-Core
Geekbench 5.5: Multi-Core | Single-Core
HWBOT x265 Benchmark v2.2: 4k Preset
LibreOffice : 20 Documents To PDF
R Benchmark 2.5: Overall mean
| CPU Performance Rating | |
| Asus TUF Gaming A14 FA401WV-WB94 | |
| Asus ROG Zephyrus G14 2024 GA403U | |
| Average of class Multimedia | |
| SCHENKER Key 14 (M24) | |
| Dell XPS 14 2024 OLED | |
| Average Intel Core Ultra 7 155H | |
| Acer Nitro 14 AN14-41-R3MX | |
| Cinebench R23 / Multi Core | |
| Asus TUF Gaming A14 FA401WV-WB94 | |
| Asus ROG Zephyrus G14 2024 GA403U | |
| SCHENKER Key 14 (M24) | |
| Average of class Multimedia (4861 - 30783, n=82, last 2 years) | |
| Average Intel Core Ultra 7 155H (9769 - 19007, n=52) | |
| Dell XPS 14 2024 OLED | |
| Acer Nitro 14 AN14-41-R3MX | |
| Cinebench R23 / Single Core | |
| Asus TUF Gaming A14 FA401WV-WB94 | |
| Average of class Multimedia (1128 - 2290, n=74, last 2 years) | |
| Asus ROG Zephyrus G14 2024 GA403U | |
| Dell XPS 14 2024 OLED | |
| Average Intel Core Ultra 7 155H (1496 - 1815, n=52) | |
| Acer Nitro 14 AN14-41-R3MX | |
| SCHENKER Key 14 (M24) | |
| Cinebench R20 / CPU (Multi Core) | |
| Asus TUF Gaming A14 FA401WV-WB94 | |
| Asus ROG Zephyrus G14 2024 GA403U | |
| Dell XPS 14 2024 OLED | |
| SCHENKER Key 14 (M24) | |
| Average of class Multimedia (1887 - 11924, n=66, last 2 years) | |
| Average Intel Core Ultra 7 155H (3798 - 7409, n=50) | |
| Acer Nitro 14 AN14-41-R3MX | |
| Cinebench R20 / CPU (Single Core) | |
| Asus TUF Gaming A14 FA401WV-WB94 | |
| Asus ROG Zephyrus G14 2024 GA403U | |
| Average of class Multimedia (420 - 853, n=66, last 2 years) | |
| Dell XPS 14 2024 OLED | |
| Acer Nitro 14 AN14-41-R3MX | |
| Average Intel Core Ultra 7 155H (601 - 696, n=50) | |
| SCHENKER Key 14 (M24) | |
| Cinebench R15 / CPU Multi 64Bit | |
| Asus TUF Gaming A14 FA401WV-WB94 | |
| Asus ROG Zephyrus G14 2024 GA403U | |
| Dell XPS 14 2024 OLED | |
| Average of class Multimedia (856 - 5224, n=73, last 2 years) | |
| SCHENKER Key 14 (M24) | |
| Average Intel Core Ultra 7 155H (1932 - 2880, n=56) | |
| Acer Nitro 14 AN14-41-R3MX | |
| Cinebench R15 / CPU Single 64Bit | |
| Asus TUF Gaming A14 FA401WV-WB94 | |
| Asus ROG Zephyrus G14 2024 GA403U | |
| Acer Nitro 14 AN14-41-R3MX | |
| Average of class Multimedia (99.6 - 323, n=68, last 2 years) | |
| Dell XPS 14 2024 OLED | |
| Average Intel Core Ultra 7 155H (99.6 - 268, n=52) | |
| SCHENKER Key 14 (M24) | |
| Blender / v2.79 BMW27 CPU | |
| Average of class Multimedia (100 - 557, n=68, last 2 years) | |
| Dell XPS 14 2024 OLED | |
| Acer Nitro 14 AN14-41-R3MX | |
| Average Intel Core Ultra 7 155H (175 - 381, n=47) | |
| SCHENKER Key 14 (M24) | |
| Asus ROG Zephyrus G14 2024 GA403U | |
| Asus TUF Gaming A14 FA401WV-WB94 | |
| 7-Zip 18.03 / 7z b 4 | |
| Asus TUF Gaming A14 FA401WV-WB94 | |
| Asus ROG Zephyrus G14 2024 GA403U | |
| SCHENKER Key 14 (M24) | |
| Average Intel Core Ultra 7 155H (41739 - 70254, n=50) | |
| Average of class Multimedia (29095 - 130368, n=61, last 2 years) | |
| Acer Nitro 14 AN14-41-R3MX | |
| Dell XPS 14 2024 OLED | |
| 7-Zip 18.03 / 7z b 4 -mmt1 | |
| Acer Nitro 14 AN14-41-R3MX | |
| Asus TUF Gaming A14 FA401WV-WB94 | |
| Asus ROG Zephyrus G14 2024 GA403U | |
| Average of class Multimedia (3666 - 7545, n=61, last 2 years) | |
| SCHENKER Key 14 (M24) | |
| Dell XPS 14 2024 OLED | |
| Average Intel Core Ultra 7 155H (4594 - 5621, n=50) | |
| Geekbench 6.4 / Multi-Core | |
| Asus TUF Gaming A14 FA401WV-WB94 | |
| Average of class Multimedia (4983 - 25760, n=79, last 2 years) | |
| Dell XPS 14 2024 OLED | |
| Asus ROG Zephyrus G14 2024 GA403U | |
| SCHENKER Key 14 (M24) | |
| Average Intel Core Ultra 7 155H (7732 - 13656, n=55) | |
| Acer Nitro 14 AN14-41-R3MX | |
| Geekbench 6.4 / Single-Core | |
| Asus TUF Gaming A14 FA401WV-WB94 | |
| Average of class Multimedia (1534 - 3927, n=75, last 2 years) | |
| Asus ROG Zephyrus G14 2024 GA403U | |
| Acer Nitro 14 AN14-41-R3MX | |
| Dell XPS 14 2024 OLED | |
| Average Intel Core Ultra 7 155H (1901 - 2473, n=52) | |
| SCHENKER Key 14 (M24) | |
| Geekbench 5.5 / Multi-Core | |
| Asus TUF Gaming A14 FA401WV-WB94 | |
| Dell XPS 14 2024 OLED | |
| SCHENKER Key 14 (M24) | |
| Average of class Multimedia (4652 - 23059, n=66, last 2 years) | |
| Average Intel Core Ultra 7 155H (10017 - 13556, n=52) | |
| Asus ROG Zephyrus G14 2024 GA403U | |
| Acer Nitro 14 AN14-41-R3MX | |
| Geekbench 5.5 / Single-Core | |
| Asus TUF Gaming A14 FA401WV-WB94 | |
| Acer Nitro 14 AN14-41-R3MX | |
| Average of class Multimedia (805 - 2555, n=66, last 2 years) | |
| Asus ROG Zephyrus G14 2024 GA403U | |
| Dell XPS 14 2024 OLED | |
| Average Intel Core Ultra 7 155H (1462 - 1824, n=52) | |
| SCHENKER Key 14 (M24) | |
| HWBOT x265 Benchmark v2.2 / 4k Preset | |
| Asus TUF Gaming A14 FA401WV-WB94 | |
| Asus ROG Zephyrus G14 2024 GA403U | |
| Acer Nitro 14 AN14-41-R3MX | |
| Average of class Multimedia (5.26 - 34.3, n=61, last 2 years) | |
| Average Intel Core Ultra 7 155H (9.93 - 21.2, n=50) | |
| Dell XPS 14 2024 OLED | |
| SCHENKER Key 14 (M24) | |
| LibreOffice / 20 Documents To PDF | |
| Asus ROG Zephyrus G14 2024 GA403U | |
| Asus TUF Gaming A14 FA401WV-WB94 | |
| Average of class Multimedia (23.9 - 146.7, n=62, last 2 years) | |
| Dell XPS 14 2024 OLED | |
| Average Intel Core Ultra 7 155H (37.5 - 79.2, n=49) | |
| Acer Nitro 14 AN14-41-R3MX | |
| SCHENKER Key 14 (M24) | |
| R Benchmark 2.5 / Overall mean | |
| SCHENKER Key 14 (M24) | |
| Average Intel Core Ultra 7 155H (0.4457 - 0.53, n=49) | |
| Average of class Multimedia (0.3604 - 0.947, n=61, last 2 years) | |
| Dell XPS 14 2024 OLED | |
| Acer Nitro 14 AN14-41-R3MX | |
| Asus ROG Zephyrus G14 2024 GA403U | |
| Asus TUF Gaming A14 FA401WV-WB94 | |
* ... smaller is better
AIDA64: FP32 Ray-Trace | FPU Julia | CPU SHA3 | CPU Queen | FPU SinJulia | FPU Mandel | CPU AES | CPU ZLib | FP64 Ray-Trace | CPU PhotoWorxx
| Performance Rating | |
| Asus TUF Gaming A14 FA401WV-WB94 | |
| Asus ROG Zephyrus G14 2024 GA403U | |
| Acer Nitro 14 AN14-41-R3MX | |
| Average of class Multimedia | |
| SCHENKER Key 14 (M24) | |
| Average Intel Core Ultra 7 155H | |
| Dell XPS 14 2024 OLED | |
| AIDA64 / FP32 Ray-Trace | |
| Asus TUF Gaming A14 FA401WV-WB94 | |
| Asus ROG Zephyrus G14 2024 GA403U | |
| Acer Nitro 14 AN14-41-R3MX | |
| Average of class Multimedia (5121 - 50388, n=59, last 2 years) | |
| SCHENKER Key 14 (M24) | |
| Average Intel Core Ultra 7 155H (6670 - 18470, n=50) | |
| Dell XPS 14 2024 OLED | |
| AIDA64 / FPU Julia | |
| Asus TUF Gaming A14 FA401WV-WB94 | |
| Asus ROG Zephyrus G14 2024 GA403U | |
| Acer Nitro 14 AN14-41-R3MX | |
| Average of class Multimedia (14528 - 201874, n=60, last 2 years) | |
| SCHENKER Key 14 (M24) | |
| Average Intel Core Ultra 7 155H (40905 - 93181, n=50) | |
| Dell XPS 14 2024 OLED | |
| AIDA64 / CPU SHA3 | |
| Asus TUF Gaming A14 FA401WV-WB94 | |
| Asus ROG Zephyrus G14 2024 GA403U | |
| Acer Nitro 14 AN14-41-R3MX | |
| Average of class Multimedia (1188 - 8623, n=60, last 2 years) | |
| SCHENKER Key 14 (M24) | |
| Average Intel Core Ultra 7 155H (1940 - 4436, n=50) | |
| Dell XPS 14 2024 OLED | |
| AIDA64 / CPU Queen | |
| Asus ROG Zephyrus G14 2024 GA403U | |
| Acer Nitro 14 AN14-41-R3MX | |
| Asus TUF Gaming A14 FA401WV-WB94 | |
| SCHENKER Key 14 (M24) | |
| Dell XPS 14 2024 OLED | |
| Average Intel Core Ultra 7 155H (64698 - 94181, n=50) | |
| Average of class Multimedia (21547 - 181505, n=60, last 2 years) | |
| AIDA64 / FPU SinJulia | |
| Asus TUF Gaming A14 FA401WV-WB94 | |
| Asus ROG Zephyrus G14 2024 GA403U | |
| Acer Nitro 14 AN14-41-R3MX | |
| Average of class Multimedia (1240 - 28794, n=60, last 2 years) | |
| SCHENKER Key 14 (M24) | |
| Average Intel Core Ultra 7 155H (5639 - 10647, n=50) | |
| Dell XPS 14 2024 OLED | |
| AIDA64 / FPU Mandel | |
| Asus TUF Gaming A14 FA401WV-WB94 | |
| Asus ROG Zephyrus G14 2024 GA403U | |
| Acer Nitro 14 AN14-41-R3MX | |
| Average of class Multimedia (9903 - 105740, n=59, last 2 years) | |
| SCHENKER Key 14 (M24) | |
| Average Intel Core Ultra 7 155H (18236 - 47685, n=50) | |
| Dell XPS 14 2024 OLED | |
| AIDA64 / CPU AES | |
| Asus ROG Zephyrus G14 2024 GA403U | |
| Asus TUF Gaming A14 FA401WV-WB94 | |
| Average Intel Core Ultra 7 155H (45713 - 152179, n=50) | |
| Average of class Multimedia (26066 - 169946, n=60, last 2 years) | |
| SCHENKER Key 14 (M24) | |
| Dell XPS 14 2024 OLED | |
| Acer Nitro 14 AN14-41-R3MX | |
| AIDA64 / CPU ZLib | |
| Asus TUF Gaming A14 FA401WV-WB94 | |
| Asus ROG Zephyrus G14 2024 GA403U | |
| SCHENKER Key 14 (M24) | |
| Average Intel Core Ultra 7 155H (557 - 1250, n=50) | |
| Average of class Multimedia (440 - 2022, n=60, last 2 years) | |
| Dell XPS 14 2024 OLED | |
| Acer Nitro 14 AN14-41-R3MX | |
| AIDA64 / FP64 Ray-Trace | |
| Asus TUF Gaming A14 FA401WV-WB94 | |
| Asus ROG Zephyrus G14 2024 GA403U | |
| Acer Nitro 14 AN14-41-R3MX | |
| Average of class Multimedia (2759 - 26875, n=60, last 2 years) | |
| SCHENKER Key 14 (M24) | |
| Average Intel Core Ultra 7 155H (3569 - 9802, n=50) | |
| Dell XPS 14 2024 OLED | |
| AIDA64 / CPU PhotoWorxx | |
| Dell XPS 14 2024 OLED | |
| SCHENKER Key 14 (M24) | |
| Average Intel Core Ultra 7 155H (32719 - 54223, n=50) | |
| Average of class Multimedia (12860 - 65787, n=60, last 2 years) | |
| Asus ROG Zephyrus G14 2024 GA403U | |
| Asus TUF Gaming A14 FA401WV-WB94 | |
| Acer Nitro 14 AN14-41-R3MX | |
System performance
The Key 14 is quite responsive in everyday use, with synthetic benchmarks more or less confirming our subjective impression. We experienced no issues of any kind during our time with the sample unit, either.
CrossMark: Overall | Productivity | Creativity | Responsiveness
WebXPRT 3: Overall
WebXPRT 4: Overall
Mozilla Kraken 1.1: Total
| PCMark 10 / Score | |
| Asus TUF Gaming A14 FA401WV-WB94 | |
| Acer Nitro 14 AN14-41-R3MX | |
| Asus ROG Zephyrus G14 2024 GA403U | |
| Average Intel Core Ultra 7 155H, NVIDIA GeForce RTX 4060 Laptop GPU (6751 - 7370, n=5) | |
| Average of class Multimedia (4325 - 8670, n=57, last 2 years) | |
| SCHENKER Key 14 (M24) | |
| Dell XPS 14 2024 OLED | |
| PCMark 10 / Essentials | |
| Average of class Multimedia (8025 - 12420, n=57, last 2 years) | |
| Asus TUF Gaming A14 FA401WV-WB94 | |
| SCHENKER Key 14 (M24) | |
| Dell XPS 14 2024 OLED | |
| Average Intel Core Ultra 7 155H, NVIDIA GeForce RTX 4060 Laptop GPU (9476 - 10446, n=5) | |
| Asus ROG Zephyrus G14 2024 GA403U | |
| Acer Nitro 14 AN14-41-R3MX | |
| PCMark 10 / Productivity | |
| Acer Nitro 14 AN14-41-R3MX | |
| Asus TUF Gaming A14 FA401WV-WB94 | |
| Asus ROG Zephyrus G14 2024 GA403U | |
| Average of class Multimedia (6763 - 10615, n=57, last 2 years) | |
| Dell XPS 14 2024 OLED | |
| Average Intel Core Ultra 7 155H, NVIDIA GeForce RTX 4060 Laptop GPU (8079 - 9477, n=5) | |
| SCHENKER Key 14 (M24) | |
| PCMark 10 / Digital Content Creation | |
| Asus TUF Gaming A14 FA401WV-WB94 | |
| Asus ROG Zephyrus G14 2024 GA403U | |
| Acer Nitro 14 AN14-41-R3MX | |
| Average Intel Core Ultra 7 155H, NVIDIA GeForce RTX 4060 Laptop GPU (9811 - 11620, n=5) | |
| SCHENKER Key 14 (M24) | |
| Average of class Multimedia (3651 - 15187, n=57, last 2 years) | |
| Dell XPS 14 2024 OLED | |
| CrossMark / Overall | |
| Asus ROG Zephyrus G14 2024 GA403U | |
| Acer Nitro 14 AN14-41-R3MX | |
| Average of class Multimedia (866 - 2255, n=66, last 2 years) | |
| SCHENKER Key 14 (M24) | |
| Asus TUF Gaming A14 FA401WV-WB94 | |
| Dell XPS 14 2024 OLED | |
| Average Intel Core Ultra 7 155H, NVIDIA GeForce RTX 4060 Laptop GPU (1540 - 1746, n=5) | |
| CrossMark / Productivity | |
| Acer Nitro 14 AN14-41-R3MX | |
| Asus ROG Zephyrus G14 2024 GA403U | |
| SCHENKER Key 14 (M24) | |
| Average of class Multimedia (913 - 2050, n=66, last 2 years) | |
| Average Intel Core Ultra 7 155H, NVIDIA GeForce RTX 4060 Laptop GPU (1436 - 1684, n=5) | |
| Dell XPS 14 2024 OLED | |
| Asus TUF Gaming A14 FA401WV-WB94 | |
| CrossMark / Creativity | |
| Asus TUF Gaming A14 FA401WV-WB94 | |
| Average of class Multimedia (907 - 2795, n=66, last 2 years) | |
| Asus ROG Zephyrus G14 2024 GA403U | |
| Dell XPS 14 2024 OLED | |
| Average Intel Core Ultra 7 155H, NVIDIA GeForce RTX 4060 Laptop GPU (1811 - 1929, n=5) | |
| SCHENKER Key 14 (M24) | |
| Acer Nitro 14 AN14-41-R3MX | |
| CrossMark / Responsiveness | |
| Acer Nitro 14 AN14-41-R3MX | |
| SCHENKER Key 14 (M24) | |
| Asus ROG Zephyrus G14 2024 GA403U | |
| Average of class Multimedia (605 - 2094, n=66, last 2 years) | |
| Average Intel Core Ultra 7 155H, NVIDIA GeForce RTX 4060 Laptop GPU (1165 - 1631, n=5) | |
| Dell XPS 14 2024 OLED | |
| Asus TUF Gaming A14 FA401WV-WB94 | |
| WebXPRT 3 / Overall | |
| Average of class Multimedia (136.4 - 545, n=69, last 2 years) | |
| Asus ROG Zephyrus G14 2024 GA403U | |
| Acer Nitro 14 AN14-41-R3MX | |
| Asus TUF Gaming A14 FA401WV-WB94 | |
| Average Intel Core Ultra 7 155H, NVIDIA GeForce RTX 4060 Laptop GPU (274 - 290, n=5) | |
| Dell XPS 14 2024 OLED | |
| SCHENKER Key 14 (M24) | |
| WebXPRT 4 / Overall | |
| Average of class Multimedia (167.3 - 353, n=63, last 2 years) | |
| Dell XPS 14 2024 OLED | |
| Asus TUF Gaming A14 FA401WV-WB94 | |
| Average Intel Core Ultra 7 155H, NVIDIA GeForce RTX 4060 Laptop GPU (236 - 262, n=5) | |
| Asus ROG Zephyrus G14 2024 GA403U | |
| Acer Nitro 14 AN14-41-R3MX | |
| SCHENKER Key 14 (M24) | |
| Mozilla Kraken 1.1 / Total | |
| SCHENKER Key 14 (M24) | |
| Average Intel Core Ultra 7 155H, NVIDIA GeForce RTX 4060 Laptop GPU (519 - 585, n=5) | |
| Acer Nitro 14 AN14-41-R3MX | |
| Dell XPS 14 2024 OLED | |
| Asus ROG Zephyrus G14 2024 GA403U | |
| Average of class Multimedia (254 - 835, n=73, last 2 years) | |
| Asus TUF Gaming A14 FA401WV-WB94 | |
* ... smaller is better
| PCMark 10 Score | 6751 points | |
Help | ||
| AIDA64 / Memory Copy | |
| Dell XPS 14 2024 OLED | |
| Asus TUF Gaming A14 FA401WV-WB94 | |
| Average Intel Core Ultra 7 155H (62397 - 96791, n=50) | |
| Average of class Multimedia (21158 - 108302, n=60, last 2 years) | |
| SCHENKER Key 14 (M24) | |
| Acer Nitro 14 AN14-41-R3MX | |
| Asus ROG Zephyrus G14 2024 GA403U | |
| AIDA64 / Memory Read | |
| Asus TUF Gaming A14 FA401WV-WB94 | |
| Dell XPS 14 2024 OLED | |
| SCHENKER Key 14 (M24) | |
| Average Intel Core Ultra 7 155H (60544 - 90647, n=50) | |
| Average of class Multimedia (24312 - 125604, n=60, last 2 years) | |
| Acer Nitro 14 AN14-41-R3MX | |
| Asus ROG Zephyrus G14 2024 GA403U | |
| AIDA64 / Memory Write | |
| Asus TUF Gaming A14 FA401WV-WB94 | |
| Asus ROG Zephyrus G14 2024 GA403U | |
| Acer Nitro 14 AN14-41-R3MX | |
| Average of class Multimedia (24382 - 117933, n=60, last 2 years) | |
| SCHENKER Key 14 (M24) | |
| Dell XPS 14 2024 OLED | |
| Average Intel Core Ultra 7 155H (58692 - 93451, n=50) | |
| AIDA64 / Memory Latency | |
| Average Intel Core Ultra 7 155H (116.2 - 233, n=50) | |
| Dell XPS 14 2024 OLED | |
| Asus TUF Gaming A14 FA401WV-WB94 | |
| SCHENKER Key 14 (M24) | |
| Average of class Multimedia (7 - 346, n=60, last 2 years) | |
| Asus ROG Zephyrus G14 2024 GA403U | |
| Acer Nitro 14 AN14-41-R3MX | |
* ... smaller is better
DPC latencies
In our standardized latency test (Internet browsing, 4K YouTube playback, CPU load with Prime95), one of the drivers was a bit of a problem, but the important "interrupt-to-process latency" value still remained very low. Therefore, there should be no issues when working with audio or video in real time.


| DPC Latencies / LatencyMon - interrupt to process latency (max), Web, Youtube, Prime95 | |
| Dell XPS 14 2024 OLED | |
| Acer Nitro 14 AN14-41-R3MX | |
| Asus ROG Zephyrus G14 2024 GA403U | |
| SCHENKER Key 14 (M24) | |
* ... smaller is better
Storage devices
The Key 14 can be had with various PCIe 4 M.2 2280 SSDs. The test device is equipped with a 1 TB Samsung SSD 990 Pro, which is 64 euros more expensive compared to the base 500 GB Samsung 980 option.
The SSD delivers excellent transfer rates with no performance drops even under sustained load. After initial setup, approximately 890 GB are available. Further SSD benchmarks can be found here.

* ... smaller is better
Disk throttling: DiskSpd Read Loop, Queue Depth 8
GPU performance

The Key 14 is available with either the GeForce RTX 4060 or the GeForce RTX 4070 laptop GPUs. The latter makes the whole package 295 euros more expensive. In both cases, the maximum TGP power target is set to 100 watts (75 W TGP + 25 W Dynamic Boost) and there is 8 GB of VRAM. GeForce RTX Studio certification is onboard, too. A MUX switch is present.
We got a chance to run synthetic and gaming benchmarks on both variants. The RTX 4070 Laptop is approximately 16% faster in synthetic benchmarks, but only 7% faster in the games tested. The performance of the RTX 4060 Laptop is sufficient for running all 2024 games smoothly at Full HD on maximum settings and it remains stable even under longer workloads.
On battery, the GPU is limited to a maximum of 40 watts, resulting in a performance drop of around 30%. Further GPU benchmarks are available here.
| 3DMark Performance Rating - Percent | |
| SCHENKER Key 14 (M24) | |
| Acer Nitro 14 AN14-41-R3MX | |
| Asus ROG Zephyrus G14 2024 GA403U | |
| Asus TUF Gaming A14 FA401WV-WB94 | |
| SCHENKER Key 14 (M24) | |
| Average NVIDIA GeForce RTX 4060 Laptop GPU | |
| Average of class Multimedia | |
| Dell XPS 14 2024 OLED | |
| 3DMark 11 - 1280x720 Performance GPU | |
| SCHENKER Key 14 (M24) | |
| Acer Nitro 14 AN14-41-R3MX | |
| Asus ROG Zephyrus G14 2024 GA403U | |
| Asus TUF Gaming A14 FA401WV-WB94 | |
| SCHENKER Key 14 (M24) | |
| Average NVIDIA GeForce RTX 4060 Laptop GPU (28136 - 38912, n=57) | |
| Average of class Multimedia (3765 - 45564, n=59, last 2 years) | |
| Dell XPS 14 2024 OLED | |
| 3DMark 11 Performance | 28106 points | |
| 3DMark Fire Strike Score | 18863 points | |
| 3DMark Time Spy Score | 10037 points | |
| 3DMark Steel Nomad Score | 2236 points | |
| 3DMark Steel Nomad Light Score | 9967 points | |
Help | ||
| Blender / v3.3 Classroom OPTIX/RTX | |
| Average of class Multimedia (19 - 105, n=26, last 2 years) | |
| Dell XPS 14 2024 OLED | |
| Asus ROG Zephyrus G14 2024 GA403U | |
| Average NVIDIA GeForce RTX 4060 Laptop GPU (19 - 28, n=53) | |
| Asus TUF Gaming A14 FA401WV-WB94 | |
| Acer Nitro 14 AN14-41-R3MX | |
| SCHENKER Key 14 (M24) | |
| SCHENKER Key 14 (M24) | |
| Blender / v3.3 Classroom CUDA | |
| Average of class Multimedia (32 - 164, n=25, last 2 years) | |
| Dell XPS 14 2024 OLED | |
| Average NVIDIA GeForce RTX 4060 Laptop GPU (39 - 53, n=53) | |
| SCHENKER Key 14 (M24) | |
| Asus TUF Gaming A14 FA401WV-WB94 | |
| Acer Nitro 14 AN14-41-R3MX | |
| Asus ROG Zephyrus G14 2024 GA403U | |
| SCHENKER Key 14 (M24) | |
| Blender / v3.3 Classroom CPU | |
| Dell XPS 14 2024 OLED | |
| Average of class Multimedia (160 - 1042, n=68, last 2 years) | |
| Acer Nitro 14 AN14-41-R3MX | |
| SCHENKER Key 14 (M24) | |
| SCHENKER Key 14 (M24) | |
| Asus ROG Zephyrus G14 2024 GA403U | |
| Average NVIDIA GeForce RTX 4060 Laptop GPU (189 - 452, n=53) | |
| Asus TUF Gaming A14 FA401WV-WB94 | |
* ... smaller is better
| Performance Rating - Percent | |
| Acer Nitro 14 AN14-41-R3MX | |
| Asus TUF Gaming A14 FA401WV-WB94 | |
| Asus ROG Zephyrus G14 2024 GA403U -1! | |
| SCHENKER Key 14 (M24) | |
| SCHENKER Key 14 (M24) | |
| Dell XPS 14 2024 OLED | |
| Average of class Multimedia | |
| Cyberpunk 2077 2.2 Phantom Liberty - 1920x1080 Ultra Preset (FSR off) | |
| Acer Nitro 14 AN14-41-R3MX | |
| Asus ROG Zephyrus G14 2024 GA403U | |
| Asus TUF Gaming A14 FA401WV-WB94 | |
| SCHENKER Key 14 (M24) | |
| SCHENKER Key 14 (M24) | |
| Dell XPS 14 2024 OLED | |
| Average of class Multimedia (6.41 - 97.8, n=67, last 2 years) | |
| Baldur's Gate 3 - 1920x1080 Ultra Preset AA:T | |
| Acer Nitro 14 AN14-41-R3MX | |
| Asus TUF Gaming A14 FA401WV-WB94 | |
| SCHENKER Key 14 (M24) | |
| SCHENKER Key 14 (M24) | |
| Dell XPS 14 2024 OLED | |
| Average of class Multimedia (7.8 - 127.3, n=55, last 2 years) | |
| GTA V - 1920x1080 Highest Settings possible AA:4xMSAA + FX AF:16x | |
| Asus TUF Gaming A14 FA401WV-WB94 | |
| Acer Nitro 14 AN14-41-R3MX | |
| Asus ROG Zephyrus G14 2024 GA403U | |
| SCHENKER Key 14 (M24) | |
| SCHENKER Key 14 (M24) | |
| Dell XPS 14 2024 OLED | |
| Average of class Multimedia (9.38 - 141.6, n=61, last 2 years) | |
| Final Fantasy XV Benchmark - 1920x1080 High Quality | |
| Acer Nitro 14 AN14-41-R3MX | |
| SCHENKER Key 14 (M24) | |
| Asus ROG Zephyrus G14 2024 GA403U | |
| Asus TUF Gaming A14 FA401WV-WB94 | |
| SCHENKER Key 14 (M24) | |
| Dell XPS 14 2024 OLED | |
| Average of class Multimedia (7.61 - 132, n=64, last 2 years) | |
| Strange Brigade - 1920x1080 ultra AA:ultra AF:16 | |
| SCHENKER Key 14 (M24) | |
| Asus TUF Gaming A14 FA401WV-WB94 | |
| Acer Nitro 14 AN14-41-R3MX | |
| Asus ROG Zephyrus G14 2024 GA403U | |
| SCHENKER Key 14 (M24) | |
| Dell XPS 14 2024 OLED | |
| Average of class Multimedia (13.3 - 247, n=63, last 2 years) | |
| Dota 2 Reborn - 1920x1080 ultra (3/3) best looking | |
| Asus TUF Gaming A14 FA401WV-WB94 | |
| SCHENKER Key 14 (M24) | |
| SCHENKER Key 14 (M24) | |
| Asus ROG Zephyrus G14 2024 GA403U | |
| Acer Nitro 14 AN14-41-R3MX | |
| Dell XPS 14 2024 OLED | |
| Average of class Multimedia (29 - 179.9, n=66, last 2 years) | |
| X-Plane 11.11 - 1920x1080 high (fps_test=3) | |
| SCHENKER Key 14 (M24) | |
| SCHENKER Key 14 (M24) | |
| Asus ROG Zephyrus G14 2024 GA403U | |
| Dell XPS 14 2024 OLED | |
| Acer Nitro 14 AN14-41-R3MX | |
| Asus TUF Gaming A14 FA401WV-WB94 | |
| Average of class Multimedia (16.9 - 141.1, n=61, last 2 years) | |
Cyberpunk 2077 Ultra fps chart
| low | med. | high | ultra | QHD | |
|---|---|---|---|---|---|
| GTA V (2015) | 167 | 158.8 | 141.1 | 79.7 | 72.3 |
| Dota 2 Reborn (2015) | 167.5 | 141.1 | 136.5 | 122.6 | |
| Final Fantasy XV Benchmark (2018) | 156.8 | 121.1 | 94 | 72.4 | |
| X-Plane 11.11 (2018) | 123.1 | 103.2 | 84.6 | ||
| Far Cry 5 (2018) | 130 | 116 | 112 | 106 | |
| Strange Brigade (2018) | 341 | 255 | 214 | 186 | 125 |
| Baldur's Gate 3 (2023) | 124.5 | 104.2 | 77.6 | 66.9 | 50.8 |
| Cyberpunk 2077 2.2 Phantom Liberty (2023) | 109.6 | 79.3 | 70.5 | 56.4 | 41.5 |
| F1 24 (2024) | 182.8 | 182.9 | 162.8 | 52.3 | 24.3 |
Emissions. Power
Noise emissions

The Key uses two fans to dispose of unwanted heat. The noise produced varies significantly depending on the power profile. In both Entertainment and Performance modes, the fans activate quickly even during mundane tasks which can be somewhat annoying. When under load, the system is quite loud, reaching 57.8 dB(A) under the Performance (Turbo) mode during gaming and stress testing. It's 55.9 dB(a) for Performance (Automatic) and 51.6 dB(A) for Entertainment which is still on the louder side. Therefore, headphones are recommended. Activating the Quiet mode makes the cooling solution act much quieter at 30.3 dB(A), even during stress testing.
We're able to hear no other noises such as coil whine.
Noise Level
| Idle |
| 25.5 / 26.5 / 30.3 dB(A) |
| Load |
| 49.3 / 57.8 dB(A) |
 | ||
30 dB silent 40 dB(A) audible 50 dB(A) loud |
||
min: | ||
| SCHENKER Key 14 (M24) NVIDIA GeForce RTX 4060 Laptop GPU, Ultra 7 155H, Samsung 990 Pro 1 TB | Asus TUF Gaming A14 FA401WV-WB94 NVIDIA GeForce RTX 4060 Laptop GPU, Ryzen AI 9 HX 370, WD PC SN560 SDDPNQE-1T00 | Dell XPS 14 2024 OLED NVIDIA GeForce RTX 4050 Laptop GPU, Ultra 7 155H, Samsung PM9A1 MZVL21T0HCLR | Asus ROG Zephyrus G14 2024 GA403U NVIDIA GeForce RTX 4070 Laptop GPU, R9 8945HS, WD PC SN560 SDDPNQE-1T00 | Acer Nitro 14 AN14-41-R3MX NVIDIA GeForce RTX 4060 Laptop GPU, R5 8645HS, Micron 3500 MTFDKBA512TGD | |
|---|---|---|---|---|---|
| Noise | 9% | 11% | 12% | 10% | |
| off / environment * (dB) | 25.5 | 22.9 10% | 24.3 5% | 23.9 6% | 24.3 5% |
| Idle Minimum * (dB) | 25.5 | 22.9 10% | 24.3 5% | 23.9 6% | 24.3 5% |
| Idle Average * (dB) | 26.5 | 28.3 -7% | 26.5 -0% | 23.9 10% | 24.3 8% |
| Idle Maximum * (dB) | 30.3 | 28.8 5% | 28.5 6% | 23.9 21% | 24.3 20% |
| Load Average * (dB) | 49.3 | 37.3 24% | 37 25% | 46.2 6% | 33.1 33% |
| Cyberpunk 2077 ultra * (dB) | 57.8 | 50.6 12% | 57.1 1% | ||
| Load Maximum * (dB) | 57.8 | 50.6 12% | 43.3 25% | 46.2 20% | 57 1% |
| Witcher 3 ultra * (dB) | 39.1 | 46.2 |
* ... smaller is better
Temperature
Temperatures aren't a problem when performing simple tasks but under load, the rear area on the underside gets very warm (over 50°C) and it's hardly the only sector to get warm. It’s best not to place the system on your thighs. During our stress testing (Prime95 + FurMark), the processor's as well as the graphics card's clock speeds and power consumption figures fluctuate slightly, with the GPU getting a much larger cut of the overall power budget. The processor's average consumption is ~15 watts while the dGPU eats a whopping 85 watts.

(±) The maximum temperature on the upper side is 43.1 °C / 110 F, compared to the average of 36.9 °C / 98 F, ranging from 21.1 to 71 °C for the class Multimedia.
(-) The bottom heats up to a maximum of 51.3 °C / 124 F, compared to the average of 39.2 °C / 103 F
(+) In idle usage, the average temperature for the upper side is 30.4 °C / 87 F, compared to the device average of 31.3 °C / 88 F.
(±) 3: The average temperature for the upper side is 37.3 °C / 99 F, compared to the average of 31.3 °C / 88 F for the class Multimedia.
(+) The palmrests and touchpad are cooler than skin temperature with a maximum of 31 °C / 87.8 F and are therefore cool to the touch.
(-) The average temperature of the palmrest area of similar devices was 28.7 °C / 83.7 F (-2.3 °C / -4.1 F).


| SCHENKER Key 14 (M24) Intel Core Ultra 7 155H, NVIDIA GeForce RTX 4060 Laptop GPU | Asus TUF Gaming A14 FA401WV-WB94 AMD Ryzen AI 9 HX 370, NVIDIA GeForce RTX 4060 Laptop GPU | Dell XPS 14 2024 OLED Intel Core Ultra 7 155H, NVIDIA GeForce RTX 4050 Laptop GPU | Asus ROG Zephyrus G14 2024 GA403U AMD Ryzen 9 8945HS, NVIDIA GeForce RTX 4070 Laptop GPU | Acer Nitro 14 AN14-41-R3MX AMD Ryzen 5 8645HS, NVIDIA GeForce RTX 4060 Laptop GPU | |
|---|---|---|---|---|---|
| Heat | 6% | 17% | 12% | 9% | |
| Maximum Upper Side * (°C) | 43.1 | 49.8 -16% | 40.5 6% | 46.6 -8% | 43.5 -1% |
| Maximum Bottom * (°C) | 51.3 | 46 10% | 42.6 17% | 47.8 7% | 46.3 10% |
| Idle Upper Side * (°C) | 33.2 | 30.2 9% | 26.9 19% | 26.7 20% | 30.4 8% |
| Idle Bottom * (°C) | 38.3 | 29.8 22% | 27.8 27% | 27.8 27% | 31.3 18% |
* ... smaller is better
Speakers
The stereo speakers sound somewhat tinny and are not particularly impressive. While speech playback benefits from clear highs, external speakers or headphones are recommended for playing music or video content.
SCHENKER Key 14 (M24) audio analysis
(±) | speaker loudness is average but good (81.5 dB)
Bass 100 - 315 Hz
(-) | nearly no bass - on average 29.9% lower than median
(±) | linearity of bass is average (7.9% delta to prev. frequency)
Mids 400 - 2000 Hz
(±) | higher mids - on average 5.3% higher than median
(+) | mids are linear (5.9% delta to prev. frequency)
Highs 2 - 16 kHz
(+) | balanced highs - only 2.1% away from median
(+) | highs are linear (2.8% delta to prev. frequency)
Overall 100 - 16.000 Hz
(±) | linearity of overall sound is average (20.9% difference to median)
Compared to same class
» 70% of all tested devices in this class were better, 8% similar, 22% worse
» The best had a delta of 5%, average was 18%, worst was 45%
Compared to all devices tested
» 55% of all tested devices were better, 8% similar, 37% worse
» The best had a delta of 4%, average was 24%, worst was 134%
Asus TUF Gaming A14 FA401WV-WB94 audio analysis
(±) | speaker loudness is average but good (75.2 dB)
Bass 100 - 315 Hz
(±) | reduced bass - on average 8.4% lower than median
(±) | linearity of bass is average (9.7% delta to prev. frequency)
Mids 400 - 2000 Hz
(±) | higher mids - on average 10% higher than median
(+) | mids are linear (4.2% delta to prev. frequency)
Highs 2 - 16 kHz
(+) | balanced highs - only 3.8% away from median
(+) | highs are linear (6.7% delta to prev. frequency)
Overall 100 - 16.000 Hz
(±) | linearity of overall sound is average (19.2% difference to median)
Compared to same class
» 64% of all tested devices in this class were better, 7% similar, 29% worse
» The best had a delta of 6%, average was 18%, worst was 132%
Compared to all devices tested
» 44% of all tested devices were better, 7% similar, 48% worse
» The best had a delta of 4%, average was 24%, worst was 134%
Dell XPS 14 2024 OLED audio analysis
(+) | speakers can play relatively loud (82.8 dB)
Bass 100 - 315 Hz
(±) | reduced bass - on average 9.9% lower than median
(±) | linearity of bass is average (10.1% delta to prev. frequency)
Mids 400 - 2000 Hz
(+) | balanced mids - only 4.4% away from median
(+) | mids are linear (3.8% delta to prev. frequency)
Highs 2 - 16 kHz
(+) | balanced highs - only 2.3% away from median
(±) | linearity of highs is average (7% delta to prev. frequency)
Overall 100 - 16.000 Hz
(+) | overall sound is linear (11% difference to median)
Compared to same class
» 12% of all tested devices in this class were better, 3% similar, 85% worse
» The best had a delta of 5%, average was 18%, worst was 45%
Compared to all devices tested
» 6% of all tested devices were better, 2% similar, 93% worse
» The best had a delta of 4%, average was 24%, worst was 134%
Asus ROG Zephyrus G14 2024 GA403U audio analysis
(+) | speakers can play relatively loud (84.7 dB)
Bass 100 - 315 Hz
(+) | good bass - only 3.5% away from median
(±) | linearity of bass is average (7.3% delta to prev. frequency)
Mids 400 - 2000 Hz
(+) | balanced mids - only 3.8% away from median
(+) | mids are linear (3.6% delta to prev. frequency)
Highs 2 - 16 kHz
(+) | balanced highs - only 1.4% away from median
(+) | highs are linear (3.5% delta to prev. frequency)
Overall 100 - 16.000 Hz
(+) | overall sound is linear (5.8% difference to median)
Compared to same class
» 0% of all tested devices in this class were better, 0% similar, 100% worse
» The best had a delta of 6%, average was 18%, worst was 132%
Compared to all devices tested
» 0% of all tested devices were better, 0% similar, 100% worse
» The best had a delta of 4%, average was 24%, worst was 134%
Acer Nitro 14 AN14-41-R3MX audio analysis
(±) | speaker loudness is average but good (79.6 dB)
Bass 100 - 315 Hz
(-) | nearly no bass - on average 23.5% lower than median
(±) | linearity of bass is average (10.2% delta to prev. frequency)
Mids 400 - 2000 Hz
(+) | balanced mids - only 2.7% away from median
(±) | linearity of mids is average (7.9% delta to prev. frequency)
Highs 2 - 16 kHz
(±) | higher highs - on average 5.3% higher than median
(±) | linearity of highs is average (9.4% delta to prev. frequency)
Overall 100 - 16.000 Hz
(±) | linearity of overall sound is average (20% difference to median)
Compared to same class
» 69% of all tested devices in this class were better, 6% similar, 24% worse
» The best had a delta of 6%, average was 18%, worst was 132%
Compared to all devices tested
» 50% of all tested devices were better, 8% similar, 42% worse
» The best had a delta of 4%, average was 24%, worst was 134%
Power consumption
Its maximum idle consumption is around 11 watts, while gaming power consumption ranges from 160 to 180 watts. In the stress test, we initially measured a maximum of 183 watts, but this quickly dipped and stabilized at around 125 to 140 watts. The included 180-watt power supply unit is therefore adequately sized.
| Off / Standby | |
| Idle | |
| Load |
|
Key:
min: | |
Power consumption in Cyberpunk 2077 (gaming stress test)
Power consumption with ext. monitor connected
Battery life
The 80 Wh battery only provides average battery life. In our Web surfing via Wi-Fi test with 150 cd/m² brightness (corresponds to 70% setting), the Schenker lasted about 7.5 hours.
Notebookcheck rating
SCHENKER Key 14 (M24)
- 12/15/2024 v8
Andreas Osthoff
 Total Sustainability Score:


Transparency
The selection of devices to be reviewed is made by our editorial team. The test sample was provided to the author as a loan by the manufacturer or retailer for the purpose of this review. The lender had no influence on this review, nor did the manufacturer receive a copy of this review before publication. There was no obligation to publish this review. We never accept compensation or payment in return for our reviews. As an independent media company, Notebookcheck is not subjected to the authority of manufacturers, retailers or publishers.
This is how Notebookcheck is testing
Every year, Notebookcheck independently reviews hundreds of laptops and smartphones using standardized procedures to ensure that all results are comparable. We have continuously developed our test methods for around 20 years and set industry standards in the process. In our test labs, high-quality measuring equipment is utilized by experienced technicians and editors. These tests involve a multi-stage validation process. Our complex rating system is based on hundreds of well-founded measurements and benchmarks, which maintains objectivity. Further information on our test methods can be found here.

