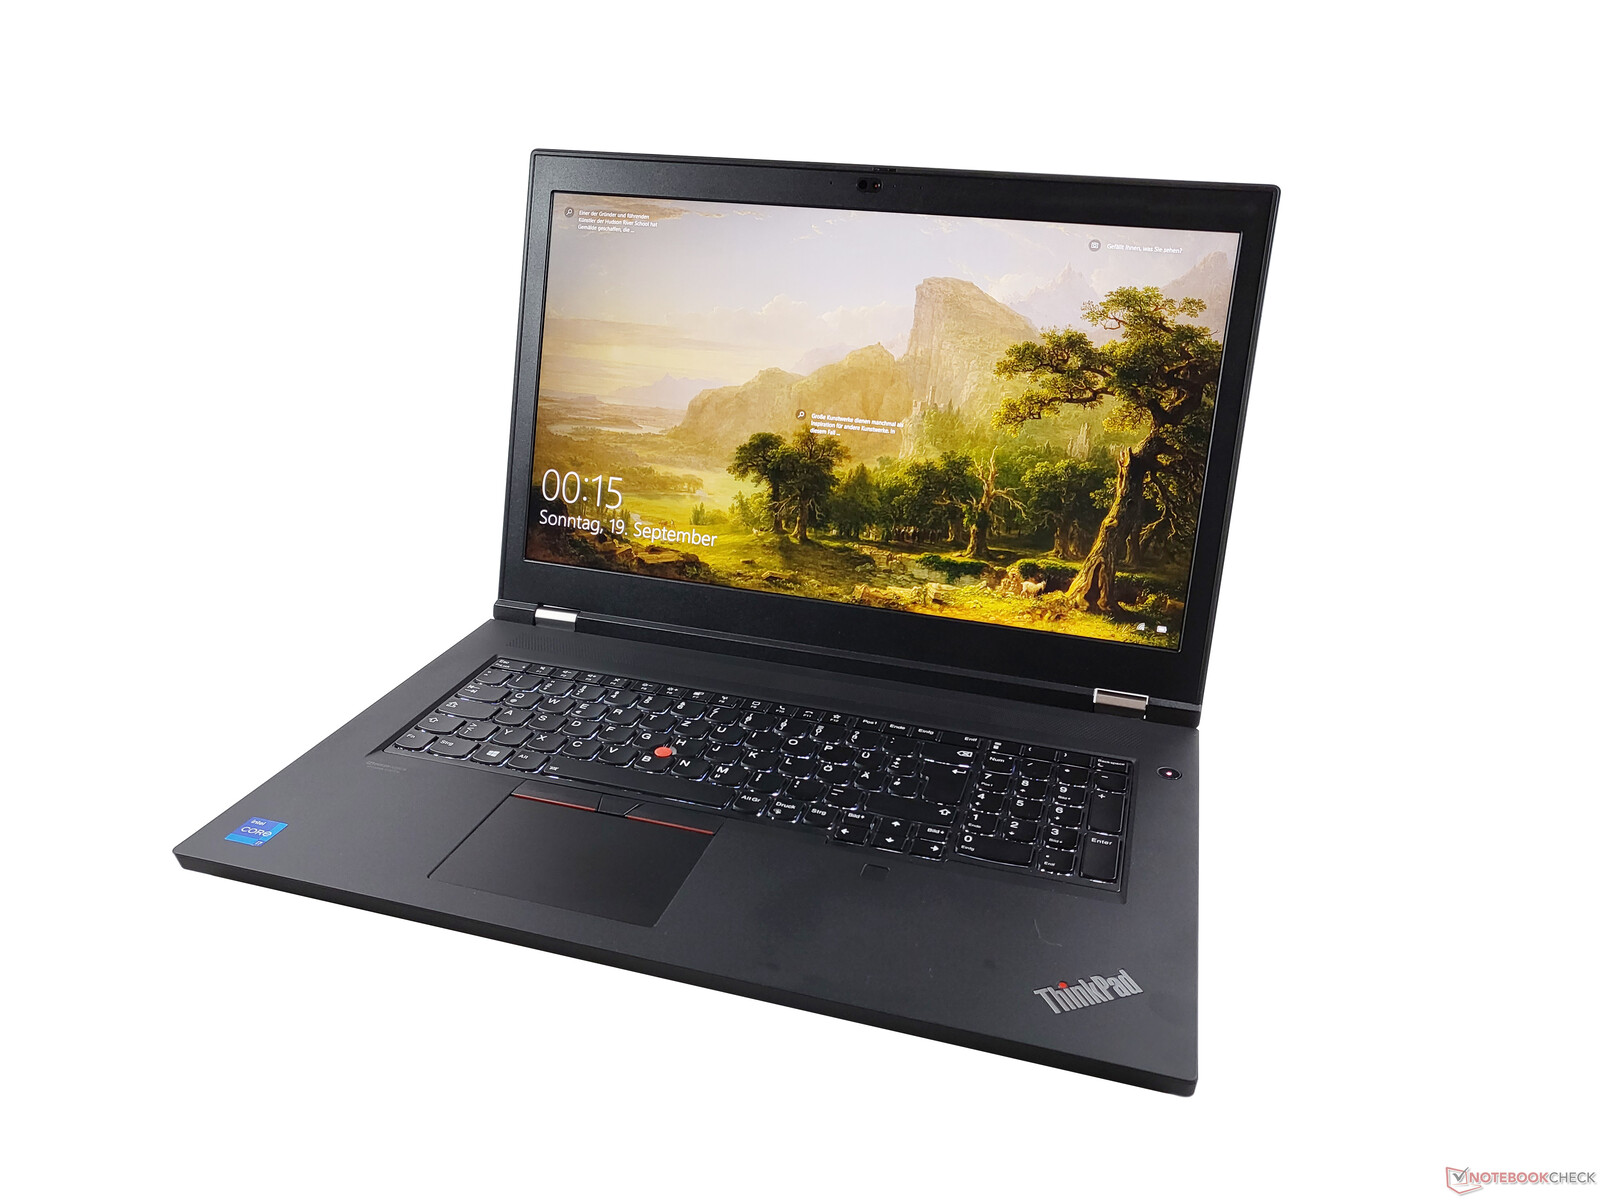
Lenovo ThinkPad P17 G2 Laptop Review: Massive workstation with internal upgrades

The 17-inch form factor is far from being the most popular choice, particularly when it comes to business laptops for enterprise customers. Systems in the latter category have to be small and lightweight to allow for greater portability. Although the Lenovo ThinkPad P17 G2 is portable as well, this mobile workstation's large weight and dimensions make it more suitable for stationary use. It is the only 17-inch ThinkPad on offer and its primary use case is providing enough performance for CAD and other compute-intensive tasks.
Potential competitors in comparison
Rating | Date | Model | Weight | Height | Size | Resolution | Price |
|---|---|---|---|---|---|---|---|
| 87.8 % v7 (old) | 10 / 2021 | Lenovo ThinkPad P17 G2-20YU0025G i7-11800H, RTX A2000 Laptop GPU | 3.6 kg | 28.38 mm | 17.30" | 1920x1080 | |
| 86.6 % v7 (old) | 12 / 2019 | Lenovo ThinkPad P73-20QR002DGE i7-9850H, Quadro RTX 3000 (Laptop) | 3.5 kg | 31 mm | 17.30" | 1920x1080 | |
| 89.8 % v7 (old) | 04 / 2021 | HP ZBook Fury 17 G7 119W5EA i9-10885H, Quadro RTX 4000 Max-Q | 2.9 kg | 26.9 mm | 17.30" | 3840x2160 | |
| 87 % v7 (old) | 09 / 2020 | Dell Precision 5000 5750 P92F W-10885M, Quadro RTX 3000 Max-Q | 2.5 kg | 19.5 mm | 17.00" | 3840x2400 | |
| 86.4 % v7 (old) | 05 / 2020 | Asus ProArt StudioBook Pro 17 W700G3T i7-9750H, Quadro RTX 3000 Max-Q | 2.5 kg | 18.4 mm | 17.00" | 1920x1200 |
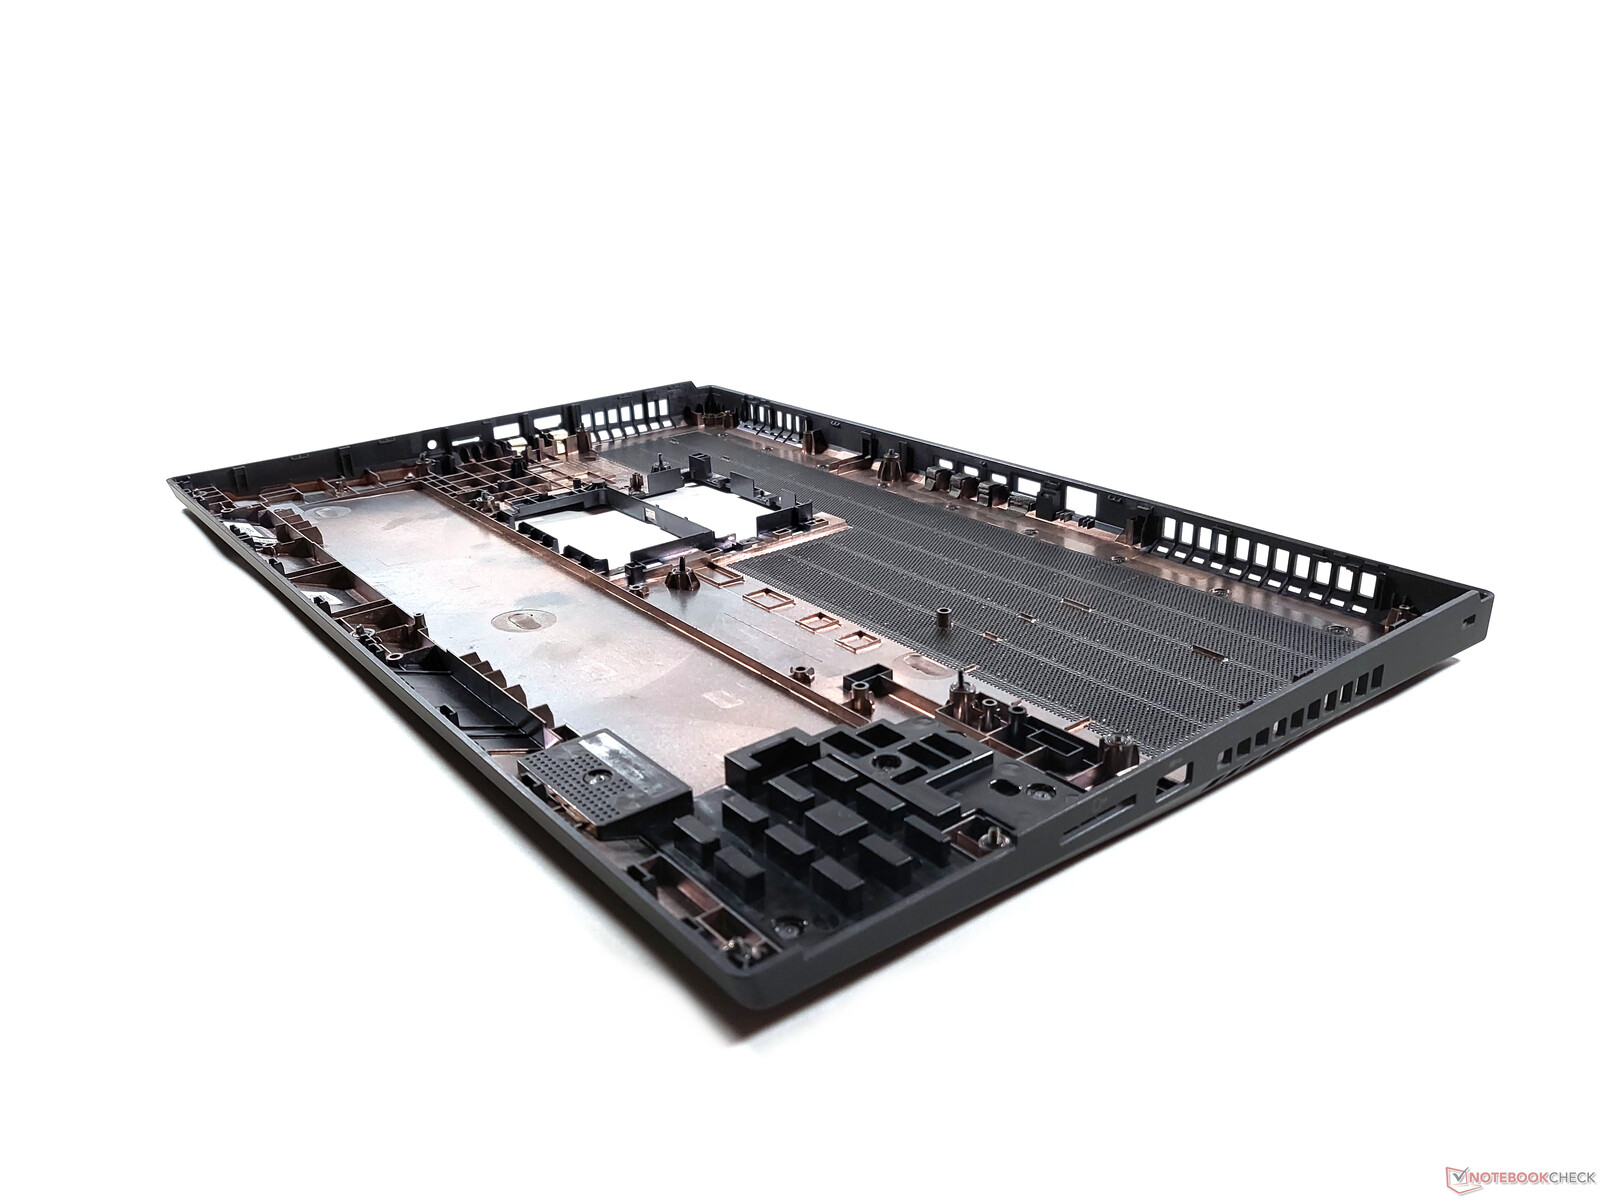
ThinkPad Chassis: Plastic exterior, magnesium base frame

While Lenovo already updated its biggest workstation last year, last year's changes only focused on the hardware. In fact, barely anything has changed in terms of the design since the ThinkPad P70 from 2015. Although compared to the Lenovo ThinkPad P73, a few minor details have changed, there have not been any major revisions.
This time around, the massive magnesium/aluminum base cover of previous generations has been replaced by a fiber-reinforced plastic shell. The internal, traditional ThinkPad structure frame consists of magnesium. As a result, the rigidity of the base unit is quite high. The plastic is coated in a velvety texture that makes it a smudge and fingerprint magnet. The display cover is surprisingly rigid with very little flexing when trying to twist it from the corners and barely any yielding under pressure. Unfortunately, the same does not hold true for the palm rest, which yields very easily near the smartcard reader and does not transition smoothly to the base at the front edge of the chassis.
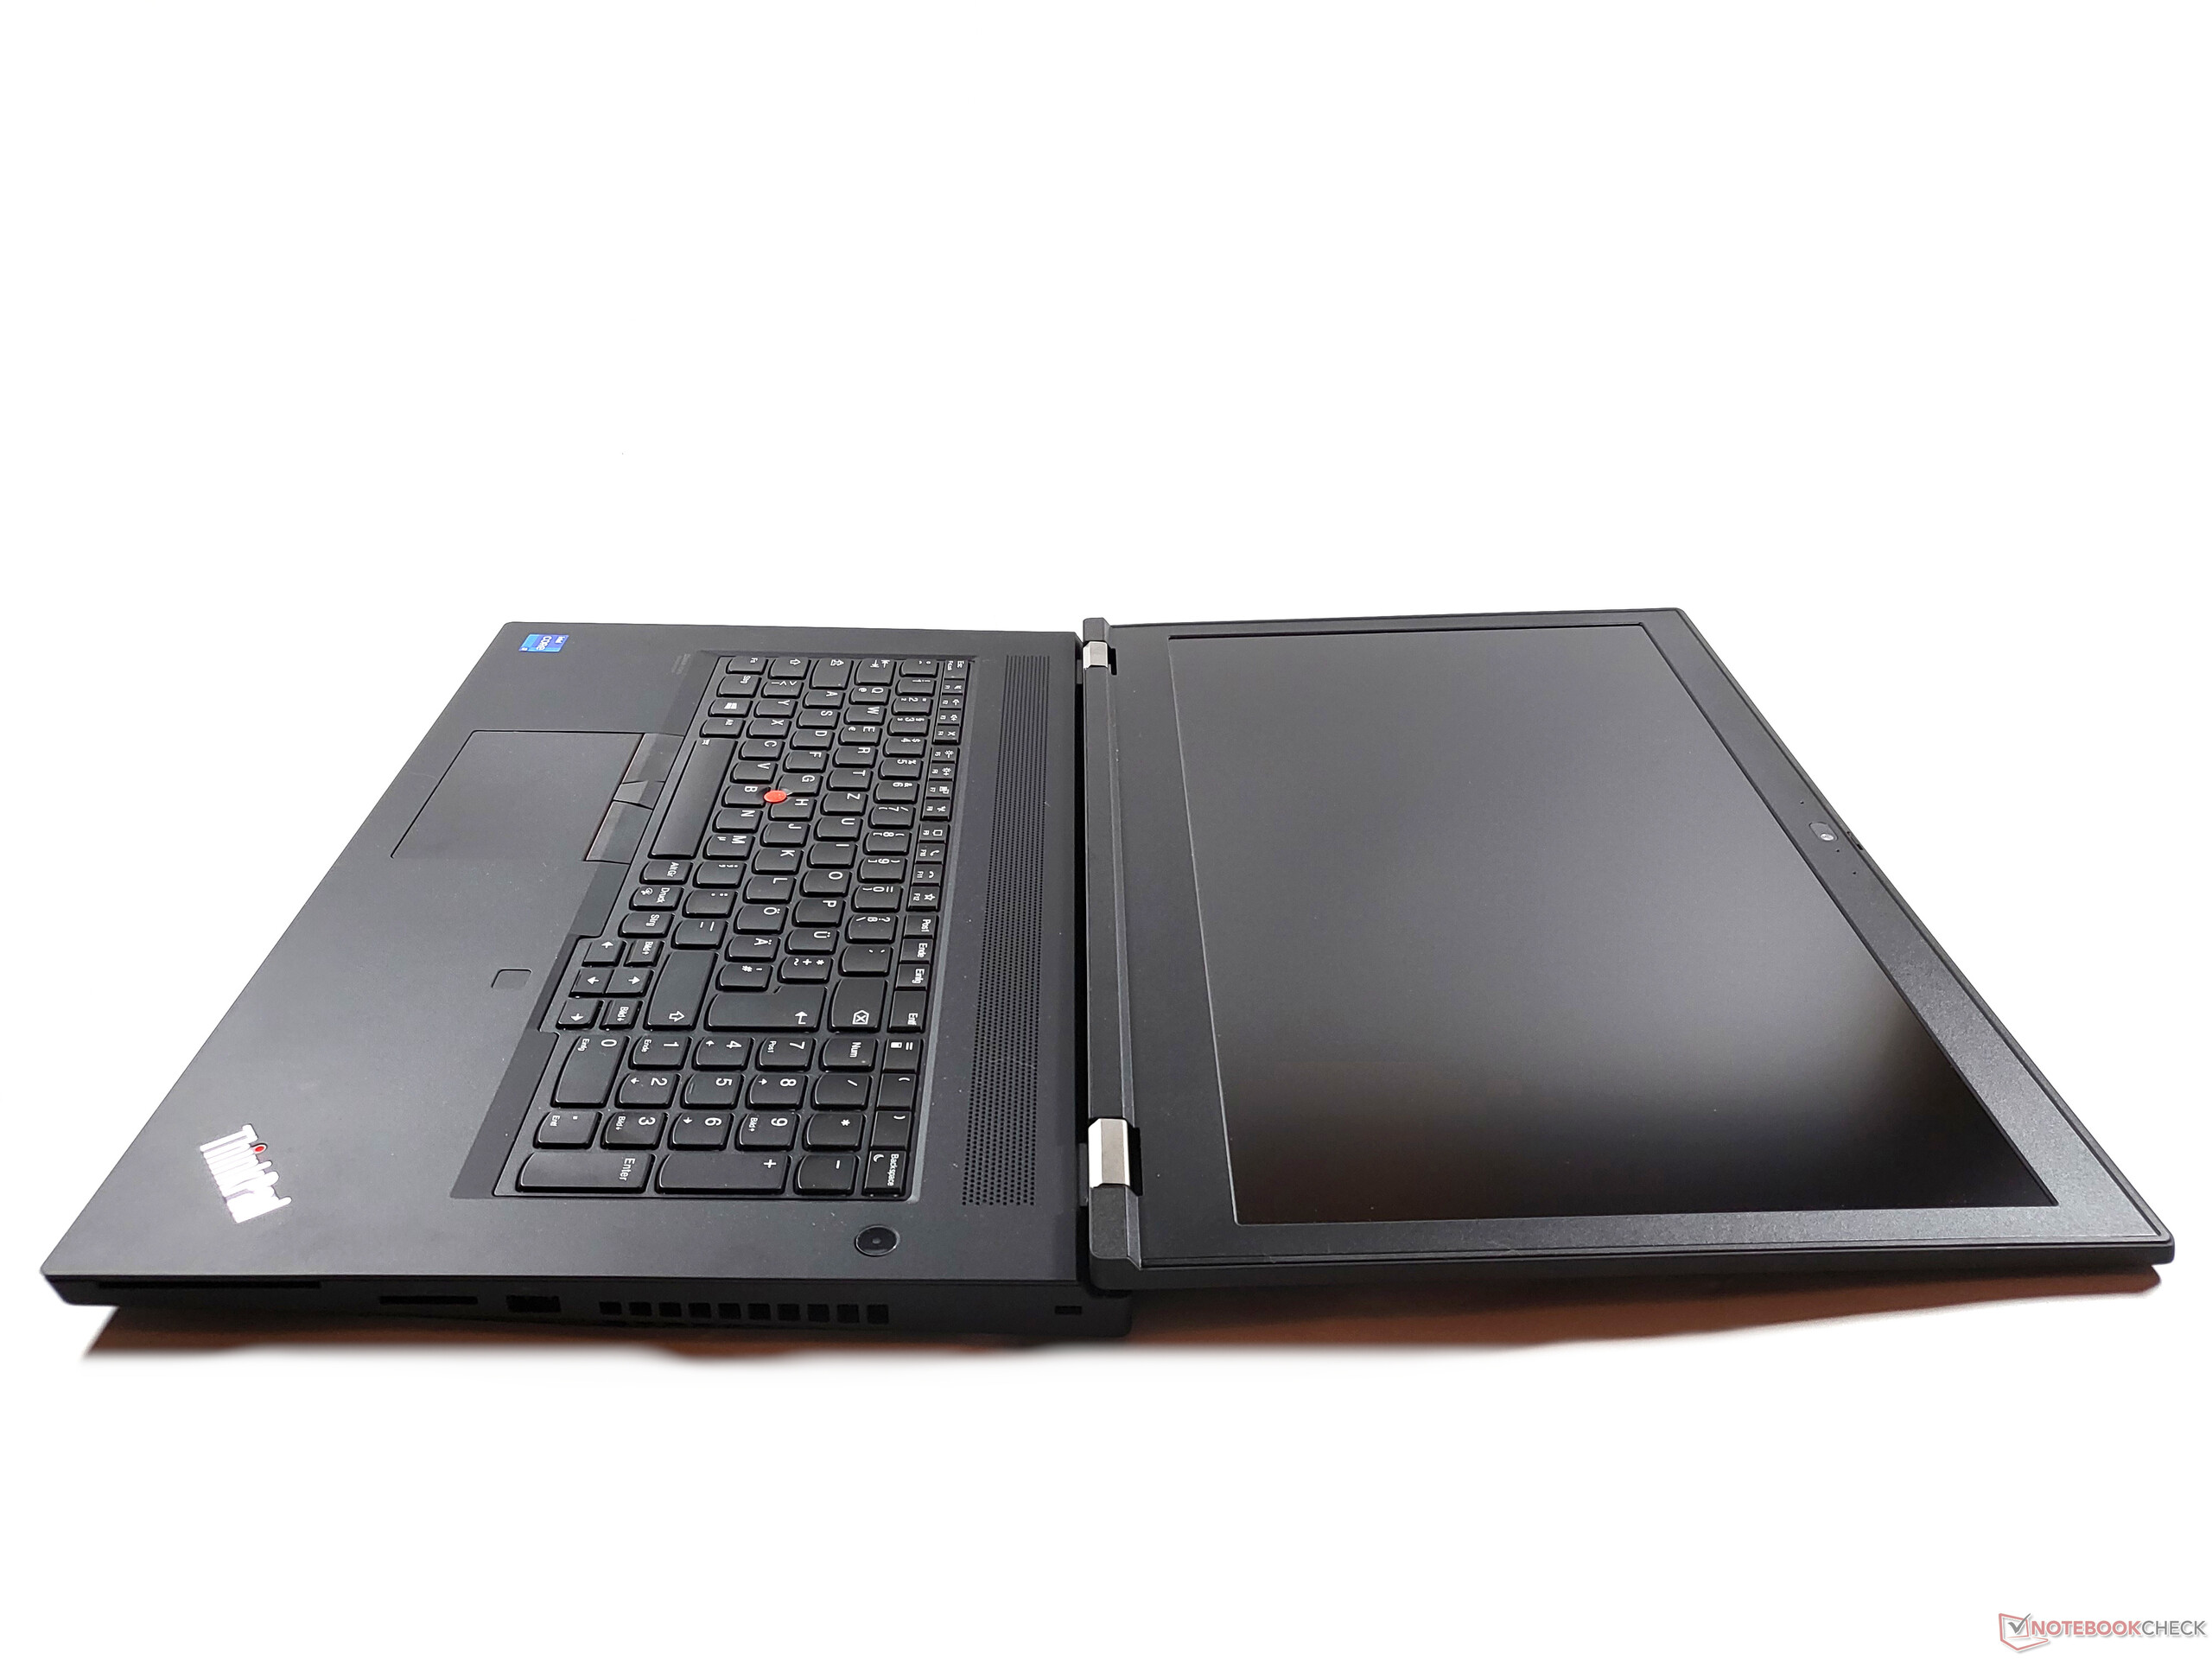
The two silver metal hinges within the base unit are firm enough to hold the display in place, while still allowing users to open the laptop with one hand. The maximum angle of the display is greater than 180 degrees.


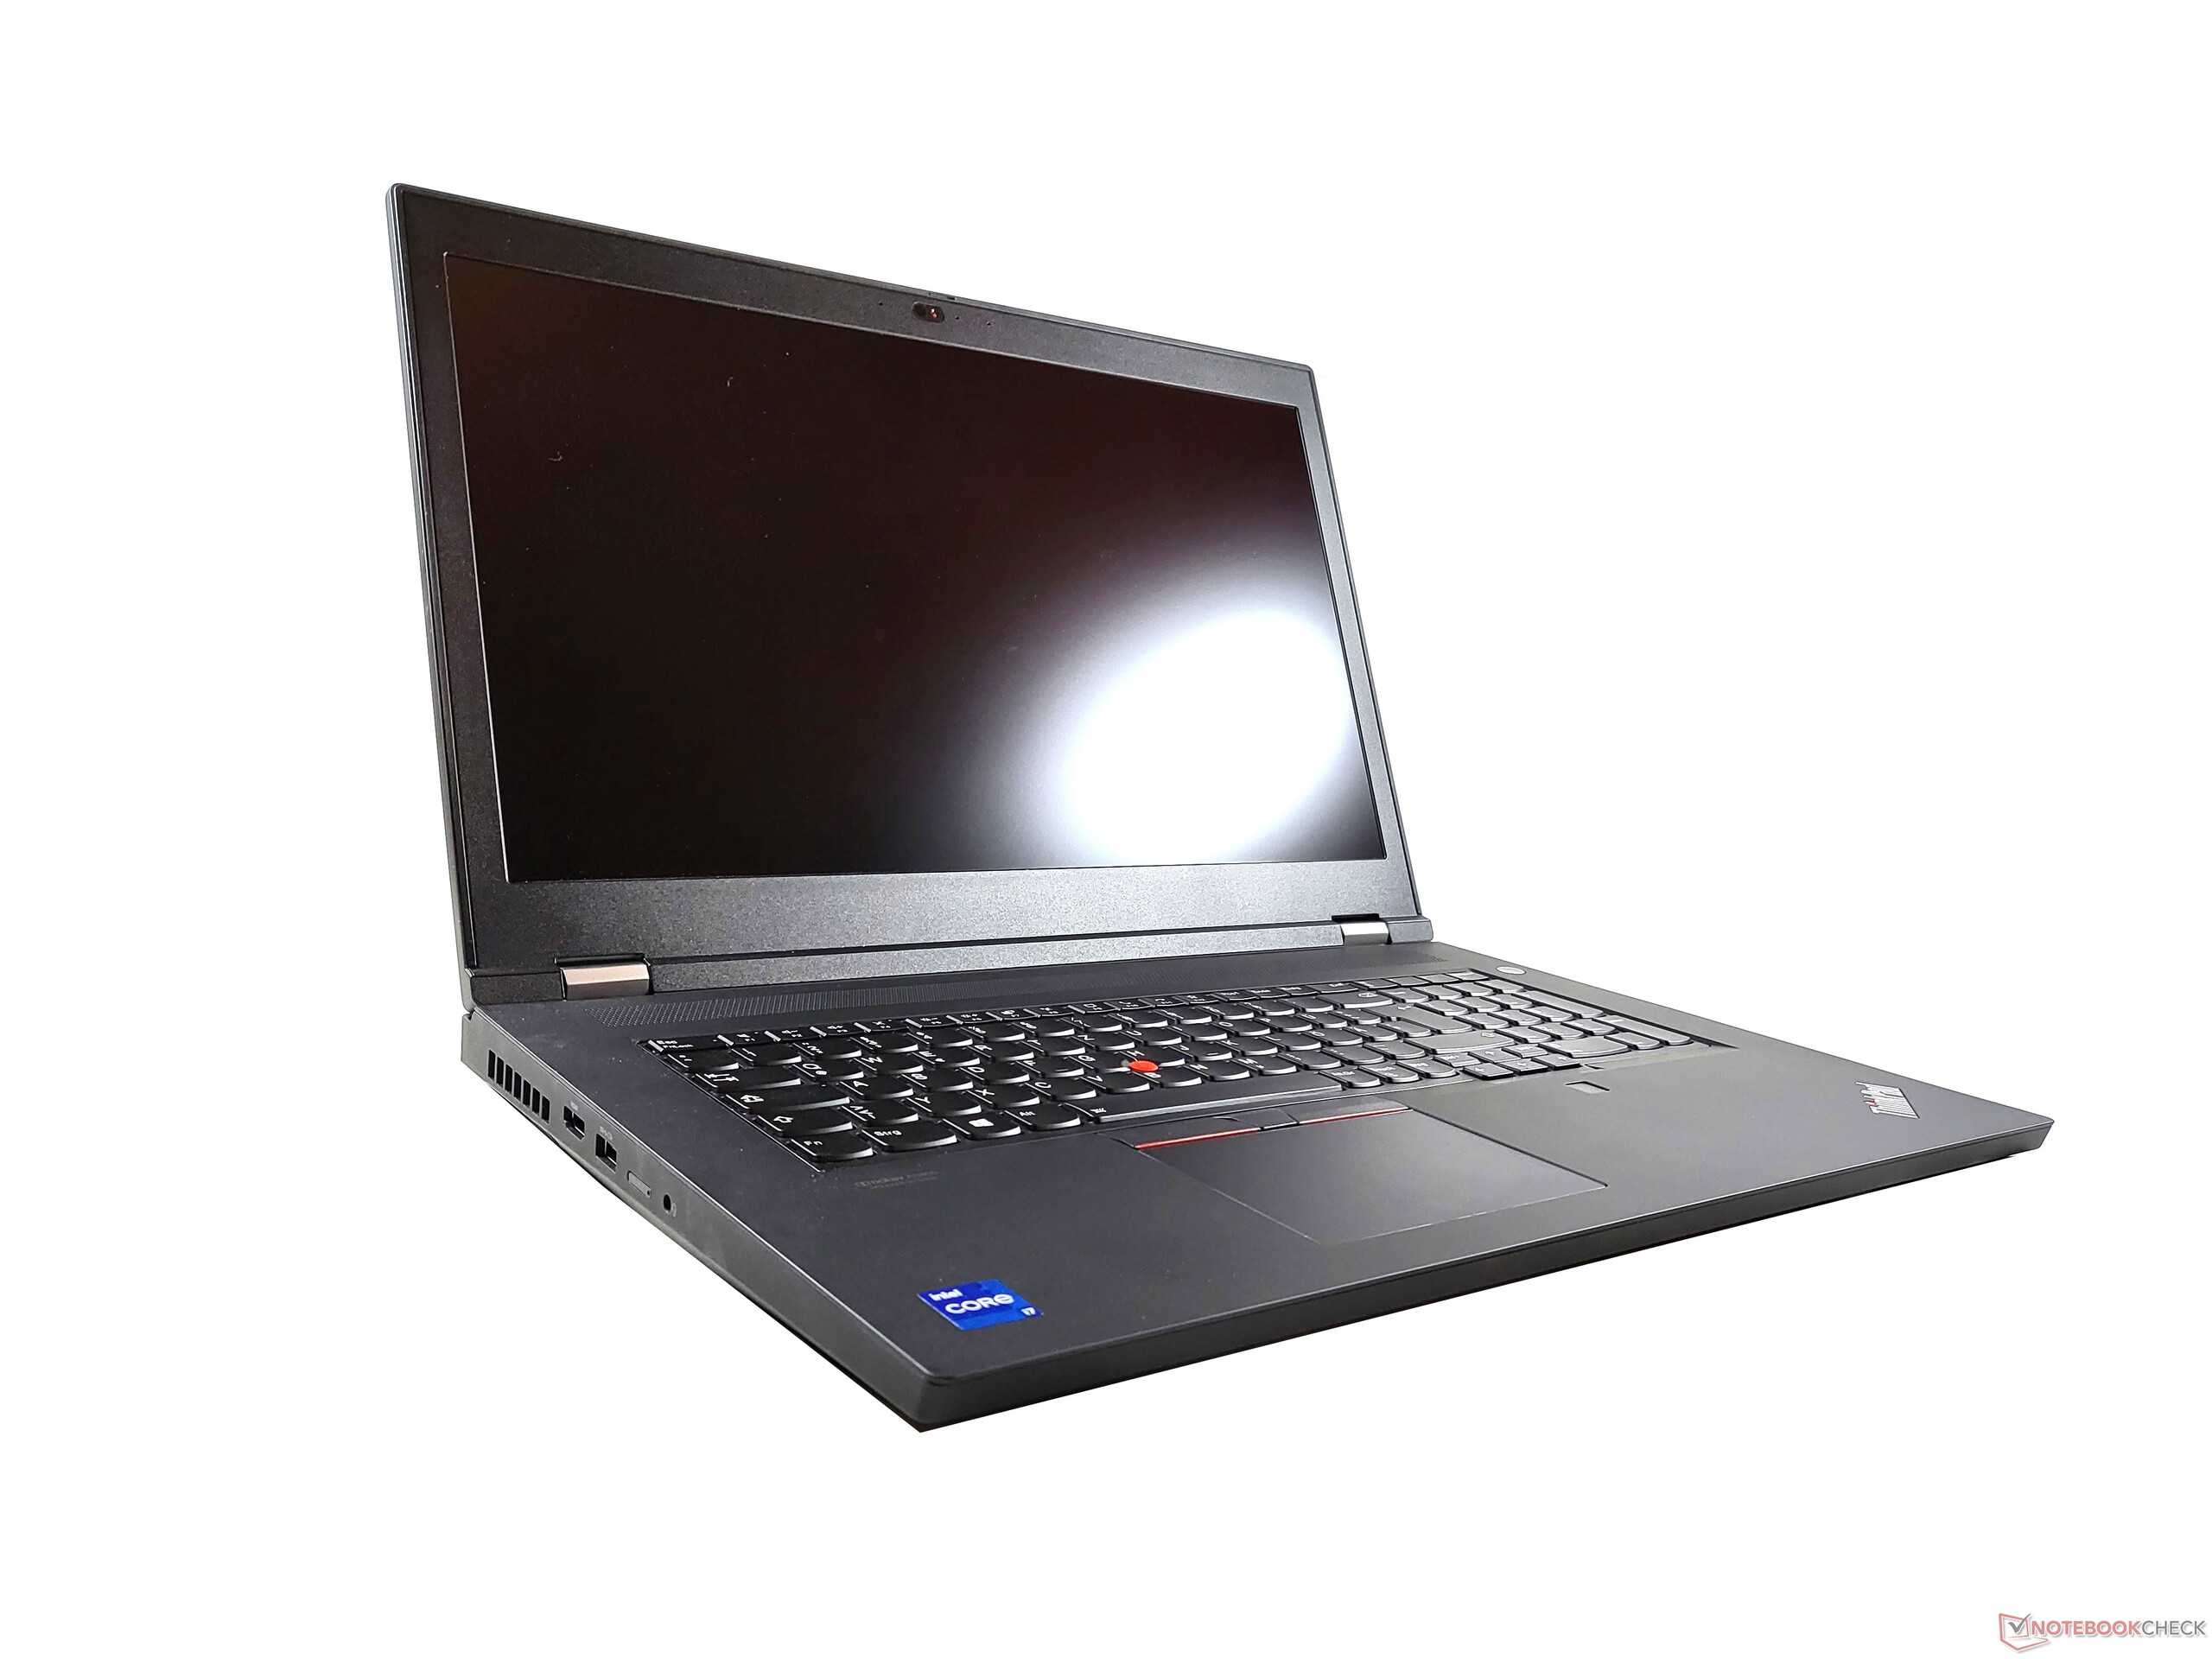


While we would describe the build with the fairly positive word "traditional", the size of the display bezels and the chassis itself are simply outdated. Apart from last year's ThinkPad P73, no other 17-inch workstation in our comparison exceeds the colossal dimensions, which include the thickness and weight, of the ThinkPad P17 Gen 2. Thus, using this Lenovo laptop when traveling will likely be the exception.
Connectivity: Lenovo laptop with many ports
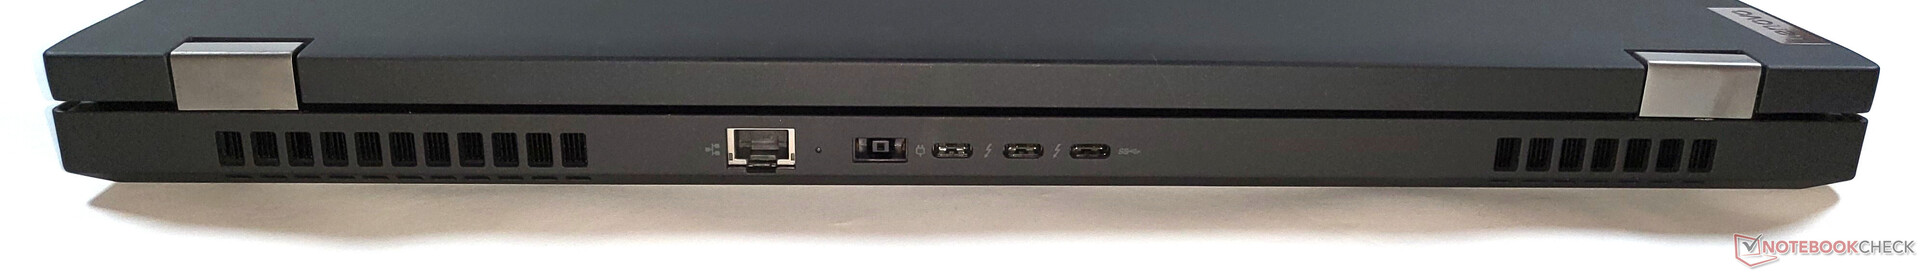
The spacious case has allowed Lenovo to include numerous ports. That being said, the port selection is slightly worse compared to the ThinkPad P73, since the ThinkPad P17 G2 offers one USB-A port less. It should be noted that this is the first P-series laptop with support for Thunderbolt 4.
As with all P-series ThinkPad workstations, the ThinkPad P17 Gen 2 is charged via the proprietary slim tip port. Although USB-C power delivery is supposedly supported as well, it did not recognize a 65W USB-C charger. As with the smaller ThinkPad P1 G4, a 90W USB-C charger should work, however.

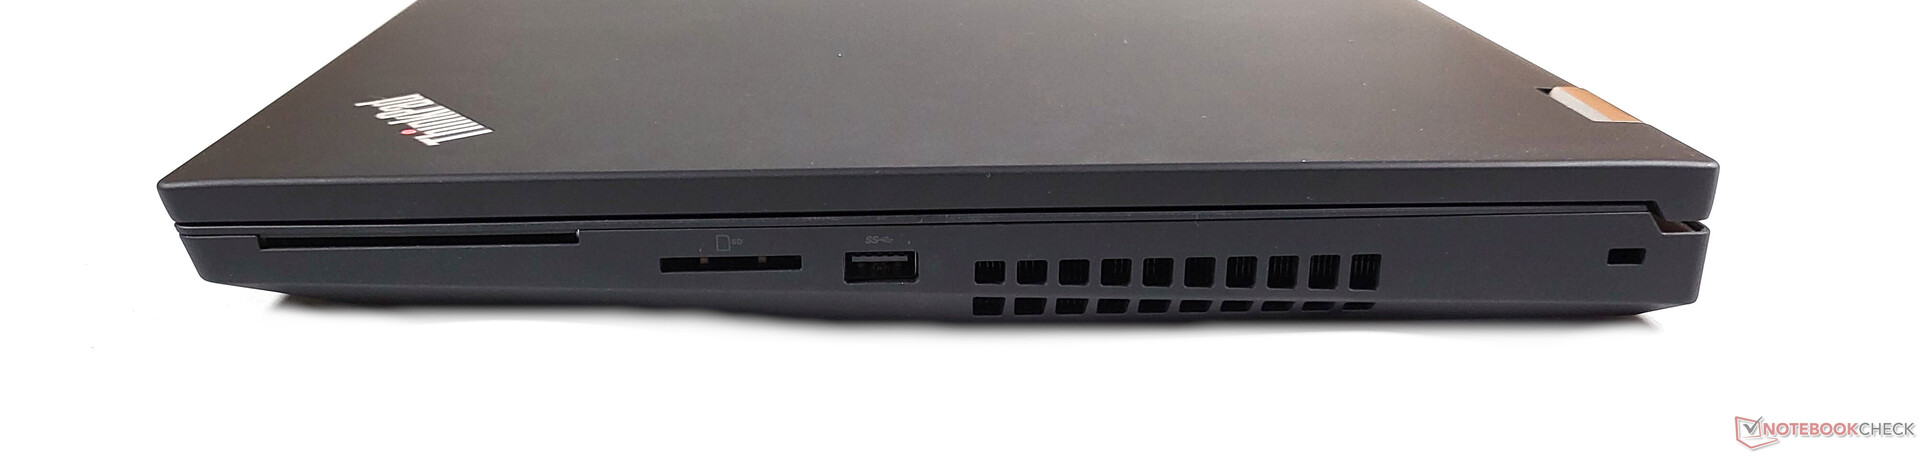
SD card reader
A benchmark with our 128GB AV Pro microSD V60 reference card shows the fast speeds of the integrated card reader. The performance is on par with other workstation laptops. When fully inserted, the SD card sits flush against the edge.
| SD Card Reader | |
| average JPG Copy Test (av. of 3 runs) | |
| Lenovo ThinkPad P17 G2-20YU0025G (Toshiba Exceria Pro SDXC 64 GB UHS-II) | |
| Lenovo ThinkPad P73-20QR002DGE (Toshiba Exceria Pro SDXC 64 GB UHS-II) | |
| Asus ProArt StudioBook Pro 17 W700G3T (Toshiba Exceria Pro SDXC 64 GB UHS-II) | |
| HP ZBook Fury 17 G7 119W5EA (AV Pro 60) | |
| Dell Precision 5000 5750 P92F (Toshiba Exceria Pro SDXC 64 GB UHS-II) | |
| Average of class Workstation (49.6 - 189.3, n=11, last 2 years) | |
| maximum AS SSD Seq Read Test (1GB) | |
| Asus ProArt StudioBook Pro 17 W700G3T (Toshiba Exceria Pro SDXC 64 GB UHS-II) | |
| Lenovo ThinkPad P73-20QR002DGE (Toshiba Exceria Pro SDXC 64 GB UHS-II) | |
| Lenovo ThinkPad P17 G2-20YU0025G (Toshiba Exceria Pro SDXC 64 GB UHS-II) | |
| Dell Precision 5000 5750 P92F (Toshiba Exceria Pro SDXC 64 GB UHS-II) | |
| HP ZBook Fury 17 G7 119W5EA (AV Pro 60) | |
| Average of class Workstation (87.6 - 227, n=11, last 2 years) | |
Communication
In addition to the previously mentioned RJ45 Ethernet connection, the Lenovo ThinkPad P17 G2 of course also comes with Wi-Fi support. With the brand-new Wi-Fi 6E module AX210, the manufacturer relies on Intel here as well. Slightly disappointing: While the transfer speeds are decent when receiving data, the transmissions speeds fall short of our expectations.
Our test device includes the necessary internals for the Lenovo ThinkPad P17 Gen 2's optional WWAN/LTE module.
Webcam
Lenovo has finally started to include 1080p webcams in specific ThinkPad models. Unfortunately, the ThinkPad P17 G2 did not make the cut. As a result, the integrated 720p does not offer much in terms of quality and is only sufficient for video calls.


Security
Regardless of which security feature you need, there is a high likelihood that the Lenovo P17 G2 supports it. Authentication is secured with a smartcard reader, a fingerprint sensor and an infrared camera. Meanwhile, there is a "ThinkShutter" webcam shutter for better privacy and a Kensington Lock to protect against theft. In the event that the ThinkPad is lost, it can be located with the help of the BIOS' Computrace feature.
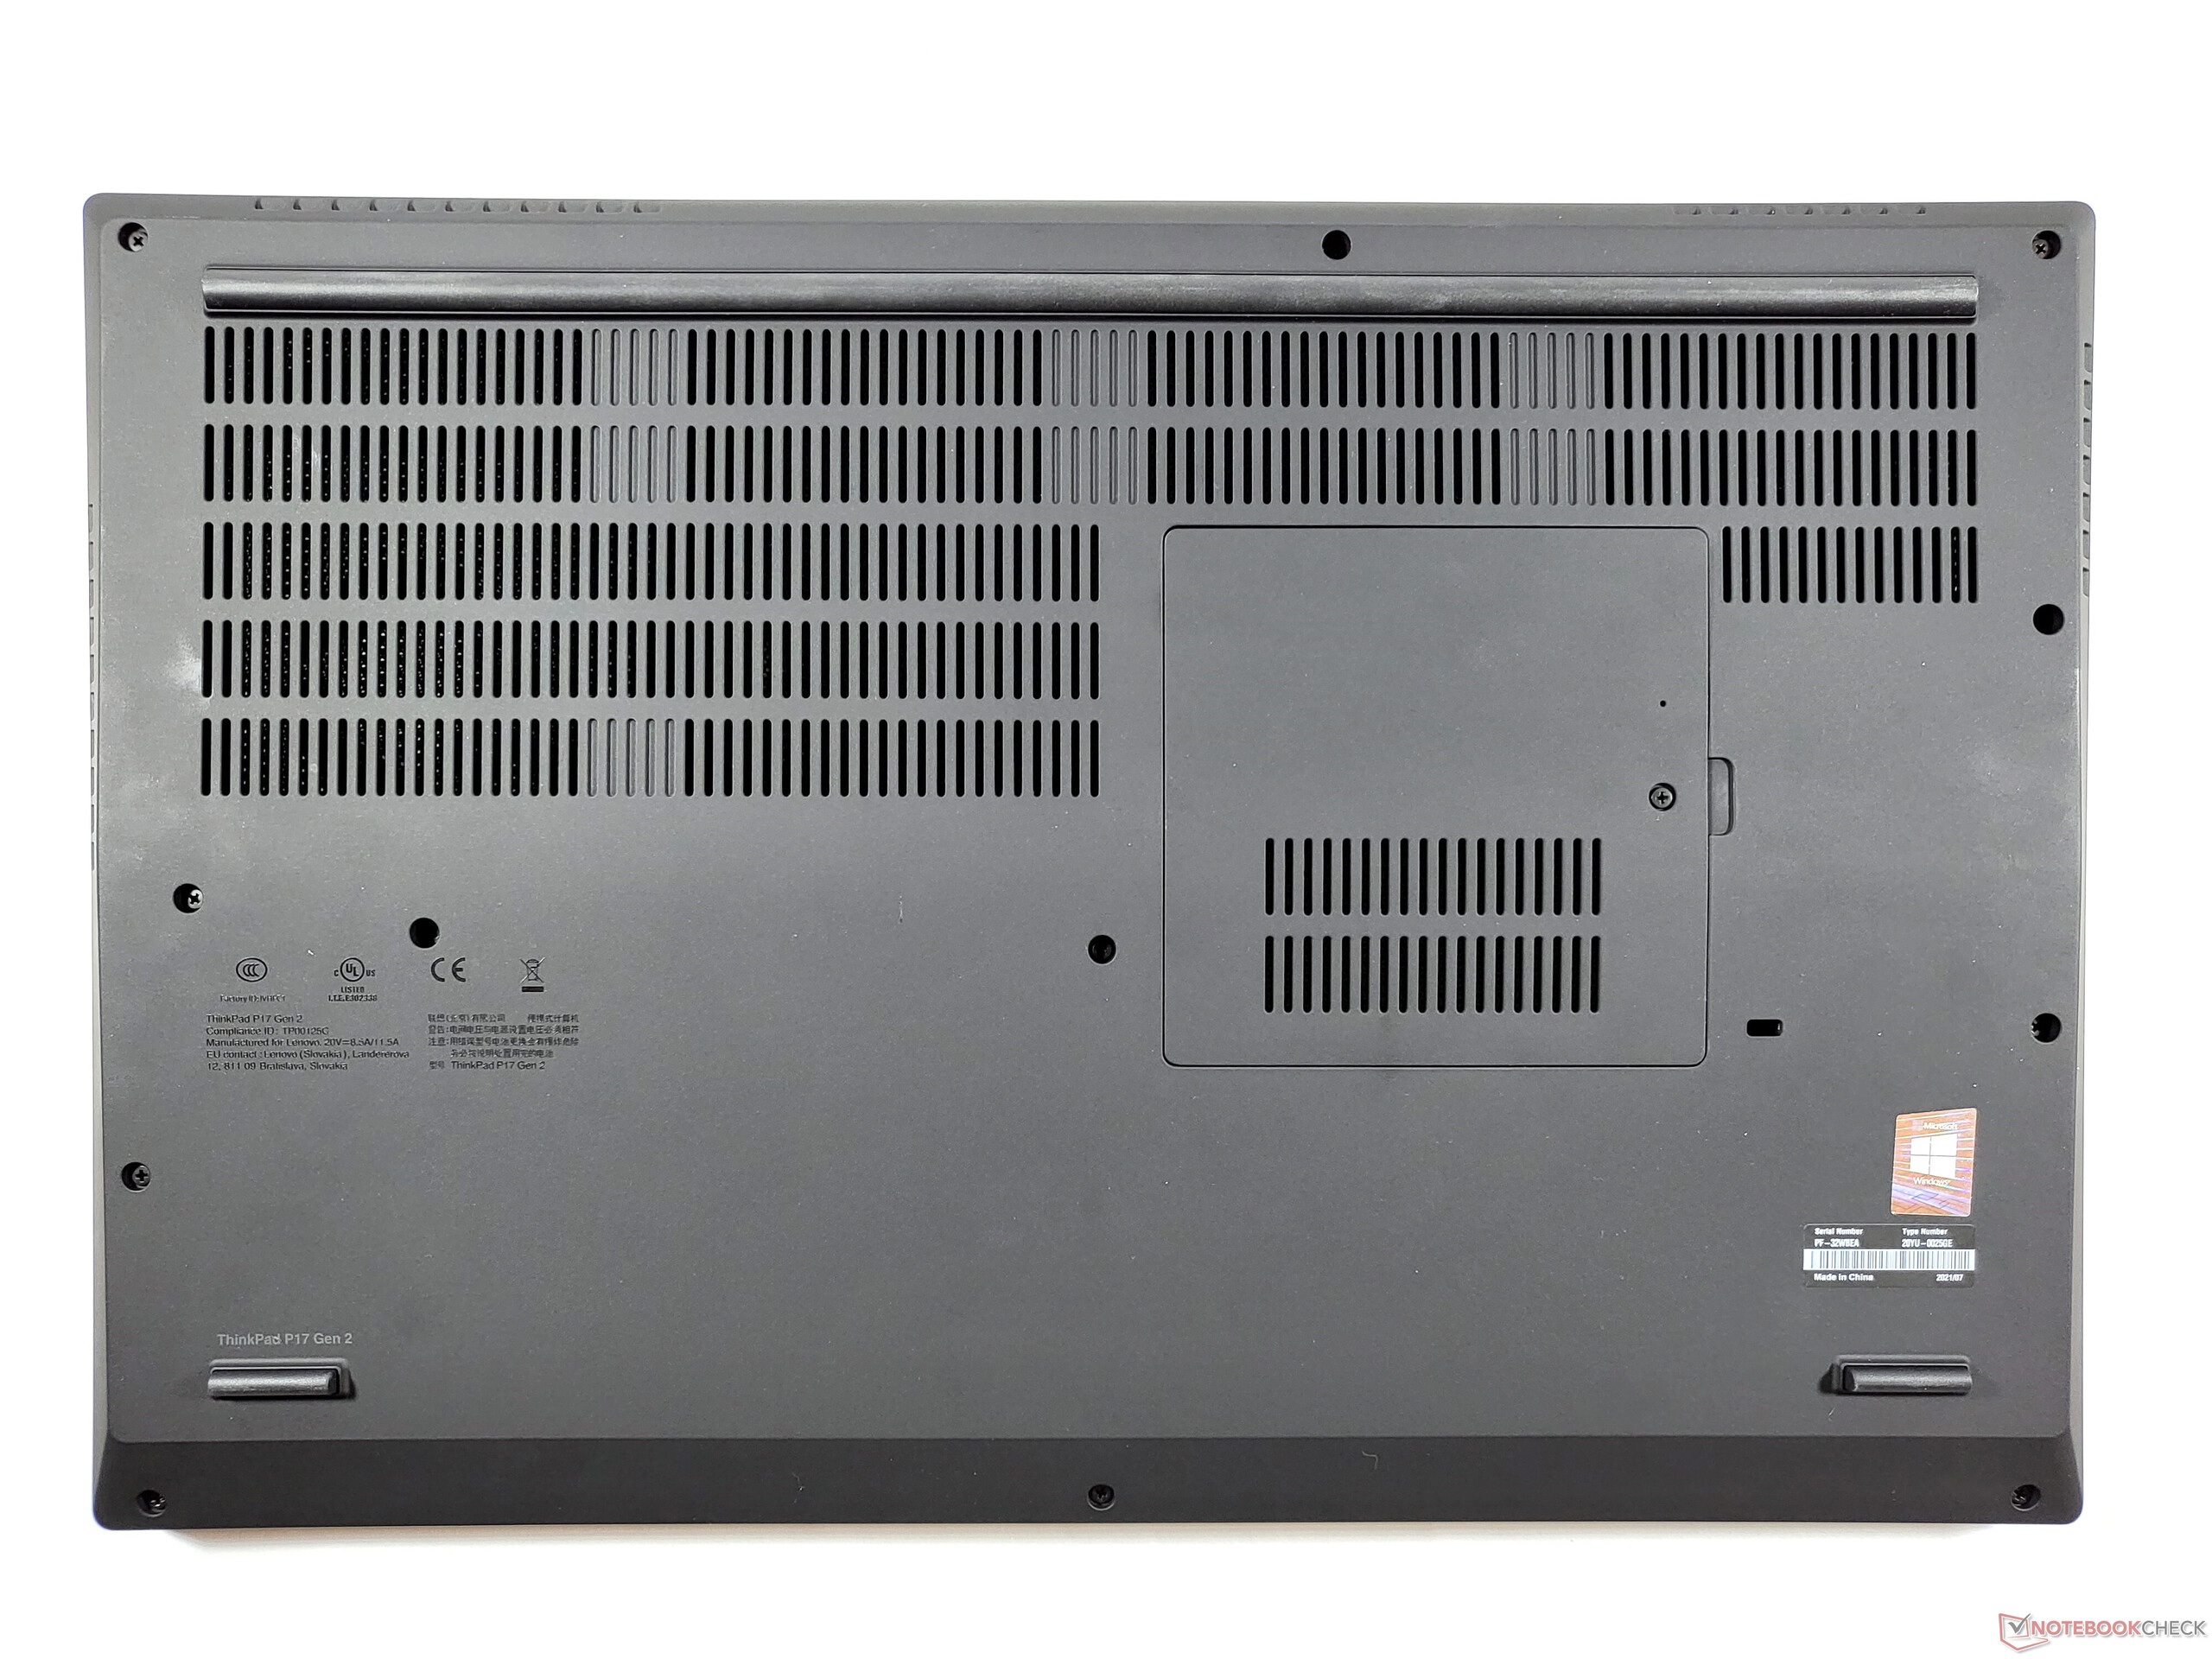
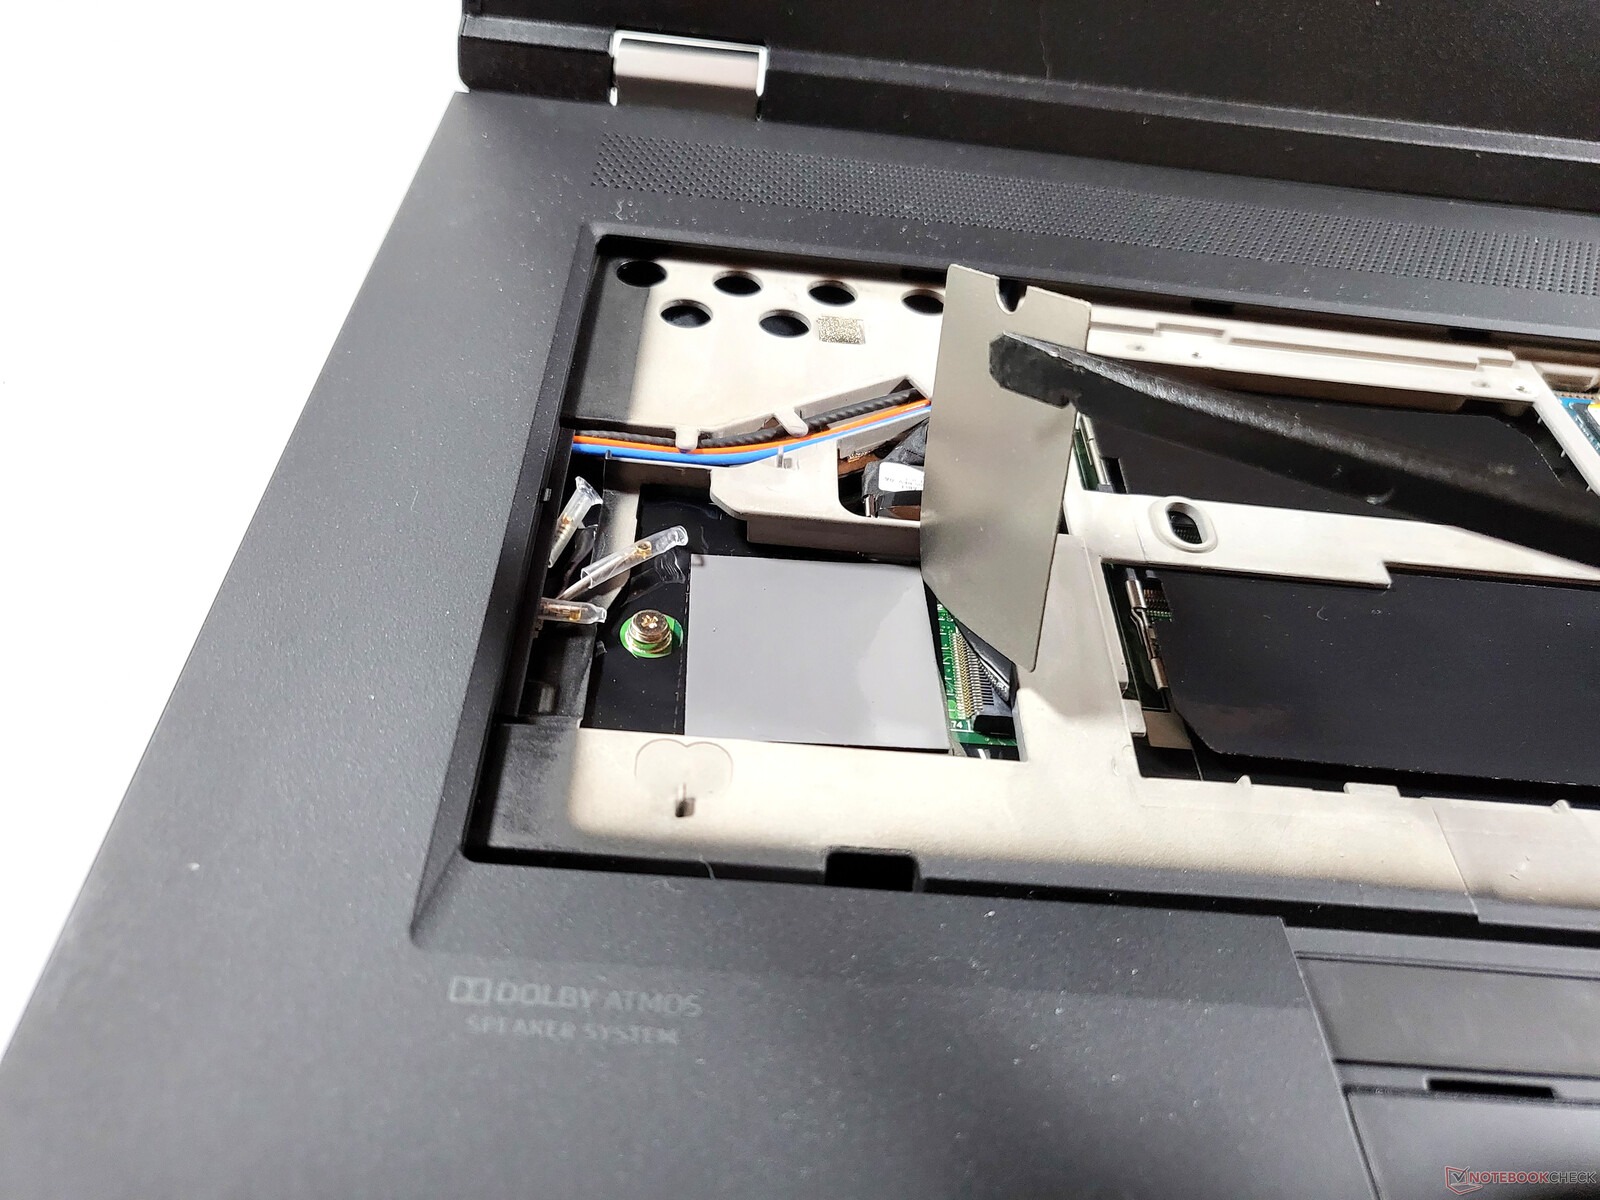
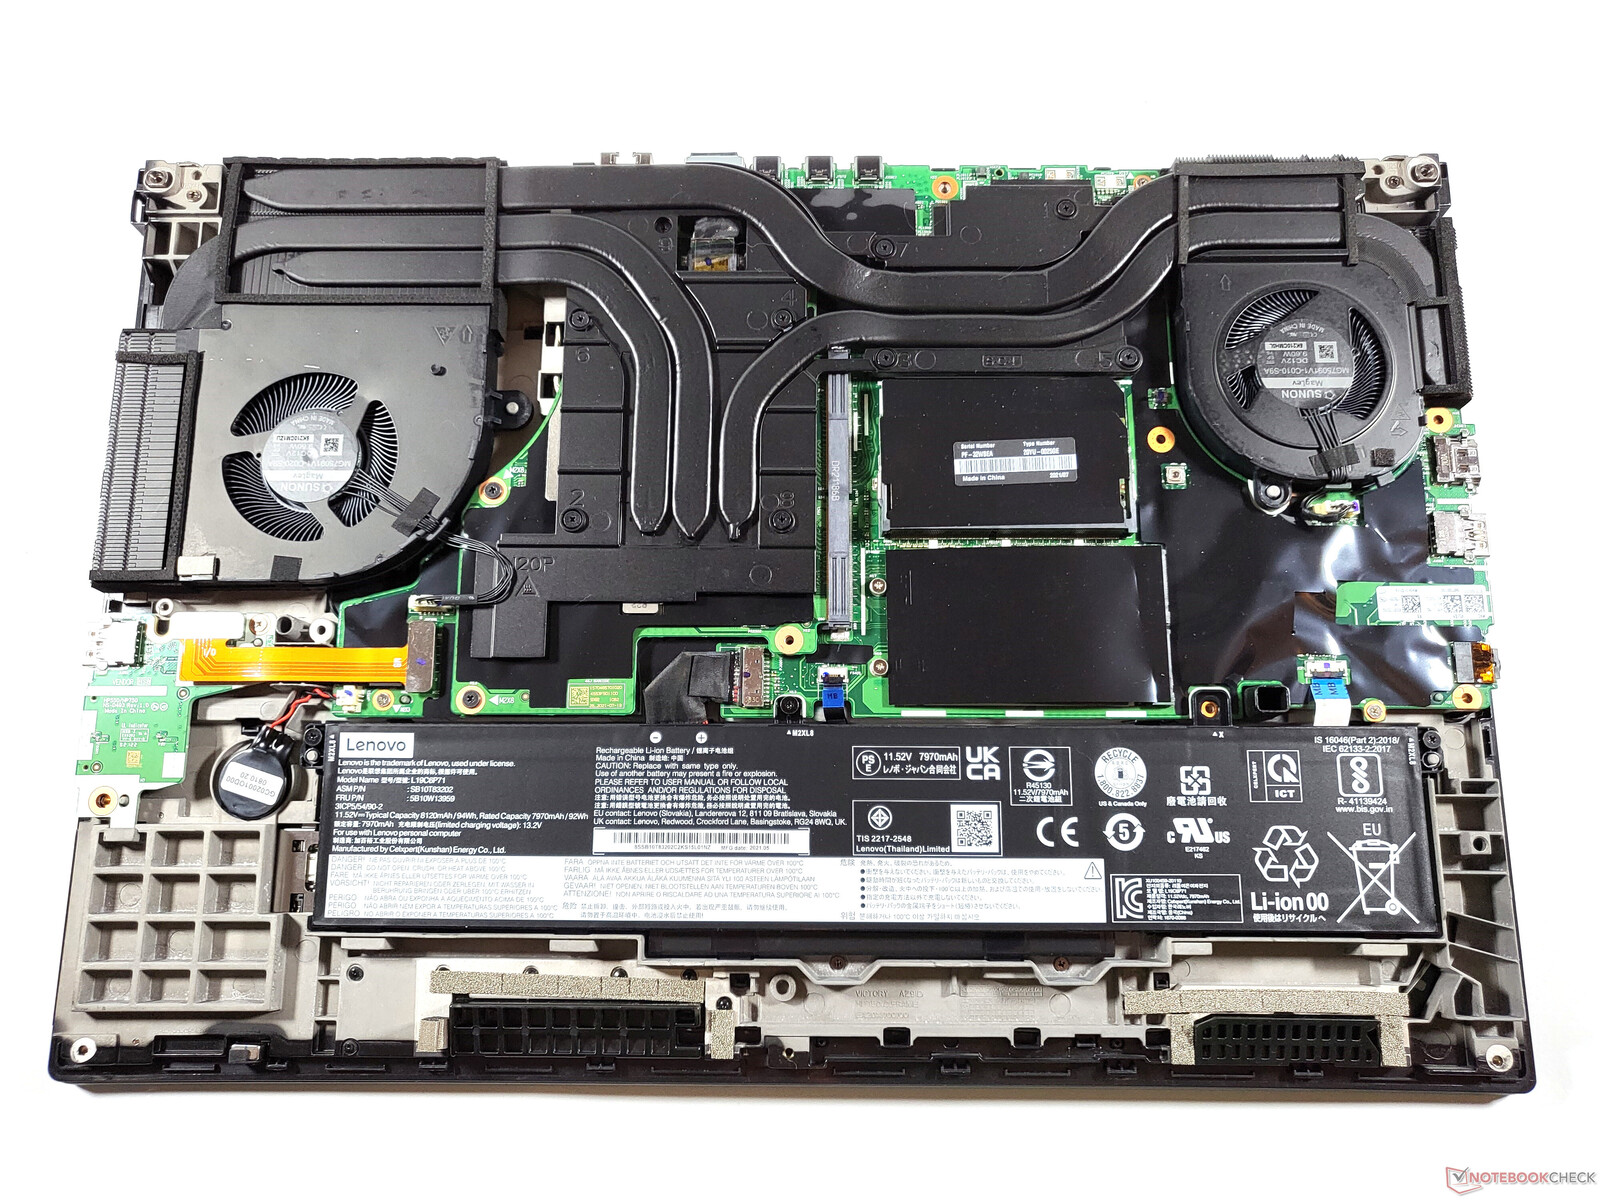
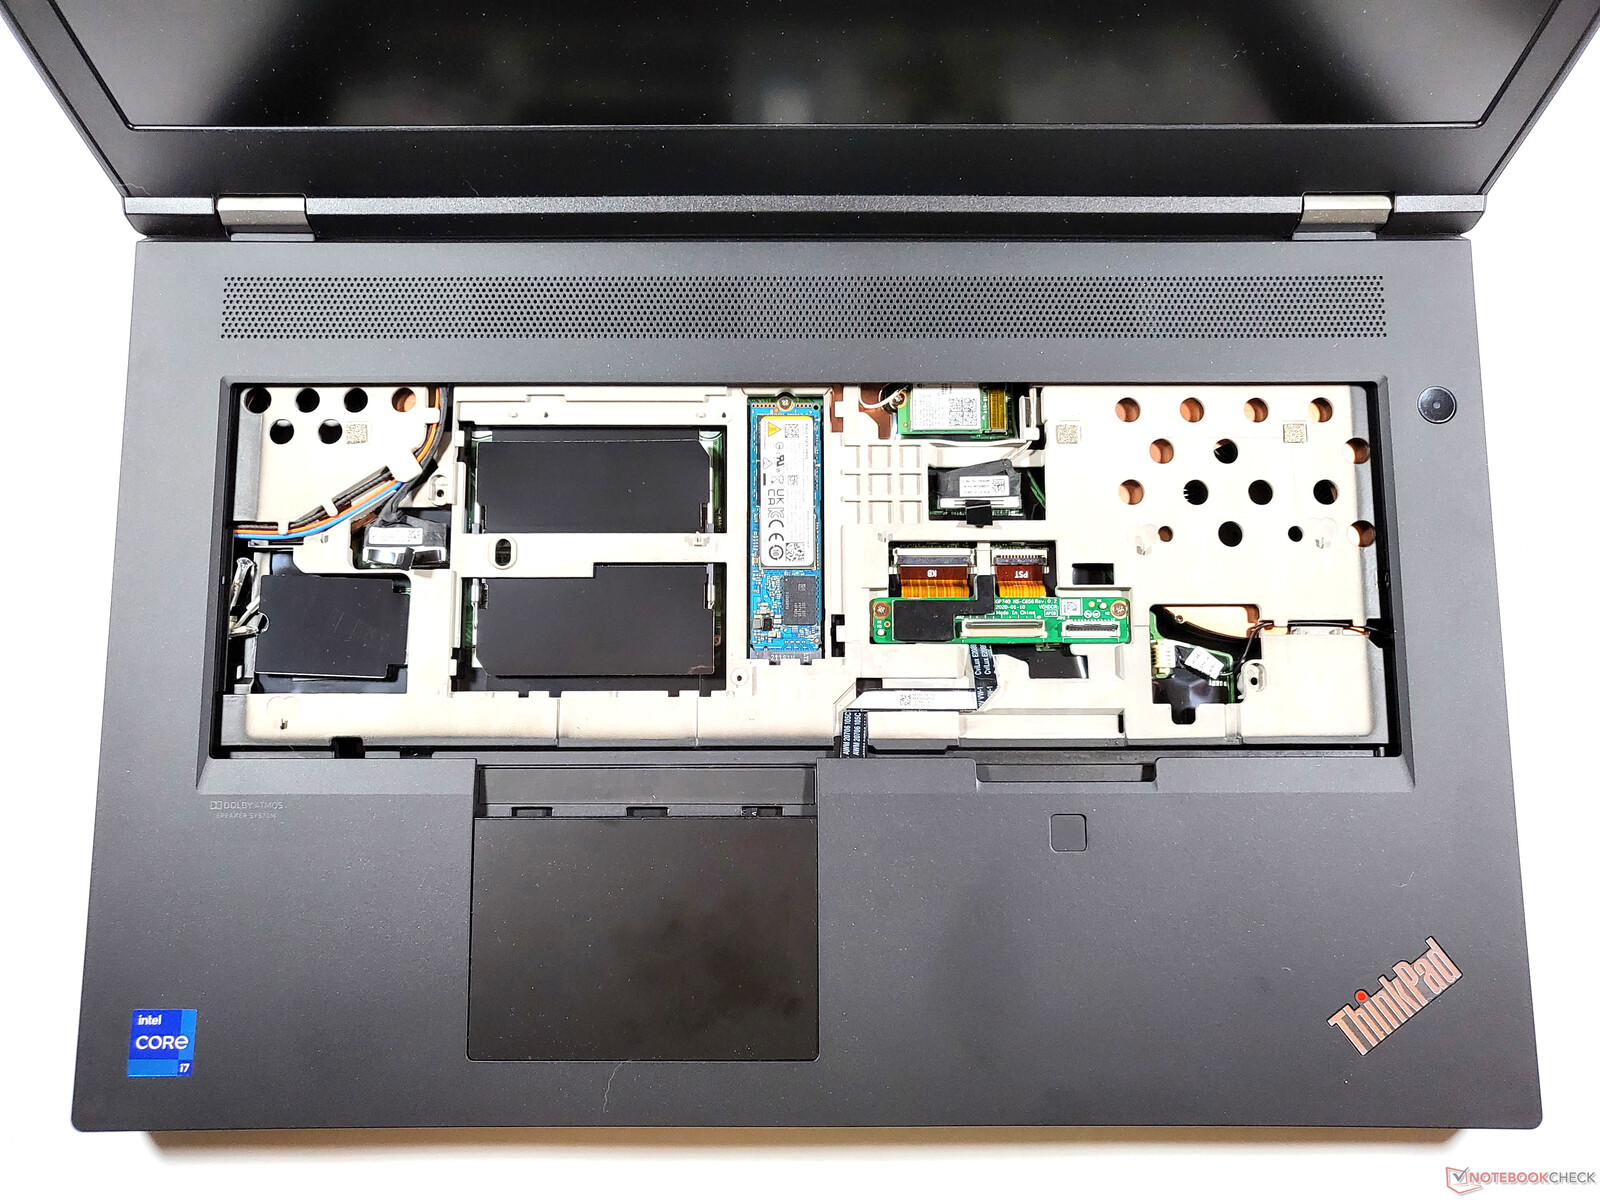
Maintenance
Extensively upgradeable, but sometimes difficult - this is how you can describe the maintainability of older P series ThinkPads. For example, in order to clean the fans of the ThinkPad P73, the entire case including the magnesium frame had to be disassembled. With the new ThinkPad P17, this is no longer the case. Removing the bottom plate is all that is required to access the battery and the cooling solution. On the bottom , there are fourteen Phillips screws with two of them hidden below the small maintenance hatch. After removing the screws, the plate is only secured by plastic clips.
There are two SODIMM and two unoccupied M.2 slots below the small service hatch. The main SSD, the other two SODIMM slots, and the M.2-2242 WWAN slot are located below the keyboard, which can also be removed fairly easily: It is secured by only two screws on the bottom. As with all ThinkPad laptops, Lenovo provides a hardware maintenance manual.

Input Devices: ThinkPad P17 G2 now with a clickpad
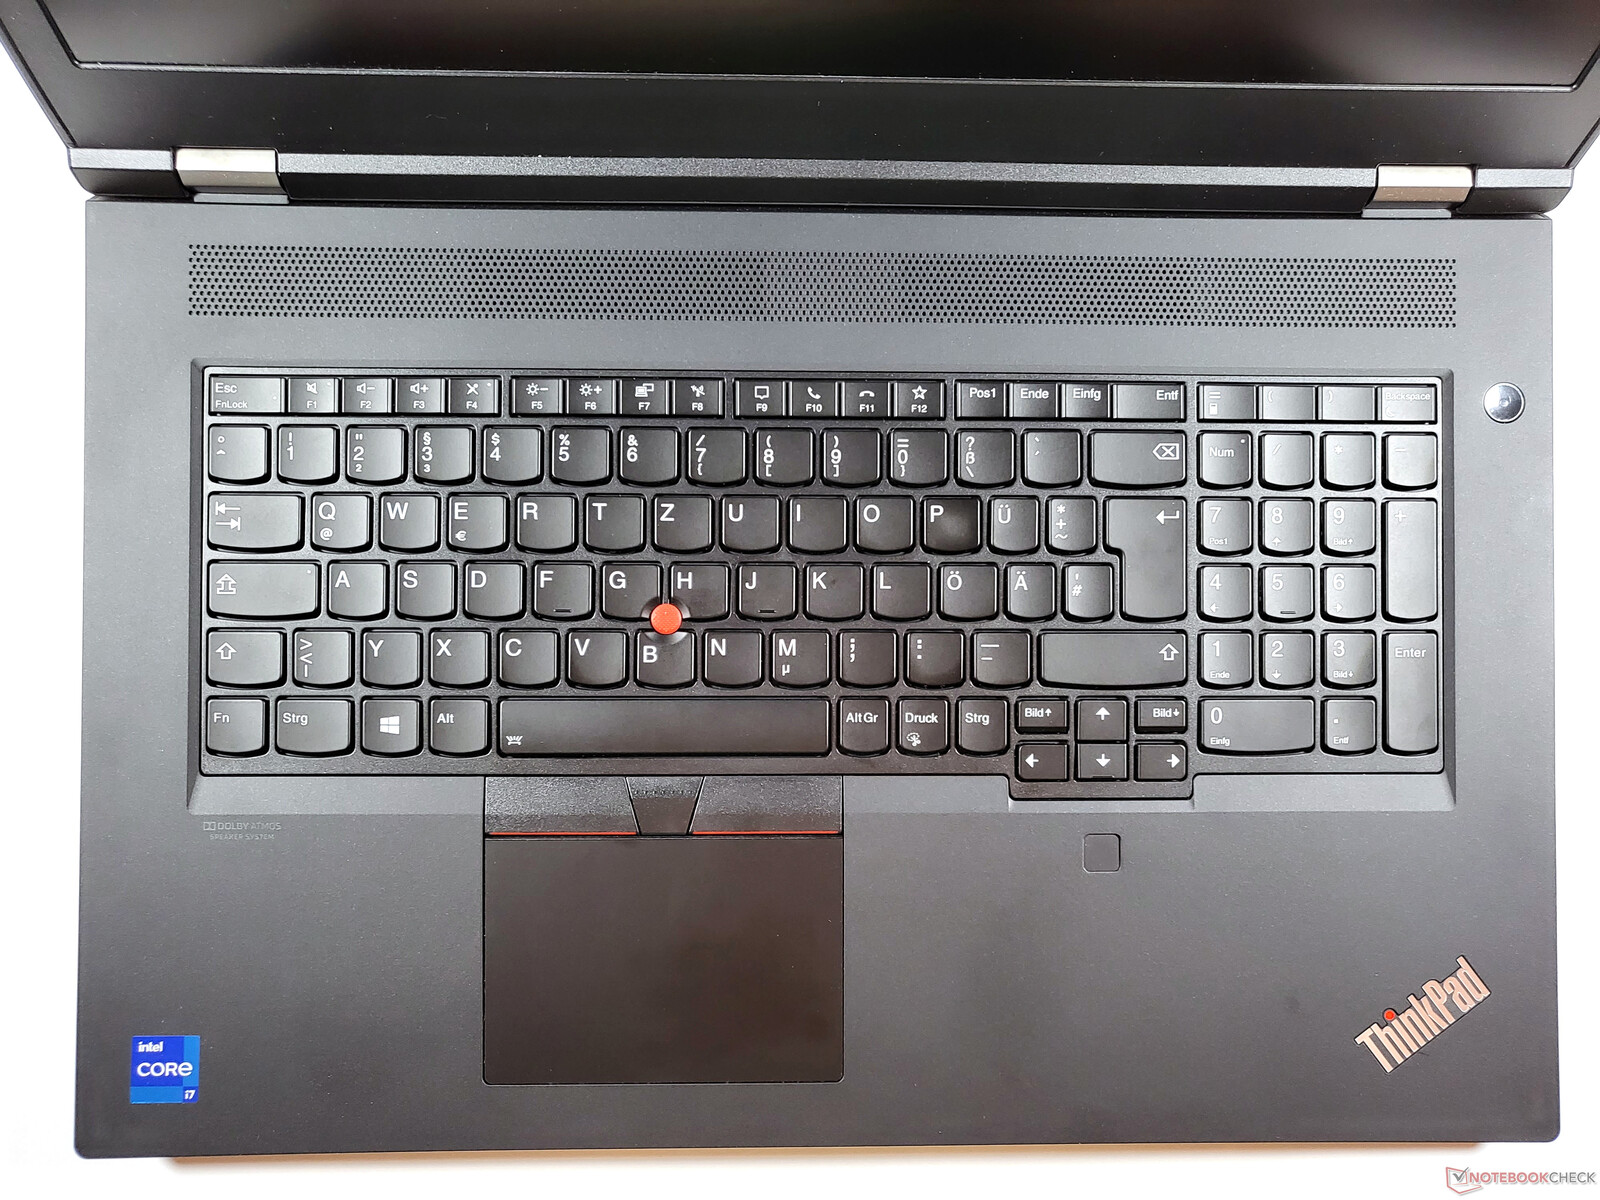
Keyboard
There have been no changes in regards to the keyboard, which has for the most part remained unchanged since the ThinkPad P72. The smooth keys come with backlighting with two brightness levels and 1.8mm travel, which is significantly more than other modern laptops. Whether long or short travel is better is a matter of habit and personal preference. In any case, the installed keyboard is excellent and worthy of the ThinkPad name with an ideal feedback that is neither too soft nor too hard. The Lenovo ThinkPad P17 Gen 2 is well-suited to even prolonged typing. Unlike with the ThinkPad P15 G2, the keyboard area does not yield.
As with most larger workstations, there is a numpad on the right side of the keyboard area that leads to the main keys being slightly offset to the left. The keyboard does not quite stretch itself across the entire width of the base unit. Additionally, there are dedicated keys for all important functions including navigation, which allows for an efficient workflow.
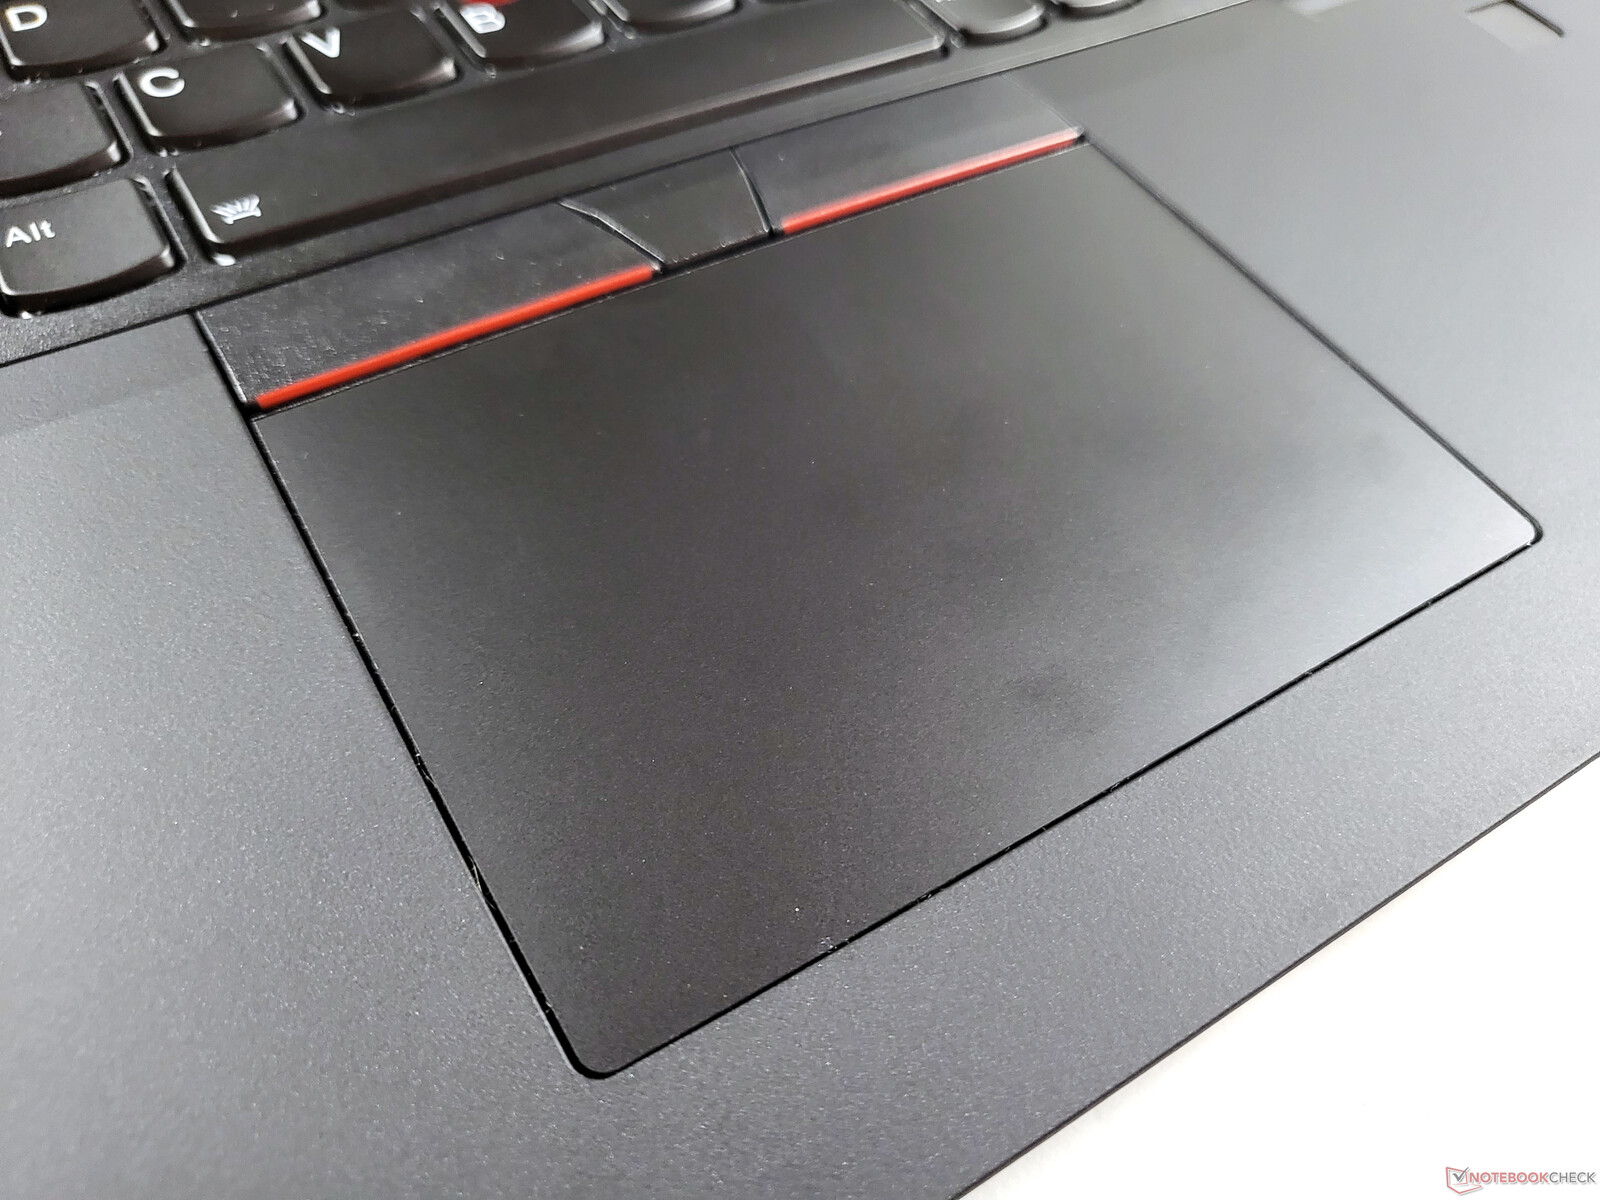
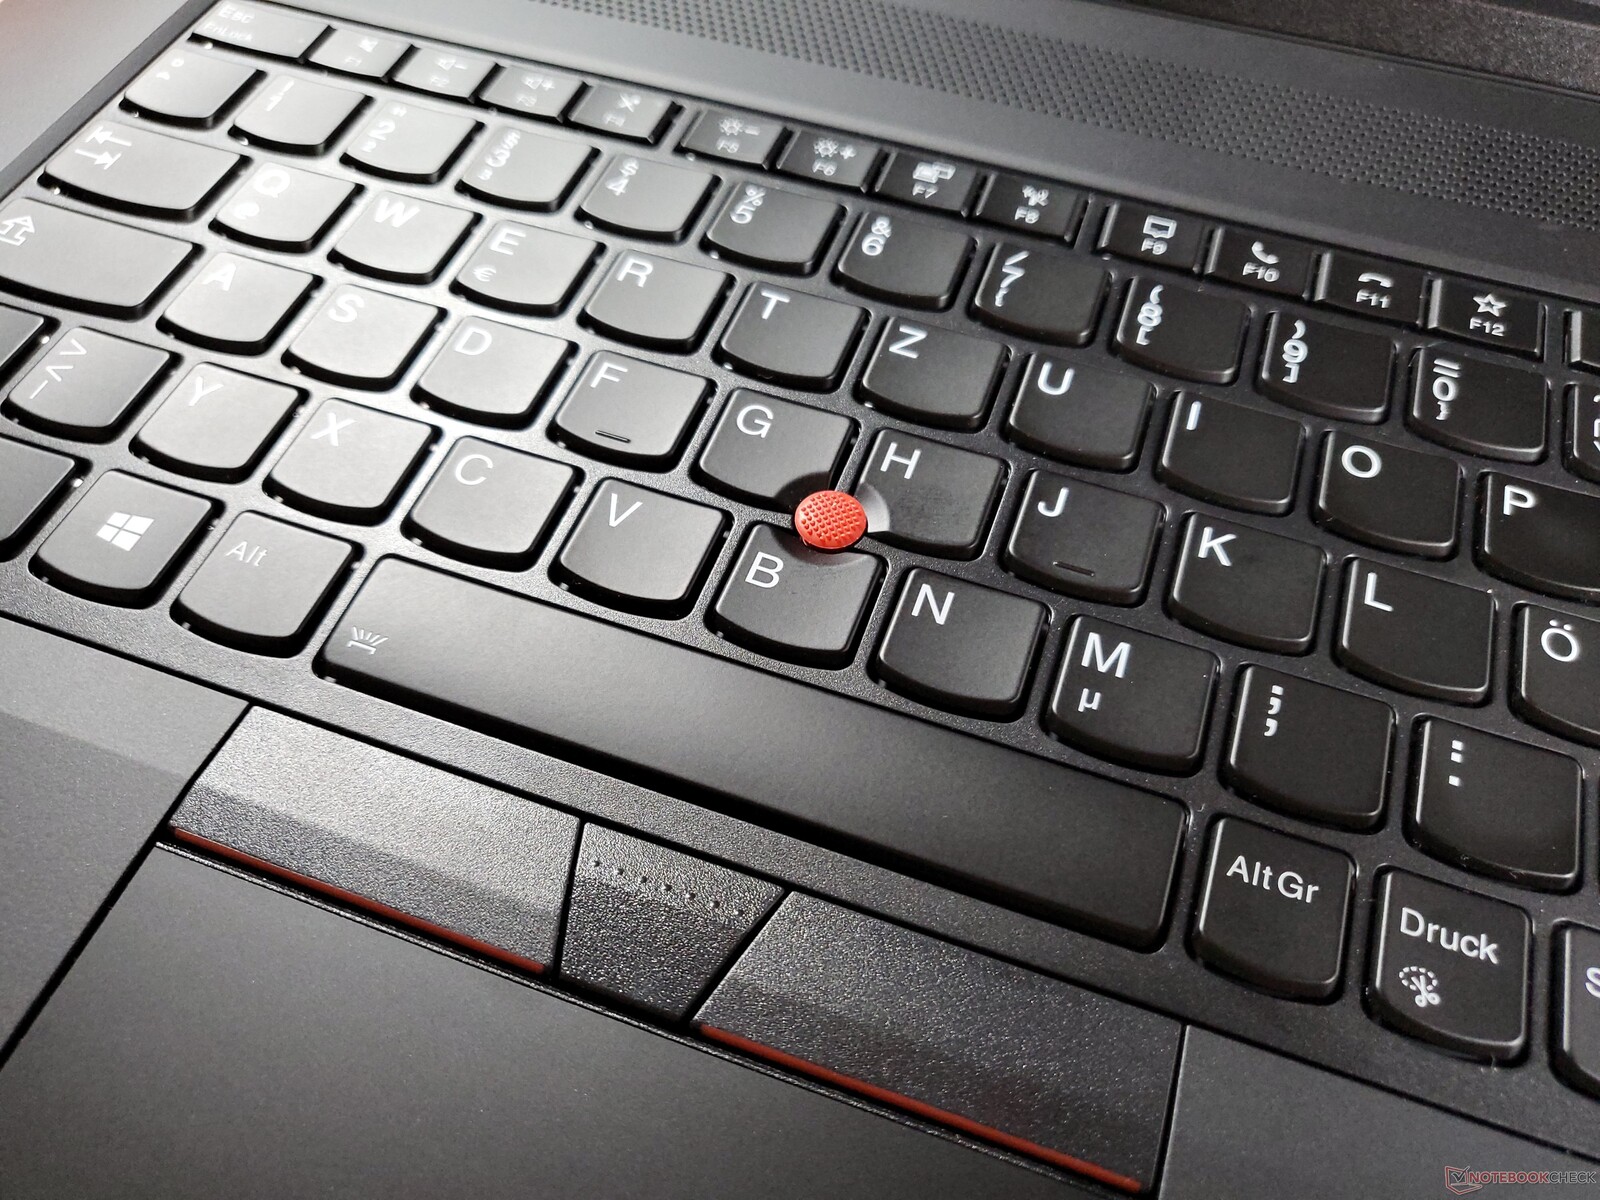
Touchpad & TrackPoint
With the ThinkPad P17, Lenovo has introduced its clickpad without dedicated keys to another lineup. However, Lenovo has seized the opportunity to switch to a glass touchpad. The plastic surface offers smooth gliding properties with dull, high-quality clicks. At 10 x 7 cm (~3.94 x 2.76 in), the touchpad is decently-sized. The software implementation of the Synaptics touchpad warrants no criticism.
Aside from the touchpad, the Lenovo ThinkPad P17 G2 offers its signature ThinkPad TrackPoint with its three dedicated buttons. The TrackPoint is superior to the clickpad particularly when it comes to drag & drop and it allows users to move the mouse cursor while typing. Overall it is a great mouse alternative, although it may take some practice for beginners.
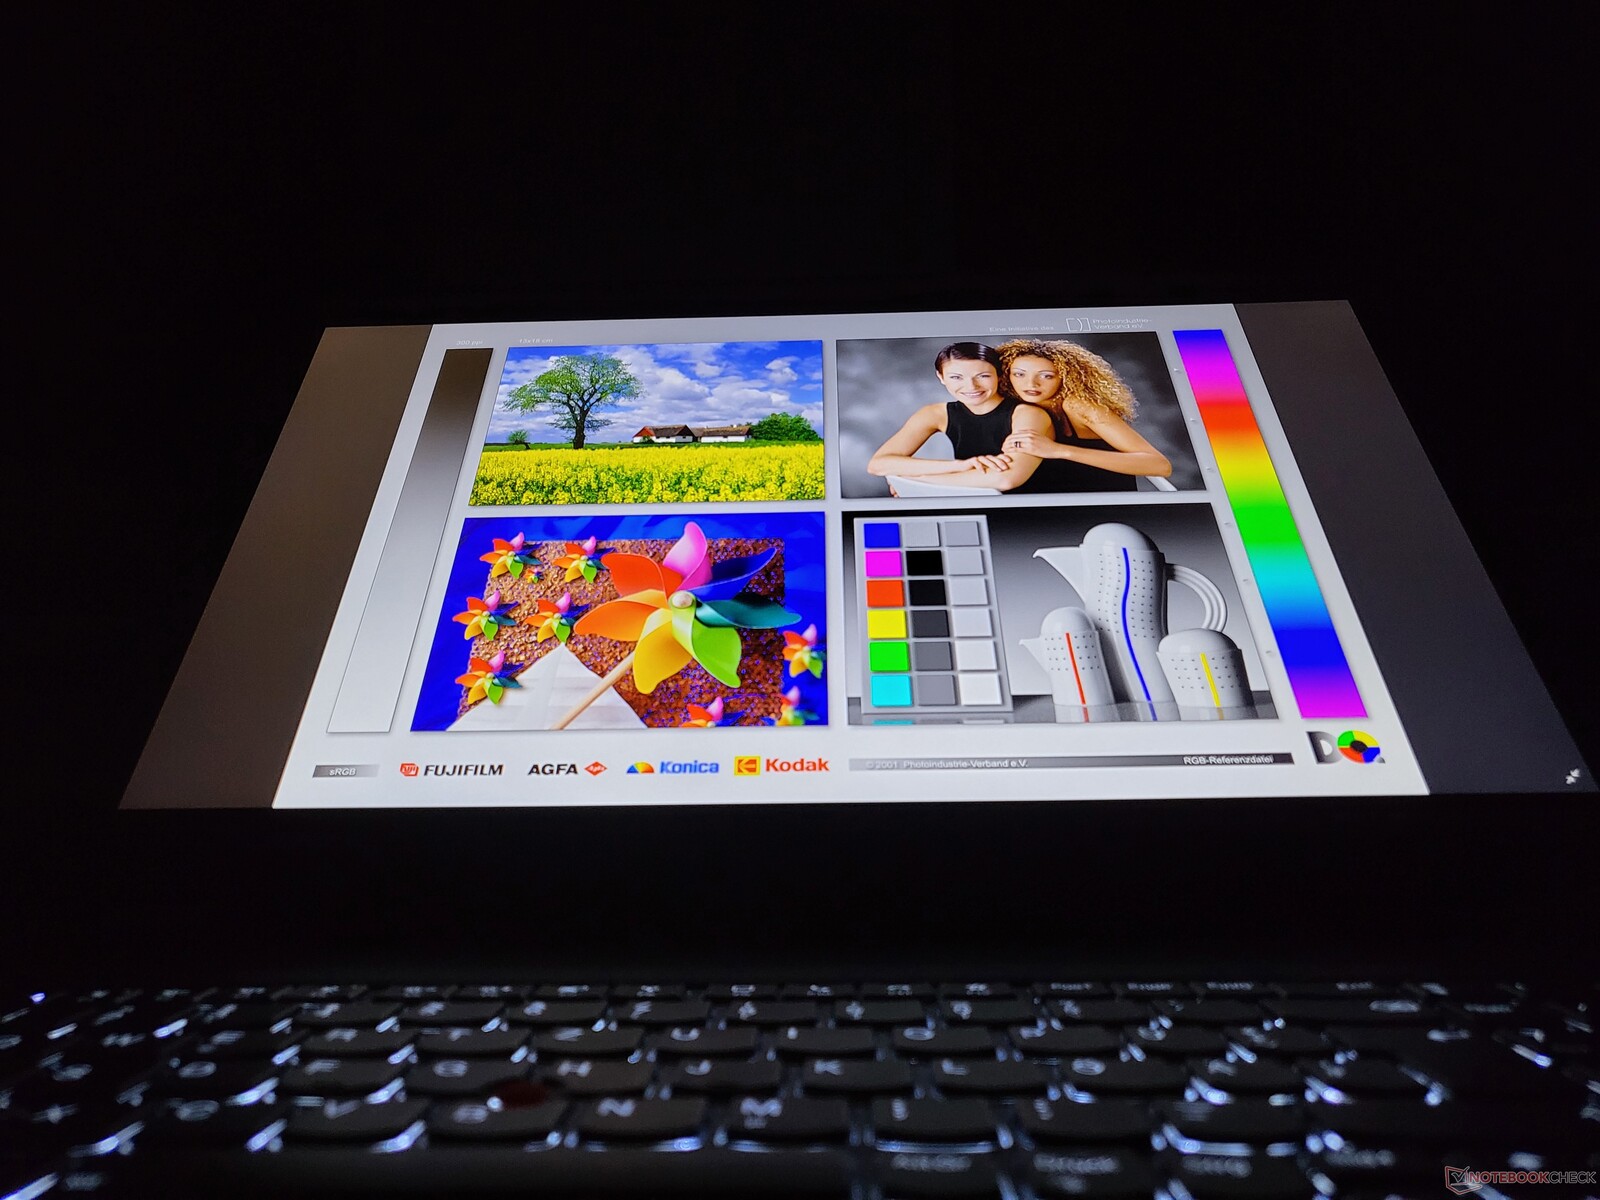
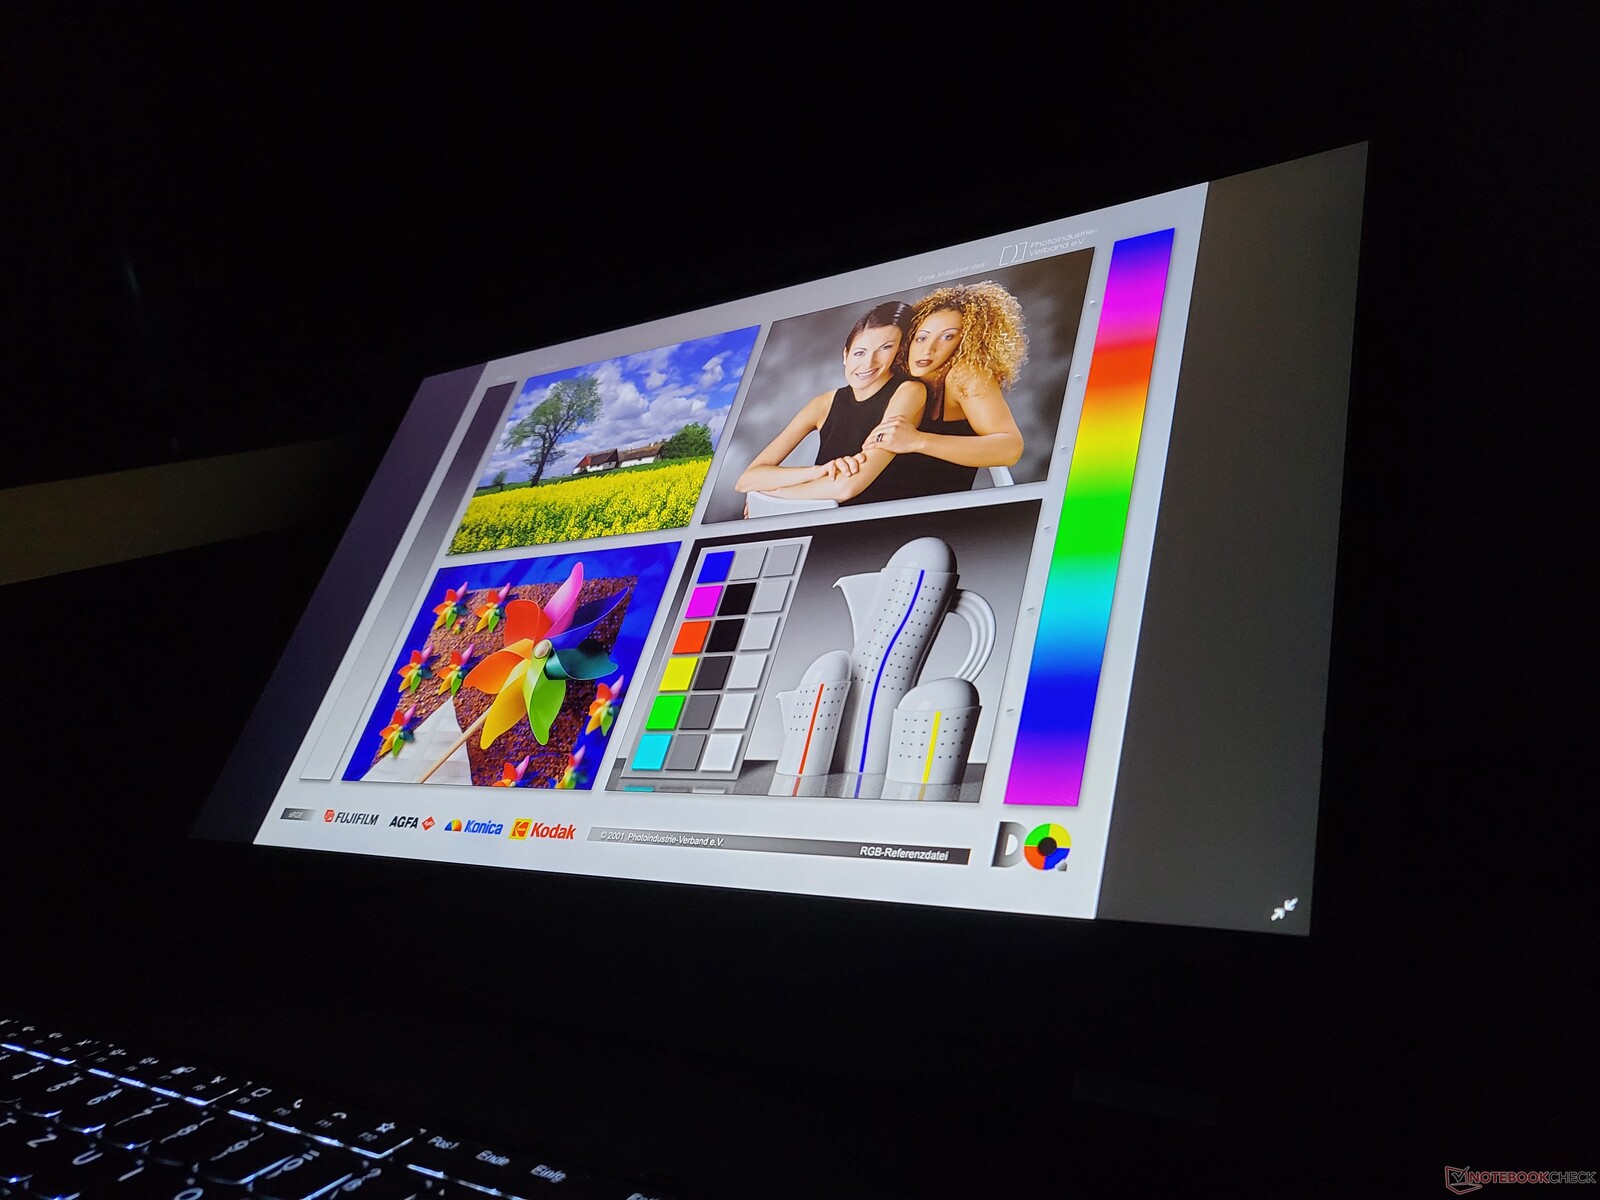
Display: ThinkPad with a disappointing Full HD LCD
While the 16:9 form factor is not quite outdated, it is now almost obsolete: More and more laptops are adopting 16:10 or 3:2 aspect ratios, although this trend does not seem to have had much of an effect on the workstation sector yet. Lenovo offers two 17.3-inch 16:9 display options for the ThinkPad P17 Gen 2. Both variants are matte IPS screens. Touchscreens are not available on this model, since they - along with OLED - are exclusive to the smaller Lenovo ThinkPad P15 G2.
- Full HD (1920 x 1080), 300 nits, 100% sRGB
- 4K Ultra HD (3840 x 2160), 500 nits, 100% AdobeRGB
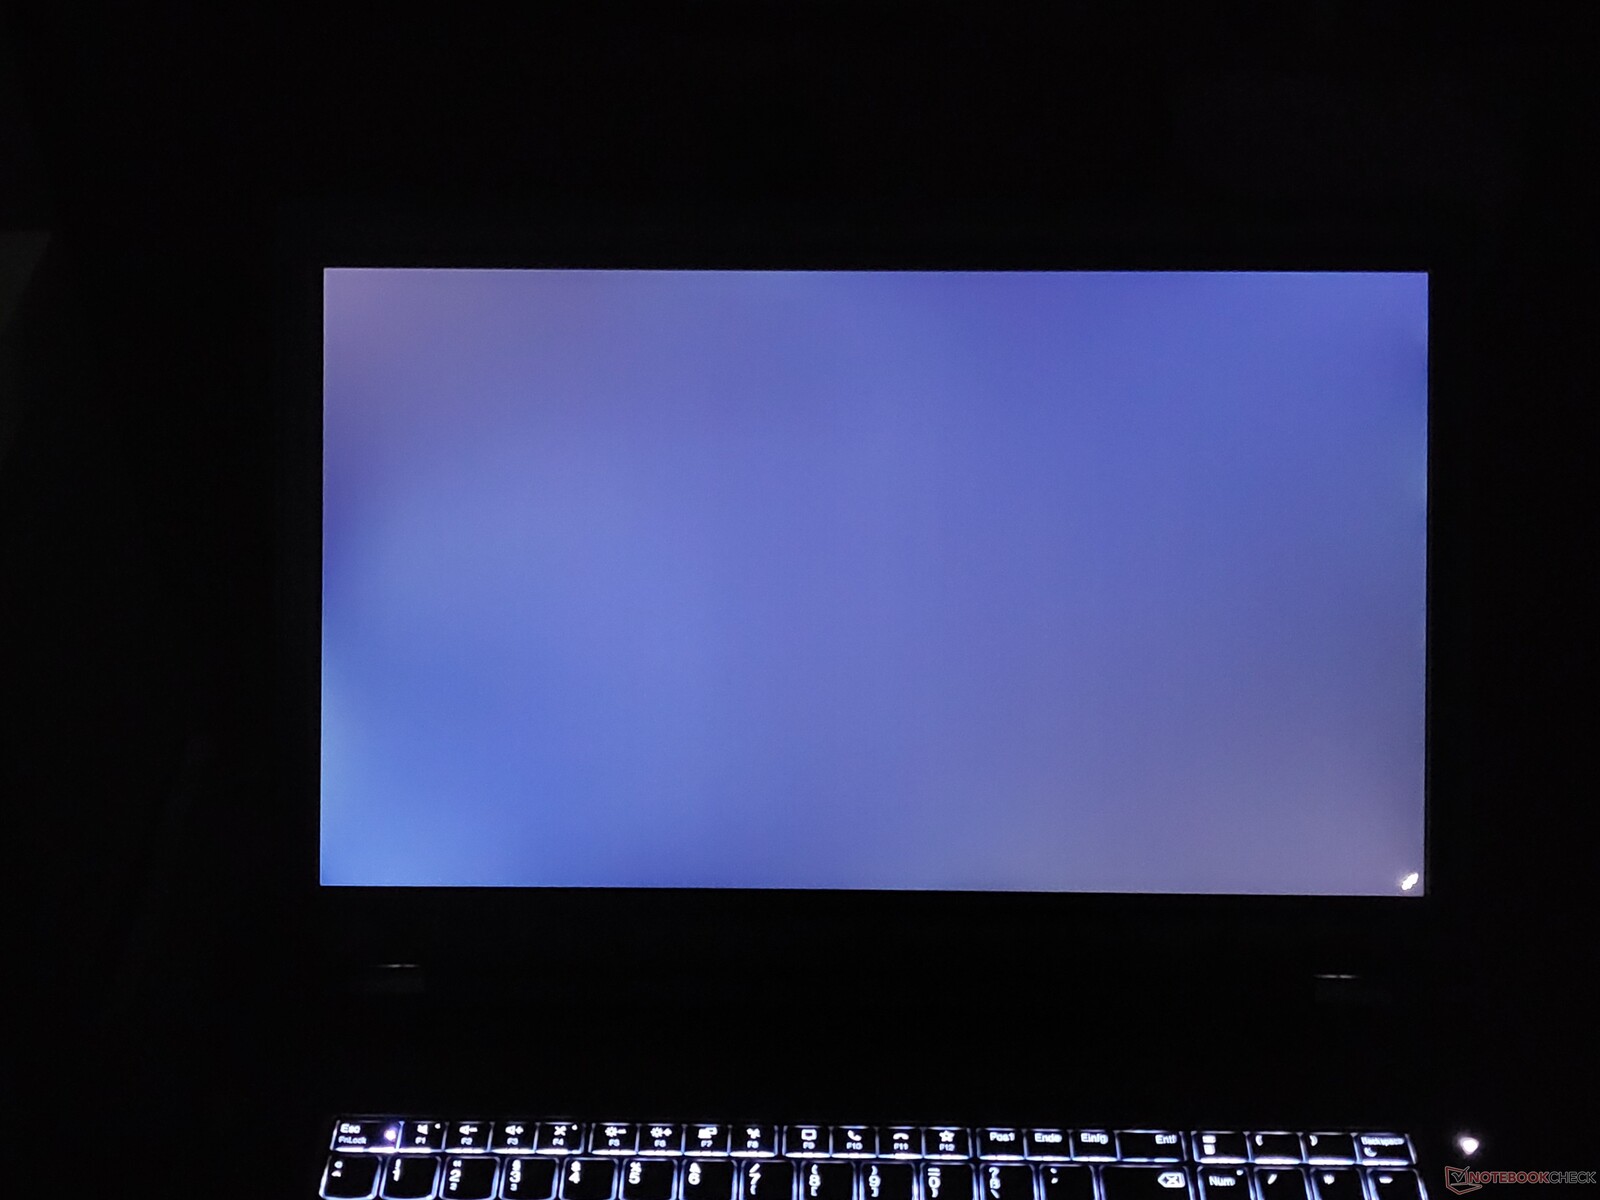
The display effortlessly surpasses the advertised 300-nit brightness level with its average measured brightness of 334 nits. Although it is brighter than last year's model, the base display option of the ThinkPad P17 G2 cannot quite compete with the 4K UHD LCDs from competing HP and Dell systems.
Overall, the native Full HD resolution is almost too low for a 17-inch laptop, particularly in the workstation space. The image looks somewhat rough and the large LCD screen feels wasted. We hope Lenovo can make a switch to a 2K or QHD display for future models.
| |||||||||||||||||||||||||
Brightness Distribution: 87 %
Center on Battery: 357 cd/m²
Contrast: 1031:1 (Black: 0.35 cd/m²)
ΔE ColorChecker Calman: 5.4 | ∀{0.5-29.43 Ø4.77}
calibrated: 3.2
ΔE Greyscale Calman: 6.5 | ∀{0.09-98 Ø5}
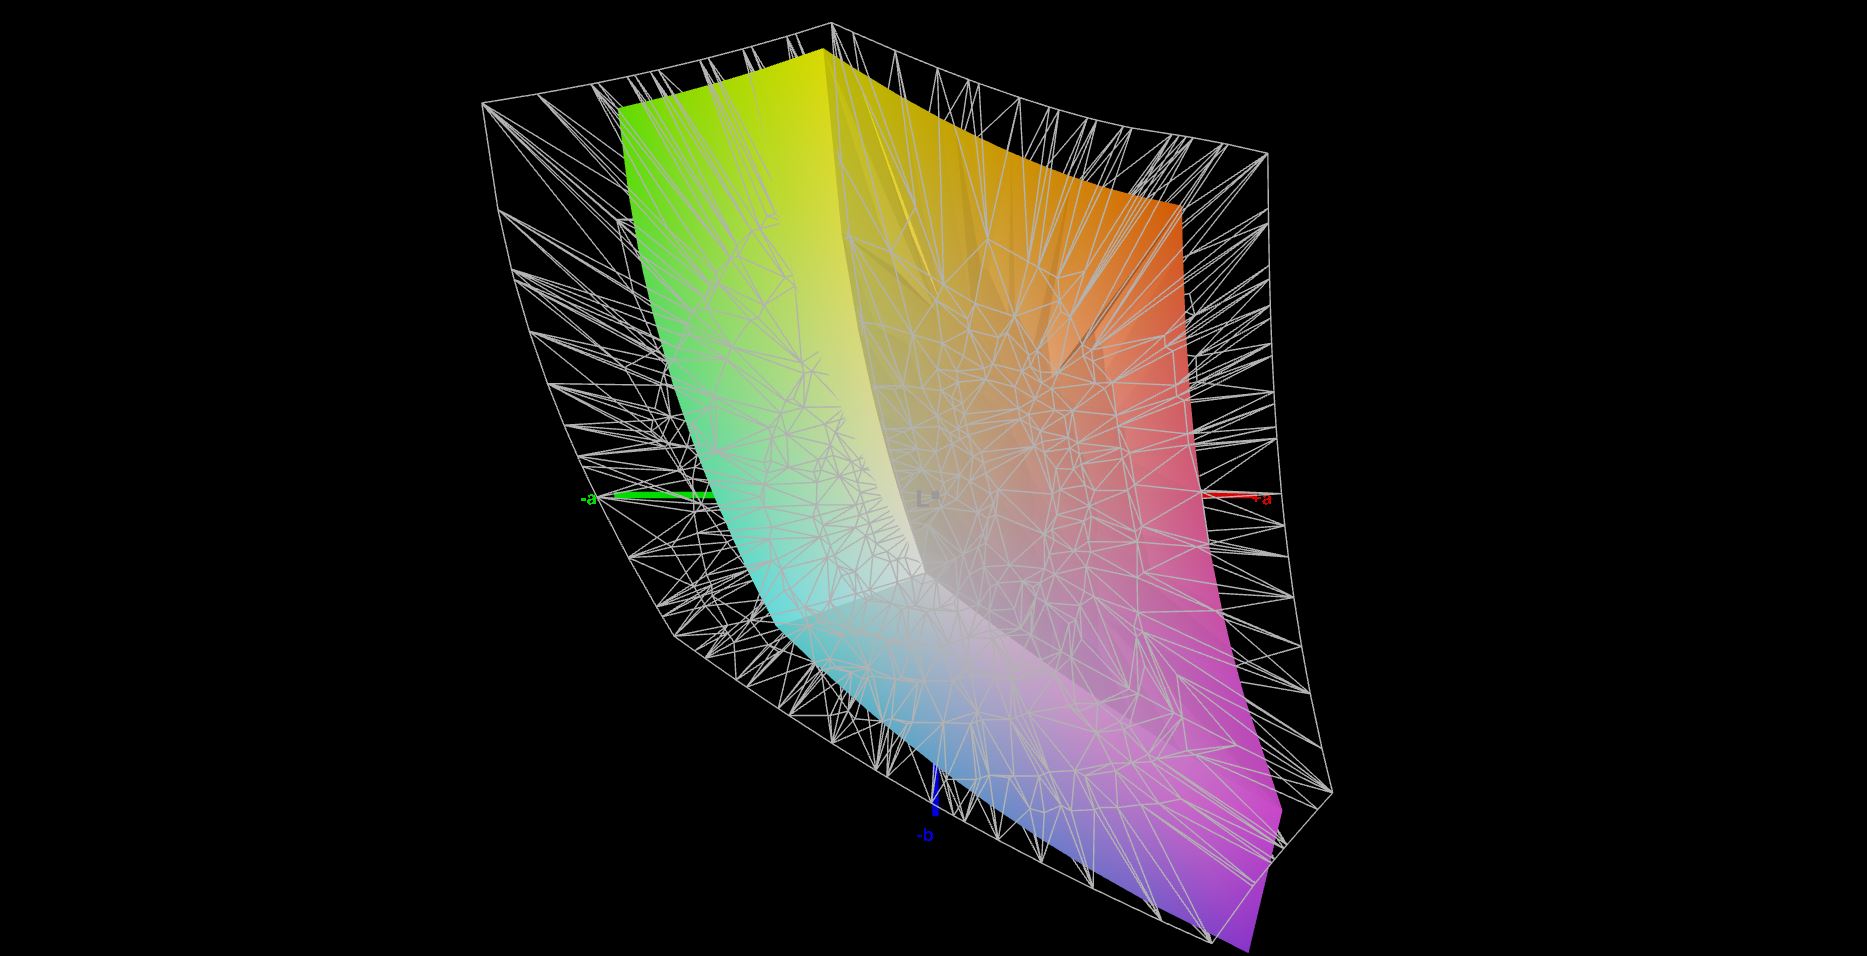
63.9% AdobeRGB 1998 (Argyll 3D)
87.3% sRGB (Argyll 3D)
67.9% Display P3 (Argyll 3D)
Gamma: 2.23
CCT: 7351 K
| Lenovo ThinkPad P17 G2-20YU0025G LP173WF4-SPF7, IPS LED, 1920x1080, 17.3" | Lenovo ThinkPad P73-20QR002DGE N173HCE-E31, IPS LED, 1920x1080, 17.3" | HP ZBook Fury 17 G7 119W5EA AUOCD8C, , 3840x2160, 17.3" | Dell Precision 5000 5750 P92F Sharp LQ170R1, IPS, 3840x2400, 17" | Asus ProArt StudioBook Pro 17 W700G3T 170PUW1-A00, IPS, 1920x1200, 17" | |
|---|---|---|---|---|---|
| Display | 4% | 32% | 30% | 30% | |
| Display P3 Coverage (%) | 67.9 | 67.5 -1% | 99.3 46% | 83.6 23% | 96.2 42% |
| sRGB Coverage (%) | 87.3 | 94.2 8% | 99.9 14% | 99.7 14% | 99.8 14% |
| AdobeRGB 1998 Coverage (%) | 63.9 | 67.8 6% | 86.9 36% | 97.7 53% | 84.7 33% |
| Response Times | -14% | -61% | -29% | -19% | |
| Response Time Grey 50% / Grey 80% * (ms) | 39.2 ? | 40 ? -2% | 56 ? -43% | 41.2 ? -5% | 41.2 ? -5% |
| Response Time Black / White * (ms) | 22.4 ? | 28 ? -25% | 40 ? -79% | 34 ? -52% | 29.6 ? -32% |
| PWM Frequency (Hz) | 25000 ? | ||||
| Screen | 6% | 48% | 16% | 31% | |
| Brightness middle (cd/m²) | 361 | 333 -8% | 573 59% | 483.8 34% | 323 -11% |
| Brightness (cd/m²) | 334 | 310 -7% | 586 75% | 457 37% | 308 -8% |
| Brightness Distribution (%) | 87 | 83 -5% | 91 5% | 90 3% | 88 1% |
| Black Level * (cd/m²) | 0.35 | 0.39 -11% | 0.38 -9% | 0.37 -6% | 0.36 -3% |
| Contrast (:1) | 1031 | 854 -17% | 1508 46% | 1308 27% | 897 -13% |
| Colorchecker dE 2000 * | 5.4 | 4.4 19% | 1.9 65% | 4.27 21% | 1.1 80% |
| Colorchecker dE 2000 max. * | 9.9 | 7.5 24% | 4.2 58% | 8.78 11% | 3.3 67% |
| Colorchecker dE 2000 calibrated * | 3.2 | 2 37% | 0.7 78% | 4.01 -25% | 0.8 75% |
| Greyscale dE 2000 * | 6.5 | 5.1 22% | 2.9 55% | 3.5 46% | 0.8 88% |
| Gamma | 2.23 99% | 2.39 92% | 2.1 105% | 2.43 91% | 2.23 99% |
| CCT | 7351 88% | 7061 92% | 6217 105% | 1741 373% | 6479 100% |
| Color Space (Percent of AdobeRGB 1998) (%) | 61.1 | 77.6 | 86.7 | 75.7 | |
| Color Space (Percent of sRGB) (%) | 94 | 100 | 99.9 | 99.8 | |
| Total Average (Program / Settings) | -1% /
3% | 6% /
29% | 6% /
13% | 14% /
23% |
* ... smaller is better
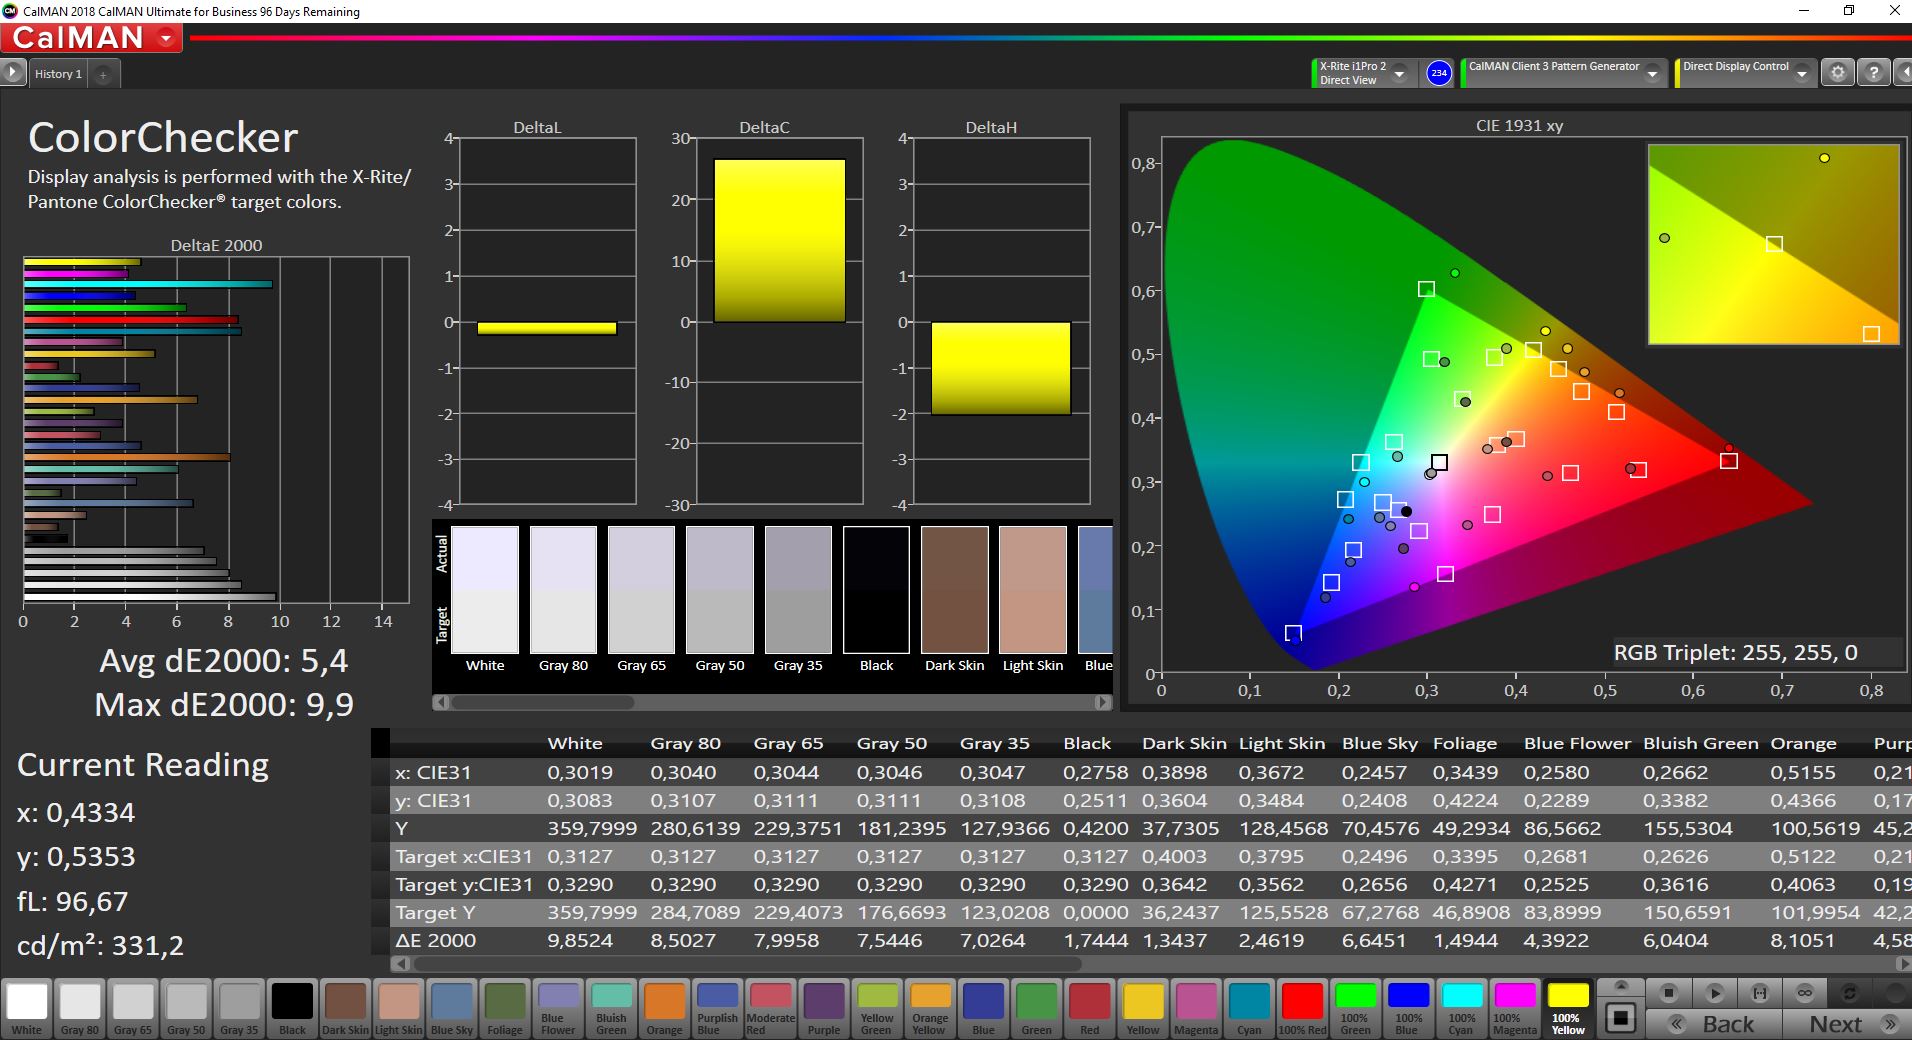
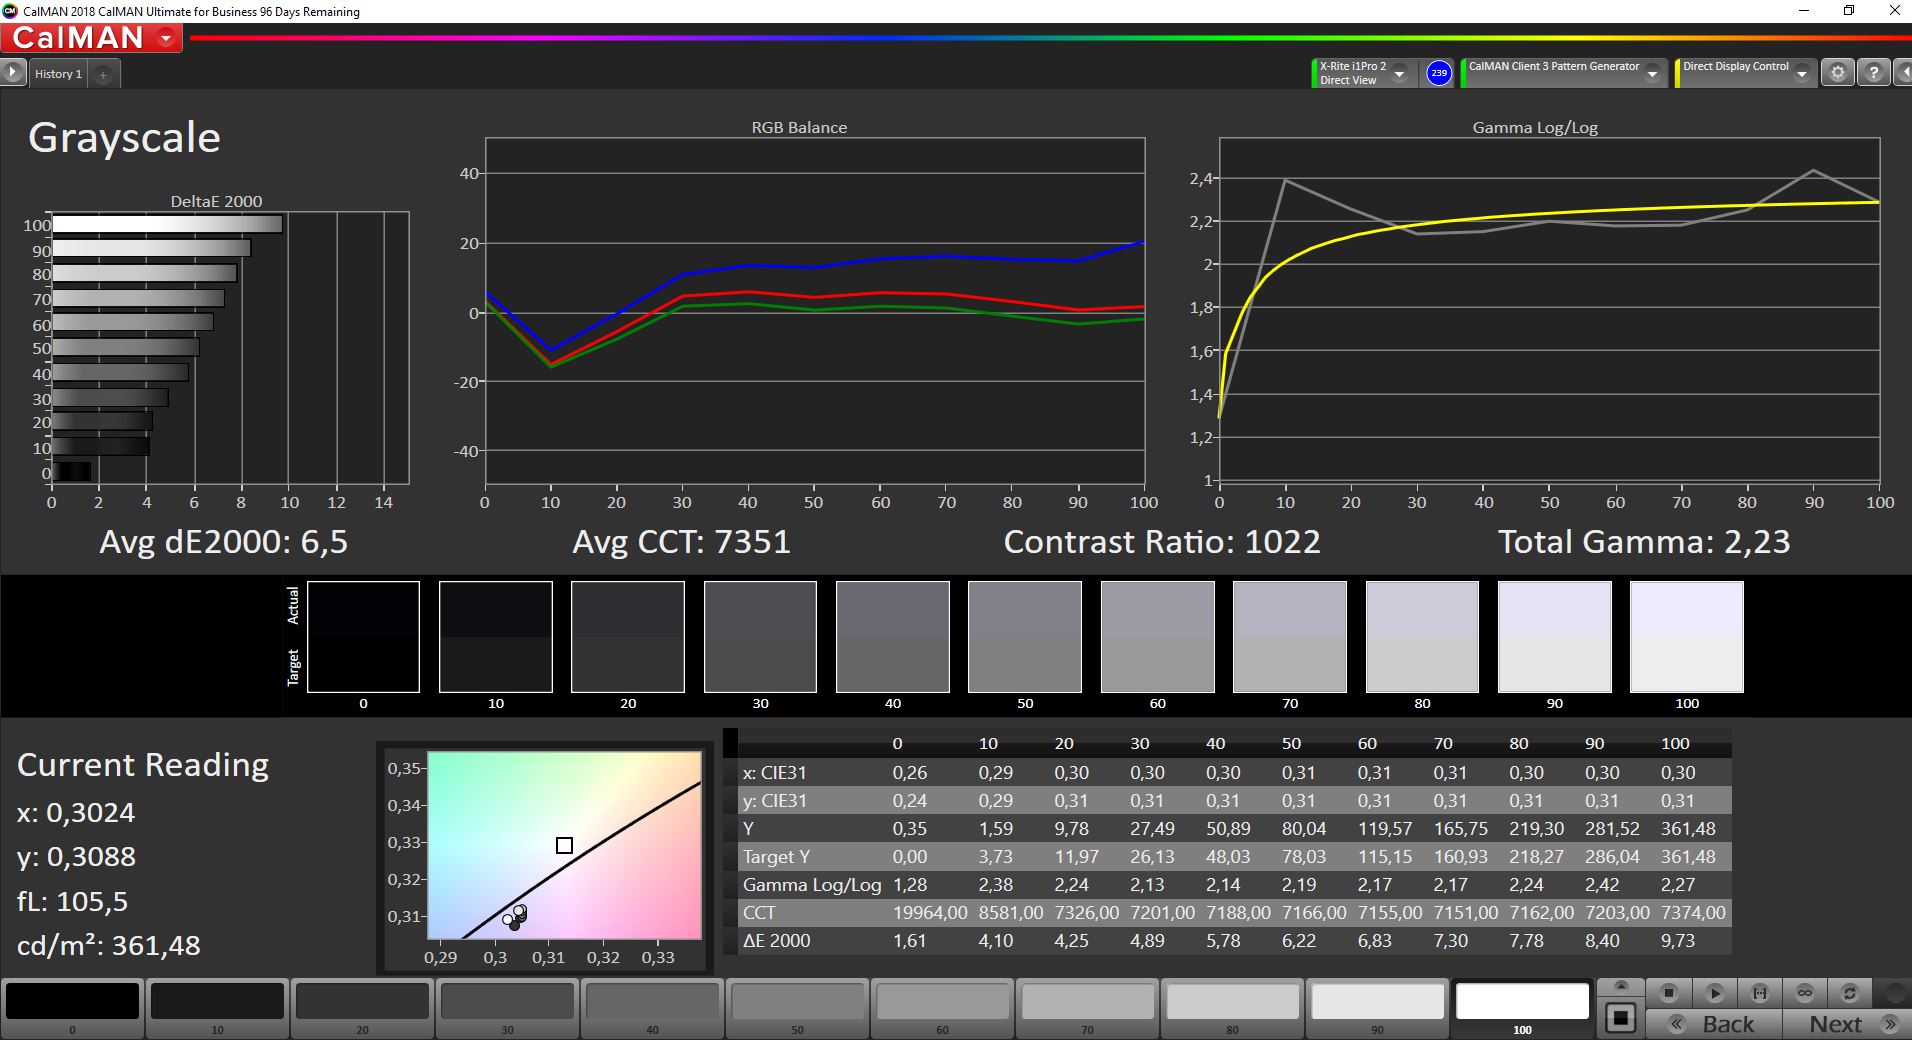
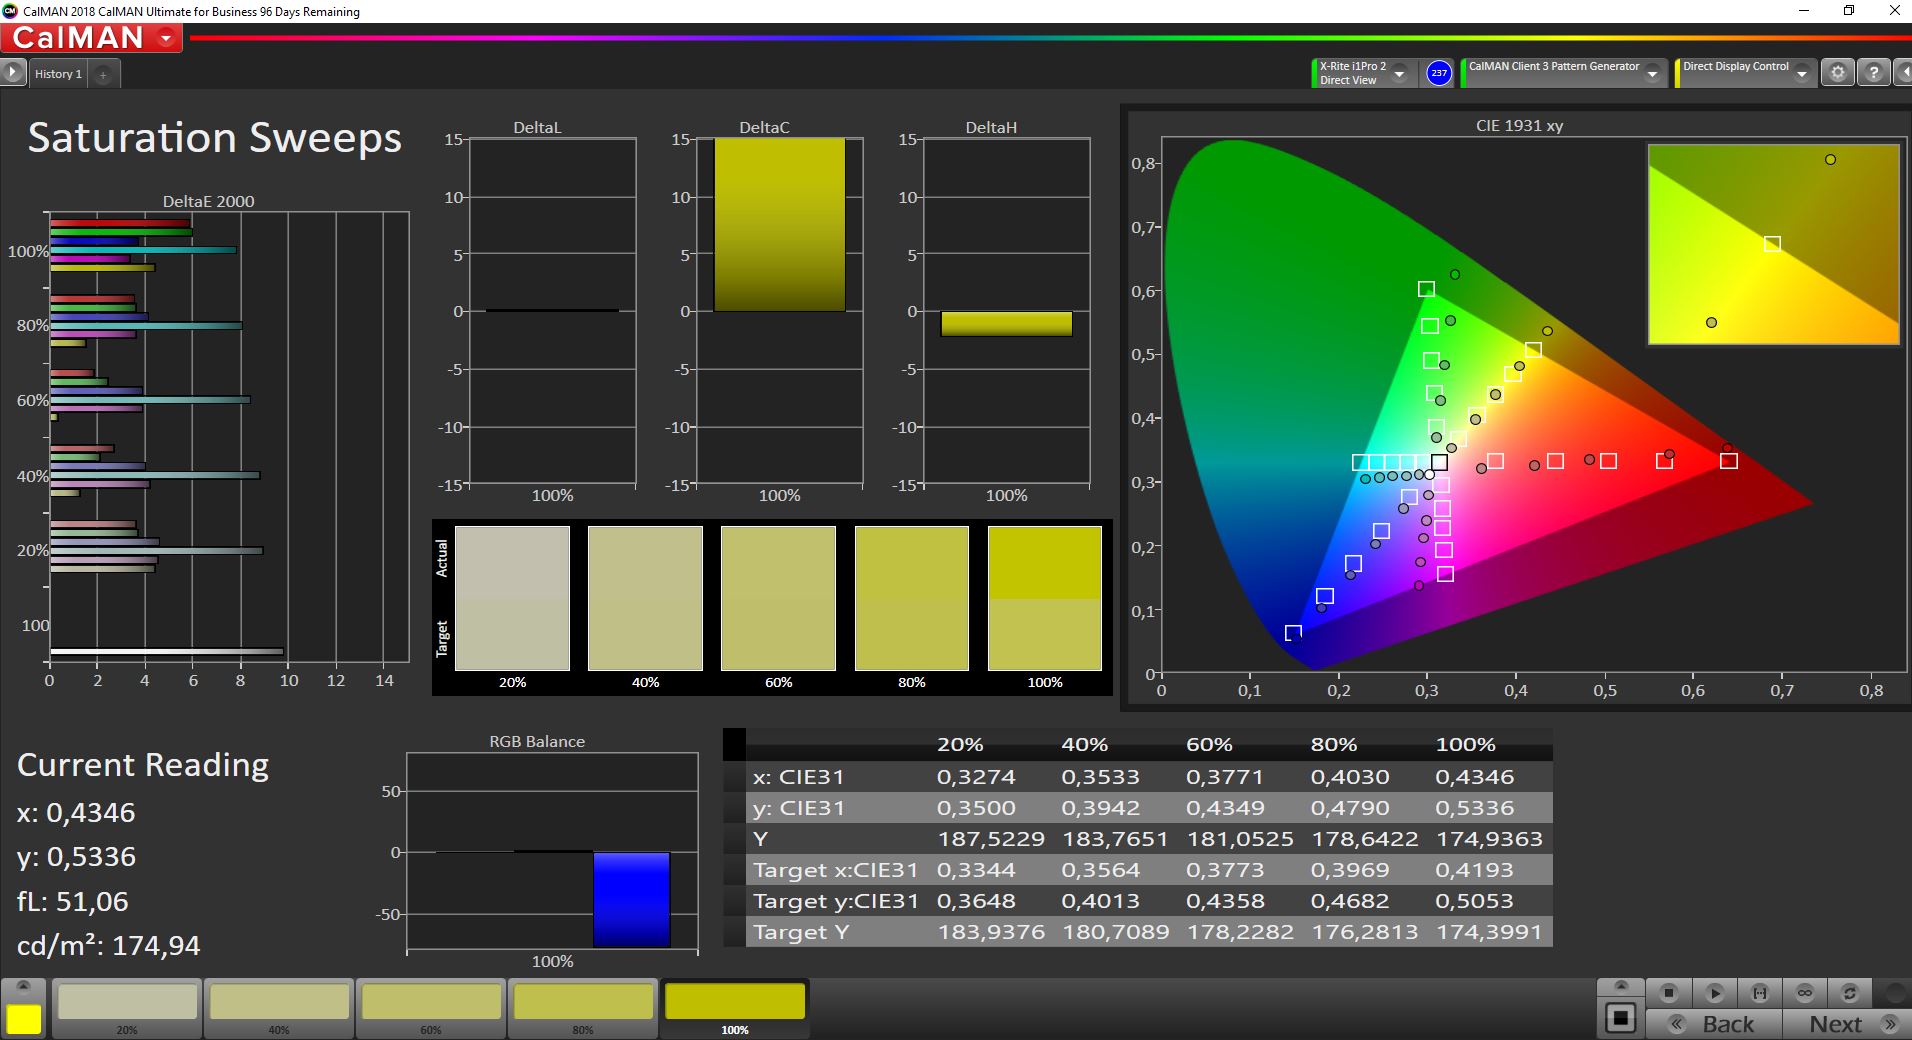


According to the CalMAN results from our X-Rite i1Pro 2 colorimeter, the LCD's color temperature is slightly too cool ex-factory. A calibration with X-Rite's iProfiler greatly improved the grayscale, while the colors remained inaccurate. Even with a contrast ratio of 1031:1, the poor color accuracy of the display cannot be denied. The Full HD display of the Lenovo ThinkPad P17 G2 does not achieve the advertised 100% sRGB coverage. Although 87% is not a terrible result, it is definitely below the average. For professional photo editing, the UHD LCD should be a much better choice.


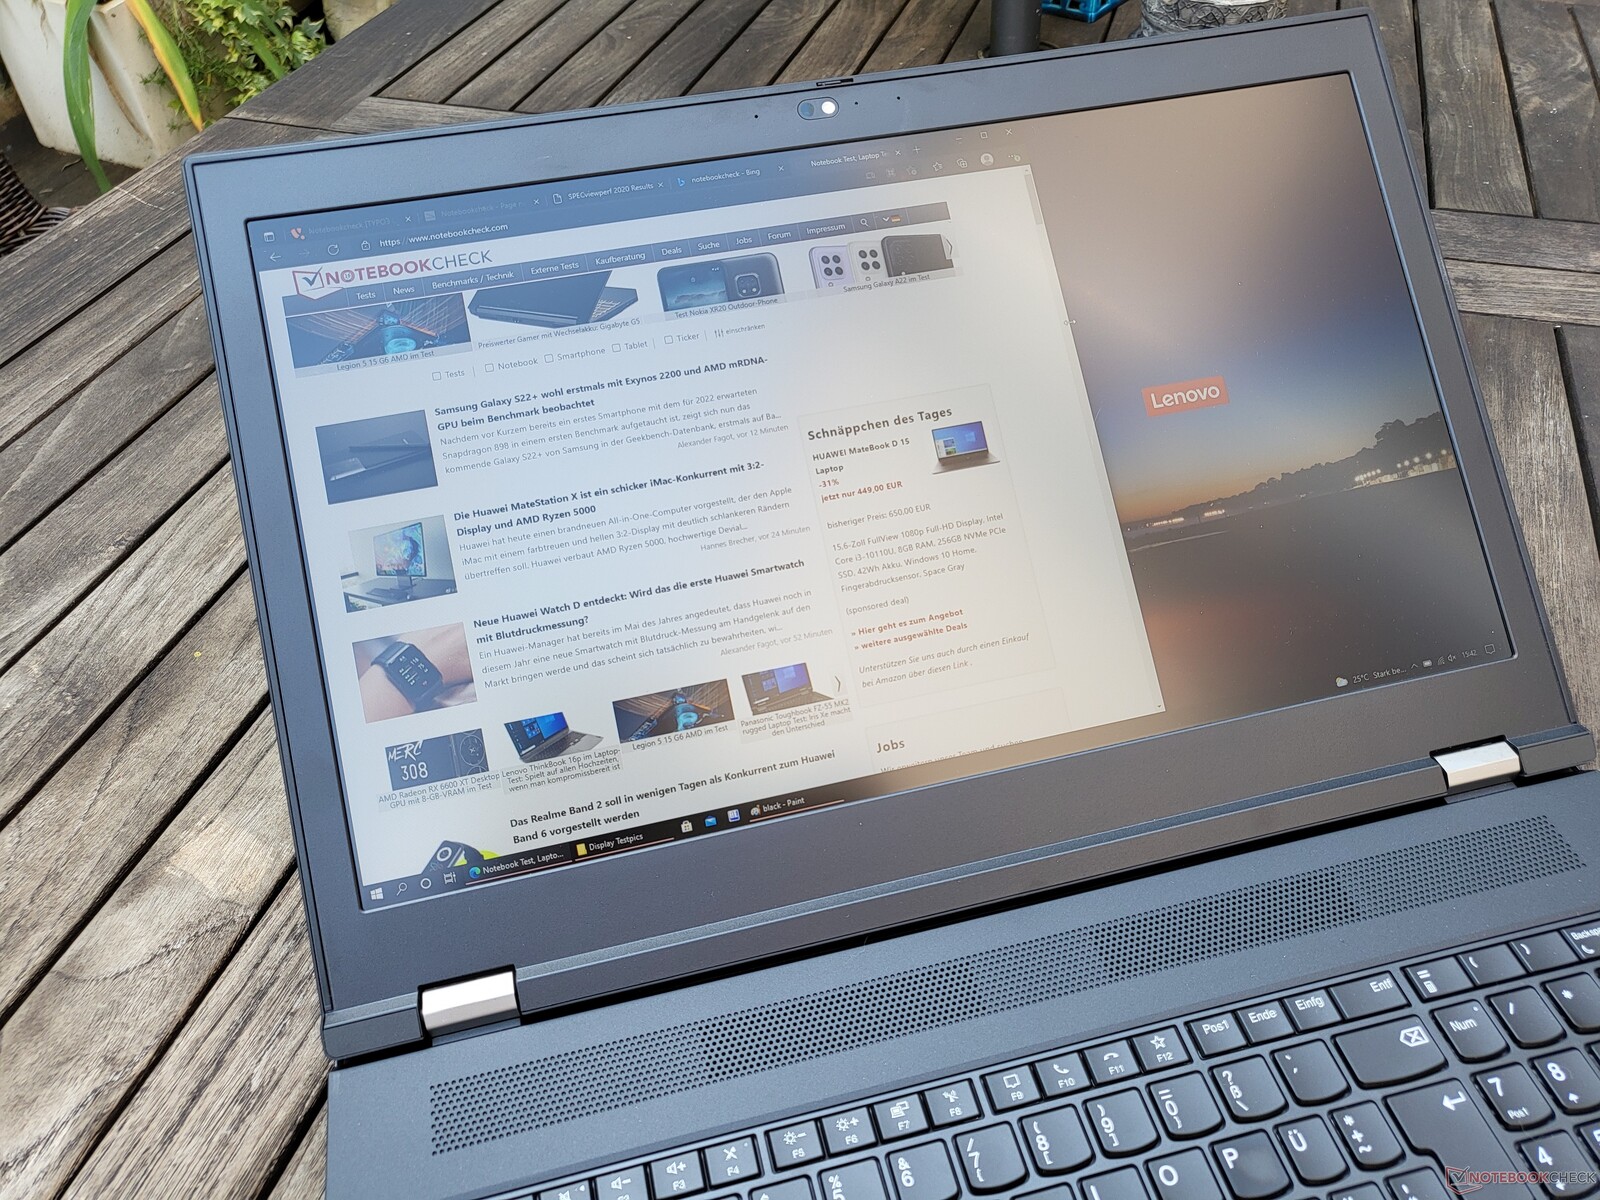
Outdoor use is made possible primarily by the matte layer of the screen. 300 nits of brightness will at least suffice for use in the shade.
Display Response Times
| ↔ Response Time Black to White | ||
|---|---|---|
| 22.4 ms ... rise ↗ and fall ↘ combined | ↗ 11.6 ms rise |  |
| ↘ 10.8 ms fall | ||
| The screen shows good response rates in our tests, but may be too slow for competitive gamers. In comparison, all tested devices range from 0.1 (minimum) to 240 (maximum) ms. » 49 % of all devices are better. This means that the measured response time is worse than the average of all tested devices (20.2 ms). | ||
| ↔ Response Time 50% Grey to 80% Grey | ||
| 39.2 ms ... rise ↗ and fall ↘ combined | ↗ 21.2 ms rise | 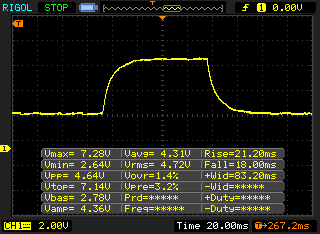 |
| ↘ 18 ms fall | ||
| The screen shows slow response rates in our tests and will be unsatisfactory for gamers. In comparison, all tested devices range from 0.165 (minimum) to 636 (maximum) ms. » 59 % of all devices are better. This means that the measured response time is worse than the average of all tested devices (31.6 ms). | ||
Screen Flickering / PWM (Pulse-Width Modulation)
| Screen flickering / PWM not detected |  | ||
In comparison: 53 % of all tested devices do not use PWM to dim the display. If PWM was detected, an average of 8083 (minimum: 5 - maximum: 343500) Hz was measured. | |||
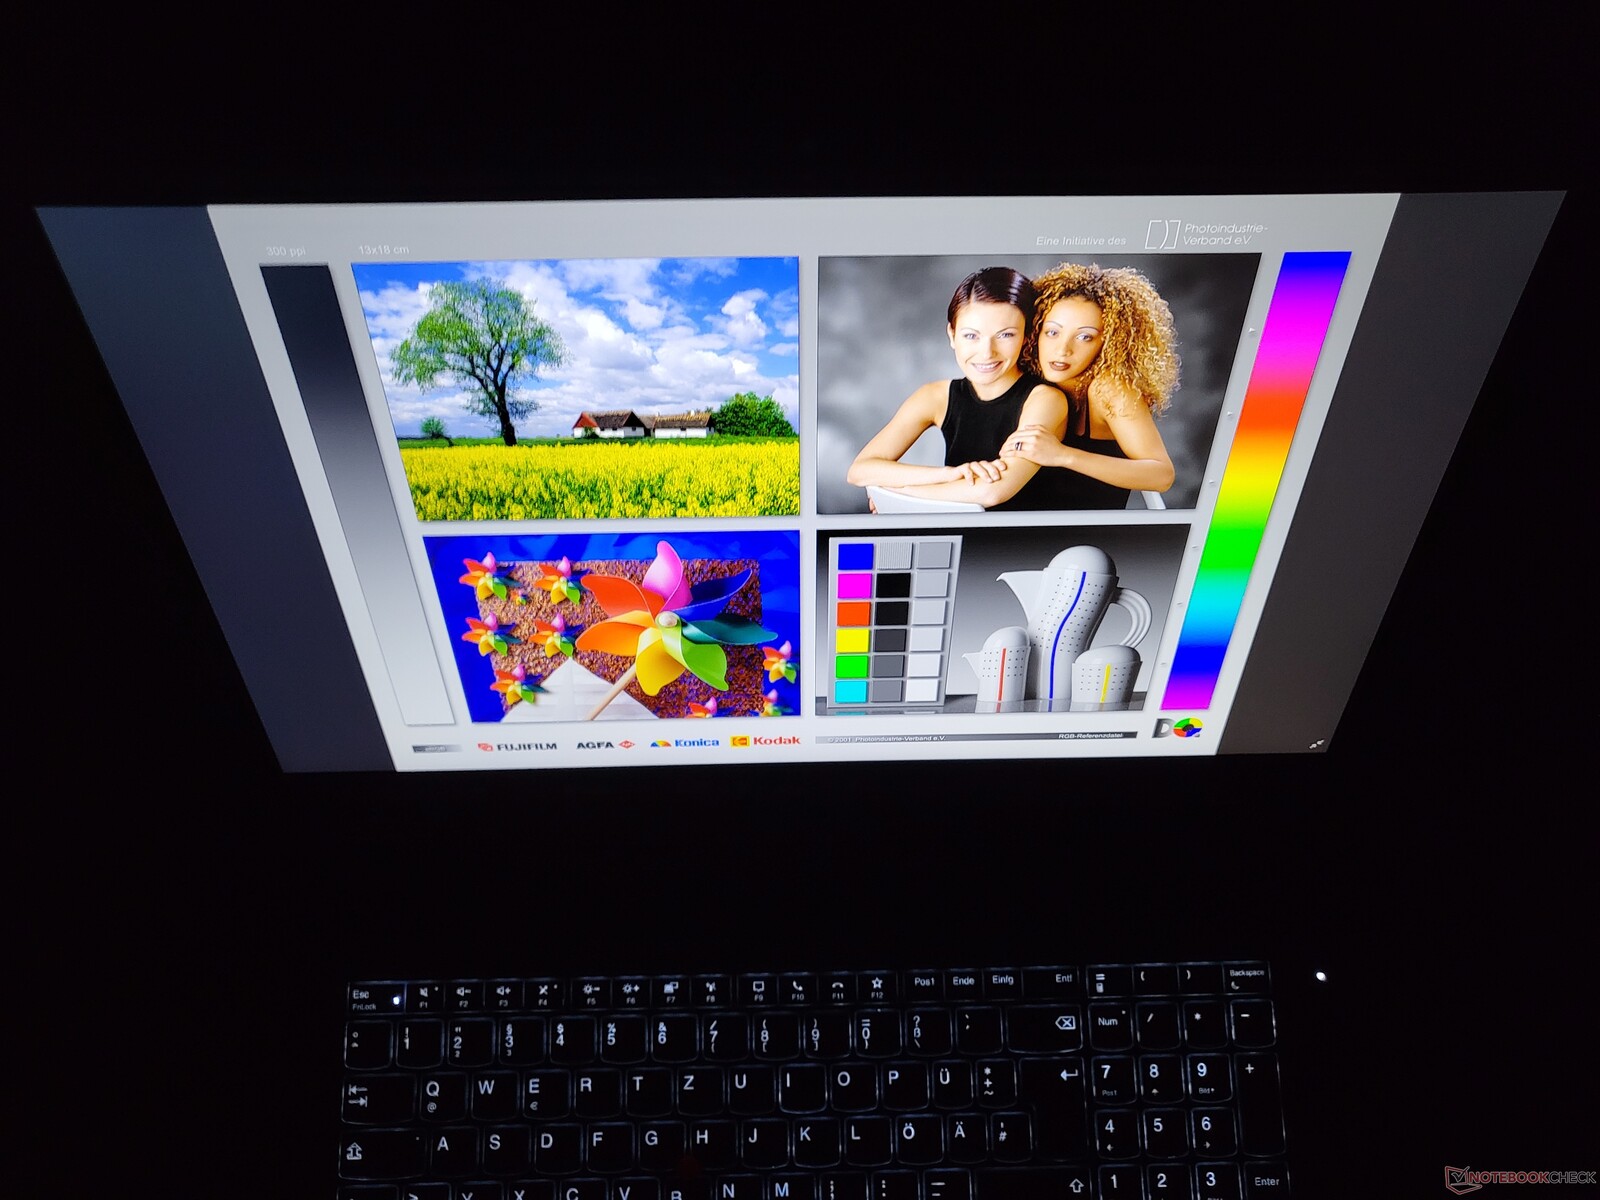
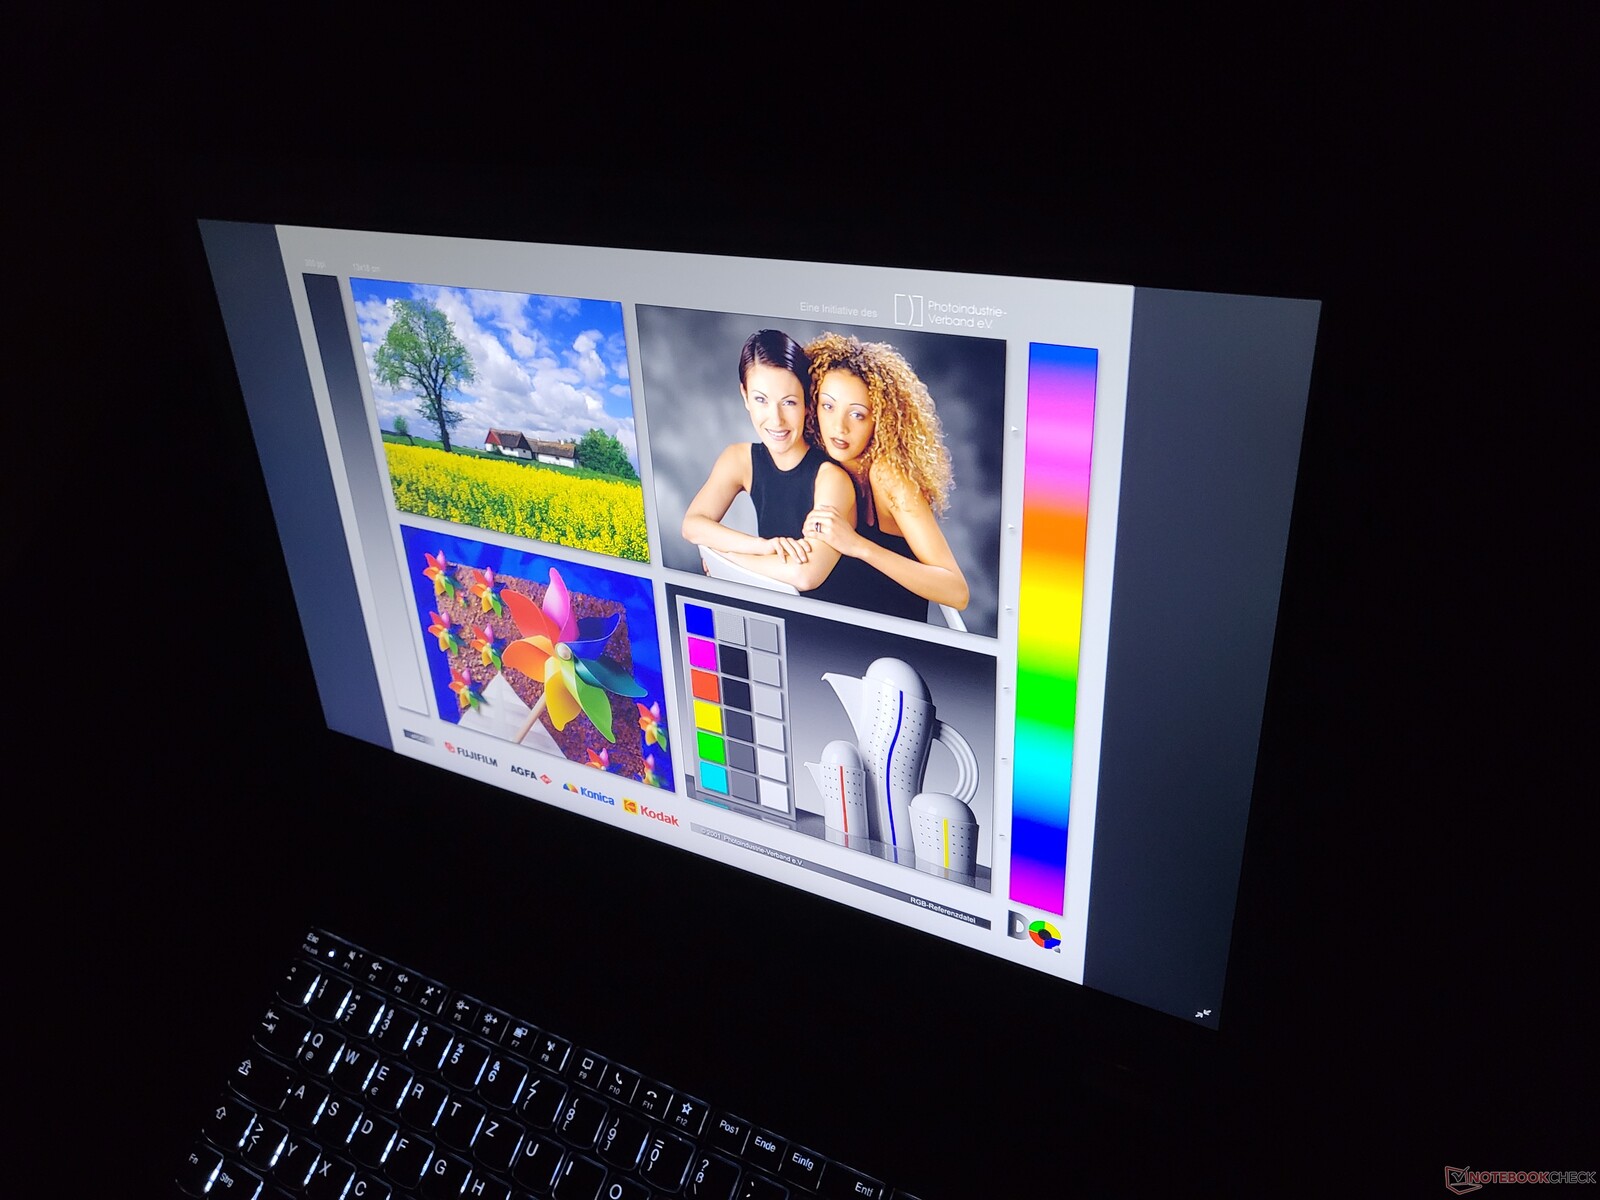
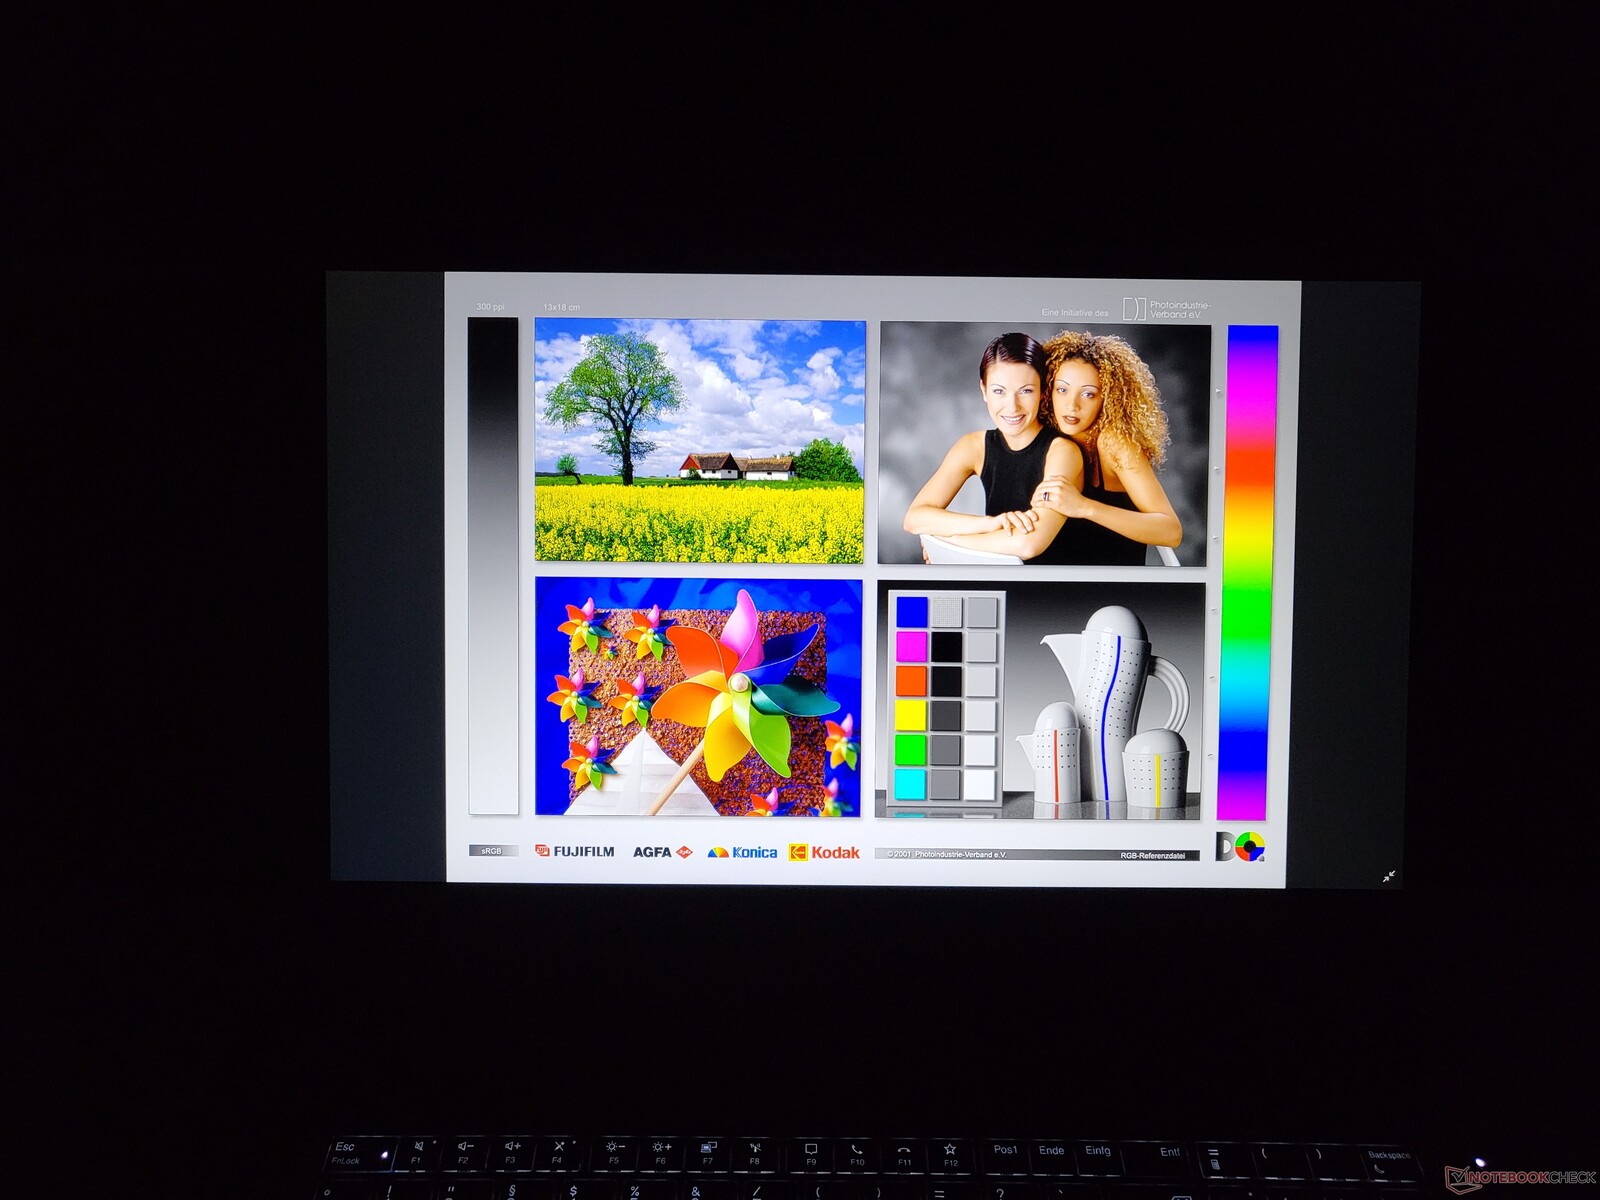
Thanks to the underlying IPS technology, the ThinkPad display offers great viewing angles.


Performance: Lenovo ThinkPad P17 G2 with great scores
With the ThinkPad P17, the P series has become more configurable than ever before, since the GPU occupies a separate daughterboard. This allows for arbitrary processor and graphics combinations. The available processors are as follows: Core i5-11500H, i7-11800H, i7-11850H, i9-11950H, Xeon W-11855M, as well as the Xeon W-11955M. Lenovo pairs these CPUs with either the Nvidia T1200 (60 W), Nvidia RTX A2000 (60 W), RTX A3000 (115 W), RTX A4000 (115 W) or RTX A5000 (115 W).
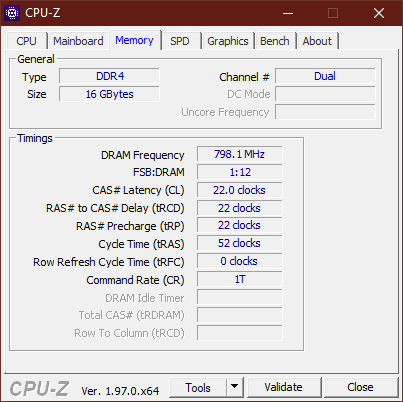
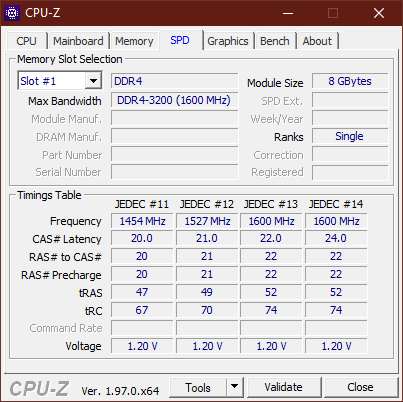
The four SODIMM slots support up to 128 GB of DDR4-3200 RAM in total with ECC capabilities when configured with a Xeon option. Furthermore, the Lenovo ThinkPad P17 Gen 2 accepts up to three M.2-2280 SSDs.
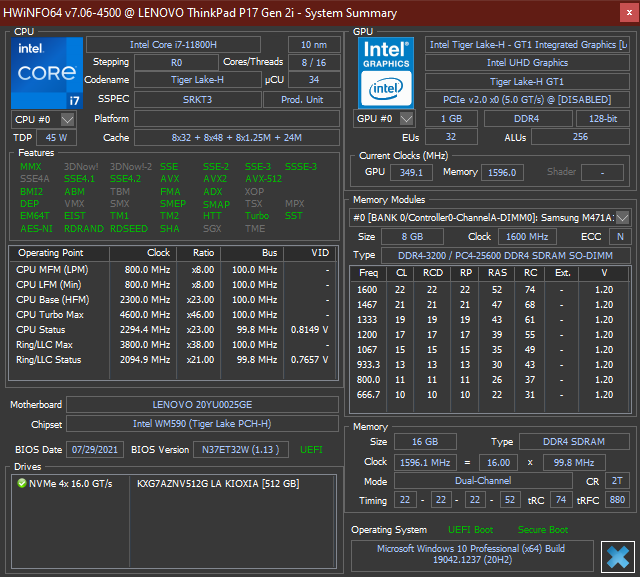
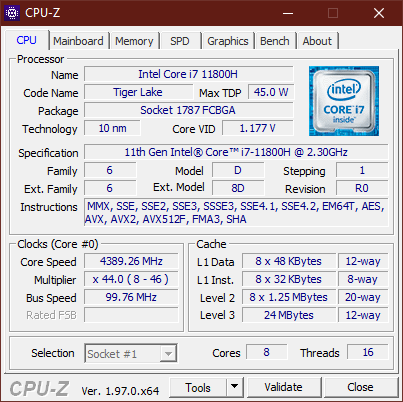

Processor
The Intel Core i7-11800H is an H-series processor from Intel's 11th generation Tiger Lake, meaning 10-nanometer CPUs have finally been introduced to the ThinkPad P series. The H-series octa-core CPU has a 45W TDP and clock speeds of up to 4.6 GHz. The base clock sits at 2.3 GHz. A comparison with other processors can be found on our CPU comparison page.
The maximum power limit of the Lenovo ThinkPad P17 G2 has been set to 80 watts ex-factory. Under a prolonged load, the consumption drops to 70 watts, which is still significantly higher than the specified TDP. The high power budget allows our ThinkPad laptop to easily outperform every competitor with an older Intel CPU in our comparison in terms of multi-thread performance. Meanwhile, it performs about the same as the Lenovo IdeaPad 5 Pro 16ACH, which is equipped with the AMD Cezanne-H CPU Ryzen R7 5800H that requires far less power to achieve the same performance level.
In battery mode, the CPU performance drops by about 12%.
Cinebench R15 Multi Endurance test
Cinebench R23: Single Core | Multi Core
Cinebench R15: CPU Single 64Bit | CPU Multi 64Bit
Blender: v2.79 BMW27 CPU
7-Zip 18.03: 7z b 4 -mmt1 | 7z b 4
Geekbench 5.5: Single-Core | Multi-Core
HWBOT x265 Benchmark v2.2: 4k Preset
LibreOffice : 20 Documents To PDF
R Benchmark 2.5: Overall mean
| Cinebench R20 / CPU (Single Core) | |
| Average of class Workstation (671 - 849, n=26, last 2 years) | |
| Lenovo ThinkPad P17 G2-20YU0025G | |
| Average Intel Core i7-11800H (520 - 586, n=47) | |
| Lenovo IdeaPad 5 Pro 16ACH | |
| Dell Precision 5000 5750 P92F | |
| HP ZBook Fury 17 G7 119W5EA | |
| Asus ProArt StudioBook Pro 17 W700G3T | |
| Lenovo ThinkPad P73-20QR002DGE | |
| Cinebench R20 / CPU (Multi Core) | |
| Average of class Workstation (5471 - 15043, n=26, last 2 years) | |
| Lenovo ThinkPad P17 G2-20YU0025G | |
| Lenovo IdeaPad 5 Pro 16ACH | |
| Average Intel Core i7-11800H (2498 - 5408, n=50) | |
| Dell Precision 5000 5750 P92F | |
| HP ZBook Fury 17 G7 119W5EA | |
| Asus ProArt StudioBook Pro 17 W700G3T | |
| Lenovo ThinkPad P73-20QR002DGE | |
| Cinebench R23 / Single Core | |
| Average of class Workstation (1712 - 2206, n=26, last 2 years) | |
| Lenovo ThinkPad P17 G2-20YU0025G | |
| Average Intel Core i7-11800H (1386 - 1522, n=45) | |
| Lenovo IdeaPad 5 Pro 16ACH | |
| HP ZBook Fury 17 G7 119W5EA | |
| Cinebench R23 / Multi Core | |
| Average of class Workstation (14055 - 38520, n=26, last 2 years) | |
| Lenovo ThinkPad P17 G2-20YU0025G | |
| Lenovo IdeaPad 5 Pro 16ACH | |
| Average Intel Core i7-11800H (6508 - 14088, n=48) | |
| HP ZBook Fury 17 G7 119W5EA | |
| Cinebench R15 / CPU Single 64Bit | |
| Average of class Workstation (191.4 - 328, n=26, last 2 years) | |
| Lenovo ThinkPad P17 G2-20YU0025G | |
| Average Intel Core i7-11800H (201 - 231, n=46) | |
| Lenovo IdeaPad 5 Pro 16ACH | |
| Dell Precision 5000 5750 P92F | |
| HP ZBook Fury 17 G7 119W5EA | |
| Lenovo ThinkPad P73-20QR002DGE | |
| Asus ProArt StudioBook Pro 17 W700G3T | |
| Cinebench R15 / CPU Multi 64Bit | |
| Average of class Workstation (2404 - 5810, n=26, last 2 years) | |
| Lenovo ThinkPad P17 G2-20YU0025G | |
| Lenovo IdeaPad 5 Pro 16ACH | |
| Average Intel Core i7-11800H (1342 - 2173, n=50) | |
| Dell Precision 5000 5750 P92F | |
| HP ZBook Fury 17 G7 119W5EA | |
| Lenovo ThinkPad P73-20QR002DGE | |
| Asus ProArt StudioBook Pro 17 W700G3T | |
| Asus ProArt StudioBook Pro 17 W700G3T | |
| Blender / v2.79 BMW27 CPU | |
| Lenovo ThinkPad P73-20QR002DGE | |
| Asus ProArt StudioBook Pro 17 W700G3T | |
| HP ZBook Fury 17 G7 119W5EA | |
| Dell Precision 5000 5750 P92F | |
| Average Intel Core i7-11800H (217 - 454, n=46) | |
| Lenovo IdeaPad 5 Pro 16ACH | |
| Lenovo ThinkPad P17 G2-20YU0025G | |
| Average of class Workstation (91 - 261, n=26, last 2 years) | |
| 7-Zip 18.03 / 7z b 4 -mmt1 | |
| Average of class Workstation (4981 - 6960, n=26, last 2 years) | |
| HP ZBook Fury 17 G7 119W5EA | |
| Dell Precision 5000 5750 P92F | |
| Average Intel Core i7-11800H (5138 - 5732, n=46) | |
| Lenovo ThinkPad P17 G2-20YU0025G | |
| Lenovo IdeaPad 5 Pro 16ACH | |
| Lenovo ThinkPad P73-20QR002DGE | |
| Asus ProArt StudioBook Pro 17 W700G3T | |
| 7-Zip 18.03 / 7z b 4 | |
| Average of class Workstation (53407 - 116969, n=26, last 2 years) | |
| Lenovo IdeaPad 5 Pro 16ACH | |
| Lenovo ThinkPad P17 G2-20YU0025G | |
| Average Intel Core i7-11800H (33718 - 56758, n=46) | |
| Dell Precision 5000 5750 P92F | |
| HP ZBook Fury 17 G7 119W5EA | |
| Asus ProArt StudioBook Pro 17 W700G3T | |
| Lenovo ThinkPad P73-20QR002DGE | |
| Geekbench 5.5 / Single-Core | |
| Average of class Workstation (1759 - 2183, n=26, last 2 years) | |
| Average Intel Core i7-11800H (1429 - 1625, n=40) | |
| Lenovo ThinkPad P17 G2-20YU0025G | |
| Lenovo IdeaPad 5 Pro 16ACH | |
| Dell Precision 5000 5750 P92F | |
| HP ZBook Fury 17 G7 119W5EA | |
| Asus ProArt StudioBook Pro 17 W700G3T | |
| Lenovo ThinkPad P73-20QR002DGE | |
| Geekbench 5.5 / Multi-Core | |
| Average of class Workstation (11542 - 25554, n=26, last 2 years) | |
| Average Intel Core i7-11800H (4655 - 9851, n=40) | |
| Dell Precision 5000 5750 P92F | |
| Lenovo ThinkPad P17 G2-20YU0025G | |
| Lenovo IdeaPad 5 Pro 16ACH | |
| HP ZBook Fury 17 G7 119W5EA | |
| Asus ProArt StudioBook Pro 17 W700G3T | |
| Lenovo ThinkPad P73-20QR002DGE | |
| HWBOT x265 Benchmark v2.2 / 4k Preset | |
| Average of class Workstation (14.4 - 40.5, n=26, last 2 years) | |
| Lenovo ThinkPad P17 G2-20YU0025G | |
| Lenovo IdeaPad 5 Pro 16ACH | |
| Average Intel Core i7-11800H (7.38 - 17.4, n=46) | |
| Dell Precision 5000 5750 P92F | |
| HP ZBook Fury 17 G7 119W5EA | |
| Lenovo ThinkPad P73-20QR002DGE | |
| Asus ProArt StudioBook Pro 17 W700G3T | |
| LibreOffice / 20 Documents To PDF | |
| Asus ProArt StudioBook Pro 17 W700G3T | |
| HP ZBook Fury 17 G7 119W5EA | |
| Lenovo ThinkPad P17 G2-20YU0025G | |
| Average of class Workstation (37.1 - 74.7, n=26, last 2 years) | |
| Lenovo IdeaPad 5 Pro 16ACH | |
| Average Intel Core i7-11800H (38.6 - 59.9, n=45) | |
| Dell Precision 5000 5750 P92F | |
| R Benchmark 2.5 / Overall mean | |
| Asus ProArt StudioBook Pro 17 W700G3T | |
| HP ZBook Fury 17 G7 119W5EA | |
| Lenovo ThinkPad P17 G2-20YU0025G | |
| Dell Precision 5000 5750 P92F | |
| Average Intel Core i7-11800H (0.548 - 0.615, n=46) | |
| Lenovo IdeaPad 5 Pro 16ACH | |
| Average of class Workstation (0.3825 - 0.603, n=26, last 2 years) | |
* ... smaller is better
System Performance
As expected, the high-end hardware performs exceptionally in PCMark 10. Similarly, the day-to-day performance feels fast as well.
| PCMark 10 / Score | |
| Average of class Workstation (6436 - 9723, n=22, last 2 years) | |
| Lenovo ThinkPad P17 G2-20YU0025G | |
| Average Intel Core i7-11800H, NVIDIA RTX A2000 Laptop GPU (n=1) | |
| Lenovo ThinkPad P73-20QR002DGE | |
| Dell Precision 5000 5750 P92F | |
| HP ZBook Fury 17 G7 119W5EA | |
| Asus ProArt StudioBook Pro 17 W700G3T | |
| PCMark 10 / Essentials | |
| Average of class Workstation (9622 - 11157, n=22, last 2 years) | |
| Dell Precision 5000 5750 P92F | |
| Lenovo ThinkPad P17 G2-20YU0025G | |
| Average Intel Core i7-11800H, NVIDIA RTX A2000 Laptop GPU (n=1) | |
| Lenovo ThinkPad P73-20QR002DGE | |
| Asus ProArt StudioBook Pro 17 W700G3T | |
| HP ZBook Fury 17 G7 119W5EA | |
| PCMark 10 / Productivity | |
| Average of class Workstation (8789 - 18261, n=22, last 2 years) | |
| Lenovo ThinkPad P17 G2-20YU0025G | |
| Average Intel Core i7-11800H, NVIDIA RTX A2000 Laptop GPU (n=1) | |
| Dell Precision 5000 5750 P92F | |
| Asus ProArt StudioBook Pro 17 W700G3T | |
| Lenovo ThinkPad P73-20QR002DGE | |
| HP ZBook Fury 17 G7 119W5EA | |
| PCMark 10 / Digital Content Creation | |
| Average of class Workstation (7744 - 15631, n=22, last 2 years) | |
| Lenovo ThinkPad P17 G2-20YU0025G | |
| Average Intel Core i7-11800H, NVIDIA RTX A2000 Laptop GPU (n=1) | |
| HP ZBook Fury 17 G7 119W5EA | |
| Lenovo ThinkPad P73-20QR002DGE | |
| Dell Precision 5000 5750 P92F | |
| Asus ProArt StudioBook Pro 17 W700G3T | |
| PCMark 10 Score | 6430 points | |
Help | ||
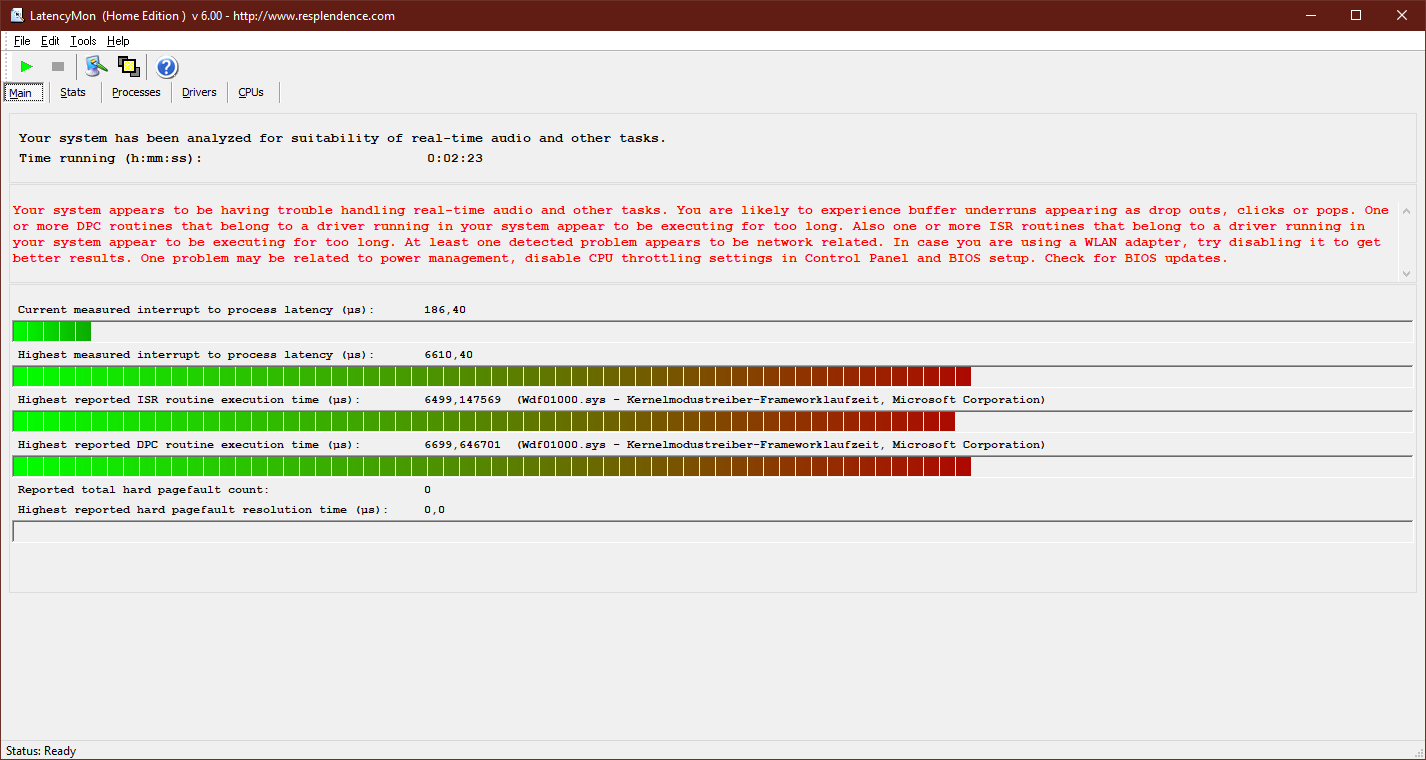
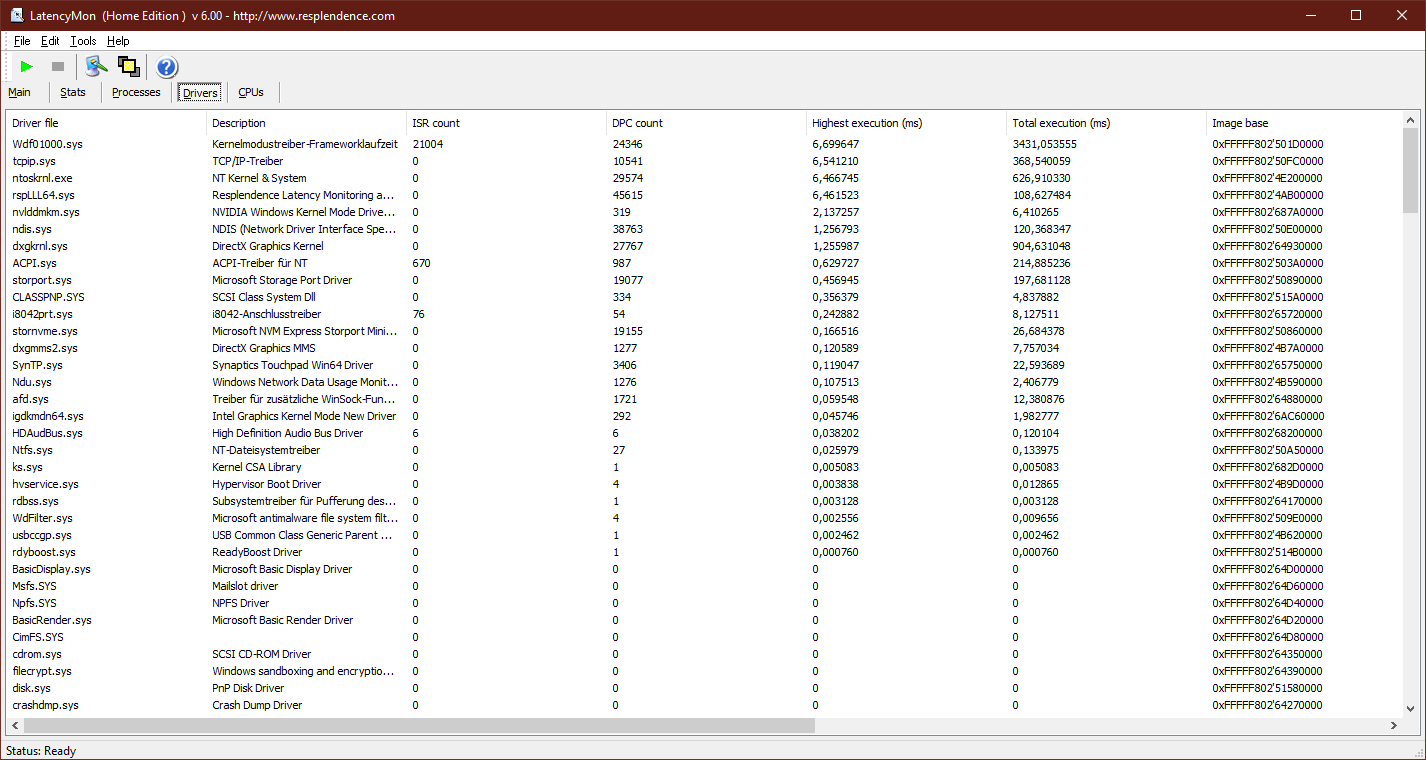
DPC Latencies
Unfortunately, the Lenovo ThinkPad P17 Gen 2 clearly struggles with DPC latency issues. This may lead to interruptions during real-time audio and video editing. The only solution would be a driver update from Lenovo.
| DPC Latencies / LatencyMon - interrupt to process latency (max), Web, Youtube, Prime95 | |
| Lenovo ThinkPad P17 G2-20YU0025G | |
| HP ZBook Fury 17 G7 119W5EA | |
* ... smaller is better
Storage Solution
The installed 512GB SSD was manufactured by Kioxia, formerly known as Toshiba Memory. The M.2-2280 Kioxia XG7 SSD is faster than the Toshiba XG6 SSD from the previous generation. However, the NVMe PCIe 4.0 SSD cannot quite match the Samsung PM981.
| Lenovo ThinkPad P17 G2-20YU0025G Kioxia XG7 KXG7AZNV512G | Lenovo ThinkPad P73-20QR002DGE Intel SSD Pro 7600p SSDPEKKF512G8L | HP ZBook Fury 17 G7 119W5EA WDC PC SN730 SDBPNTY-1T00 | Dell Precision 5000 5750 P92F Toshiba Kioxia XG6 KXG60PNV1T02 | Asus ProArt StudioBook Pro 17 W700G3T Samsung SSD PM981 MZVLB1T0HALR | Average Kioxia XG7 KXG7AZNV512G | |
|---|---|---|---|---|---|---|
| AS SSD | -16% | 1% | -34% | 14% | 10% | |
| Seq Read (MB/s) | 3997 | 2693 -33% | 2423 -39% | 2025 -49% | 2958 -26% | 4551 ? 14% |
| Seq Write (MB/s) | 1049 | 1542 47% | 1203 15% | 1438 37% | 2350 124% | 1432 ? 37% |
| 4K Read (MB/s) | 44.96 | 62.6 39% | 42.24 -6% | 38.77 -14% | 56.6 26% | 46.2 ? 3% |
| 4K Write (MB/s) | 115.3 | 149.5 30% | 115.5 0% | 96.9 -16% | 106.1 -8% | 126.3 ? 10% |
| 4K-64 Read (MB/s) | 2160 | 871 -60% | 1630 -25% | 1105 -49% | 1836 -15% | 2136 ? -1% |
| 4K-64 Write (MB/s) | 1697 | 1006 -41% | 1979 17% | 1435 -15% | 1789 5% | 1700 ? 0% |
| Access Time Read * (ms) | 0.156 | 0.058 63% | 0.057 63% | 0.08 49% | 0.061 61% | 0.1105 ? 29% |
| Access Time Write * (ms) | 0.036 | 0.067 -86% | 0.033 8% | 0.116 -222% | 0.036 -0% | 0.033 ? 8% |
| Score Read (Points) | 2605 | 1203 -54% | 1915 -26% | 1347 -48% | 2189 -16% | 2638 ? 1% |
| Score Write (Points) | 1918 | 1309 -32% | 2215 15% | 1676 -13% | 2130 11% | 1970 ? 3% |
| Score Total (Points) | 5700 | 3088 -46% | 5047 -11% | 3686 -35% | 5411 -5% | 5793 ? 2% |
* ... smaller is better

Continuous read performance: DiskSpd Read Loop, Queue Depth 8
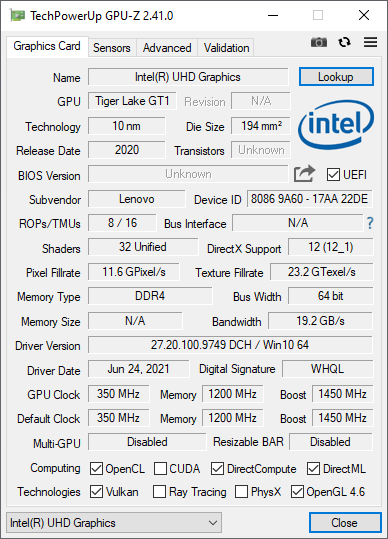
GPU Performance

The Nvidia RTX A2000 is part of the new professional Nvidia GPU lineup that no longer carries the "Quadro" name. It is based on Nvidia's latest Ampere architecture and offers 2560 pipelines. A comparison with other graphics chips can be found on our dedicated GPU comparison page.
The GPU within the Lenovo ThinkPad P17 G2 has access to four gigabytes of dedicated GDDR6 RAM over a 128-bit bus. The 60-watt version inside the Lenovo laptop achieves a respectable performance level that is similar to that of the RTX 3000 Max-Q in the Dell Precision 5750, while being around 20% slower than the RTX 4000 Max-Q in the ZBook Fury 17, depending on the benchmark.
The performance is severely limited in battery mode. When not connected to an AC adapter, the GPU performance drops by almost 40%.
| 3DMark 06 Standard Score | 36019 points | |
| 3DMark Vantage P Result | 63738 points | |
| 3DMark 11 Performance | 18193 points | |
| 3DMark Ice Storm Standard Score | 94347 points | |
| 3DMark Cloud Gate Standard Score | 42670 points | |
| 3DMark Fire Strike Score | 13170 points | |
| 3DMark Time Spy Score | 5904 points | |
Help | ||
Gaming Performance
The Lenovo ThinkPad P17 G2 is definitely not made for gaming, but game development may make sense. The RTX A2000 is well-equipped to handle modern titles, although achieving a constant 60 FPS in the latest titles is not always possible at the highest settings. For 4K gaming, a more powerful version of the Lenovo ThinkPad P17 G2 is recommended.
| The Witcher 3 - 1920x1080 High Graphics & Postprocessing (Nvidia HairWorks Off) | |
| Average of class Workstation (53.4 - 259, n=6, last 2 years) | |
| HP ZBook Fury 17 G7 119W5EA | |
| Dell Precision 5000 5750 P92F | |
| Lenovo ThinkPad P73-20QR002DGE | |
| Asus ProArt StudioBook Pro 17 W700G3T | |
| Lenovo ThinkPad P17 G2-20YU0025G | |
| Average NVIDIA RTX A2000 Laptop GPU (45 - 108.6, n=9) | |
Witcher 3 FPS-Diagram
| low | med. | high | ultra | |
|---|---|---|---|---|
| GTA V (2015) | 173 | 164 | 119 | 69.1 |
| The Witcher 3 (2015) | 256 | 160 | 95.8 | 54 |
| Dota 2 Reborn (2015) | 156 | 133 | 129 | 121 |
| Final Fantasy XV Benchmark (2018) | 131 | 76.3 | 51.6 | |
| X-Plane 11.11 (2018) | 115 | 97.9 | 78.5 | |
| Strange Brigade (2018) | 290 | 135 | 110 | 95.7 |
| Shadow of the Tomb Raider (2018) | 111 | 70.4 | 67.3 | 61.6 |
| Hunt Showdown (2020) | 169 | 81.2 | 68.6 | |
| Doom Eternal (2020) | 207 | 110 | ||
| Gears Tactics (2020) | 143 | 125 | 85.1 | 63.9 |
| Horizon Zero Dawn (2020) | 109 | 77.9 | 70.1 | 54.8 |
| Mafia Definitive Edition (2020) | 118 | 68.6 | 63.7 | |
| Outriders (2021) | 127 | 86.9 | 56 | |
| Days Gone (2021) | 123 | 85.5 | 76.6 | 57.7 |
| F1 2021 (2021) | 205 | 137 | 109 | 50.6 |
| Deathloop (2021) | 104 | 64.3 | 50.8 | 42.3 |
| New World (2021) | 83.2 | 68.6 | 63.5 | 52.4 |
Emissions: Less heat & noise than the ThinkPad P15 G2
System noise
During idle, both fans of the Lenovo ThinkPad P17 G2 remain silent. In our median load test, we measured a maximum noise level of 38.1 dB(A), which is fairly noticeable already. Under maximum load, the fans further increase their speeds and at 45 dB(A), approach the limit of what is bearable. At least, the P17 does not get as noisy as its smaller sibling, the ThinkPad P15 G2, which can reach a deafening 54.9 dB(A).
We did not notice any coil whine from our ThinkPad P17 G2 test unit.
Noise level
| Idle |
| 26.4 / 26.4 / 26.4 dB(A) |
| Load |
| 38.1 / 45 dB(A) |
 | ||
30 dB silent 40 dB(A) audible 50 dB(A) loud |
||
min: | ||
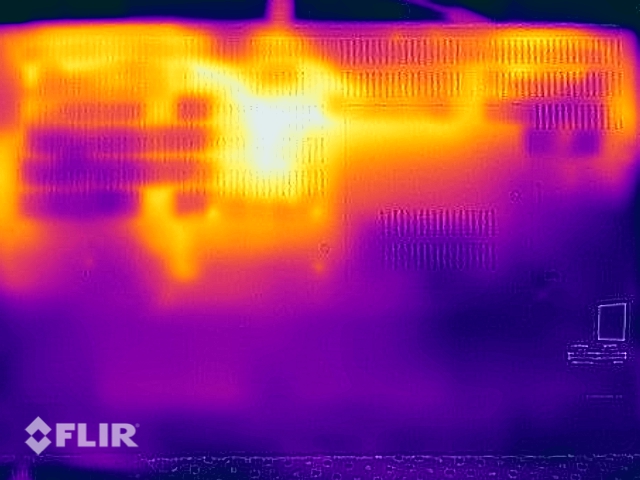
Temperature
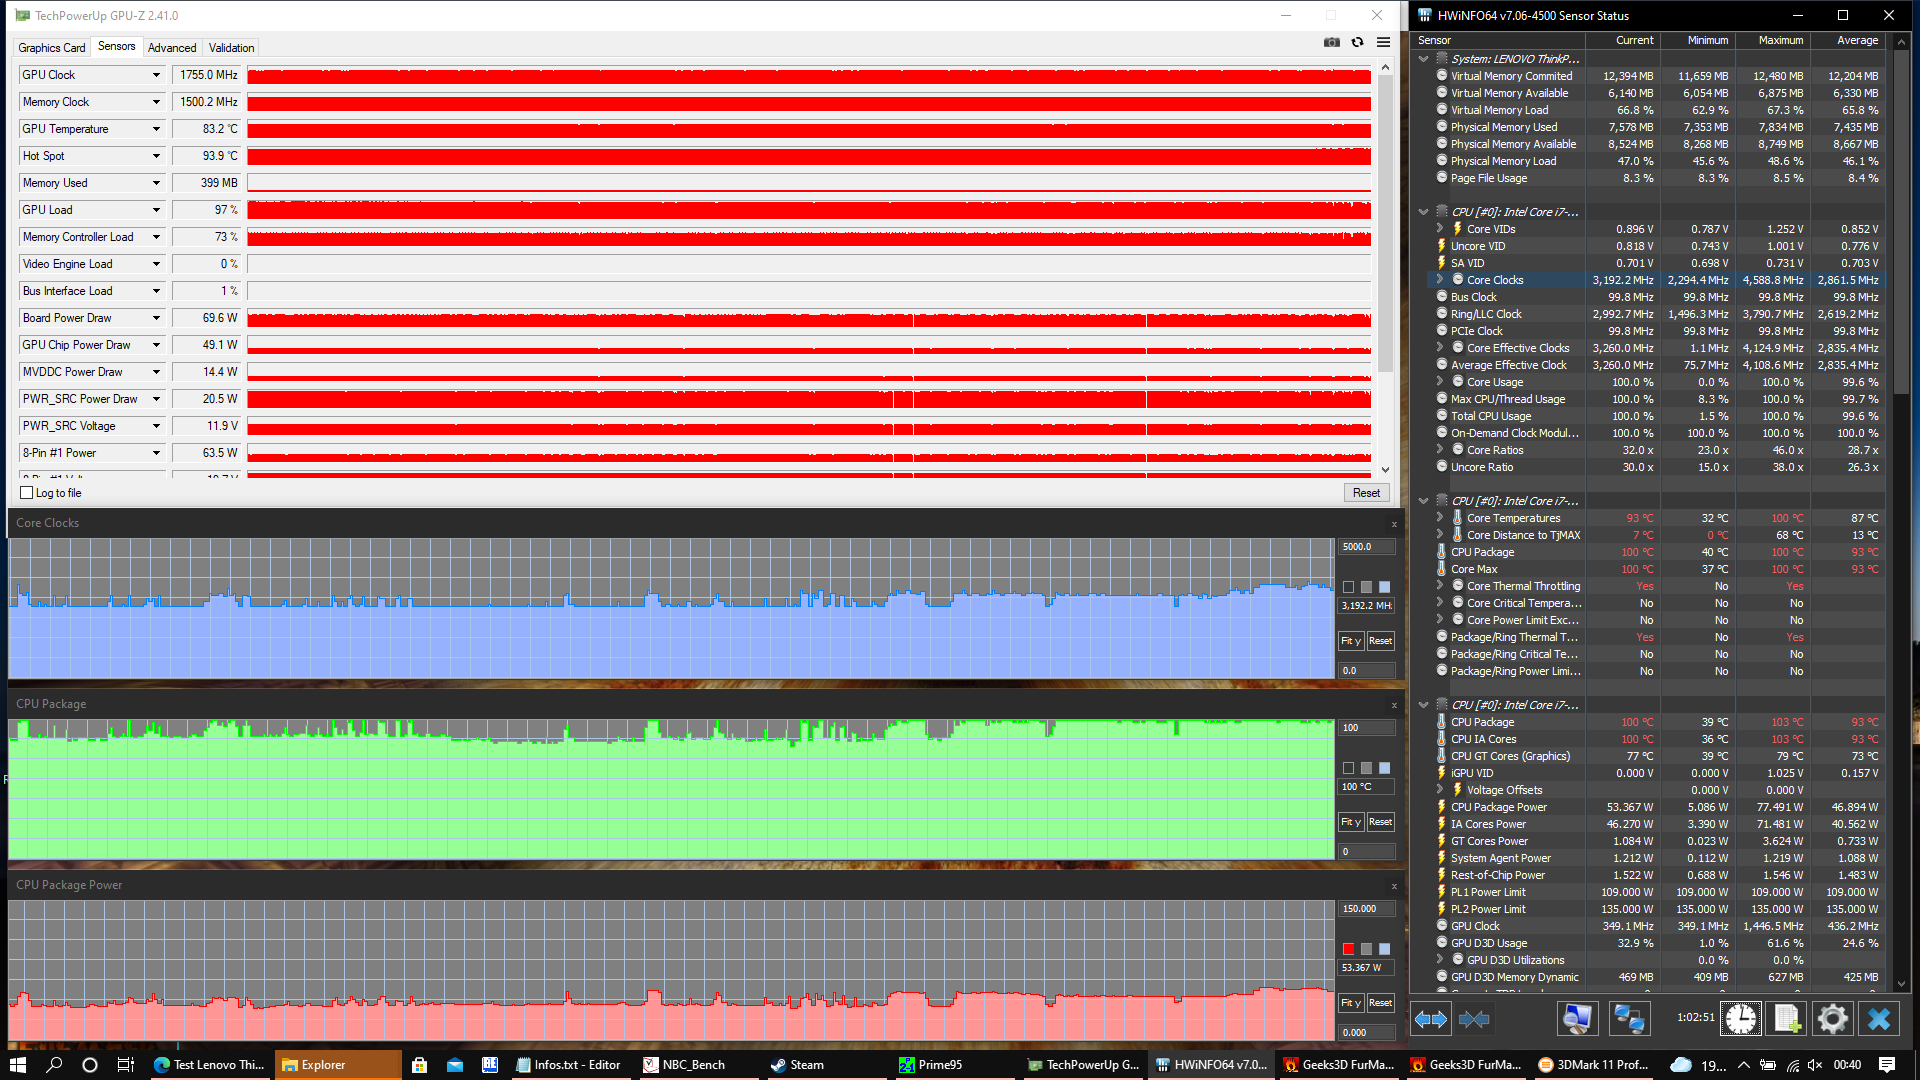
The ThinkPad remains cool while idling. During our stress test, the hot spots are located near the back corners of the base unit, while the hot spot on the bottom lies in the center between the back corners. The hottest recorded temperature was 125.78 °F. At 129.56 °F, the peak temperature during our Witcher 3 test was even higher.
During the stress test, both the CPU and GPU have to decrease their performance. After one hour, the GPU power consumption sits at 50 watts, while the processor's power limit also fluctuates around 50 watts. Even though the Lenovo ThinkPad P17 G2 then no longer runs at its maximum speed, the clock speeds still remain relatively high. A 3DMark performed directly after the stress test did not yield a significantly lower score. During daily use, throttling should not become an issue for users of the ThinkPad P17 G2.
(-) The maximum temperature on the upper side is 49.6 °C / 121 F, compared to the average of 38.2 °C / 101 F, ranging from 22.2 to 69.8 °C for the class Workstation.
(-) The bottom heats up to a maximum of 52.1 °C / 126 F, compared to the average of 41.1 °C / 106 F
(+) In idle usage, the average temperature for the upper side is 25.3 °C / 78 F, compared to the device average of 32 °C / 90 F.
(±) Playing The Witcher 3, the average temperature for the upper side is 34.8 °C / 95 F, compared to the device average of 32 °C / 90 F.
(+) The palmrests and touchpad are cooler than skin temperature with a maximum of 30 °C / 86 F and are therefore cool to the touch.
(-) The average temperature of the palmrest area of similar devices was 27.8 °C / 82 F (-2.2 °C / -4 F).

Speakers
Like on the predecessor, the Lenovo has placed the stereo speakers above the keyboard of the ThinkPad P17 G2. Although they are lacking in terms of bass, volume and balance, they are at least louder than their counterparts on the Lenovo ThinkPad P73.
However, an external solution is preferred, regardless of whether you choose speakers or headphones. The dedicated 3.5mm audio jack works flawlessly.
Lenovo ThinkPad P17 G2-20YU0025G audio analysis
(±) | speaker loudness is average but good (76.6 dB)
Bass 100 - 315 Hz
(±) | reduced bass - on average 14.5% lower than median
(±) | linearity of bass is average (9.6% delta to prev. frequency)
Mids 400 - 2000 Hz
(±) | higher mids - on average 6.9% higher than median
(±) | linearity of mids is average (7.7% delta to prev. frequency)
Highs 2 - 16 kHz
(+) | balanced highs - only 2.6% away from median
(+) | highs are linear (6.6% delta to prev. frequency)
Overall 100 - 16.000 Hz
(±) | linearity of overall sound is average (20.1% difference to median)
Compared to same class
» 71% of all tested devices in this class were better, 6% similar, 24% worse
» The best had a delta of 7%, average was 17%, worst was 35%
Compared to all devices tested
» 51% of all tested devices were better, 8% similar, 41% worse
» The best had a delta of 4%, average was 24%, worst was 134%
HP ZBook Fury 17 G7 119W5EA audio analysis
(±) | speaker loudness is average but good (78.6 dB)
Bass 100 - 315 Hz
(±) | reduced bass - on average 7.9% lower than median
(±) | linearity of bass is average (11.1% delta to prev. frequency)
Mids 400 - 2000 Hz
(+) | balanced mids - only 2.8% away from median
(+) | mids are linear (3.9% delta to prev. frequency)
Highs 2 - 16 kHz
(+) | balanced highs - only 2.7% away from median
(+) | highs are linear (4.8% delta to prev. frequency)
Overall 100 - 16.000 Hz
(+) | overall sound is linear (10.9% difference to median)
Compared to same class
» 9% of all tested devices in this class were better, 4% similar, 86% worse
» The best had a delta of 7%, average was 17%, worst was 35%
Compared to all devices tested
» 6% of all tested devices were better, 2% similar, 93% worse
» The best had a delta of 4%, average was 24%, worst was 134%
Lenovo ThinkPad P73-20QR002DGE audio analysis
(-) | not very loud speakers (70.2 dB)
Bass 100 - 315 Hz
(±) | reduced bass - on average 14.5% lower than median
(±) | linearity of bass is average (14% delta to prev. frequency)
Mids 400 - 2000 Hz
(±) | higher mids - on average 7.3% higher than median
(+) | mids are linear (5.1% delta to prev. frequency)
Highs 2 - 16 kHz
(±) | reduced highs - on average 5.1% lower than median
(±) | linearity of highs is average (8% delta to prev. frequency)
Overall 100 - 16.000 Hz
(±) | linearity of overall sound is average (29.3% difference to median)
Compared to same class
» 96% of all tested devices in this class were better, 1% similar, 3% worse
» The best had a delta of 7%, average was 17%, worst was 35%
Compared to all devices tested
» 87% of all tested devices were better, 3% similar, 10% worse
» The best had a delta of 4%, average was 24%, worst was 134%
Energy Management: Small battery meets low power consumption
Energy Consumption
The Lenovo ThinkPad P17 G2 is the only 17-inch workstation in our comparison that is equipped with one of the latest Tiger Lake CPUs. It appears that the more efficient 10-nanometer chips consume slightly less power, since both the FHD and the 4K competitors draw more power during idle.
The proprietary slim-tip AC adapter is rated for 170 watts. This almost exactly matches the Lenovo ThinkPad P17 G2's consumption under load. Due to this, more powerful P17 Gen 2 models come with a larger 230-watt AC adapter.
| Off / Standby | |
| Idle | |
| Load |
|
Key:
min: | |
| Lenovo ThinkPad P17 G2-20YU0025G i7-11800H, RTX A2000 Laptop GPU, Kioxia XG7 KXG7AZNV512G, IPS LED, 1920x1080, 17.3" | Lenovo ThinkPad P73-20QR002DGE i7-9850H, Quadro RTX 3000 (Laptop), Intel SSD Pro 7600p SSDPEKKF512G8L, IPS LED, 1920x1080, 17.3" | HP ZBook Fury 17 G7 119W5EA i9-10885H, Quadro RTX 4000 Max-Q, WDC PC SN730 SDBPNTY-1T00, , 3840x2160, 17.3" | Dell Precision 5000 5750 P92F W-10885M, Quadro RTX 3000 Max-Q, Toshiba Kioxia XG6 KXG60PNV1T02, IPS, 3840x2400, 17" | Asus ProArt StudioBook Pro 17 W700G3T i7-9750H, Quadro RTX 3000 Max-Q, Samsung SSD PM981 MZVLB1T0HALR, IPS, 1920x1200, 17" | Average NVIDIA RTX A2000 Laptop GPU | Average of class Workstation | |
|---|---|---|---|---|---|---|---|
| Power Consumption | -20% | -23% | -10% | -25% | -12% | -20% | |
| Idle Minimum * (Watt) | 6.1 | 8.9 -46% | 5.8 5% | 6.3 -3% | 11.3 -85% | 6.6 ? -8% | 8.89 ? -46% |
| Idle Average * (Watt) | 10.9 | 12.8 -17% | 14.8 -36% | 14.2 -30% | 16 -47% | 11.8 ? -8% | 13.4 ? -23% |
| Idle Maximum * (Watt) | 12.3 | 16.4 -33% | 17 -38% | 17.3 -41% | 16.8 -37% | 16.7 ? -36% | 17.6 ? -43% |
| Load Average * (Watt) | 106.3 | 108.4 -2% | 120.4 -13% | 121.2 -14% | 93.6 12% | 116.3 ? -9% | 91.7 ? 14% |
| Witcher 3 ultra * (Watt) | 124 | 153 -23% | 168.4 -36% | 115.4 7% | 106 15% | ||
| Load Maximum * (Watt) | 168.9 | 166 2% | 199.8 -18% | 130.7 23% | 186.6 -10% | 171.3 ? -1% | 170.2 ? -1% |
* ... smaller is better
Energy absorption Witcher 3 / Stress test
Battery Life

The battery capacity has shrunk compared to the Lenovo ThinkPad P73 with 94 from 99 Wh. As a result, the battery life has decreased as well despite the lower power consumption of the system. However, almost ten hours of Wi-Fi use is still a respectable result for a workstation that is unlikely to be used a lot while traveling.
| Lenovo ThinkPad P17 G2-20YU0025G i7-11800H, RTX A2000 Laptop GPU, 94 Wh | Lenovo ThinkPad P73-20QR002DGE i7-9850H, Quadro RTX 3000 (Laptop), 99 Wh | HP ZBook Fury 17 G7 119W5EA i9-10885H, Quadro RTX 4000 Max-Q, 94 Wh | Dell Precision 5000 5750 P92F W-10885M, Quadro RTX 3000 Max-Q, 97 Wh | Asus ProArt StudioBook Pro 17 W700G3T i7-9750H, Quadro RTX 3000 Max-Q, 57 Wh | Average of class Workstation | |
|---|---|---|---|---|---|---|
| Battery runtime | 5% | 2% | 34% | -15% | -6% | |
| H.264 (h) | 9.5 | 9.8 3% | 10.3 8% | 6.9 -27% | 9.51 ? 0% | |
| WiFi v1.3 (h) | 9.8 | 11.1 13% | 7.6 -22% | 10.9 11% | 5.9 -40% | 8.4 ? -14% |
| Load (h) | 1.4 | 1.4 0% | 1.7 21% | 2.2 57% | 1.7 21% | 1.364 ? -3% |
Pros
Cons
Verdict: Lenovo ThinkPad P17 G2 makes sense in a high-end configuration

Workstations are for people who know they need them. Systems that fall into the same category as the ThinkPad P17 G2 are not meant for general use, but rather for engineers who design buildings or products with the help of CAD applications.
Although it is important to keep this in mind, it is not an excuse for the weaknesses of the Lenovo ThinkPad P17 G2. The outdated design is an obvious drawback: 16:9 displays with wide bezels are no longer contemporary, particularly when it comes to high-end devices. They also make the Lenovo ThinkPad P17 G2 unnecessarily large and heavy. Another disadvantage: The display does not reach the advertised 100% sRGB coverage and the Full HD resolution feels too low for a 17-inch screen. Furthermore, the problematic DPC latencies are worth mentioning.
Excellent input devices, a robust chassis, a wide variety of features - the P17 G2 comes with many advantages that are typical for a ThinkPad. Additionally, there are model-specific strengths such as the expandability and the performance. The CPU performs particularly well and unlike the smaller Lenovo ThinkPad P15 G2, the P17 G2's heat and noise levels are slightly lower. Here, the spacious chassis is definitely advantageous.
Big and heavy, but also fast and easily upgradeable: The Lenovo ThinkPad P17 G2 is a traditional take on workstations.
While we will gladly recommend the ThinkPad P17 G2, we would advise against choosing our test configuration. The low-end model simply does not offer enough advantages over more compact workstations such as the HP ZBook Fury 17. The ThinkPad system is best suited to buyers who want the highest-end configuration and can take advantage of the maximum specifications of the ThinkPad P17 G2.
Price and availability
Our test configuration is by no means cheap at around $2500 USD. There are discounts available for the Lenovo ThinkPad P17 G2 if you are a student or eligible for Lenovo's education program. Amazon lists the base configuration of the ThinkPad with an Nvidia RTX A2000 for around $2350 USD.
Lenovo ThinkPad P17 G2-20YU0025G
- 10/01/2021 v7 (old)
Benjamin Herzig
Price comparison