Notebookcheck Logo
Teaser

Gigabyte G5 KF5 2024 laptop review: RTX 4060 gaming at a bargain price - is the deal worth it?

Mega bargain?

Intel Core i7-13620H, an RTX 4060, plus 16 GB RAM and a 1 TB SSD — all for 899 euros. You can't get an RTX 4060 gamer much cheaper at the moment. We check whether the latest G5 is worth the money and a candidate for our list of the best value gaming laptops.
Christian Hintze, 👁 Christian Hintze, Anton Avdyushkin (translated by DeepL / Ninh Duy) Published 🇩🇪 🇫🇷 ...
Alder Lake Deal Gaming Geforce GPU Laptop Nvidia Raptor Lake

Verdict - Cooling system as the problematic area

An RTX 4060 laptop for just 899 euros has its appeal, and you can accept a 720p webcam, the lack of a Thunderbolt port, and perhaps even the slightly higher noise. The G5 also does some things surprisingly well: the subtle design is pleasing, the keyboard is more than solid, the rather average display shines with high color accuracy and the CPU performance is slightly above average.

What is not right, however, is the cooling system: if the CPU constantly reaches 100 °C during gaming, this is not necessarily conducive to the durability of the hardware. No wonder the laptop is also quite loud. This may be a fault of our test model, but the predecessor also had to contend with temperature problems. We don't understand why Gigabyte didn't fix this weak point between the two laptop generations. If the manufacturer does discover a fault in our model, we will update the test.

Pros

+ low price
+ 2 M.2 SSD slots
+ good keyboard
+ calibrated display is very true to color (sRGB)
+ good CPU performance

Cons

- no Thunderbolt
- 720p webcam
- no MUX switch
- CPU gets too hot during gaming
- SSD throttling
- high latencies
- somewhat below-average graphics performance
- overstrained cooling system
- comparatively loud

Price and availability

Some SKUs of the Gigabyte G5 KF5 2024 is available from various online stores, including Amazon.

Bestpreis 1197.46 € notebooksbilliger.de
GIGABYTE G5 KF5-H3DE554KD, Core i7-13620H, 16GB RAM, 1TB SSD, GeForce RTX 4060, DE
2. 1207.52 € notebooksbilliger.at

Price comparison

Possible competitors in comparison

Image
Model / Review
Geizhals
Weight
Height
Display
1.
76.3%
Gigabyte G5 KF5 2024
Intel Core i7-13620H ⎘
NVIDIA GeForce RTX 4060 Laptop GPU ⎘
16 GB Memory, 1024 GB SSD
Bestpreis 1197.46€ notebooksbilliger.de
2. 1207.52€ notebooksbilliger.at
2 kg22.7 mm15.60"
1920x1080
141 PPI
IPS
2.
79%
Lenovo LOQ 15IRX9
Lenovo LOQ 15IRX9
Intel Core i5-13450HX ⎘
NVIDIA GeForce RTX 4060 Laptop GPU ⎘
16 GB Memory, 1024 GB SSD
Bestpreis 969€ hardwarecamp24
2.4 kg23.9 mm15.60"
1920x1080
141 PPI
IPS
3.
80.3%
Asus TUF Gaming A15 FA507UV
AMD Ryzen 9 8945H ⎘
NVIDIA GeForce RTX 4060 Laptop GPU ⎘
16 GB Memory, 1024 GB SSD
Bestpreis 1389.73€ bueromarkt-ag.de
2. 2053.02€ NRE - Computer & Service
3. 2053.02€ NRE - Computer & Service
2.1 kg22.4 mm15.60"
1920x1080
141 PPI
IPS
4.
82.3%
Lenovo Legion Pro 5 16IRX9 G9
Intel Core i7-14700HX ⎘
NVIDIA GeForce RTX 4060 Laptop GPU ⎘
32 GB Memory, 1024 GB SSD
Listenpreis 1.432 Euro
Geizhals Suche
2.5 kg26.55 mm16.00"
2560x1600
189 PPI
IPS
5.
83.4%
Dell Inspiron 16 Plus 7640
Intel Core Ultra 7 155H ⎘
NVIDIA GeForce RTX 4060 Laptop GPU ⎘
16 GB Memory, 1024 GB SSD
Listenpreis 1300 USD
Geizhals Suche
2.2 kg19.9 mm16.00"
2560x1600
189 PPI
IPS

The G5 series marks Gigabyte's affordable entry into gaming laptops. Compared to the predecessor with Intel Gen12 Alder Lake, the 2024 model gets an update to Intel Gen13 Raptor Lake, namely the Core i7-13620H and the RTX 4060 remains of course, as does the 16 GB RAM, while the SSD capacity has been doubled to 1 TB. At just 899 euros, it is even cheaper than its predecessor, making it one of the lowest prices ever in this performance segment. We test whether the current G5 KF5 is interesting for those looking to save money or whether it cuts too many corners.

In addition to its predecessor, we also compare the system with other budget gaming laptops such as the LOQ 15, and the Asus TUF Gaming A15 (2024) but also with the more expensive devices due to a lack of alternatives Lenovo Legion Pro 5 16IRX9 G9 and Dell Inspiron 16 Plus 7640.

Specifications - Core i7-13620H and RTX 4060 for under 900 euros

G5 KF5 (G5 Series)
Processor
Intel Core i7-13620H 10 x 1.8 - 4.9 GHz, Raptor Lake-H
Graphics adapter
NVIDIA GeForce RTX 4060 Laptop GPU - 8 GB VRAM, 75 W TDP, Geforce 565.90, Optimus
Memory
16 GB 
, 2x 8 GB Samsung DDR5-4800
Display
15.60 inch 16:9, 1920 x 1080 pixel 141 PPI, Sharp SHP153F (LQ156M1JW30), IPS, glossy: no, HDR, 360 Hz
Mainboard
Intel Alder Lake-P PCH
Storage
Gigabyte AG450E1024-SI, 1024 GB 
, 876 GB free
Soundcard
Intel Raptor Lake-P/U/H PCH - cAVS
Connections
1 USB 2.0, 1 USB 3.0 / 3.1 Gen1, 2 USB 3.1 Gen2, 1 HDMI, 1 DisplayPort, 1 Kensington Lock, Audio Connections: Headset + Microphone, Card Reader: MicroSD Reader
Networking
Realtek Semiconductor RTL8168/8111 PCI-E Gigabit Ethernet NIC (10/100/1000MBit/s), Intel Wi-Fi 6E AX211 (a/b/g/h/n = Wi-Fi 4/ac = Wi-Fi 5/ax = Wi-Fi 6/ Wi-Fi 6E 6 GHz), Bluetooth Bluetooth 5.2
Size
height x width x depth (in mm): 22.7 x 360 x 238 ( = 0.89 x 14.17 x 9.37 in)
Battery
54 Wh Lithium-Ion
Operating System
Microsoft Windows 11 Home
Camera
Webcam: 720p IR Webcam
Primary Camera: 0.9 MPix
Additional features
Keyboard: Chiclet 1 Zone RGB, Keyboard Light: yes, 24 Months Warranty
Weight
2.018 kg ( = 71.18 oz / 4.45 pounds), Power Supply: 478 g ( = 16.86 oz / 1.05 pounds)
Price
899 Euro
Note: The manufacturer may use components from different suppliers including display panels, drives or memory sticks with similar specifications.


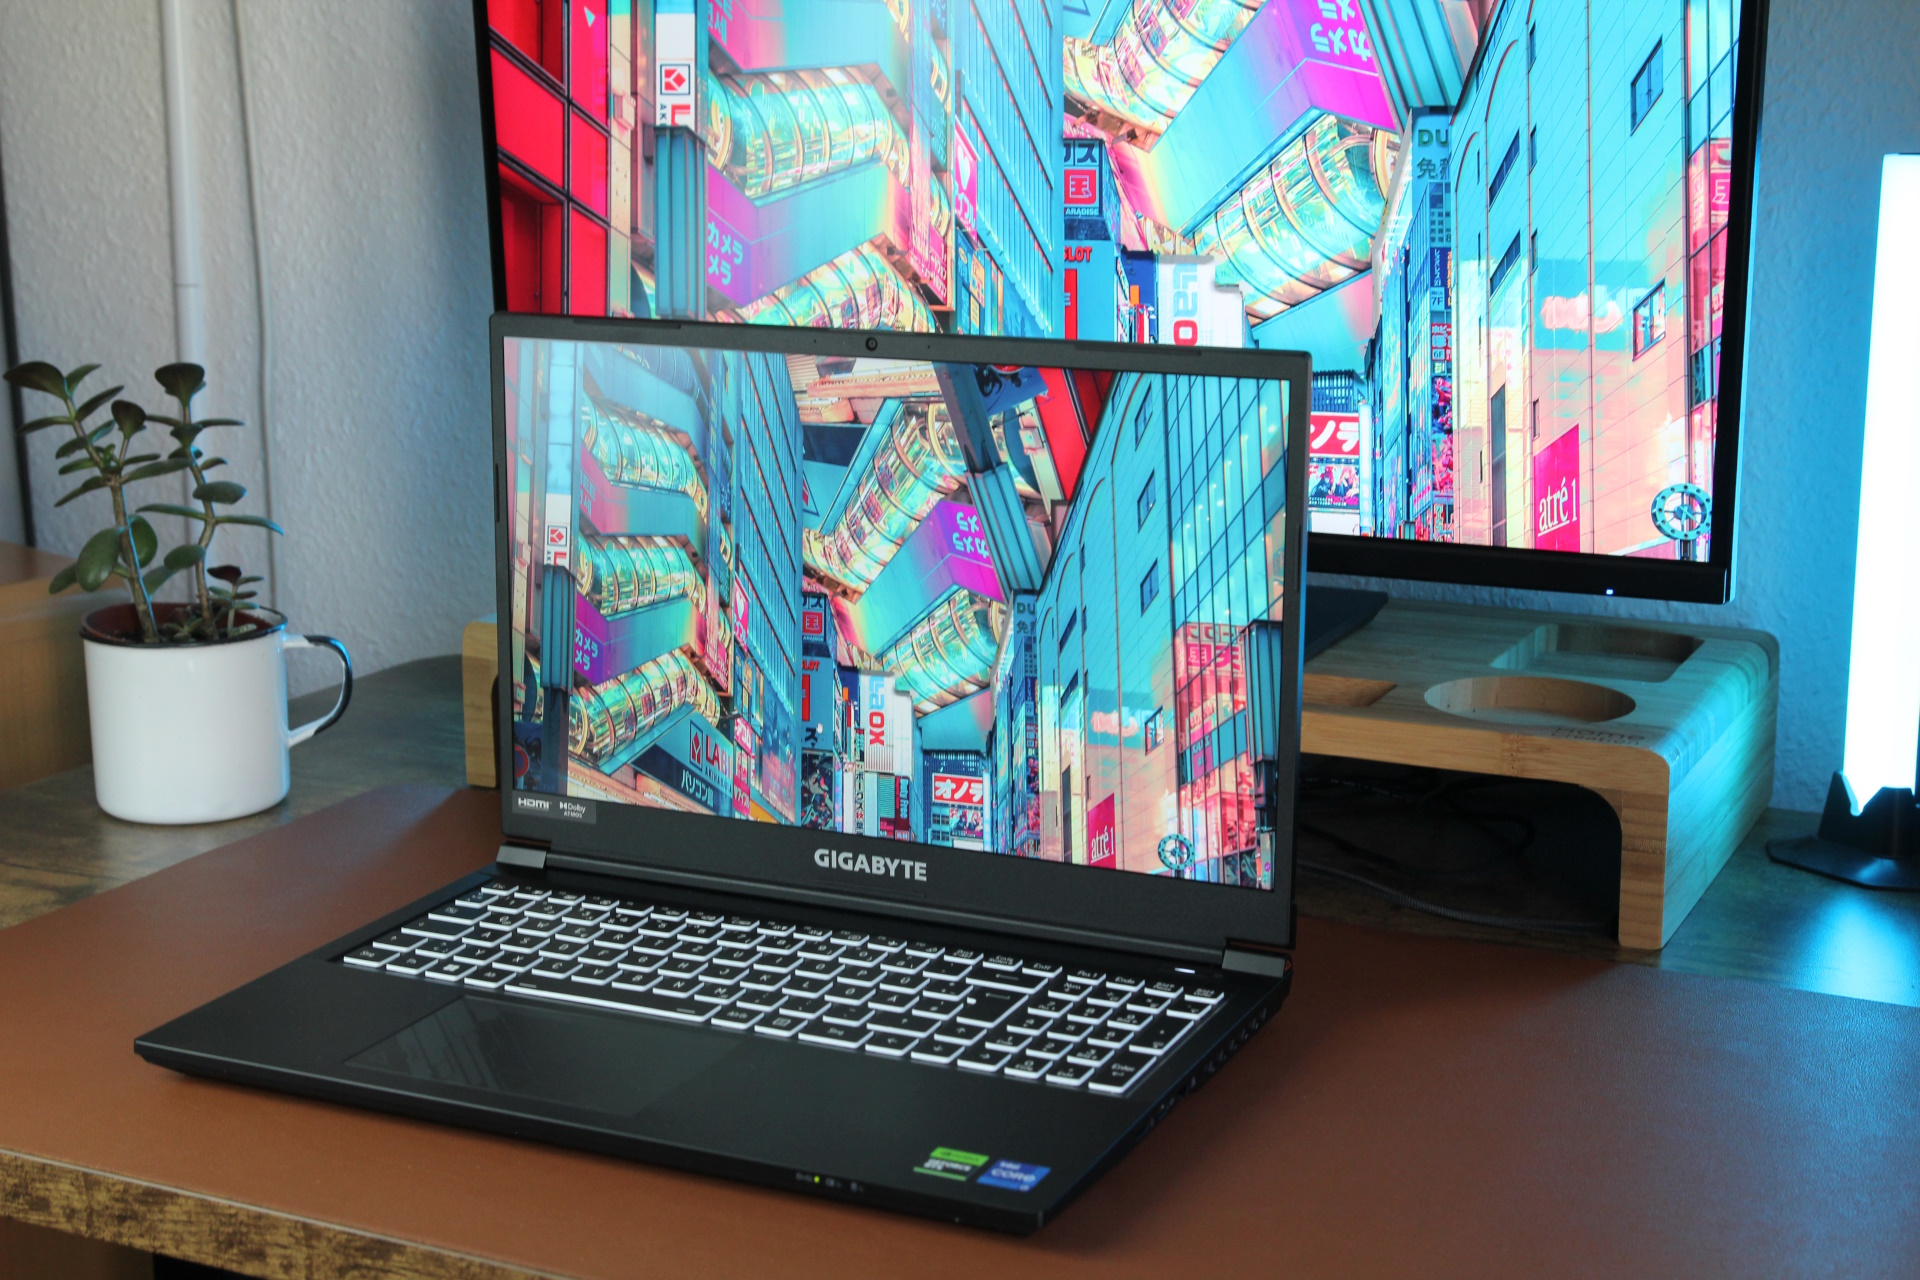
Case & features: Plastic housing in Iron Gray

Externally, virtually nothing has changed from its predecessor, as it also copied its plastic Clevo design ("Iron Gray") from the Gigabyte G5 KE (at that time still with RTX 3060). Interestingly, the former Thunderbolt 4 support of the left USB-C port has been removed. Savings were also made on the webcam, which only has a resolution of 720p, and is quite blurred; it also has high color deviations.

For maintenance, 13 Phillips screws need to be removed, two of which are covered with a sealing sticker, which could invalidate the warranty if not done properly. Inside, you have access to the two M.2 SSD slots, the removable WiFi module, the battery, two RAM slots, and the cooling system.

Without base plate
Without base plate
DDR5 RAM
DDR5 RAM
Two M.2 SSD slots plus WiFi module
The battery
The battery

The base cracks and crackles slightly when you try to twist it. The lid only rocks slightly when adjusted and opens to a maximum of 140 degrees.

Size comparison

363.4 mm / 14.3 in 261.75 mm / 10.3 in 26.55 mm / 1.045 in 2.5 kg5.43 lbs359.86 mm / 14.2 in 258.7 mm / 10.2 in 23.9 mm / 0.941 in 2.4 kg5.34 lbs360 mm / 14.2 in 238 mm / 9.37 in 22.7 mm / 0.894 in 2 kg4.45 lbs360 mm / 14.2 in 238 mm / 9.37 in 22.7 mm / 0.894 in 1.9 kg4.19 lbs356.78 mm / 14 in 250.6 mm / 9.87 in 19.9 mm / 0.783 in 2.2 kg4.87 lbs354 mm / 13.9 in 251 mm / 9.88 in 22.4 mm / 0.882 in 2.1 kg4.68 lbs297 mm / 11.7 in 210 mm / 8.27 in 1 mm / 0.03937 in 5.7 g0.01257 lbs
Left: Kensington, USB-A 3.0, USB-A 2.0, microphone jack, headset jack
Right: MicroSD reader, USB-C 3.2 Gen2, LAN (1 GbE)
Rear: USB-C 3.2 Gen2, HDMI 2.1, MiniDP 1.4, power
SD Card Reader
average JPG Copy Test (av. of 3 runs)
Average of class Gaming
  (20 - 207, n=73, last 2 years)
106.1 MB/s +50%
Gigabyte G5 KF5 2024
Intel Core i7-13620H
70.6 (55.19min - 75.59max) MB/s
Gigabyte G5 KF
Intel Core i5-12500H
69.8 (63.44min - 75.35max) MB/s -1%
Dell Inspiron 16 Plus 7640
Intel Core Ultra 7 155H (Angelbird AV Pro V60)
22.2 MB/s -69%
maximum AS SSD Seq Read Test (1GB)
Average of class Gaming
  (25.8 - 261, n=72, last 2 years)
135.9 MB/s +50%
Gigabyte G5 KF5 2024
Intel Core i7-13620H
90.74 MB/s
Gigabyte G5 KF
Intel Core i5-12500H
89.47 MB/s -1%
Dell Inspiron 16 Plus 7640
Intel Core Ultra 7 155H (Angelbird AV Pro V60)
28.7 MB/s -68%
Networking
iperf3 transmit AXE11000
Lenovo Legion Pro 5 16IRX9 G9
Intel Wi-Fi 6E AX211
1549 (752min - 1707max) MBit/s +8%
Gigabyte G5 KF5 2024
Intel Wi-Fi 6E AX211
1432 (1380min - 1467max) MBit/s
Gigabyte G5 KF
Intel Wi-Fi 6E AX211
1347 (1198min - 1410max) MBit/s -6%
Average Intel Wi-Fi 6E AX211
  (64 - 1921, n=262)
1233 MBit/s -14%
Average of class Gaming
  (469 - 1862, n=121, last 2 years)
1229 MBit/s -14%
Lenovo LOQ 15IRX9
Realtek RTL8852BE
830 (747min - 873max) MBit/s -42%
Dell Inspiron 16 Plus 7640
Intel Wi-Fi 6E AX211
811 (428min - 1008max) MBit/s -43%
Asus TUF Gaming A15 FA507UV
Realtek RTL8852BE
806 (513min - 843max) MBit/s -44%
iperf3 receive AXE11000
Gigabyte G5 KF5 2024
Intel Wi-Fi 6E AX211
1650 (1563min - 1691max) MBit/s
Gigabyte G5 KF
Intel Wi-Fi 6E AX211
1631 (1392min - 1669max) MBit/s -1%
Lenovo Legion Pro 5 16IRX9 G9
Intel Wi-Fi 6E AX211
1477 (1386min - 1517max) MBit/s -10%
Average of class Gaming
  (680 - 1741, n=121, last 2 years)
1408 MBit/s -15%
Average Intel Wi-Fi 6E AX211
  (582 - 1890, n=262)
1392 MBit/s -16%
Dell Inspiron 16 Plus 7640
Intel Wi-Fi 6E AX211
1000 (899min - 1078max) MBit/s -39%
Lenovo LOQ 15IRX9
Realtek RTL8852BE
975 (950min - 986max) MBit/s -41%
Asus TUF Gaming A15 FA507UV
Realtek RTL8852BE
956 (936min - 974max) MBit/s -42%
iperf3 transmit AXE11000 6GHz
Gigabyte G5 KF
Intel Wi-Fi 6E AX211
1594 (1547min - 1650max) MBit/s +2%
Lenovo Legion Pro 5 16IRX9 G9
Intel Wi-Fi 6E AX211
1585 (1369min - 1655max) MBit/s +1%
Gigabyte G5 KF5 2024
Intel Wi-Fi 6E AX211
1566 (780min - 1615max) MBit/s
Average of class Gaming
  (648 - 2355, n=52, last 2 years)
1407 MBit/s -10%
Average Intel Wi-Fi 6E AX211
  (385 - 1851, n=219)
1368 MBit/s -13%
Dell Inspiron 16 Plus 7640
Intel Wi-Fi 6E AX211
705 (634min - 769max) MBit/s -55%
iperf3 receive AXE11000 6GHz
Gigabyte G5 KF
Intel Wi-Fi 6E AX211
1654 (1581min - 1671max) MBit/s +4%
Gigabyte G5 KF5 2024
Intel Wi-Fi 6E AX211
1585 (1568min - 1606max) MBit/s
Lenovo Legion Pro 5 16IRX9 G9
Intel Wi-Fi 6E AX211
1540 (774min - 1556max) MBit/s -3%
Average Intel Wi-Fi 6E AX211
  (700 - 1857, n=219)
1495 MBit/s -6%
Average of class Gaming
  (853 - 1788, n=52, last 2 years)
1479 MBit/s -7%
Dell Inspiron 16 Plus 7640
Intel Wi-Fi 6E AX211
700 (607min - 805max) MBit/s -56%
05010015020025030035040045050055060065070075080085090095010001050110011501200125013001350140014501500155016001650Tooltip
Gigabyte G5 KF5 2024 Intel Wi-Fi 6E AX211; iperf3 transmit AXE11000 6GHz; iperf 3.1.3: Ø1540 (780-1615)
Gigabyte G5 KF5 2024 Intel Wi-Fi 6E AX211; iperf3 receive AXE11000 6GHz; iperf 3.1.3: Ø1584 (1568-1606)
Gigabyte G5 KF5 2024 Intel Wi-Fi 6E AX211; iperf3 transmit AXE11000; iperf 3.1.3: Ø1432 (1380-1467)
Lenovo LOQ 15IRX9 Realtek RTL8852BE; iperf3 transmit AXE11000; iperf 3.1.3: Ø830 (747-873)
Asus TUF Gaming A15 FA507UV Realtek RTL8852BE; iperf3 transmit AXE11000; iperf 3.1.3: Ø806 (513-843)
Gigabyte G5 KF5 2024 Intel Wi-Fi 6E AX211; iperf3 receive AXE11000; iperf 3.1.3: Ø1649 (1563-1691)
Lenovo LOQ 15IRX9 Realtek RTL8852BE; iperf3 receive AXE11000; iperf 3.1.3: Ø974 (950-986)
Asus TUF Gaming A15 FA507UV Realtek RTL8852BE; iperf3 receive AXE11000; iperf 3.1.3: Ø956 (936-974)
ColorChecker
19.3 ∆E
18.5 ∆E
23.1 ∆E
23.1 ∆E
20.4 ∆E
18 ∆E
23.3 ∆E
27.9 ∆E
17.2 ∆E
14 ∆E
17.4 ∆E
25.2 ∆E
26.2 ∆E
24.5 ∆E
20.6 ∆E
15.6 ∆E
19.3 ∆E
29.3 ∆E
1.8 ∆E
10.7 ∆E
20.7 ∆E
22.4 ∆E
21.5 ∆E
12.8 ∆E
ColorChecker Gigabyte G5 KF5 2024: 19.7 ∆E min: 1.76 - max: 29.31 ∆E

Sustainability

Although Gigabyte ships the G5 in a cardboard box, the gaming laptop and power supply unit are still wrapped in plastic bags inside and protected from shocks by Styrodur materials. Recycled materials are apparently not used, and the manufacturer does not provide any information about the CO2 emissions during the production of the G5.

Input devices - G5 with good input devices

The layout and labeling are slightly different from the G5 KE, but follow the direct predecessor G5 KF with its larger enter key and thinner, clearer labeling. The layout is clear and the lettering is easy to read even without a backlight. The single-zone keyboard illumination can be configured in the colors, and the brightness can be adjusted in four levels. The pressure point is pleasant with a medium stroke, while the feedback is good. Typing is quick with moderate noise emissions.

The touchpad measures approx. 12 x 7.2 cm and offers decent gliding properties, which only weaken slightly with very slow movements. The clicking noises of the integrated mouse buttons are moderate.

The keyboard
The keyboard
The touchpad
The touchpad
The buttons without illumination
The backlight
The backlight

Display - Gigabyte with sharp FHD display

No serious backlight bleeding
Subpixel structure
Subpixel structure

Gigabyte has changed the display in the G5. The last G5 models used a Chi-Mei panel, but our test sample now has a matte Full HD IPS screen from Sharp with a maximum refresh rate of 360 Hz.

On average, the screen shines at just over 300 nits, which is in the lower range these days. The illumination uniformity is a good 87 percent.

The black level and contrast are average. The panel does not switch pixels excessively quickly but it is not particularly slow either. Backlight bleeding is not a problem, nor is PWM.

Subjectively summarized, we have a decent display for the overall price, which is certainly not one of the best in its class, but does its job reliably. For higher resolutions, brighter colors, and contrasts as well as other panel technologies (OLED, MiniLEDs), you will have to dig deeper into your pockets.

297
cd/m²
306
cd/m²
302
cd/m²
307
cd/m²
342
cd/m²
317
cd/m²
299
cd/m²
299
cd/m²
299
cd/m²
Distribution of brightness
Sharp SHP153F (LQ156M1JW30) tested with X-Rite i1Pro 3
Maximum: 342 cd/m² (Nits) Average: 307.6 cd/m² Minimum: 18.8 cd/m²
Brightness Distribution: 87 %
Center on Battery: 342 cd/m²
Contrast: 1179:1 (Black: 0.29 cd/m²)
ΔE ColorChecker Calman: 2.46 | ∀{0.5-29.43 Ø4.83}
calibrated: 0.82
ΔE Greyscale Calman: 3.03 | ∀{0.09-98 Ø5.1}
68.8% AdobeRGB 1998 (Argyll 3D)
98.9% sRGB (Argyll 3D)
67.9% Display P3 (Argyll 3D)
Gamma: 2.51
CCT: 7056 K
Gigabyte G5 KF5 2024
Sharp SHP153F (LQ156M1JW30), IPS, 1920x1080, 15.6", 360 Hz
Gigabyte G5 KF
Chi Mei N156HRA-EA1, IPS, 1920x1080, 15.6", 144 Hz
Lenovo LOQ 15IRX9
BOE NJ NE156FHM-NX9, IPS, 1920x1080, 15.6", 144 Hz
Asus TUF Gaming A15 FA507UV
AU Optronics B156HAN15.H, IPS, 1920x1080, 15.6", 144 Hz
Lenovo Legion Pro 5 16IRX9 G9
BOE NE160QDM-NZB, IPS, 2560x1600, 16", 240 Hz
Dell Inspiron 16 Plus 7640
AU Optronics B160QAN, IPS, 2560x1600, 16", 120 Hz
Display
-35%
5%
3%
25%
8%
Display P3 Coverage
67.9
43.2
-36%
73.7
9%
70.5
4%
99.22
46%
76
12%
sRGB Coverage
98.9
64.3
-35%
99.1
0%
98.5
0%
99.93
1%
99.8
1%
AdobeRGB 1998 Coverage
68.8
44.7
-35%
72.6
6%
72.7
6%
87.81
28%
76.7
11%
Response Times
-58%
-191%
-152%
29%
-99%
Response Time Grey 50% / Grey 80% *
13 ?(6.6, 6.4)
25.1 ?(11.7, 13.4)
-93%
42.2 ?(19.1, 23.1)
-225%
31.7 ?(14.7, 17)
-144%
4.8 ?(2.2, 2.6)
63%
25.6 ?(12.3, 13.3)
-97%
Response Time Black / White *
8.8 ?(4.6, 4.2)
10.8 ?(9.9, 7.9)
-23%
22.6 ?(11.2, 11.4)
-157%
22.9 ?(11.7, 11.2)
-160%
9.2 ?(4.6, 4.6)
-5%
17.6 ?(8.5, 9.1)
-100%
PWM Frequency
Screen
-134%
-3%
-13%
-4%
8%
Brightness middle
342
297
-13%
306
-11%
315
-8%
518
51%
314.7
-8%
Brightness
308
275
-11%
287
-7%
303
-2%
491
59%
291
-6%
Brightness Distribution
87
85
-2%
88
1%
90
3%
90
3%
89
2%
Black Level *
0.29
0.34
-17%
0.21
28%
0.25
14%
0.36
-24%
0.28
3%
Contrast
1179
874
-26%
1457
24%
1260
7%
1439
22%
1124
-5%
Colorchecker dE 2000 *
2.46
6.23
-153%
2.25
9%
2.26
8%
4.32
-76%
1.62
34%
Colorchecker dE 2000 max. *
4.12
20.93
-408%
4.84
-17%
7.37
-79%
6.37
-55%
2.94
29%
Colorchecker dE 2000 calibrated *
0.82
4.74
-478%
1.45
-77%
1.03
-26%
0.75
9%
1.08
-32%
Greyscale dE 2000 *
3.03
5.92
-95%
2.4
21%
4
-32%
3.66
-21%
1.3
57%
Gamma
2.51 88%
2.49 88%
2.259 97%
2.116 104%
2.19 100%
2.26 97%
CCT
7056 92%
6279 104%
6790 96%
7570 86%
6841 95%
6385 102%
Total Average (Program / Settings)
-76% / -102%
-63% / -28%
-54% / -29%
17% / 7%
-28% / -7%

* ... smaller is better

With the panel used, it is certainly not surprising that of the usual color spaces, only sRGB is almost completely covered.

sRGB
sRGB
Display P3
Display P3
AdobeRGB
AdobeRGB

The display's colors and grayscale are fine ex-works, but the DeltaE values can be significantly reduced using our manual calibration via the Xrite colorimeter and the Calman software so that the deviations in the grayscale drop from 3.03 to just 0.71 and from 2.46 to just 0.82 in the ColorChecker. The panel is therefore quite color accurate and is even suitable for light photo and video editing tasks, as long as the sRGB color space is sufficient.

Grayscale
Grayscale
Saturation
Saturation
ColorChecker
ColorChecker
Grayscale calibrated
Saturation calibrated
ColorChecker calibrated

Display Response Times

Display response times show how fast the screen is able to change from one color to the next. Slow response times can lead to afterimages and can cause moving objects to appear blurry (ghosting). Gamers of fast-paced 3D titles should pay special attention to fast response times.
       Response Time Black to White
8.8 ms ... rise ↗ and fall ↘ combined↗ 4.6 ms rise
↘ 4.2 ms fall
The screen shows fast response rates in our tests and should be suited for gaming.
In comparison, all tested devices range from 0.1 (minimum) to 240 (maximum) ms. » 22 % of all devices are better.
This means that the measured response time is better than the average of all tested devices (20.5 ms).
       Response Time 50% Grey to 80% Grey
13 ms ... rise ↗ and fall ↘ combined↗ 6.6 ms rise
↘ 6.4 ms fall
The screen shows good response rates in our tests, but may be too slow for competitive gamers.
In comparison, all tested devices range from 0.165 (minimum) to 636 (maximum) ms. » 24 % of all devices are better.
This means that the measured response time is better than the average of all tested devices (32.1 ms).

Screen Flickering / PWM (Pulse-Width Modulation)

To dim the screen, some notebooks will simply cycle the backlight on and off in rapid succession - a method called Pulse Width Modulation (PWM) . This cycling frequency should ideally be undetectable to the human eye. If said frequency is too low, users with sensitive eyes may experience strain or headaches or even notice the flickering altogether.
Screen flickering / PWM not detected

In comparison: 53 % of all tested devices do not use PWM to dim the display. If PWM was detected, an average of 8327 (minimum: 5 - maximum: 343500) Hz was measured.

Outdoors, the 300 nits are not ideal, but usable. Sunlight should be avoided at all costs.

Outside in the shade
Outdoors in direct sunlight
Stable IPS viewing angles

Performance - CPU top, GPU less

Our G5 KF5 is equipped with an Intel Core i7-13620H and a RTX 4060 plus 16 GB DDR5 RAM and a 1 TB SSD. The G5 is also available as the MF5 model, in which case a weaker RTX 4050 is installed, which seems to be the only difference. With this hardware combination, the G5 is positioned as a budget gamer and is also capable of handling some light Creator tasks.

Test conditions

The Gigabyte Control Center is pre-installed on the G5. The software is not particularly comprehensive (no MUX switch) and we have rarely seen such a pixelated, unattractive control center. At least we find four performance profiles (silent, power saving, entertainment, performance) in addition to the keyboard settings. We selected the performance mode for our benchmarks and used the power-saving mode for the battery tests. Since it is not at all clear how these modes interact with or influence the Windows power modes, we also set Windows to performance mode (or energy-saving mode for the battery tests).

The Gigabyte Control Center
The pixelated look is not really nice (zoomed in).
Keyboard macros and backlighting
Battery charging settings

Processor

The Intel Core i7-13620H is a high-end CPU for laptops with 6 P and 4 E cores, a total of 16 threads, and a clock frequency of 1.8 (base clock E cores) to 4.9 GHz (single-core turbo P core). An Intel Xe graphics unit with only 64 of the 96 EUs is integrated.

In our Cinebench R15 endurance test, there is only a slight drop in points over the first four runs, after which the performance remains constant. Overall, the processor in the G5 performs slightly better than the average laptop with the same CPU from our database and even beats the Core i5-13450HX in the LOQ 15. Compared to the predecessor, the CPU's performance increased by 21 percent.

In battery mode, the performance in Cinebench R15 drops by around 35 percent.

Cinebench R15/Mode Performance Entertainment Silent Energy saving battery
Score 2,396 2,296 840 768 1,555
TDP first 93, drops to 65 W over time first 85, later briefly 65, then 45 W first 28, later 20, then 15 W 15 W 36 W

Cinebench R15 Multi loop

0210420630840105012601470168018902100231025202730294031503360357037803990Tooltip
Gigabyte G5 KF5 2024 Intel Core i7-13620H: Ø2161 (2113.38-2395.78)
Gigabyte G5 KF Intel Core i5-12500H: Ø1808 (1783.56-2001.16)
Lenovo LOQ 15IRX9 Intel Core i5-13450HX: Ø2170 (2104.93-2503.76)
Asus TUF Gaming A15 FA507UV AMD Ryzen 9 8945H: Ø2688 (2638-2777.2)
Lenovo Legion Pro 5 16IRX9 G9 Intel Core i7-14700HX: Ø3774 (3668.72-4136.93)
Dell Inspiron 16 Plus 7640 Intel Core Ultra 7 155H: Ø2341 (1793.16-2787.26)
CPU Performance Rating: Percent
Cinebench R23: Multi Core | Single Core
Cinebench R20: CPU (Multi Core) | CPU (Single Core)
Cinebench R15: CPU Multi 64Bit | CPU Single 64Bit
Blender: v2.79 BMW27 CPU
7-Zip 18.03: 7z b 4 | 7z b 4 -mmt1
Geekbench 6.4: Multi-Core | Single-Core
Geekbench 5.5: Multi-Core | Single-Core
HWBOT x265 Benchmark v2.2: 4k Preset
LibreOffice : 20 Documents To PDF
R Benchmark 2.5: Overall mean
CPU Performance Rating
Lenovo Legion Pro 5 16IRX9 G9
Intel Core i7-14700HX
86.7 pt
Average of class Gaming
 
78.3 pt
Asus TUF Gaming A15 FA507UV
AMD Ryzen 9 8945H
68.1 pt
Dell Inspiron 16 Plus 7640
Intel Core Ultra 7 155H
63.8 pt
Gigabyte G5 KF5 2024
Intel Core i7-13620H
61.6 pt
Average Intel Core i7-13620H
 
59.8 pt
Lenovo LOQ 15IRX9
Intel Core i5-13450HX
58.4 pt
Gigabyte G5 KF
Intel Core i5-12500H
51 pt
Cinebench R23 / Multi Core
Lenovo Legion Pro 5 16IRX9 G9
Intel Core i7-14700HX
28122 Points +91%
Average of class Gaming
  (5668 - 40970, n=144, last 2 years)
24111 Points +64%
Dell Inspiron 16 Plus 7640
Intel Core Ultra 7 155H
17675 (14726min - 17675max) Points +20%
Asus TUF Gaming A15 FA507UV
AMD Ryzen 9 8945H
17423 Points +19%
Lenovo LOQ 15IRX9
Intel Core i5-13450HX
16797 Points +14%
Gigabyte G5 KF5 2024
Intel Core i7-13620H
14686 Points
Average Intel Core i7-13620H
  (10819 - 15496, n=6)
14472 Points -1%
Gigabyte G5 KF
Intel Core i5-12500H
13471 Points -8%
Cinebench R23 / Single Core
Lenovo Legion Pro 5 16IRX9 G9
Intel Core i7-14700HX
2128 Points +14%
Average of class Gaming
  (1136 - 2267, n=144, last 2 years)
1953 Points +5%
Gigabyte G5 KF5 2024
Intel Core i7-13620H
1862 Points
Average Intel Core i7-13620H
  (1805 - 1871, n=6)
1842 Points -1%
Asus TUF Gaming A15 FA507UV
AMD Ryzen 9 8945H
1814 Points -3%
Dell Inspiron 16 Plus 7640
Intel Core Ultra 7 155H
1733 Points -7%
Lenovo LOQ 15IRX9
Intel Core i5-13450HX
1710 Points -8%
Gigabyte G5 KF
Intel Core i5-12500H
1690 Points -9%
Cinebench R20 / CPU (Multi Core)
Lenovo Legion Pro 5 16IRX9 G9
Intel Core i7-14700HX
10498 Points +89%
Average of class Gaming
  (2179 - 16108, n=144, last 2 years)
9296 Points +67%
Asus TUF Gaming A15 FA507UV
AMD Ryzen 9 8945H
6859 Points +23%
Dell Inspiron 16 Plus 7640
Intel Core Ultra 7 155H
6807 Points +22%
Lenovo LOQ 15IRX9
Intel Core i5-13450HX
6532 Points +18%
Gigabyte G5 KF5 2024
Intel Core i7-13620H
5558 Points
Average Intel Core i7-13620H
  (4214 - 5905, n=6)
5505 Points -1%
Gigabyte G5 KF
Intel Core i5-12500H
5115 Points -8%
Cinebench R20 / CPU (Single Core)
Lenovo Legion Pro 5 16IRX9 G9
Intel Core i7-14700HX
818 Points +17%
Average of class Gaming
  (439 - 870, n=144, last 2 years)
752 Points +8%
Average Intel Core i7-13620H
  (693 - 719, n=6)
704 Points +1%
Gigabyte G5 KF5 2024
Intel Core i7-13620H
697 Points
Asus TUF Gaming A15 FA507UV
AMD Ryzen 9 8945H
670 Points -4%
Dell Inspiron 16 Plus 7640
Intel Core Ultra 7 155H
666 Points -4%
Lenovo LOQ 15IRX9
Intel Core i5-13450HX
652 Points -6%
Gigabyte G5 KF
Intel Core i5-12500H
651 Points -7%
Cinebench R15 / CPU Multi 64Bit
Lenovo Legion Pro 5 16IRX9 G9
Intel Core i7-14700HX
4137 (3668.72min - 4136.93max) Points +73%
Average of class Gaming
  (1537 - 6271, n=144, last 2 years)
3743 Points +56%
Dell Inspiron 16 Plus 7640
Intel Core Ultra 7 155H
2787 (1793.16min - 2787.26max) Points +16%
Asus TUF Gaming A15 FA507UV
AMD Ryzen 9 8945H
2777 Points +16%
Lenovo LOQ 15IRX9
Intel Core i5-13450HX
2503 Points +4%
Gigabyte G5 KF5 2024
Intel Core i7-13620H
2396 (2113.38min - 2395.78max) Points
Average Intel Core i7-13620H
  (1681 - 2492, n=6)
2246 Points -6%
Gigabyte G5 KF
Intel Core i5-12500H
2001 Points -16%
Cinebench R15 / CPU Single 64Bit
Lenovo Legion Pro 5 16IRX9 G9
Intel Core i7-14700HX
300 Points +12%
Average of class Gaming
  (191.9 - 343, n=143, last 2 years)
289 Points +7%
Asus TUF Gaming A15 FA507UV
AMD Ryzen 9 8945H
284 Points +6%
Gigabyte G5 KF5 2024
Intel Core i7-13620H
269 Points
Average Intel Core i7-13620H
  (258 - 269, n=6)
263 Points -2%
Dell Inspiron 16 Plus 7640
Intel Core Ultra 7 155H
255 Points -5%
Lenovo LOQ 15IRX9
Intel Core i5-13450HX
239 Points -11%
Gigabyte G5 KF
Intel Core i5-12500H
233 Points -13%
Blender / v2.79 BMW27 CPU
Gigabyte G5 KF
Intel Core i5-12500H
256 Seconds * -17%
Average Intel Core i7-13620H
  (215 - 289, n=6)
234 Seconds * -7%
Lenovo LOQ 15IRX9
Intel Core i5-13450HX
229 Seconds * -5%
Gigabyte G5 KF5 2024
Intel Core i7-13620H
218 Seconds *
Dell Inspiron 16 Plus 7640
Intel Core Ultra 7 155H
191 Seconds * +12%
Asus TUF Gaming A15 FA507UV
AMD Ryzen 9 8945H
182 Seconds * +17%
Average of class Gaming
  (80 - 517, n=141, last 2 years)
158.6 Seconds * +27%
Lenovo Legion Pro 5 16IRX9 G9
Intel Core i7-14700HX
126 Seconds * +42%
7-Zip 18.03 / 7z b 4
Lenovo Legion Pro 5 16IRX9 G9
Intel Core i7-14700HX
104730 MIPS +73%
Average of class Gaming
  (23795 - 148086, n=142, last 2 years)
89477 MIPS +48%
Asus TUF Gaming A15 FA507UV
AMD Ryzen 9 8945H
73222 MIPS +21%
Dell Inspiron 16 Plus 7640
Intel Core Ultra 7 155H
61730 MIPS +2%
Gigabyte G5 KF5 2024
Intel Core i7-13620H
60545 MIPS
Lenovo LOQ 15IRX9
Intel Core i5-13450HX
59026 MIPS -3%
Average Intel Core i7-13620H
  (45983 - 62324, n=6)
56867 MIPS -6%
Gigabyte G5 KF
Intel Core i5-12500H
49343 MIPS -19%
7-Zip 18.03 / 7z b 4 -mmt1
Lenovo Legion Pro 5 16IRX9 G9
Intel Core i7-14700HX
6979 MIPS +14%
Asus TUF Gaming A15 FA507UV
AMD Ryzen 9 8945H
6615 MIPS +9%
Average of class Gaming
  (4199 - 7573, n=142, last 2 years)
6380 MIPS +5%
Gigabyte G5 KF5 2024
Intel Core i7-13620H
6096 MIPS
Average Intel Core i7-13620H
  (5742 - 6326, n=6)
5966 MIPS -2%
Dell Inspiron 16 Plus 7640
Intel Core Ultra 7 155H
5461 MIPS -10%
Lenovo LOQ 15IRX9
Intel Core i5-13450HX
5370 MIPS -12%
Gigabyte G5 KF
Intel Core i5-12500H
5258 MIPS -14%
Geekbench 6.4 / Multi-Core
Lenovo Legion Pro 5 16IRX9 G9
Intel Core i7-14700HX
17562 Points +37%
Average of class Gaming
  (5340 - 22104, n=139, last 2 years)
15274 Points +20%
Dell Inspiron 16 Plus 7640
Intel Core Ultra 7 155H
13018 Points +2%
Gigabyte G5 KF5 2024
Intel Core i7-13620H
12779 Points
Lenovo LOQ 15IRX9
Intel Core i5-13450HX
12684 Points -1%
Asus TUF Gaming A15 FA507UV
AMD Ryzen 9 8945H
12662 Points -1%
Average Intel Core i7-13620H
  (9131 - 13077, n=5)
11687 Points -9%
Gigabyte G5 KF
Intel Core i5-12500H
8714 Points -32%
Geekbench 6.4 / Single-Core
Lenovo Legion Pro 5 16IRX9 G9
Intel Core i7-14700HX
2884 Points +13%
Average of class Gaming
  (1490 - 3219, n=139, last 2 years)
2753 Points +8%
Asus TUF Gaming A15 FA507UV
AMD Ryzen 9 8945H
2711 Points +7%
Average Intel Core i7-13620H
  (2498 - 2605, n=5)
2568 Points +1%
Gigabyte G5 KF5 2024
Intel Core i7-13620H
2544 Points
Dell Inspiron 16 Plus 7640
Intel Core Ultra 7 155H
2401 Points -6%
Lenovo LOQ 15IRX9
Intel Core i5-13450HX
2381 Points -6%
Gigabyte G5 KF
Intel Core i5-12500H
2239 Points -12%
Geekbench 5.5 / Multi-Core
Lenovo Legion Pro 5 16IRX9 G9
Intel Core i7-14700HX
19597 Points +68%
Average of class Gaming
  (4557 - 27010, n=141, last 2 years)
16246 Points +39%
Dell Inspiron 16 Plus 7640
Intel Core Ultra 7 155H
12600 Points +8%
Lenovo LOQ 15IRX9
Intel Core i5-13450HX
12005 Points +3%
Asus TUF Gaming A15 FA507UV
AMD Ryzen 9 8945H
11949 Points +2%
Gigabyte G5 KF5 2024
Intel Core i7-13620H
11699 Points
Average Intel Core i7-13620H
  (8357 - 12223, n=6)
10876 Points -7%
Gigabyte G5 KF
Intel Core i5-12500H
8194 Points -30%
Geekbench 5.5 / Single-Core
Lenovo Legion Pro 5 16IRX9 G9
Intel Core i7-14700HX
2133 Points +19%
Asus TUF Gaming A15 FA507UV
AMD Ryzen 9 8945H
1991 Points +11%
Average of class Gaming
  (986 - 2423, n=141, last 2 years)
1980 Points +10%
Average Intel Core i7-13620H
  (1785 - 1865, n=6)
1817 Points +1%
Gigabyte G5 KF5 2024
Intel Core i7-13620H
1799 Points
Dell Inspiron 16 Plus 7640
Intel Core Ultra 7 155H
1793 Points 0%
Lenovo LOQ 15IRX9
Intel Core i5-13450HX
1696 Points -6%
Gigabyte G5 KF
Intel Core i5-12500H
1618 Points -10%
HWBOT x265 Benchmark v2.2 / 4k Preset
Lenovo Legion Pro 5 16IRX9 G9
Intel Core i7-14700HX
27.4 fps +55%
Average of class Gaming
  (7.7 - 44.3, n=142, last 2 years)
26.1 fps +47%
Asus TUF Gaming A15 FA507UV
AMD Ryzen 9 8945H
21.9 fps +24%
Dell Inspiron 16 Plus 7640
Intel Core Ultra 7 155H
19.5 fps +10%
Gigabyte G5 KF5 2024
Intel Core i7-13620H
17.7 fps
Lenovo LOQ 15IRX9
Intel Core i5-13450HX
17.5 fps -1%
Average Intel Core i7-13620H
  (12.9 - 17.7, n=6)
16.3 fps -8%
Gigabyte G5 KF
Intel Core i5-12500H
14.2 fps -20%
LibreOffice / 20 Documents To PDF
Lenovo LOQ 15IRX9
Intel Core i5-13450HX
59.3 s * -15%
Lenovo Legion Pro 5 16IRX9 G9
Intel Core i7-14700HX
52.3 s * -2%
Gigabyte G5 KF5 2024
Intel Core i7-13620H
51.4 s *
Gigabyte G5 KF
Intel Core i5-12500H
50.1 s * +3%
Average Intel Core i7-13620H
  (41.5 - 56.8, n=6)
49.1 s * +4%
Asus TUF Gaming A15 FA507UV
AMD Ryzen 9 8945H
47.5 s * +8%
Average of class Gaming
  (19 - 96.6, n=140, last 2 years)
47.5 s * +8%
Dell Inspiron 16 Plus 7640
Intel Core Ultra 7 155H
43.5 s * +15%
R Benchmark 2.5 / Overall mean
Gigabyte G5 KF
Intel Core i5-12500H
0.535 sec * -20%
Lenovo LOQ 15IRX9
Intel Core i5-13450HX
0.4838 sec * -8%
Dell Inspiron 16 Plus 7640
Intel Core Ultra 7 155H
0.4709 sec * -6%
Average Intel Core i7-13620H
  (0.4438 - 0.4545, n=6)
0.4484 sec * -1%
Gigabyte G5 KF5 2024
Intel Core i7-13620H
0.446 sec *
Average of class Gaming
  (0.3551 - 0.759, n=143, last 2 years)
0.4299 sec * +4%
Asus TUF Gaming A15 FA507UV
AMD Ryzen 9 8945H
0.4298 sec * +4%
Lenovo Legion Pro 5 16IRX9 G9
Intel Core i7-14700HX
0.4003 sec * +10%

* ... smaller is better

Cinebench R15 CPU Multi 64Bit
2396 Points
Cinebench R15 OpenGL 64Bit
209 fps
Cinebench R15 Ref. Match 64Bit
99.6 %
Cinebench R15 CPU Single 64Bit
269 Points
Cinebench R20 CPU (Multi Core)
5558 Points
Cinebench R20 CPU (Single Core)
697 Points
Cinebench R23 Single Core
1862 Points
Cinebench R23 Multi Core
14686 Points
Help
Performance Rating
Lenovo Legion Pro 5 16IRX9 G9
Intel Core i7-14700HX, NVIDIA GeForce RTX 4060 Laptop GPU
94 pt
Average of class Gaming
 
91.8 pt
Asus TUF Gaming A15 FA507UV
AMD Ryzen 9 8945H, NVIDIA GeForce RTX 4060 Laptop GPU
89 pt
Dell Inspiron 16 Plus 7640
Intel Core Ultra 7 155H, NVIDIA GeForce RTX 4060 Laptop GPU
58.8 pt
Lenovo LOQ 15IRX9
Intel Core i5-13450HX, NVIDIA GeForce RTX 4060 Laptop GPU
58.2 pt
Gigabyte G5 KF
Intel Core i5-12500H, NVIDIA GeForce RTX 4060 Laptop GPU
52.7 pt
Gigabyte G5 KF5 2024
Intel Core i7-13620H, NVIDIA GeForce RTX 4060 Laptop GPU
49.7 pt
Average Intel Core i7-13620H
 
49.1 pt
AIDA64 / FP32 Ray-Trace
Asus TUF Gaming A15 FA507UV
AMD Ryzen 9 8945H, NVIDIA GeForce RTX 4060 Laptop GPU
28698 KRay/s +125%
Average of class Gaming
  (7192 - 85542, n=141, last 2 years)
26600 KRay/s +108%
Lenovo Legion Pro 5 16IRX9 G9
Intel Core i7-14700HX, NVIDIA GeForce RTX 4060 Laptop GPU
23676 KRay/s +86%
Dell Inspiron 16 Plus 7640
Intel Core Ultra 7 155H, NVIDIA GeForce RTX 4060 Laptop GPU
14038 KRay/s +10%
Lenovo LOQ 15IRX9
Intel Core i5-13450HX, NVIDIA GeForce RTX 4060 Laptop GPU
13747 KRay/s +8%
Gigabyte G5 KF5 2024
Intel Core i7-13620H, NVIDIA GeForce RTX 4060 Laptop GPU
12760 KRay/s
Average Intel Core i7-13620H
  (10779 - 13601, n=6)
12313 KRay/s -4%
Gigabyte G5 KF
Intel Core i5-12500H, NVIDIA GeForce RTX 4060 Laptop GPU
11802 KRay/s -8%
AIDA64 / FPU Julia
Average of class Gaming
  (35040 - 252486, n=141, last 2 years)
122472 Points +88%
Asus TUF Gaming A15 FA507UV
AMD Ryzen 9 8945H, NVIDIA GeForce RTX 4060 Laptop GPU
122466 Points +88%
Lenovo Legion Pro 5 16IRX9 G9
Intel Core i7-14700HX, NVIDIA GeForce RTX 4060 Laptop GPU
116556 Points +79%
Lenovo LOQ 15IRX9
Intel Core i5-13450HX, NVIDIA GeForce RTX 4060 Laptop GPU
71834 Points +10%
Dell Inspiron 16 Plus 7640
Intel Core Ultra 7 155H, NVIDIA GeForce RTX 4060 Laptop GPU
70839 Points +9%
Gigabyte G5 KF5 2024
Intel Core i7-13620H, NVIDIA GeForce RTX 4060 Laptop GPU
65073 Points
Average Intel Core i7-13620H
  (54287 - 67187, n=6)
63413 Points -3%
Gigabyte G5 KF
Intel Core i5-12500H, NVIDIA GeForce RTX 4060 Laptop GPU
59683 Points -8%
AIDA64 / CPU SHA3
Average of class Gaming
  (1728 - 10389, n=141, last 2 years)
5604 MB/s +111%
Lenovo Legion Pro 5 16IRX9 G9
Intel Core i7-14700HX, NVIDIA GeForce RTX 4060 Laptop GPU
5567 MB/s +110%
Asus TUF Gaming A15 FA507UV
AMD Ryzen 9 8945H, NVIDIA GeForce RTX 4060 Laptop GPU
5113 MB/s +92%
Lenovo LOQ 15IRX9
Intel Core i5-13450HX, NVIDIA GeForce RTX 4060 Laptop GPU
3530 MB/s +33%
Dell Inspiron 16 Plus 7640
Intel Core Ultra 7 155H, NVIDIA GeForce RTX 4060 Laptop GPU
3277 MB/s +23%
Gigabyte G5 KF
Intel Core i5-12500H, NVIDIA GeForce RTX 4060 Laptop GPU
2983 MB/s +12%
Gigabyte G5 KF5 2024
Intel Core i7-13620H, NVIDIA GeForce RTX 4060 Laptop GPU
2657 MB/s
Average Intel Core i7-13620H
  (2357 - 2773, n=6)
2620 MB/s -1%
AIDA64 / CPU Queen
Lenovo Legion Pro 5 16IRX9 G9
Intel Core i7-14700HX, NVIDIA GeForce RTX 4060 Laptop GPU
152200 Points +94%
Asus TUF Gaming A15 FA507UV
AMD Ryzen 9 8945H, NVIDIA GeForce RTX 4060 Laptop GPU
125950 Points +60%
Average of class Gaming
  (50699 - 200651, n=141, last 2 years)
118565 Points +51%
Dell Inspiron 16 Plus 7640
Intel Core Ultra 7 155H, NVIDIA GeForce RTX 4060 Laptop GPU
87819 Points +12%
Lenovo LOQ 15IRX9
Intel Core i5-13450HX, NVIDIA GeForce RTX 4060 Laptop GPU
86148 Points +10%
Gigabyte G5 KF
Intel Core i5-12500H, NVIDIA GeForce RTX 4060 Laptop GPU
79989 Points +2%
Gigabyte G5 KF5 2024
Intel Core i7-13620H, NVIDIA GeForce RTX 4060 Laptop GPU
78523 Points
Average Intel Core i7-13620H
  (66885 - 78867, n=6)
76293 Points -3%
AIDA64 / FPU SinJulia
Asus TUF Gaming A15 FA507UV
AMD Ryzen 9 8945H, NVIDIA GeForce RTX 4060 Laptop GPU
15856 Points +95%
Lenovo Legion Pro 5 16IRX9 G9
Intel Core i7-14700HX, NVIDIA GeForce RTX 4060 Laptop GPU
14434 Points +78%
Average of class Gaming
  (5020 - 33636, n=141, last 2 years)
14112 Points +74%
Dell Inspiron 16 Plus 7640
Intel Core Ultra 7 155H, NVIDIA GeForce RTX 4060 Laptop GPU
9893 Points +22%
Lenovo LOQ 15IRX9
Intel Core i5-13450HX, NVIDIA GeForce RTX 4060 Laptop GPU
9344 Points +15%
Gigabyte G5 KF5 2024
Intel Core i7-13620H, NVIDIA GeForce RTX 4060 Laptop GPU
8124 Points
Average Intel Core i7-13620H
  (6737 - 8421, n=6)
7844 Points -3%
Gigabyte G5 KF
Intel Core i5-12500H, NVIDIA GeForce RTX 4060 Laptop GPU
7322 Points -10%
AIDA64 / FPU Mandel
Asus TUF Gaming A15 FA507UV
AMD Ryzen 9 8945H, NVIDIA GeForce RTX 4060 Laptop GPU
65523 Points +108%
Average of class Gaming
  (17585 - 134044, n=141, last 2 years)
62836 Points +99%
Lenovo Legion Pro 5 16IRX9 G9
Intel Core i7-14700HX, NVIDIA GeForce RTX 4060 Laptop GPU
58380 Points +85%
Dell Inspiron 16 Plus 7640
Intel Core Ultra 7 155H, NVIDIA GeForce RTX 4060 Laptop GPU
35006 Points +11%
Lenovo LOQ 15IRX9
Intel Core i5-13450HX, NVIDIA GeForce RTX 4060 Laptop GPU
34956 Points +11%
Gigabyte G5 KF5 2024
Intel Core i7-13620H, NVIDIA GeForce RTX 4060 Laptop GPU
31508 Points
Average Intel Core i7-13620H
  (27242 - 32787, n=6)
31013 Points -2%
Gigabyte G5 KF
Intel Core i5-12500H, NVIDIA GeForce RTX 4060 Laptop GPU
29112 Points -8%
AIDA64 / CPU AES
Lenovo Legion Pro 5 16IRX9 G9
Intel Core i7-14700HX, NVIDIA GeForce RTX 4060 Laptop GPU
113157 MB/s +109%
Average of class Gaming
  (19065 - 328679, n=141, last 2 years)
109774 MB/s +103%
Gigabyte G5 KF
Intel Core i5-12500H, NVIDIA GeForce RTX 4060 Laptop GPU
105881 MB/s +96%
Asus TUF Gaming A15 FA507UV
AMD Ryzen 9 8945H, NVIDIA GeForce RTX 4060 Laptop GPU
90481 MB/s +67%
Lenovo LOQ 15IRX9
Intel Core i5-13450HX, NVIDIA GeForce RTX 4060 Laptop GPU
70330 MB/s +30%
Dell Inspiron 16 Plus 7640
Intel Core Ultra 7 155H, NVIDIA GeForce RTX 4060 Laptop GPU
68050 MB/s +26%
Average Intel Core i7-13620H
  (52697 - 85895, n=6)
60581 MB/s +12%
Gigabyte G5 KF5 2024
Intel Core i7-13620H, NVIDIA GeForce RTX 4060 Laptop GPU
54096 MB/s
AIDA64 / CPU ZLib
Lenovo Legion Pro 5 16IRX9 G9
Intel Core i7-14700HX, NVIDIA GeForce RTX 4060 Laptop GPU
1682 MB/s +115%
Average of class Gaming
  (373 - 2531, n=141, last 2 years)
1484 MB/s +90%
Asus TUF Gaming A15 FA507UV
AMD Ryzen 9 8945H, NVIDIA GeForce RTX 4060 Laptop GPU
1150 MB/s +47%
Dell Inspiron 16 Plus 7640
Intel Core Ultra 7 155H, NVIDIA GeForce RTX 4060 Laptop GPU
1045 MB/s +34%
Lenovo LOQ 15IRX9
Intel Core i5-13450HX, NVIDIA GeForce RTX 4060 Laptop GPU
1002 MB/s +28%
Gigabyte G5 KF
Intel Core i5-12500H, NVIDIA GeForce RTX 4060 Laptop GPU
864 MB/s +10%
Average Intel Core i7-13620H
  (697 - 835, n=6)
783 MB/s 0%
Gigabyte G5 KF5 2024
Intel Core i7-13620H, NVIDIA GeForce RTX 4060 Laptop GPU
782 MB/s
AIDA64 / FP64 Ray-Trace
Asus TUF Gaming A15 FA507UV
AMD Ryzen 9 8945H, NVIDIA GeForce RTX 4060 Laptop GPU
15513 KRay/s +128%
Average of class Gaming
  (3856 - 45446, n=141, last 2 years)
14281 KRay/s +110%
Lenovo Legion Pro 5 16IRX9 G9
Intel Core i7-14700HX, NVIDIA GeForce RTX 4060 Laptop GPU
12928 KRay/s +90%
Lenovo LOQ 15IRX9
Intel Core i5-13450HX, NVIDIA GeForce RTX 4060 Laptop GPU
7428 KRay/s +9%
Dell Inspiron 16 Plus 7640
Intel Core Ultra 7 155H, NVIDIA GeForce RTX 4060 Laptop GPU
7347 KRay/s +8%
Gigabyte G5 KF5 2024
Intel Core i7-13620H, NVIDIA GeForce RTX 4060 Laptop GPU
6800 KRay/s
Average Intel Core i7-13620H
  (6077 - 7364, n=6)
6745 KRay/s -1%
Gigabyte G5 KF
Intel Core i5-12500H, NVIDIA GeForce RTX 4060 Laptop GPU
6169 KRay/s -9%
AIDA64 / CPU PhotoWorxx
Lenovo Legion Pro 5 16IRX9 G9
Intel Core i7-14700HX, NVIDIA GeForce RTX 4060 Laptop GPU
49671 MPixel/s +59%
Average of class Gaming
  (10805 - 62916, n=141, last 2 years)
42271 MPixel/s +36%
Dell Inspiron 16 Plus 7640
Intel Core Ultra 7 155H, NVIDIA GeForce RTX 4060 Laptop GPU
39530 MPixel/s +27%
Lenovo LOQ 15IRX9
Intel Core i5-13450HX, NVIDIA GeForce RTX 4060 Laptop GPU
36764 MPixel/s +18%
Asus TUF Gaming A15 FA507UV
AMD Ryzen 9 8945H, NVIDIA GeForce RTX 4060 Laptop GPU
33410 MPixel/s +7%
Gigabyte G5 KF5 2024
Intel Core i7-13620H, NVIDIA GeForce RTX 4060 Laptop GPU
31165 MPixel/s
Average Intel Core i7-13620H
  (19421 - 34544, n=6)
29244 MPixel/s -6%
Gigabyte G5 KF
Intel Core i5-12500H, NVIDIA GeForce RTX 4060 Laptop GPU
27635 MPixel/s -11%

System performance

The G5's results in PCMark 10 are unremarkable and it sits in the midfield. In CrossMark, our Gigabyte performs pretty much at the expected level. We rarely noticed any problems in Windows mode, only when scrolling through the browser can there be a few hiccups.

PCMark 10
PCMark 10
PCMark 10 / Score
Lenovo Legion Pro 5 16IRX9 G9
NVIDIA GeForce RTX 4060 Laptop GPU, i7-14700HX, Samsung PM9A1 MZVL21T0HCLR
8278 Points +14%
Average of class Gaming
  (5776 - 9852, n=128, last 2 years)
8047 Points +11%
Asus TUF Gaming A15 FA507UV
NVIDIA GeForce RTX 4060 Laptop GPU, R9 8945H, WD PC SN560 SDDPNQE-1T00
7943 Points +9%
Gigabyte G5 KF5 2024
NVIDIA GeForce RTX 4060 Laptop GPU, i7-13620H, Gigabyte AG450E1024-SI
7256 Points
Dell Inspiron 16 Plus 7640
NVIDIA GeForce RTX 4060 Laptop GPU, Ultra 7 155H, SK hynix BC901 HFS001TEJ4X164N
7042 Points -3%
Average Intel Core i7-13620H, NVIDIA GeForce RTX 4060 Laptop GPU
  (6678 - 7256, n=3)
7031 Points -3%
Lenovo LOQ 15IRX9
NVIDIA GeForce RTX 4060 Laptop GPU, i5-13450HX, Micron 2400 MTFDKCD1T0QFM
6929 Points -5%
Gigabyte G5 KF
NVIDIA GeForce RTX 4060 Laptop GPU, i5-12500H, SSSTC CA6-8D512
6318 Points -13%
PCMark 10 / Essentials
Lenovo Legion Pro 5 16IRX9 G9
NVIDIA GeForce RTX 4060 Laptop GPU, i7-14700HX, Samsung PM9A1 MZVL21T0HCLR
11087 Points +7%
Asus TUF Gaming A15 FA507UV
NVIDIA GeForce RTX 4060 Laptop GPU, R9 8945H, WD PC SN560 SDDPNQE-1T00
10873 Points +5%
Average of class Gaming
  (9057 - 12600, n=128, last 2 years)
10785 Points +4%
Gigabyte G5 KF5 2024
NVIDIA GeForce RTX 4060 Laptop GPU, i7-13620H, Gigabyte AG450E1024-SI
10386 Points
Average Intel Core i7-13620H, NVIDIA GeForce RTX 4060 Laptop GPU
  (9909 - 10809, n=3)
10368 Points 0%
Gigabyte G5 KF
NVIDIA GeForce RTX 4060 Laptop GPU, i5-12500H, SSSTC CA6-8D512
10328 Points -1%
Dell Inspiron 16 Plus 7640
NVIDIA GeForce RTX 4060 Laptop GPU, Ultra 7 155H, SK hynix BC901 HFS001TEJ4X164N
10279 Points -1%
Lenovo LOQ 15IRX9
NVIDIA GeForce RTX 4060 Laptop GPU, i5-13450HX, Micron 2400 MTFDKCD1T0QFM
9379 Points -10%
PCMark 10 / Productivity
Asus TUF Gaming A15 FA507UV
NVIDIA GeForce RTX 4060 Laptop GPU, R9 8945H, WD PC SN560 SDDPNQE-1T00
10269 Points +5%
Average of class Gaming
  (6662 - 14612, n=128, last 2 years)
9867 Points +1%
Lenovo Legion Pro 5 16IRX9 G9
NVIDIA GeForce RTX 4060 Laptop GPU, i7-14700HX, Samsung PM9A1 MZVL21T0HCLR
9823 Points 0%
Gigabyte G5 KF5 2024
NVIDIA GeForce RTX 4060 Laptop GPU, i7-13620H, Gigabyte AG450E1024-SI
9781 Points
Gigabyte G5 KF
NVIDIA GeForce RTX 4060 Laptop GPU, i5-12500H, SSSTC CA6-8D512
9736 Points 0%
Average Intel Core i7-13620H, NVIDIA GeForce RTX 4060 Laptop GPU
  (8642 - 9781, n=3)
9244 Points -5%
Lenovo LOQ 15IRX9
NVIDIA GeForce RTX 4060 Laptop GPU, i5-13450HX, Micron 2400 MTFDKCD1T0QFM
8800 Points -10%
Dell Inspiron 16 Plus 7640
NVIDIA GeForce RTX 4060 Laptop GPU, Ultra 7 155H, SK hynix BC901 HFS001TEJ4X164N
8079 Points -17%
PCMark 10 / Digital Content Creation
Lenovo Legion Pro 5 16IRX9 G9
NVIDIA GeForce RTX 4060 Laptop GPU, i7-14700HX, Samsung PM9A1 MZVL21T0HCLR
14135 Points +39%
Average of class Gaming
  (7440 - 19351, n=128, last 2 years)
13464 Points +32%
Asus TUF Gaming A15 FA507UV
NVIDIA GeForce RTX 4060 Laptop GPU, R9 8945H, WD PC SN560 SDDPNQE-1T00
12182 Points +19%
Dell Inspiron 16 Plus 7640
NVIDIA GeForce RTX 4060 Laptop GPU, Ultra 7 155H, SK hynix BC901 HFS001TEJ4X164N
11413 Points +12%
Lenovo LOQ 15IRX9
NVIDIA GeForce RTX 4060 Laptop GPU, i5-13450HX, Micron 2400 MTFDKCD1T0QFM
10937 Points +7%
Gigabyte G5 KF5 2024
NVIDIA GeForce RTX 4060 Laptop GPU, i7-13620H, Gigabyte AG450E1024-SI
10204 Points
Average Intel Core i7-13620H, NVIDIA GeForce RTX 4060 Laptop GPU
  (9437 - 10204, n=3)
9848 Points -3%
Gigabyte G5 KF
NVIDIA GeForce RTX 4060 Laptop GPU, i5-12500H, SSSTC CA6-8D512
6807 Points -33%
CrossMark / Overall
Lenovo Legion Pro 5 16IRX9 G9
NVIDIA GeForce RTX 4060 Laptop GPU, i7-14700HX, Samsung PM9A1 MZVL21T0HCLR
2132 Points +7%
Gigabyte G5 KF5 2024
NVIDIA GeForce RTX 4060 Laptop GPU, i7-13620H, Gigabyte AG450E1024-SI
1986 Points
Average of class Gaming
  (1247 - 2344, n=110, last 2 years)
1967 Points -1%
Average Intel Core i7-13620H, NVIDIA GeForce RTX 4060 Laptop GPU
  (1857 - 1986, n=3)
1929 Points -3%
Lenovo LOQ 15IRX9
NVIDIA GeForce RTX 4060 Laptop GPU, i5-13450HX, Micron 2400 MTFDKCD1T0QFM
1804 Points -9%
Asus TUF Gaming A15 FA507UV
NVIDIA GeForce RTX 4060 Laptop GPU, R9 8945H, WD PC SN560 SDDPNQE-1T00
1800 Points -9%
Gigabyte G5 KF
NVIDIA GeForce RTX 4060 Laptop GPU, i5-12500H, SSSTC CA6-8D512
1744 Points -12%
Dell Inspiron 16 Plus 7640
NVIDIA GeForce RTX 4060 Laptop GPU, Ultra 7 155H, SK hynix BC901 HFS001TEJ4X164N
1685 Points -15%
CrossMark / Productivity
Lenovo Legion Pro 5 16IRX9 G9
NVIDIA GeForce RTX 4060 Laptop GPU, i7-14700HX, Samsung PM9A1 MZVL21T0HCLR
1973 Points +3%
Gigabyte G5 KF5 2024
NVIDIA GeForce RTX 4060 Laptop GPU, i7-13620H, Gigabyte AG450E1024-SI
1908 Points
Average of class Gaming
  (1299 - 2211, n=110, last 2 years)
1852 Points -3%
Average Intel Core i7-13620H, NVIDIA GeForce RTX 4060 Laptop GPU
  (1765 - 1908, n=3)
1847 Points -3%
Asus TUF Gaming A15 FA507UV
NVIDIA GeForce RTX 4060 Laptop GPU, R9 8945H, WD PC SN560 SDDPNQE-1T00
1761 Points -8%
Lenovo LOQ 15IRX9
NVIDIA GeForce RTX 4060 Laptop GPU, i5-13450HX, Micron 2400 MTFDKCD1T0QFM
1728 Points -9%
Gigabyte G5 KF
NVIDIA GeForce RTX 4060 Laptop GPU, i5-12500H, SSSTC CA6-8D512
1708 Points -10%
Dell Inspiron 16 Plus 7640
NVIDIA GeForce RTX 4060 Laptop GPU, Ultra 7 155H, SK hynix BC901 HFS001TEJ4X164N
1592 Points -17%
CrossMark / Creativity
Lenovo Legion Pro 5 16IRX9 G9
NVIDIA GeForce RTX 4060 Laptop GPU, i7-14700HX, Samsung PM9A1 MZVL21T0HCLR
2399 Points +16%
Average of class Gaming
  (1275 - 2729, n=110, last 2 years)
2187 Points +6%
Gigabyte G5 KF5 2024
NVIDIA GeForce RTX 4060 Laptop GPU, i7-13620H, Gigabyte AG450E1024-SI
2067 Points
Average Intel Core i7-13620H, NVIDIA GeForce RTX 4060 Laptop GPU
  (2013 - 2067, n=3)
2042 Points -1%
Dell Inspiron 16 Plus 7640
NVIDIA GeForce RTX 4060 Laptop GPU, Ultra 7 155H, SK hynix BC901 HFS001TEJ4X164N
1929 Points -7%
Asus TUF Gaming A15 FA507UV
NVIDIA GeForce RTX 4060 Laptop GPU, R9 8945H, WD PC SN560 SDDPNQE-1T00
1918 Points -7%
Lenovo LOQ 15IRX9
NVIDIA GeForce RTX 4060 Laptop GPU, i5-13450HX, Micron 2400 MTFDKCD1T0QFM
1904 Points -8%
Gigabyte G5 KF
NVIDIA GeForce RTX 4060 Laptop GPU, i5-12500H, SSSTC CA6-8D512
1760 Points -15%
CrossMark / Responsiveness
Gigabyte G5 KF5 2024
NVIDIA GeForce RTX 4060 Laptop GPU, i7-13620H, Gigabyte AG450E1024-SI
1989 Points
Lenovo Legion Pro 5 16IRX9 G9
NVIDIA GeForce RTX 4060 Laptop GPU, i7-14700HX, Samsung PM9A1 MZVL21T0HCLR
1885 Points -5%
Average Intel Core i7-13620H, NVIDIA GeForce RTX 4060 Laptop GPU
  (1734 - 1989, n=3)
1866 Points -6%
Gigabyte G5 KF
NVIDIA GeForce RTX 4060 Laptop GPU, i5-12500H, SSSTC CA6-8D512
1804 Points -9%
Lenovo LOQ 15IRX9
NVIDIA GeForce RTX 4060 Laptop GPU, i5-13450HX, Micron 2400 MTFDKCD1T0QFM
1748 Points -12%
Average of class Gaming
  (1030 - 2330, n=110, last 2 years)
1727 Points -13%
Asus TUF Gaming A15 FA507UV
NVIDIA GeForce RTX 4060 Laptop GPU, R9 8945H, WD PC SN560 SDDPNQE-1T00
1593 Points -20%
Dell Inspiron 16 Plus 7640
NVIDIA GeForce RTX 4060 Laptop GPU, Ultra 7 155H, SK hynix BC901 HFS001TEJ4X164N
1333 Points -33%
WebXPRT 3 / Overall
Average of class Gaming
  (237 - 532, n=122, last 2 years)
314 Points
Average Intel Core i7-13620H, NVIDIA GeForce RTX 4060 Laptop GPU
  (292 - 319, n=3)
310 Points
Asus TUF Gaming A15 FA507UV
NVIDIA GeForce RTX 4060 Laptop GPU, R9 8945H, WD PC SN560 SDDPNQE-1T00
308 Points
Lenovo Legion Pro 5 16IRX9 G9
NVIDIA GeForce RTX 4060 Laptop GPU, i7-14700HX, Samsung PM9A1 MZVL21T0HCLR
301 Points
Dell Inspiron 16 Plus 7640
NVIDIA GeForce RTX 4060 Laptop GPU, Ultra 7 155H, SK hynix BC901 HFS001TEJ4X164N
290 Points
Lenovo LOQ 15IRX9
NVIDIA GeForce RTX 4060 Laptop GPU, i5-13450HX, Micron 2400 MTFDKCD1T0QFM
262 Points
Gigabyte G5 KF
NVIDIA GeForce RTX 4060 Laptop GPU, i5-12500H, SSSTC CA6-8D512
246 Points
WebXPRT 4 / Overall
Average of class Gaming
  (176.4 - 341, n=109, last 2 years)
280 Points
Lenovo Legion Pro 5 16IRX9 G9
NVIDIA GeForce RTX 4060 Laptop GPU, i7-14700HX, Samsung PM9A1 MZVL21T0HCLR
273 Points
Average Intel Core i7-13620H, NVIDIA GeForce RTX 4060 Laptop GPU
  (n=1)
270 Points
Asus TUF Gaming A15 FA507UV
NVIDIA GeForce RTX 4060 Laptop GPU, R9 8945H, WD PC SN560 SDDPNQE-1T00
263 Points
Dell Inspiron 16 Plus 7640
NVIDIA GeForce RTX 4060 Laptop GPU, Ultra 7 155H, SK hynix BC901 HFS001TEJ4X164N
257 Points
Lenovo LOQ 15IRX9
NVIDIA GeForce RTX 4060 Laptop GPU, i5-13450HX, Micron 2400 MTFDKCD1T0QFM
243 Points
Mozilla Kraken 1.1 / Total
Gigabyte G5 KF
NVIDIA GeForce RTX 4060 Laptop GPU, i5-12500H, SSSTC CA6-8D512
562 ms * -10%
Gigabyte G5 KF
NVIDIA GeForce RTX 4060 Laptop GPU, i5-12500H, SSSTC CA6-8D512
562 ms * -10%
Lenovo LOQ 15IRX9
NVIDIA GeForce RTX 4060 Laptop GPU, i5-13450HX, Micron 2400 MTFDKCD1T0QFM
550 ms * -7%
Dell Inspiron 16 Plus 7640
NVIDIA GeForce RTX 4060 Laptop GPU, Ultra 7 155H, SK hynix BC901 HFS001TEJ4X164N
519 ms * -1%
Gigabyte G5 KF5 2024
NVIDIA GeForce RTX 4060 Laptop GPU, i7-13620H, Gigabyte AG450E1024-SI
513 ms *
Average Intel Core i7-13620H, NVIDIA GeForce RTX 4060 Laptop GPU
  (508 - 516, n=4)
511 ms * -0%
Asus TUF Gaming A15 FA507UV
NVIDIA GeForce RTX 4060 Laptop GPU, R9 8945H, WD PC SN560 SDDPNQE-1T00
505 ms * +2%
Average of class Gaming
  (397 - 674, n=132, last 2 years)
481 ms * +6%
Lenovo Legion Pro 5 16IRX9 G9
NVIDIA GeForce RTX 4060 Laptop GPU, i7-14700HX, Samsung PM9A1 MZVL21T0HCLR
467 ms * +9%

* ... smaller is better

PCMark 10 Score
7256 points
Help
AIDA64 / Memory Copy
Lenovo Legion Pro 5 16IRX9 G9
Intel Core i7-14700HX, NVIDIA GeForce RTX 4060 Laptop GPU
78742 MB/s +53%
Average of class Gaming
  (21750 - 97515, n=141, last 2 years)
69914 MB/s +36%
Dell Inspiron 16 Plus 7640
Intel Core Ultra 7 155H, NVIDIA GeForce RTX 4060 Laptop GPU
63520 MB/s +24%
Asus TUF Gaming A15 FA507UV
AMD Ryzen 9 8945H, NVIDIA GeForce RTX 4060 Laptop GPU
61823 MB/s +20%
Lenovo LOQ 15IRX9
Intel Core i5-13450HX, NVIDIA GeForce RTX 4060 Laptop GPU
58673 MB/s +14%
Gigabyte G5 KF5 2024
Intel Core i7-13620H, NVIDIA GeForce RTX 4060 Laptop GPU
51393 MB/s
Average Intel Core i7-13620H
  (31629 - 53927, n=6)
46982 MB/s -9%
Gigabyte G5 KF
Intel Core i5-12500H, NVIDIA GeForce RTX 4060 Laptop GPU
43470 MB/s -15%
AIDA64 / Memory Read
Lenovo Legion Pro 5 16IRX9 G9
Intel Core i7-14700HX, NVIDIA GeForce RTX 4060 Laptop GPU
86175 MB/s +47%
Dell Inspiron 16 Plus 7640
Intel Core Ultra 7 155H, NVIDIA GeForce RTX 4060 Laptop GPU
77153 MB/s +31%
Average of class Gaming
  (22956 - 104349, n=141, last 2 years)
72996 MB/s +24%
Lenovo LOQ 15IRX9
Intel Core i5-13450HX, NVIDIA GeForce RTX 4060 Laptop GPU
68109 MB/s +16%
Asus TUF Gaming A15 FA507UV
AMD Ryzen 9 8945H, NVIDIA GeForce RTX 4060 Laptop GPU
61696 MB/s +5%
Gigabyte G5 KF5 2024
Intel Core i7-13620H, NVIDIA GeForce RTX 4060 Laptop GPU
58755 MB/s
Average Intel Core i7-13620H
  (35115 - 61853, n=6)
53236 MB/s -9%
Gigabyte G5 KF
Intel Core i5-12500H, NVIDIA GeForce RTX 4060 Laptop GPU
47117 MB/s -20%
AIDA64 / Memory Write
Asus TUF Gaming A15 FA507UV
AMD Ryzen 9 8945H, NVIDIA GeForce RTX 4060 Laptop GPU
78716 MB/s +54%
Lenovo Legion Pro 5 16IRX9 G9
Intel Core i7-14700HX, NVIDIA GeForce RTX 4060 Laptop GPU
76689 MB/s +50%
Average of class Gaming
  (22297 - 133486, n=141, last 2 years)
71884 MB/s +40%
Dell Inspiron 16 Plus 7640
Intel Core Ultra 7 155H, NVIDIA GeForce RTX 4060 Laptop GPU
65616 MB/s +28%
Lenovo LOQ 15IRX9
Intel Core i5-13450HX, NVIDIA GeForce RTX 4060 Laptop GPU
59981 MB/s +17%
Gigabyte G5 KF5 2024
Intel Core i7-13620H, NVIDIA GeForce RTX 4060 Laptop GPU
51235 MB/s
Gigabyte G5 KF
Intel Core i5-12500H, NVIDIA GeForce RTX 4060 Laptop GPU
46588 MB/s -9%
Average Intel Core i7-13620H
  (30611 - 54111, n=6)
46535 MB/s -9%
AIDA64 / Memory Latency
Dell Inspiron 16 Plus 7640
Intel Core Ultra 7 155H, NVIDIA GeForce RTX 4060 Laptop GPU
120.2 ns * -14%
Gigabyte G5 KF5 2024
Intel Core i7-13620H, NVIDIA GeForce RTX 4060 Laptop GPU
105.6 ns *
Average Intel Core i7-13620H
  (75.9 - 108.2, n=6)
100.4 ns * +5%
Average of class Gaming
  (59.5 - 259, n=141, last 2 years)
100.3 ns * +5%
Lenovo LOQ 15IRX9
Intel Core i5-13450HX, NVIDIA GeForce RTX 4060 Laptop GPU
94.2 ns * +11%
Asus TUF Gaming A15 FA507UV
AMD Ryzen 9 8945H, NVIDIA GeForce RTX 4060 Laptop GPU
92.6 ns * +12%
Gigabyte G5 KF
Intel Core i5-12500H, NVIDIA GeForce RTX 4060 Laptop GPU
83.8 ns * +21%
Lenovo Legion Pro 5 16IRX9 G9
Intel Core i7-14700HX, NVIDIA GeForce RTX 4060 Laptop GPU
82.7 ns * +22%

* ... smaller is better

DPC latencies

Even when moving the mouse pointer after starting LatencyMon, higher latencies are detected, which increase with every new action (open browser, open multiple tabs, play video). Our YouTube video also has two dropped frames. Overall, the latency values are clearly too high, even in comparison. The extremely high iGPU load of 89% when playing the YouTube video is also noticeable.

YouTube
YouTube
LatencyMon Main
LatencyMon Main
LatencyMon Drivers
LatencyMon Drivers
DPC Latencies / LatencyMon - interrupt to process latency (max), Web, Youtube, Prime95
Gigabyte G5 KF5 2024
NVIDIA GeForce RTX 4060 Laptop GPU, i7-13620H, Gigabyte AG450E1024-SI
5596.5 μs *
Gigabyte G5 KF
NVIDIA GeForce RTX 4060 Laptop GPU, i5-12500H, SSSTC CA6-8D512
1905 μs * +66%
Lenovo LOQ 15IRX9
NVIDIA GeForce RTX 4060 Laptop GPU, i5-13450HX, Micron 2400 MTFDKCD1T0QFM
1689.3 μs * +70%
Lenovo Legion Pro 5 16IRX9 G9
NVIDIA GeForce RTX 4060 Laptop GPU, i7-14700HX, Samsung PM9A1 MZVL21T0HCLR
951.7 μs * +83%
Asus TUF Gaming A15 FA507UV
NVIDIA GeForce RTX 4060 Laptop GPU, R9 8945H, WD PC SN560 SDDPNQE-1T00
790.8 μs * +86%
Dell Inspiron 16 Plus 7640
NVIDIA GeForce RTX 4060 Laptop GPU, Ultra 7 155H, SK hynix BC901 HFS001TEJ4X164N
770.1 μs * +86%

* ... smaller is better

Mass storage

The manufacturer uses an NVMe SSD with 1 TB of memory from its own Gigabyte brand in our test sample. It offers sequential transfer rates of 4,000 to 5,000 MB/s. This means it is usually even slightly faster than the competitors listed here.

However, it cannot maintain this performance because of the thermal throttling in our endurance test after the 16th DiskSpd pass. After that, the performance fluctuates greatly and drops drastically again and again.

Crystaldiskmark 6
Crystaldiskmark 6
AS SSD
AS SSD
AS SSD Copy
AS SSD Copy
Gigabyte AG450E1024-SI
CDM 5/6 Read Seq Q32T1: 5159 MB/s
CDM 5/6 Write Seq Q32T1: 4811 MB/s
CDM 5/6 Read 4K Q32T1: 687 MB/s
CDM 5/6 Write 4K Q32T1: 422 MB/s
CDM 5/6 Read 4K: 81.5 MB/s
CDM 5/6 Write 4K: 318 MB/s
CDM 6 Write 4K Q8T8: 2204 MB/s
CDM 6 Read 4K Q8T8: 2057 MB/s
Drive Performance Rating - Percent
Gigabyte G5 KF5 2024
Gigabyte AG450E1024-SI
89.7 pt
Average Gigabyte AG450E1024-SI
 
86.2 pt
Gigabyte G5 KF
SSSTC CA6-8D512
86 pt
Lenovo Legion Pro 5 16IRX9 G9
Samsung PM9A1 MZVL21T0HCLR
86 pt
Average of class Gaming
 
79.1 pt
Lenovo LOQ 15IRX9
Micron 2400 MTFDKCD1T0QFM
68.5 pt
Asus TUF Gaming A15 FA507UV
WD PC SN560 SDDPNQE-1T00
63.4 pt
Dell Inspiron 16 Plus 7640
SK hynix BC901 HFS001TEJ4X164N
44.4 pt
DiskSpd
seq read
Gigabyte G5 KF
SSSTC CA6-8D512
4094 (1992.5min - 4093.83max) MB/s +37%
Lenovo Legion Pro 5 16IRX9 G9
Samsung PM9A1 MZVL21T0HCLR
3497 (3441.46min - 3497.42max) MB/s +17%
Average of class Gaming
  (281 - 8300, n=124, last 2 years)
3480 MB/s +17%
Gigabyte G5 KF5 2024
Gigabyte AG450E1024-SI
2981 (2922.38min - 2980.98max) MB/s
Asus TUF Gaming A15 FA507UV
WD PC SN560 SDDPNQE-1T00
2943 (2931.61min - 2942.92max) MB/s -1%
Average Gigabyte AG450E1024-SI
  (2366 - 2981, n=3)
2656 MB/s -11%
Lenovo LOQ 15IRX9
Micron 2400 MTFDKCD1T0QFM
2364 (2348.18min - 2364.12max) MB/s -21%
Dell Inspiron 16 Plus 7640
SK hynix BC901 HFS001TEJ4X164N
2253 (2222.1min - 2252.66max) MB/s -24%
seq write
Gigabyte G5 KF5 2024
Gigabyte AG450E1024-SI
4772 (4589.99min - 4772.17max) MB/s
Average Gigabyte AG450E1024-SI
  (4659 - 4772, n=3)
4729 MB/s -1%
Average of class Gaming
  (1247 - 9699, n=124, last 2 years)
3981 MB/s -17%
Gigabyte G5 KF
SSSTC CA6-8D512
3870 (2222.52min - 3870.29max) MB/s -19%
Lenovo Legion Pro 5 16IRX9 G9
Samsung PM9A1 MZVL21T0HCLR
3403 (3360.48min - 3402.53max) MB/s -29%
Asus TUF Gaming A15 FA507UV
WD PC SN560 SDDPNQE-1T00
3126 (3069.81min - 3126.43max) MB/s -34%
Lenovo LOQ 15IRX9
Micron 2400 MTFDKCD1T0QFM
3103 (3061.84min - 3102.82max) MB/s -35%
Dell Inspiron 16 Plus 7640
SK hynix BC901 HFS001TEJ4X164N
2368 (2226.29min - 2367.89max) MB/s -50%
seq q8 t1 read
Gigabyte G5 KF
SSSTC CA6-8D512
6922 (6017.7min - 6922.07max) MB/s +41%
Average of class Gaming
  (2605 - 15056, n=124, last 2 years)
6740 MB/s +38%
Lenovo Legion Pro 5 16IRX9 G9
Samsung PM9A1 MZVL21T0HCLR
6599 (5813.31min - 6598.9max) MB/s +35%
Average Gigabyte AG450E1024-SI
  (4897 - 5181, n=3)
5077 MB/s +4%
Gigabyte G5 KF5 2024
Gigabyte AG450E1024-SI
4897 (4033.03min - 4896.79max) MB/s
Asus TUF Gaming A15 FA507UV
WD PC SN560 SDDPNQE-1T00
4869 (4298.53min - 4868.87max) MB/s -1%
Lenovo LOQ 15IRX9
Micron 2400 MTFDKCD1T0QFM
4611 (4173.71min - 4610.79max) MB/s -6%
Dell Inspiron 16 Plus 7640
SK hynix BC901 HFS001TEJ4X164N
3290 (2756.65min - 3289.51max) MB/s -33%
seq q8 t1 write
Average of class Gaming
  (1281 - 13519, n=124, last 2 years)
5334 MB/s +11%
Lenovo Legion Pro 5 16IRX9 G9
Samsung PM9A1 MZVL21T0HCLR
4934 (4925.79min - 4933.55max) MB/s +2%
Gigabyte G5 KF5 2024
Gigabyte AG450E1024-SI
4817 (4142.4min - 4817.36max) MB/s
Average Gigabyte AG450E1024-SI
  (4775 - 4821, n=3)
4804 MB/s 0%
Dell Inspiron 16 Plus 7640
SK hynix BC901 HFS001TEJ4X164N
4053 (3806.69min - 4053.03max) MB/s -16%
Gigabyte G5 KF
SSSTC CA6-8D512
3975 (1794.3min - 3974.73max) MB/s -17%
Lenovo LOQ 15IRX9
Micron 2400 MTFDKCD1T0QFM
3612 (3558.24min - 3612.04max) MB/s -25%
Asus TUF Gaming A15 FA507UV
WD PC SN560 SDDPNQE-1T00
3140 (3055.76min - 3139.87max) MB/s -35%
4k q1 t1 read
Gigabyte G5 KF
SSSTC CA6-8D512
81.7 MB/s 0%
Gigabyte G5 KF5 2024
Gigabyte AG450E1024-SI
81.5 (80.26min - 81.51max) MB/s
Lenovo Legion Pro 5 16IRX9 G9
Samsung PM9A1 MZVL21T0HCLR
80.5 (78.06min - 80.5max) MB/s -1%
Average of class Gaming
  (32.2 - 110.2, n=124, last 2 years)
68.4 MB/s -16%
Asus TUF Gaming A15 FA507UV
WD PC SN560 SDDPNQE-1T00
62.9 (61.89min - 62.92max) MB/s -23%
Average Gigabyte AG450E1024-SI
  (47.2 - 81.5, n=3)
61.6 MB/s -24%
Lenovo LOQ 15IRX9
Micron 2400 MTFDKCD1T0QFM
54.4 (52.28min - 54.35max) MB/s -33%
Dell Inspiron 16 Plus 7640
SK hynix BC901 HFS001TEJ4X164N
44.5 (43.13min - 44.5max) MB/s -45%
4k q1 t1 write
Gigabyte G5 KF5 2024
Gigabyte AG450E1024-SI
330 (328.21min - 330.19max) MB/s
Average Gigabyte AG450E1024-SI
  (298 - 340, n=3)
323 MB/s -2%
Gigabyte G5 KF
SSSTC CA6-8D512
296 (231.06min - 296.08max) MB/s -10%
Lenovo LOQ 15IRX9
Micron 2400 MTFDKCD1T0QFM
266 (259.13min - 265.64max) MB/s -19%
Lenovo Legion Pro 5 16IRX9 G9
Samsung PM9A1 MZVL21T0HCLR
251 (246.36min - 251.38max) MB/s -24%
Asus TUF Gaming A15 FA507UV
WD PC SN560 SDDPNQE-1T00
229 (227.99min - 229max) MB/s -31%
Average of class Gaming
  (78 - 397, n=124, last 2 years)
216 MB/s -35%
Dell Inspiron 16 Plus 7640
SK hynix BC901 HFS001TEJ4X164N
123 (117.55min - 122.97max) MB/s -63%
4k q32 t16 read
Lenovo Legion Pro 5 16IRX9 G9
Samsung PM9A1 MZVL21T0HCLR
4117 (4077.22min - 4117.27max) MB/s +18%
Gigabyte G5 KF5 2024
Gigabyte AG450E1024-SI
3485 (3458.58min - 3485.22max) MB/s
Average Gigabyte AG450E1024-SI
  (3293 - 3485, n=3)
3360 MB/s -4%
Gigabyte G5 KF
SSSTC CA6-8D512
3181 (1310.9min - 3180.87max) MB/s -9%
Lenovo LOQ 15IRX9
Micron 2400 MTFDKCD1T0QFM
2852 (1702.21min - 2851.88max) MB/s -18%
Average of class Gaming
  (417 - 8067, n=124, last 2 years)
2555 MB/s -27%
Asus TUF Gaming A15 FA507UV
WD PC SN560 SDDPNQE-1T00
1544 (1272.83min - 1543.53max) MB/s -56%
Dell Inspiron 16 Plus 7640
SK hynix BC901 HFS001TEJ4X164N
575 (568.91min - 575.1max) MB/s -84%
4k q32 t16 write
Lenovo Legion Pro 5 16IRX9 G9
Samsung PM9A1 MZVL21T0HCLR
3534 (3522.28min - 3534.26max) MB/s +11%
Average Gigabyte AG450E1024-SI
  (3074 - 3443, n=3)
3237 MB/s +1%
Gigabyte G5 KF5 2024
Gigabyte AG450E1024-SI
3195 (3175.09min - 3194.61max) MB/s
Lenovo LOQ 15IRX9
Micron 2400 MTFDKCD1T0QFM
2535 (2457.97min - 2535.38max) MB/s -21%
Gigabyte G5 KF
SSSTC CA6-8D512
2147 (1232.2min - 2146.52max) MB/s -33%
Average of class Gaming
  (162.3 - 5653, n=124, last 2 years)
2087 MB/s -35%
Asus TUF Gaming A15 FA507UV
WD PC SN560 SDDPNQE-1T00
2038 (1836.85min - 2038.27max) MB/s -36%
Dell Inspiron 16 Plus 7640
SK hynix BC901 HFS001TEJ4X164N
394 (375.37min - 394.14max) MB/s -88%
AS SSD
Score Total
Average Gigabyte AG450E1024-SI
  (7807 - 8778, n=3)
8252 Points +1%
Gigabyte G5 KF5 2024
Gigabyte AG450E1024-SI
8170 Points
Lenovo Legion Pro 5 16IRX9 G9
Samsung PM9A1 MZVL21T0HCLR
7769 Points -5%
Gigabyte G5 KF
SSSTC CA6-8D512
7237 Points -11%
Average of class Gaming
  (2782 - 13854, n=122, last 2 years)
6842 Points -16%
Lenovo LOQ 15IRX9
Micron 2400 MTFDKCD1T0QFM
5947 Points -27%
Asus TUF Gaming A15 FA507UV
WD PC SN560 SDDPNQE-1T00
5043 Points -38%
Dell Inspiron 16 Plus 7640
SK hynix BC901 HFS001TEJ4X164N
4307 Points -47%
Score Read
Gigabyte G5 KF5 2024
Gigabyte AG450E1024-SI
3323 Points
Average Gigabyte AG450E1024-SI
  (3051 - 3323, n=3)
3175 Points -4%
Gigabyte G5 KF
SSSTC CA6-8D512
3127 Points -6%
Lenovo Legion Pro 5 16IRX9 G9
Samsung PM9A1 MZVL21T0HCLR
2963 Points -11%
Average of class Gaming
  (776 - 4721, n=122, last 2 years)
2382 Points -28%
Lenovo LOQ 15IRX9
Micron 2400 MTFDKCD1T0QFM
2363 Points -29%
Asus TUF Gaming A15 FA507UV
WD PC SN560 SDDPNQE-1T00
1749 Points -47%
Dell Inspiron 16 Plus 7640
SK hynix BC901 HFS001TEJ4X164N
1260 Points -62%
Score Write
Average Gigabyte AG450E1024-SI
  (3133 - 4006, n=3)
3443 Points +10%
Average of class Gaming
  (989 - 7208, n=122, last 2 years)
3308 Points +6%
Lenovo Legion Pro 5 16IRX9 G9
Samsung PM9A1 MZVL21T0HCLR
3262 Points +4%
Gigabyte G5 KF5 2024
Gigabyte AG450E1024-SI
3133 Points
Gigabyte G5 KF
SSSTC CA6-8D512
2608 Points -17%
Dell Inspiron 16 Plus 7640
SK hynix BC901 HFS001TEJ4X164N
2482 Points -21%
Asus TUF Gaming A15 FA507UV
WD PC SN560 SDDPNQE-1T00
2449 Points -22%
Lenovo LOQ 15IRX9
Micron 2400 MTFDKCD1T0QFM
2414 Points -23%
Seq Read
Gigabyte G5 KF
SSSTC CA6-8D512
5712.7 MB/s +36%
Average of class Gaming
  (2260 - 9890, n=122, last 2 years)
5180 MB/s +23%
Asus TUF Gaming A15 FA507UV
WD PC SN560 SDDPNQE-1T00
4260.13 MB/s +1%
Gigabyte G5 KF5 2024
Gigabyte AG450E1024-SI
4215 MB/s
Average Gigabyte AG450E1024-SI
  (4161 - 4215, n=3)
4196 MB/s 0%
Dell Inspiron 16 Plus 7640
SK hynix BC901 HFS001TEJ4X164N
4056.14 MB/s -4%
Lenovo LOQ 15IRX9
Micron 2400 MTFDKCD1T0QFM
3796.49 MB/s -10%
Lenovo Legion Pro 5 16IRX9 G9
Samsung PM9A1 MZVL21T0HCLR
3027 MB/s -28%
Seq Write
Average Gigabyte AG450E1024-SI
  (4234 - 4432, n=3)
4314 MB/s +1%
Gigabyte G5 KF5 2024
Gigabyte AG450E1024-SI
4277 MB/s
Average of class Gaming
  (1215 - 9926, n=122, last 2 years)
3987 MB/s -7%
Gigabyte G5 KF
SSSTC CA6-8D512
3701.25 MB/s -13%
Lenovo Legion Pro 5 16IRX9 G9
Samsung PM9A1 MZVL21T0HCLR
3510 MB/s -18%
Asus TUF Gaming A15 FA507UV
WD PC SN560 SDDPNQE-1T00
3100.95 MB/s -27%
Lenovo LOQ 15IRX9
Micron 2400 MTFDKCD1T0QFM
3051.23 MB/s -29%
Dell Inspiron 16 Plus 7640
SK hynix BC901 HFS001TEJ4X164N
2267 MB/s -47%
4K Read
Gigabyte G5 KF5 2024
Gigabyte AG450E1024-SI
98.9 MB/s
Average Gigabyte AG450E1024-SI
  (61.9 - 98.9, n=3)
79.7 MB/s -19%
Gigabyte G5 KF
SSSTC CA6-8D512
79.16 MB/s -20%
Lenovo Legion Pro 5 16IRX9 G9
Samsung PM9A1 MZVL21T0HCLR
75.4 MB/s -24%
Average of class Gaming
  (27.8 - 108.4, n=122, last 2 years)
67.3 MB/s -32%
Asus TUF Gaming A15 FA507UV
WD PC SN560 SDDPNQE-1T00
56.75 MB/s -43%
Lenovo LOQ 15IRX9
Micron 2400 MTFDKCD1T0QFM
53.84 MB/s -46%
Dell Inspiron 16 Plus 7640
SK hynix BC901 HFS001TEJ4X164N
49.59 MB/s -50%
4K Write
Gigabyte G5 KF5 2024
Gigabyte AG450E1024-SI
284 MB/s
Gigabyte G5 KF
SSSTC CA6-8D512
282.28 MB/s -1%
Average Gigabyte AG450E1024-SI
  (255 - 284, n=3)
274 MB/s -4%
Lenovo LOQ 15IRX9
Micron 2400 MTFDKCD1T0QFM
226.41 MB/s -20%
Lenovo Legion Pro 5 16IRX9 G9
Samsung PM9A1 MZVL21T0HCLR
217 MB/s -24%
Average of class Gaming
  (75.6 - 512, n=122, last 2 years)
216 MB/s -24%
Asus TUF Gaming A15 FA507UV
WD PC SN560 SDDPNQE-1T00
187.56 MB/s -34%
Dell Inspiron 16 Plus 7640
SK hynix BC901 HFS001TEJ4X164N
164.61 MB/s -42%
4K-64 Read
Gigabyte G5 KF5 2024
Gigabyte AG450E1024-SI
2803 MB/s
Average Gigabyte AG450E1024-SI
  (2551 - 2803, n=3)
2676 MB/s -5%
Lenovo Legion Pro 5 16IRX9 G9
Samsung PM9A1 MZVL21T0HCLR
2585 MB/s -8%
Gigabyte G5 KF
SSSTC CA6-8D512
2476.84 MB/s -12%
Lenovo LOQ 15IRX9
Micron 2400 MTFDKCD1T0QFM
1929.3 MB/s -31%
Average of class Gaming
  (451 - 3630, n=122, last 2 years)
1789 MB/s -36%
Asus TUF Gaming A15 FA507UV
WD PC SN560 SDDPNQE-1T00
1266.17 MB/s -55%
Dell Inspiron 16 Plus 7640
SK hynix BC901 HFS001TEJ4X164N
804.71 MB/s -71%
4K-64 Write
Average Gigabyte AG450E1024-SI
  (2421 - 3279, n=3)
2738 MB/s +13%
Average of class Gaming
  (521 - 5909, n=122, last 2 years)
2697 MB/s +11%
Lenovo Legion Pro 5 16IRX9 G9
Samsung PM9A1 MZVL21T0HCLR
2694 MB/s +11%
Gigabyte G5 KF5 2024
Gigabyte AG450E1024-SI
2421 MB/s
Dell Inspiron 16 Plus 7640
SK hynix BC901 HFS001TEJ4X164N
2090.45 MB/s -14%
Gigabyte G5 KF
SSSTC CA6-8D512
1955.15 MB/s -19%
Asus TUF Gaming A15 FA507UV
WD PC SN560 SDDPNQE-1T00
1951.29 MB/s -19%
Lenovo LOQ 15IRX9
Micron 2400 MTFDKCD1T0QFM
1882 MB/s -22%
Access Time Read
Dell Inspiron 16 Plus 7640
SK hynix BC901 HFS001TEJ4X164N
0.093 ms * -94%
Average Gigabyte AG450E1024-SI
  (0.048 - 0.088, n=3)
0.06767 ms * -41%
Asus TUF Gaming A15 FA507UV
WD PC SN560 SDDPNQE-1T00
0.063 ms * -31%
Average of class Gaming
  (0.016 - 0.379, n=122, last 2 years)
0.05598 ms * -17%
Gigabyte G5 KF5 2024
Gigabyte AG450E1024-SI
0.048 ms *
Lenovo LOQ 15IRX9
Micron 2400 MTFDKCD1T0QFM
0.033 ms * +31%
Lenovo Legion Pro 5 16IRX9 G9
Samsung PM9A1 MZVL21T0HCLR
0.032 ms * +33%
Gigabyte G5 KF
SSSTC CA6-8D512
0.025 ms * +48%
Access Time Write
Dell Inspiron 16 Plus 7640
SK hynix BC901 HFS001TEJ4X164N
0.318 ms * -2020%
Lenovo LOQ 15IRX9
Micron 2400 MTFDKCD1T0QFM
0.097 ms * -547%
Average of class Gaming
  (0.012 - 0.29, n=122, last 2 years)
0.04034 ms * -169%
Lenovo Legion Pro 5 16IRX9 G9
Samsung PM9A1 MZVL21T0HCLR
0.02 ms * -33%
Asus TUF Gaming A15 FA507UV
WD PC SN560 SDDPNQE-1T00
0.02 ms * -33%
Gigabyte G5 KF
SSSTC CA6-8D512
0.017 ms * -13%
Gigabyte G5 KF5 2024
Gigabyte AG450E1024-SI
0.015 ms *
Average Gigabyte AG450E1024-SI
  (0.015 - 0.015, n=3)
0.015 ms * -0%

* ... smaller is better

Continuous read: DiskSpd Read Loop, Queue Depth 8

033567010051340167520102345268030153350368540204355469050255360569560306365Tooltip
Gigabyte G5 KF5 2024 Gigabyte AG450E1024-SI; diskspd 2.0.17 f: Ø3808 (1282.15-5176.82)
Lenovo LOQ 15IRX9 Micron 2400 MTFDKCD1T0QFM; diskspd 2.0.17 f: Ø3364 (2261.87-4608.28)
Asus TUF Gaming A15 FA507UV WD PC SN560 SDDPNQE-1T00; diskspd 2.0.17 f: Ø4300 (3774.46-4795.98)
Lenovo Legion Pro 5 16IRX9 G9 Samsung PM9A1 MZVL21T0HCLR; diskspd 2.0.17 f: Ø4251 (3284.07-6624.06)

Graphics

The RTX 4060 is allowed a maximum TGP of 75 W in the G5, which is a rather average value. This is probably also why the G5 disappoints in the synthetic 3D benchmarks. Only in the Cloud Gate test, which is no longer supported, does it achieve an unexpectedly good value. Its other results are more of a reflection of its predecessor and are around 6 percent worse than the average laptop with RTX 4060 from our database. Except for the Dell Inspiron 16 Plus 7640, all competitors are faster, especially the Legion 5 Pro, at least if you exclude the Cloud Gate test.

The picture is similar in gaming: The G5 still performs well in CPU-heavy titles but can't quite keep up with the competition in GPU-intensive games. In addition, unlike most other laptops, our Cyberpunk 2077 endurance test shows a continuous drop in the frame rate over time. This unstable behavior indicates an overtaxed cooling system, and the SSD throttling is also an indication of this, more on this below. Despite the comparatively weak performance, you can play almost any game in Full HD in medium to maximum details with the RTX 4060 in the G5.

In battery mode, a whole 73 percent of 3D performance is lost in another Fire Strike run.

3DMark 11
3DMark 11
Cloud Gate
Cloud Gate
Fire Strike
Fire Strike
Time Spy
Time Spy
3DMark Performance Rating - Percent
Average of class Gaming
 
96.8 pt
Lenovo Legion Pro 5 16IRX9 G9
NVIDIA GeForce RTX 4060 Laptop GPU, Intel Core i7-14700HX
78.1 pt
Gigabyte G5 KF5 2024
NVIDIA GeForce RTX 4060 Laptop GPU, Intel Core i7-13620H
76.6 pt
Average NVIDIA GeForce RTX 4060 Laptop GPU
 
76.1 pt
Asus TUF Gaming A15 FA507UV -1!
NVIDIA GeForce RTX 4060 Laptop GPU, AMD Ryzen 9 8945H
75.9 pt
Lenovo LOQ 15IRX9 -1!
NVIDIA GeForce RTX 4060 Laptop GPU, Intel Core i5-13450HX
73.5 pt
Gigabyte G5 KF
NVIDIA GeForce RTX 4060 Laptop GPU, Intel Core i5-12500H
73.2 pt
Dell Inspiron 16 Plus 7640 -1!
NVIDIA GeForce RTX 4060 Laptop GPU, Intel Core Ultra 7 155H
61.6 pt
3DMark 11 - 1280x720 Performance GPU
Average of class Gaming
  (10741 - 76300, n=136, last 2 years)
47665 Points +45%
Lenovo Legion Pro 5 16IRX9 G9
NVIDIA GeForce RTX 4060 Laptop GPU, Intel Core i7-14700HX
36945 Points +12%
Asus TUF Gaming A15 FA507UV
NVIDIA GeForce RTX 4060 Laptop GPU, AMD Ryzen 9 8945H
36493 Points +11%
Lenovo LOQ 15IRX9
NVIDIA GeForce RTX 4060 Laptop GPU, Intel Core i5-13450HX
35608 Points +8%
Average NVIDIA GeForce RTX 4060 Laptop GPU
  (28136 - 38912, n=57)
34860 Points +6%
Gigabyte G5 KF
NVIDIA GeForce RTX 4060 Laptop GPU, Intel Core i5-12500H
33490 Points +2%
Gigabyte G5 KF5 2024
NVIDIA GeForce RTX 4060 Laptop GPU, Intel Core i7-13620H
32903 Points
Dell Inspiron 16 Plus 7640
NVIDIA GeForce RTX 4060 Laptop GPU, Intel Core Ultra 7 155H
30097 Points -9%
3DMark
1280x720 Cloud Gate Standard Graphics
Gigabyte G5 KF5 2024
NVIDIA GeForce RTX 4060 Laptop GPU, Intel Core i7-13620H
170179 Points
Average NVIDIA GeForce RTX 4060 Laptop GPU
  (81407 - 180228, n=29)
150196 Points -12%
Gigabyte G5 KF
NVIDIA GeForce RTX 4060 Laptop GPU, Intel Core i5-12500H
148762 Points -13%
Average of class Gaming
  (84648 - 193851, n=60, last 2 years)
148292 Points -13%
Lenovo Legion Pro 5 16IRX9 G9
NVIDIA GeForce RTX 4060 Laptop GPU, Intel Core i7-14700HX
138926 Points -18%
1920x1080 Fire Strike Graphics
Average of class Gaming
  (2913 - 62849, n=151, last 2 years)
34482 Points +35%
Asus TUF Gaming A15 FA507UV
NVIDIA GeForce RTX 4060 Laptop GPU, AMD Ryzen 9 8945H
28015 Points +10%
Lenovo Legion Pro 5 16IRX9 G9
NVIDIA GeForce RTX 4060 Laptop GPU, Intel Core i7-14700HX
27046 Points +6%
Lenovo LOQ 15IRX9
NVIDIA GeForce RTX 4060 Laptop GPU, Intel Core i5-13450HX
27026 Points +6%
Average NVIDIA GeForce RTX 4060 Laptop GPU
  (20533 - 29656, n=54)
25780 Points +1%
Gigabyte G5 KF5 2024
NVIDIA GeForce RTX 4060 Laptop GPU, Intel Core i7-13620H
25556 Points
Gigabyte G5 KF
NVIDIA GeForce RTX 4060 Laptop GPU, Intel Core i5-12500H
24789 Points -3%
Dell Inspiron 16 Plus 7640
NVIDIA GeForce RTX 4060 Laptop GPU, Intel Core Ultra 7 155H
22476 Points -12%
2560x1440 Time Spy Graphics
Average of class Gaming
  (2295 - 25763, n=147, last 2 years)
14556 Points +59%
Lenovo Legion Pro 5 16IRX9 G9
NVIDIA GeForce RTX 4060 Laptop GPU, Intel Core i7-14700HX
10919 Points +19%
Asus TUF Gaming A15 FA507UV
NVIDIA GeForce RTX 4060 Laptop GPU, AMD Ryzen 9 8945H
10189 Points +11%
Average NVIDIA GeForce RTX 4060 Laptop GPU
  (7484 - 11451, n=56)
9943 Points +8%
Lenovo LOQ 15IRX9
NVIDIA GeForce RTX 4060 Laptop GPU, Intel Core i5-13450HX
9830 Points +7%
Gigabyte G5 KF
NVIDIA GeForce RTX 4060 Laptop GPU, Intel Core i5-12500H
9199 Points 0%
Gigabyte G5 KF5 2024
NVIDIA GeForce RTX 4060 Laptop GPU, Intel Core i7-13620H
9183 Points
Dell Inspiron 16 Plus 7640
NVIDIA GeForce RTX 4060 Laptop GPU, Intel Core Ultra 7 155H
8229 Points -10%
3DMark 11 Performance
29001 points
3DMark Cloud Gate Standard Score
58918 points
3DMark Fire Strike Score
20767 points
3DMark Time Spy Score
9497 points
Help
Blender
v3.3 Classroom OPTIX/RTX
Lenovo LOQ 15IRX9
NVIDIA GeForce RTX 4060 Laptop GPU, Intel Core i5-13450HX
25 Seconds * -0%
Gigabyte G5 KF5 2024
NVIDIA GeForce RTX 4060 Laptop GPU, Intel Core i7-13620H
25 Seconds *
Gigabyte G5 KF
NVIDIA GeForce RTX 4060 Laptop GPU, Intel Core i5-12500H
24 Seconds * +4%
Dell Inspiron 16 Plus 7640
NVIDIA GeForce RTX 4060 Laptop GPU, Intel Core Ultra 7 155H
24 Seconds * +4%
Average NVIDIA GeForce RTX 4060 Laptop GPU
  (19 - 28, n=53)
22.9 Seconds * +8%
Lenovo Legion Pro 5 16IRX9 G9
NVIDIA GeForce RTX 4060 Laptop GPU, Intel Core i7-14700HX
21 Seconds * +16%
Asus TUF Gaming A15 FA507UV
NVIDIA GeForce RTX 4060 Laptop GPU, AMD Ryzen 9 8945H
21 Seconds * +16%
Average of class Gaming
  (9 - 95, n=136, last 2 years)
19.6 Seconds * +22%
v3.3 Classroom CUDA
Dell Inspiron 16 Plus 7640
NVIDIA GeForce RTX 4060 Laptop GPU, Intel Core Ultra 7 155H
44 Seconds * -2%
Lenovo LOQ 15IRX9
NVIDIA GeForce RTX 4060 Laptop GPU, Intel Core i5-13450HX
44 Seconds * -2%
Average NVIDIA GeForce RTX 4060 Laptop GPU
  (39 - 53, n=53)
43.2 Seconds * -0%
Gigabyte G5 KF5 2024
NVIDIA GeForce RTX 4060 Laptop GPU, Intel Core i7-13620H
43 Seconds *
Gigabyte G5 KF
NVIDIA GeForce RTX 4060 Laptop GPU, Intel Core i5-12500H
42 Seconds * +2%
Lenovo Legion Pro 5 16IRX9 G9
NVIDIA GeForce RTX 4060 Laptop GPU, Intel Core i7-14700HX
41 Seconds * +5%
Asus TUF Gaming A15 FA507UV
NVIDIA GeForce RTX 4060 Laptop GPU, AMD Ryzen 9 8945H
41 Seconds * +5%
Average of class Gaming
  (15 - 110, n=136, last 2 years)
32.7 Seconds * +24%
v3.3 Classroom CPU
Gigabyte G5 KF
NVIDIA GeForce RTX 4060 Laptop GPU, Intel Core i5-12500H
452 Seconds * -20%
Lenovo LOQ 15IRX9
NVIDIA GeForce RTX 4060 Laptop GPU, Intel Core i5-13450HX
397 Seconds * -5%
Gigabyte G5 KF5 2024
NVIDIA GeForce RTX 4060 Laptop GPU, Intel Core i7-13620H
378 Seconds *
Dell Inspiron 16 Plus 7640
NVIDIA GeForce RTX 4060 Laptop GPU, Intel Core Ultra 7 155H
365 Seconds * +3%
Average NVIDIA GeForce RTX 4060 Laptop GPU
  (189 - 452, n=53)
309 Seconds * +18%
Asus TUF Gaming A15 FA507UV
NVIDIA GeForce RTX 4060 Laptop GPU, AMD Ryzen 9 8945H
293 Seconds * +22%
Average of class Gaming
  (122 - 962, n=142, last 2 years)
270 Seconds * +29%
Lenovo Legion Pro 5 16IRX9 G9
NVIDIA GeForce RTX 4060 Laptop GPU, Intel Core i7-14700HX
228 Seconds * +40%

* ... smaller is better

Performance Rating - Percent
Average of class Gaming
 
93 pt
Lenovo Legion Pro 5 16IRX9 G9
Intel Core i7-14700HX, NVIDIA GeForce RTX 4060 Laptop GPU
84.9 pt
Lenovo LOQ 15IRX9 -1!
Intel Core i5-13450HX, NVIDIA GeForce RTX 4060 Laptop GPU
76.6 pt
Asus TUF Gaming A15 FA507UV
AMD Ryzen 9 8945H, NVIDIA GeForce RTX 4060 Laptop GPU
74.8 pt
Gigabyte G5 KF5 2024
Intel Core i7-13620H, NVIDIA GeForce RTX 4060 Laptop GPU
73.8 pt
Gigabyte G5 KF
Intel Core i5-12500H, NVIDIA GeForce RTX 4060 Laptop GPU
69.3 pt
Dell Inspiron 16 Plus 7640 -1!
Intel Core Ultra 7 155H, NVIDIA GeForce RTX 4060 Laptop GPU
63.1 pt
Baldur's Gate 3 - 1920x1080 Ultra Preset AA:T
Average of class Gaming
  (34.5 - 246, n=87, last 2 years)
133.2 fps +59%
Asus TUF Gaming A15 FA507UV
AMD Ryzen 9 8945H, NVIDIA GeForce RTX 4060 Laptop GPU
93.9 (67.7min, 75.2P0.1, 79P1) fps +12%
Gigabyte G5 KF5 2024
Intel Core i7-13620H, NVIDIA GeForce RTX 4060 Laptop GPU
84 fps
Dell Inspiron 16 Plus 7640
Intel Core Ultra 7 155H, NVIDIA GeForce RTX 4060 Laptop GPU
76.7 fps -9%
Gigabyte G5 KF
Intel Core i5-12500H, NVIDIA GeForce RTX 4060 Laptop GPU
75.1 (28.1min, 36.6P0.1, 54.5P1) fps -11%
Lenovo Legion Pro 5 16IRX9 G9
Intel Core i7-14700HX, NVIDIA GeForce RTX 4060 Laptop GPU
66.5 fps -21%
GTA V - 1920x1080 Highest Settings possible AA:4xMSAA + FX AF:16x
Lenovo Legion Pro 5 16IRX9 G9
Intel Core i7-14700HX, NVIDIA GeForce RTX 4060 Laptop GPU
124.9 (3.49min, 76.9P1) fps +22%
Average of class Gaming
  (12.1 - 186.9, n=124, last 2 years)
120.8 fps +18%
Lenovo LOQ 15IRX9
Intel Core i5-13450HX, NVIDIA GeForce RTX 4060 Laptop GPU
112.6 (5.45min, 76.9P1) fps +10%
Gigabyte G5 KF
Intel Core i5-12500H, NVIDIA GeForce RTX 4060 Laptop GPU
107.6 (4.17min, 66.7P1) fps +5%
Asus TUF Gaming A15 FA507UV
AMD Ryzen 9 8945H, NVIDIA GeForce RTX 4060 Laptop GPU
107.2 (4.45min, 76.9P1) fps +5%
Gigabyte G5 KF5 2024
Intel Core i7-13620H, NVIDIA GeForce RTX 4060 Laptop GPU
102.4 (8.53min, 71.4P1) fps
Final Fantasy XV Benchmark - 1920x1080 High Quality
Average of class Gaming
  (19.2 - 215, n=139, last 2 years)
131.8 fps +41%
Lenovo Legion Pro 5 16IRX9 G9
Intel Core i7-14700HX, NVIDIA GeForce RTX 4060 Laptop GPU
106.1 fps +14%
Asus TUF Gaming A15 FA507UV
AMD Ryzen 9 8945H, NVIDIA GeForce RTX 4060 Laptop GPU
100.7 fps +8%
Lenovo LOQ 15IRX9
Intel Core i5-13450HX, NVIDIA GeForce RTX 4060 Laptop GPU
99.9 fps +7%
Gigabyte G5 KF5 2024
Intel Core i7-13620H, NVIDIA GeForce RTX 4060 Laptop GPU
93.2 fps
Gigabyte G5 KF
Intel Core i5-12500H, NVIDIA GeForce RTX 4060 Laptop GPU
91.9 fps -1%
Dell Inspiron 16 Plus 7640
Intel Core Ultra 7 155H, NVIDIA GeForce RTX 4060 Laptop GPU
78.8 fps -15%
Strange Brigade - 1920x1080 ultra AA:ultra AF:16
Average of class Gaming
  (38.9 - 456, n=131, last 2 years)
254 fps +49%
Lenovo Legion Pro 5 16IRX9 G9
Intel Core i7-14700HX, NVIDIA GeForce RTX 4060 Laptop GPU
199.9 (40.2min, 143.4P1) fps +17%
Asus TUF Gaming A15 FA507UV
AMD Ryzen 9 8945H, NVIDIA GeForce RTX 4060 Laptop GPU
184.2 (41min, 136.6P1) fps +8%
Lenovo LOQ 15IRX9
Intel Core i5-13450HX, NVIDIA GeForce RTX 4060 Laptop GPU
182.7 (43.5min, 133.1P1) fps +7%
Gigabyte G5 KF
Intel Core i5-12500H, NVIDIA GeForce RTX 4060 Laptop GPU
172.1 (71.6min, 126.4P1) fps +1%
Gigabyte G5 KF5 2024
Intel Core i7-13620H, NVIDIA GeForce RTX 4060 Laptop GPU
170.8 (53.4min, 126.3P1) fps
Dell Inspiron 16 Plus 7640
Intel Core Ultra 7 155H, NVIDIA GeForce RTX 4060 Laptop GPU
153.5 (48min, 114.7P1) fps -10%
Dota 2 Reborn - 1920x1080 ultra (3/3) best looking
Lenovo Legion Pro 5 16IRX9 G9
Intel Core i7-14700HX, NVIDIA GeForce RTX 4060 Laptop GPU
183.8 (158.1min) fps +19%
Gigabyte G5 KF5 2024
Intel Core i7-13620H, NVIDIA GeForce RTX 4060 Laptop GPU
154.5 (133.1min) fps
Average of class Gaming
  (65.1 - 248, n=142, last 2 years)
153.5 fps -1%
Lenovo LOQ 15IRX9
Intel Core i5-13450HX, NVIDIA GeForce RTX 4060 Laptop GPU
141 (122.7min) fps -9%
Asus TUF Gaming A15 FA507UV
AMD Ryzen 9 8945H, NVIDIA GeForce RTX 4060 Laptop GPU
139.5 (122.4min) fps -10%
Dell Inspiron 16 Plus 7640
Intel Core Ultra 7 155H, NVIDIA GeForce RTX 4060 Laptop GPU
135.1 (116.3min) fps -13%
Gigabyte G5 KF
Intel Core i5-12500H, NVIDIA GeForce RTX 4060 Laptop GPU
131.2 (115min) fps -15%
X-Plane 11.11 - 1920x1080 high (fps_test=3)
Lenovo Legion Pro 5 16IRX9 G9
Intel Core i7-14700HX, NVIDIA GeForce RTX 4060 Laptop GPU
135.1 fps +32%
Average of class Gaming
  (33.4 - 166.2, n=144, last 2 years)
104.8 fps +3%
Gigabyte G5 KF5 2024
Intel Core i7-13620H, NVIDIA GeForce RTX 4060 Laptop GPU
102 fps
Lenovo LOQ 15IRX9
Intel Core i5-13450HX, NVIDIA GeForce RTX 4060 Laptop GPU
92.2 fps -10%
Asus TUF Gaming A15 FA507UV
AMD Ryzen 9 8945H, NVIDIA GeForce RTX 4060 Laptop GPU
91.7 fps -10%
Gigabyte G5 KF
Intel Core i5-12500H, NVIDIA GeForce RTX 4060 Laptop GPU
87.1 fps -15%
Dell Inspiron 16 Plus 7640
Intel Core Ultra 7 155H, NVIDIA GeForce RTX 4060 Laptop GPU
86.5 fps -15%

Cyberpunk 2077 ultra FPS chart

05101520253035404550556065Tooltip
Gigabyte G5 KF5 2024 i7-13620H, NVIDIA GeForce RTX 4060 Laptop GPU: Ø57.1 (51.9-62.1)
Lenovo LOQ 15IRX9 i5-13450HX, NVIDIA GeForce RTX 4060 Laptop GPU: Ø65.1 (61.4-65.8)
Asus TUF Gaming A15 FA507UV R9 8945H, NVIDIA GeForce RTX 4060 Laptop GPU: Ø66.8 (63.8-67.8)
Lenovo Legion Pro 5 16IRX9 G9 i7-14700HX, NVIDIA GeForce RTX 4060 Laptop GPU: Ø68.5 (65-69.4)
lowmed.highultra
GTA V (2015) 186.4 181.2 170.6 102.4
Dota 2 Reborn (2015) 188.7 172.3 164.9 154.5
Final Fantasy XV Benchmark (2018) 187.2 129.6 93.2
X-Plane 11.11 (2018) 159.3 131.1 102
Strange Brigade (2018) 441 253 192.3 170.8
Baldur's Gate 3 (2023) 125 98 86 84
Cyberpunk 2077 2.2 Phantom Liberty (2023) 114 91 77.2 68.2

Emissions & energy - Overloaded cooling system

Noise emissions

In performance mode, the fans are often on and the noise is around 27.87 dB. In our 3dMark06 test, the fans remain at this level for a long time, but then ramp up to the maximum speed of 54.82 dB shortly before the end, which we also measured at Cyberpoint 2077 or in our stress test. The predecessor was also this loud, the direct competition remains somewhat quieter, the Legion Pro 5 at least reaches similar noise levels, but also performs better than our G5.

In addition, a loud clicking noise under heavy 3D loads is unsettling in our test model. It seems as if something inside periodically (approx. 2 - 3 Hz) bumps against the casing, which does not make a good impression. If we lift the laptop and change its position in the hand, the noise changes and can also disappear completely. If we put it down again, the noise is usually there again. For the maintenance part, we only opened the casing after these findings but were unable to discover any loose parts.

Noise Level

Idle
23 / 23 / 27.87 dB(A)
Load
54.82 / 54.82 dB(A)
  red to green bar
 
 
30 dB
silent
40 dB(A)
audible
50 dB(A)
loud
 
min: dark, med: mid, max: light   Earthworks M23R, Arta (15 cm distance)   environment noise: 23 dB(A)
dB(A) 0102030405060708090Deep BassMiddle BassHigh BassLower RangeMidsHigher MidsLower HighsMid HighsUpper HighsSuper Highs2032.534.832.52525.525.325.53128.926.528.94024.620.824.65025.423.225.46326.828.226.88024.118.524.110023.822.223.812522.114.822.116025.713.925.720027.121.227.12503014.83031533.811.333.840034.69.834.650035.49.935.463036.510.336.580037.710.237.7100043.110.243.1125043.610.243.6160045.910.545.920004511.245250045.31245.3315043.611.643.6400043.812.243.8500042.912.642.9630041.112.441.1800036.712.436.71000033.912.733.9125003112.5311600025.911.725.9SPL54.823.954.8N9.30.59.3median 36.5median 12median 36.5Delta7.61.87.641.636.235.645.641.438.637.929.637.136.147.848.141.344.245.134.232.428.231.132.830.429.730.130.928.340.529.725.326.237.628.920.619.818.52931.422.320.41929.432.822.824.717.329.129.526.126.219.128.831.82422.520.730.532.122.722.116.430.730.921.722.21431.935.425.825.412.834.53731.235.812.538.636.425.527.7123837.325.426.311.738.538.924.926.911.940.438.221.923.912.14038.221.323.312.240.436.420.121.412.438.835.718.620.313.13836.117.818.313.138.33416.716.113.336.431.614.814.913.134.530.114.813.913.233.625.116.113.913.628.721.515.413.513.225.317.714.813.112.721.515.113.612.312.117.847.734.136.425.149.76.11.92.20.76.9median 32.8median 21.7median 22.1median 13.1median 34.55.44.45.21.85hearing rangehide median Fan NoiseGigabyte G5 KF5 2024Lenovo LOQ 15IRX9
Gigabyte G5 KF5 2024
NVIDIA GeForce RTX 4060 Laptop GPU, i7-13620H, Gigabyte AG450E1024-SI
Gigabyte G5 KF
NVIDIA GeForce RTX 4060 Laptop GPU, i5-12500H, SSSTC CA6-8D512
Lenovo LOQ 15IRX9
NVIDIA GeForce RTX 4060 Laptop GPU, i5-13450HX, Micron 2400 MTFDKCD1T0QFM
Asus TUF Gaming A15 FA507UV
NVIDIA GeForce RTX 4060 Laptop GPU, R9 8945H, WD PC SN560 SDDPNQE-1T00
Lenovo Legion Pro 5 16IRX9 G9
NVIDIA GeForce RTX 4060 Laptop GPU, i7-14700HX, Samsung PM9A1 MZVL21T0HCLR
Dell Inspiron 16 Plus 7640
NVIDIA GeForce RTX 4060 Laptop GPU, Ultra 7 155H, SK hynix BC901 HFS001TEJ4X164N
Noise
7%
-9%
1%
5%
9%
off / environment *
23
23
-0%
25
-9%
25
-9%
23
-0%
23.8
-3%
Idle Minimum *
23
23
-0%
26
-13%
25
-9%
23
-0%
24.2
-5%
Idle Average *
23
23
-0%
34
-48%
27
-17%
23
-0%
24.2
-5%
Idle Maximum *
27.87
28
-0%
36
-29%
33
-18%
25
10%
24.2
13%
Load Average *
54.82
29.94
45%
48
12%
40
27%
45.18
18%
28.9
47%
Cyberpunk 2077 ultra *
54.82
48
12%
45
18%
52.69
4%
Load Maximum *
54.82
55.5
-1%
50
9%
46
16%
53.13
3%
51
7%
Witcher 3 ultra *
55.05
51

* ... smaller is better

Temperature

Despite the rather loud fans under stress, the surface temperatures are by no means low. We measured a hot spot of up to 67 °C on the underside, centrally towards the display. This is a little too much for our taste. Unfortunately, Gigabyte has failed to optimize the equally hot predecessor here.

The GPU temperature rises to 88 °C in both the stress and gaming tests. The CPU temperature is even worse: While it is already between 76 - 82 °C in the stress test, it continuously rises to up to 100 °C in gaming and doesn't drop any further. This is anything but ideal for the durability of the hardware! At the same time, it explains the continuous drop in fps in Cyberpunk 2077 shown above.

CPU temperature rises to 100 °C during gaming!
Max. Load
 45 °C
113 F
50 °C
122 F
39 °C
102 F
 
 41 °C
106 F
41 °C
106 F
32 °C
90 F
 
 25 °C
77 F
33 °C
91 F
27 °C
81 F
 
Maximum: 50 °C = 122 F
Average: 37 °C = 99 F
44 °C
111 F
66 °C
151 F
53 °C
127 F
31 °C
88 F
39 °C
102 F
28 °C
82 F
29 °C
84 F
24 °C
75 F
23 °C
73 F
Maximum: 66 °C = 151 F
Average: 37.4 °C = 99 F
Power Supply (max.)  56 °C = 133 F | Room Temperature 18.5 °C = 65 F | Fluke t3000FC (calibrated), Fluke 62 Mini
(±) The average temperature for the upper side under maximal load is 37 °C / 99 F, compared to the average of 33.9 °C / 93 F for the devices in the class Gaming.
(-) The maximum temperature on the upper side is 50 °C / 122 F, compared to the average of 40.5 °C / 105 F, ranging from 21.2 to 68.8 °C for the class Gaming.
(-) The bottom heats up to a maximum of 66 °C / 151 F, compared to the average of 43.3 °C / 110 F
(+) In idle usage, the average temperature for the upper side is 27.9 °C / 82 F, compared to the device average of 33.9 °C / 93 F.
(±) 3: The average temperature for the upper side is 36.8 °C / 98 F, compared to the average of 33.9 °C / 93 F for the class Gaming.
(+) The palmrests and touchpad are reaching skin temperature as a maximum (33 °C / 91.4 F) and are therefore not hot.
(-) The average temperature of the palmrest area of similar devices was 28.9 °C / 84 F (-4.1 °C / -7.4 F).
Gigabyte G5 KF5 2024
Intel Core i7-13620H, NVIDIA GeForce RTX 4060 Laptop GPU
Gigabyte G5 KF
Intel Core i5-12500H, NVIDIA GeForce RTX 4060 Laptop GPU
Lenovo LOQ 15IRX9
Intel Core i5-13450HX, NVIDIA GeForce RTX 4060 Laptop GPU
Asus TUF Gaming A15 FA507UV
AMD Ryzen 9 8945H, NVIDIA GeForce RTX 4060 Laptop GPU
Lenovo Legion Pro 5 16IRX9 G9
Intel Core i7-14700HX, NVIDIA GeForce RTX 4060 Laptop GPU
Dell Inspiron 16 Plus 7640
Intel Core Ultra 7 155H, NVIDIA GeForce RTX 4060 Laptop GPU
Heat
-1%
5%
8%
-1%
15%
Maximum Upper Side *
50
54
-8%
47
6%
53
-6%
50
-0%
43.4
13%
Maximum Bottom *
66
61
8%
58
12%
46
30%
57
14%
41.6
37%
Idle Upper Side *
32
34
-6%
32
-0%
32
-0%
36
-13%
32.8
-3%
Idle Bottom *
37
36
3%
36
3%
34
8%
39
-5%
32.4
12%

* ... smaller is better

Speaker

The two stereo speakers are located on the sides towards the front and radiate downwards. They are not particularly loud and lack a lot of bass, although there are linear trebles. We recommend connecting headphones to the audio jack when gaming.

dB(A) 0102030405060708090Deep BassMiddle BassHigh BassLower RangeMidsHigher MidsLower HighsMid HighsUpper HighsSuper Highs2027.634.827.62524.225.324.23125.826.525.84021.620.821.65022.723.222.76324.628.224.68017.418.517.410020.422.220.412519.114.819.116018.313.918.320028.721.228.725037.714.837.731547.111.347.1400539.85350057.29.957.263058.210.358.280068.610.268.610007110.271125059.410.259.4160070.510.570.520007311.273250071.21271.2315066.611.666.6400067.212.267.2500063.312.663.3630059.312.459.3800059.512.459.51000054.712.754.7125004812.5481600047.511.747.5SPL79.823.979.8N41.10.541.1median 58.2median 12median 58.2Delta12.91.812.945.63937.135.844.251.331.134.430.931.326.234.518.529.2193617.343.719.147.920.75216.458.31458.412.861.712.566.61267.811.767.311.966.912.163.712.263.712.464.913.16413.16013.358.513.166.313.271.813.677.113.272.712.768.812.167.425.180.70.747.7median 13.1median 641.85.3hearing rangehide median Pink NoiseGigabyte G5 KF5 2024Lenovo LOQ 15IRX9
Frequency diagram (checkboxes can be checked and unchecked to compare devices)
Gigabyte G5 KF5 2024 audio analysis

(±) | speaker loudness is average but good (79.8 dB)
Bass 100 - 315 Hz
(-) | nearly no bass - on average 29.6% lower than median
(±) | linearity of bass is average (12.3% delta to prev. frequency)
Mids 400 - 2000 Hz
(±) | higher mids - on average 7.2% higher than median
(±) | linearity of mids is average (13.3% delta to prev. frequency)
Highs 2 - 16 kHz
(±) | higher highs - on average 5.9% higher than median
(+) | highs are linear (6.1% delta to prev. frequency)
Overall 100 - 16.000 Hz
(±) | linearity of overall sound is average (29.1% difference to median)
Compared to same class
» 94% of all tested devices in this class were better, 2% similar, 4% worse
» The best had a delta of 6%, average was 18%, worst was 132%
Compared to all devices tested
» 86% of all tested devices were better, 2% similar, 11% worse
» The best had a delta of 4%, average was 24%, worst was 134%

Lenovo LOQ 15IRX9 audio analysis

(±) | speaker loudness is average but good (81 dB)
Bass 100 - 315 Hz
(±) | reduced bass - on average 14.6% lower than median
(±) | linearity of bass is average (9.6% delta to prev. frequency)
Mids 400 - 2000 Hz
(+) | balanced mids - only 2.1% away from median
(+) | mids are linear (3.6% delta to prev. frequency)
Highs 2 - 16 kHz
(±) | higher highs - on average 5.9% higher than median
(±) | linearity of highs is average (8.2% delta to prev. frequency)
Overall 100 - 16.000 Hz
(+) | overall sound is linear (14.7% difference to median)
Compared to same class
» 28% of all tested devices in this class were better, 7% similar, 65% worse
» The best had a delta of 6%, average was 18%, worst was 132%
Compared to all devices tested
» 18% of all tested devices were better, 4% similar, 78% worse
» The best had a delta of 4%, average was 24%, worst was 134%

Power consumption

In energy-saving mode, the idle consumption is only 5.2 W. In the other performance profiles, however, the consumption jumps up to around 20 W.

In gaming (Cyberpunk 2077), we measured an average consumption of 144 W. Up to 165 W is recorded for short periods in the stress test. The small power supply unit (approx. 13.6 x 6.7 x 2.3 cm (L x W x H)) is designed for 150 W and should be able to cope with all measured average consumptions and absorb the short peaks. However, there is not much room left for charging during demanding gaming sessions.

Power Consumption
Off / Standbydarklight 0.1 / 1 Watt
Idledarkmidlight 5.2 / 19.6 / 23 Watt
Load midlight 84 / 165 Watt
 color bar
Key: min: dark, med: mid, max: light        Metrahit Energy

Energieaufnahme Cyberpunk / Stresstest

0102030405060708090100110120130140150160Tooltip
Gigabyte G5 KF5 2024; 1280x720 Prime95 28.10 and Furmark 1.25: Ø141.1 (137.37-165.27)
Gigabyte G5 KF5 2024; Idle 150cd/m2: Ø21.7 (20.81-27.463)
Gigabyte G5 KF5 2024; Cyberpunk 2077 FHD ultra no FSR 150cd: Ø143.9 (137.73-151.57)

Power consumption with the external monitor

0102030405060708090100110120130140Tooltip
Gigabyte G5 KF5 2024; Prime95 V2810 Stress (external Monitor): Ø111.5 (97.03-142.09)
Gigabyte G5 KF5 2024; Cinebench R15 Multi (external Monitor): Ø125.6 (119.31-140.51)
Gigabyte G5 KF5 2024; Cinebench R23 Multi (external Monitor): Ø128.4 (110.8-142.44)
Gigabyte G5 KF5 2024; 1280x720 FurMark 1.19 GPU Stress Test (external Monitor): Ø125.5 (119.52-130.45)
Gigabyte G5 KF5 2024; Idle 1min (external Monitor): Ø19.2 (18.333-20.862)
Gigabyte G5 KF5 2024; Cyberpunk 2077 FHD ultra no FSR (external Monitor): Ø144 (140.8-147.04)

Battery life

The low price is also reflected in the battery capacity of just 54 Wh. The listed competition has 60 to 90 Wh to offer. Nevertheless, our G5 performs quite well in terms of battery life, especially in comparison to the LOQ 15 (60 Wh) and the Legion Pro 5 (80 Wh), where it can even achieve better WiFi (5.5 to 7h) and video runtimes (6h).

Battery Runtime
WiFi Websurfing
7h 15min
WiFi Websurfing max. Brightness
5h 23min
Big Buck Bunny H.264 1080p
6h 03min
Load (maximum brightness)
1h 05min
Gigabyte G5 KF5 2024
i7-13620H, NVIDIA GeForce RTX 4060 Laptop GPU, 54 Wh
Gigabyte G5 KF
i5-12500H, NVIDIA GeForce RTX 4060 Laptop GPU, 54 Wh
Lenovo LOQ 15IRX9
i5-13450HX, NVIDIA GeForce RTX 4060 Laptop GPU, 60 Wh
Asus TUF Gaming A15 FA507UV
R9 8945H, NVIDIA GeForce RTX 4060 Laptop GPU, 90 Wh
Lenovo Legion Pro 5 16IRX9 G9
i7-14700HX, NVIDIA GeForce RTX 4060 Laptop GPU, 80 Wh
Dell Inspiron 16 Plus 7640
Ultra 7 155H, NVIDIA GeForce RTX 4060 Laptop GPU, 90 Wh
Average of class Gaming
 
Battery Runtime
-3%
-26%
61%
6%
84%
16%
H.264
363
268
-26%
312
-14%
WiFi v1.3
435
316
-27%
320
-26%
702
61%
308
-29%
799
84%
Load
65
94
45%
105
62%
Reader / Idle
514

Notebookcheck overall rating

An RTX 4060 laptop for 899 euros: Despite some compromises such as a 720p webcam and the lack of a Thunderbolt port, the Gigabyte G5 impresses with its solid design, good keyboard, and high color accuracy of the display. However, its cooling system appears to be too weak, which prevents us from recommending it for purchase.

Gigabyte G5 KF5 2024 - 10/17/2024 v8
Christian Hintze

Chassis
73 / 98 → 75%
Keyboard
84%
Pointing Device
82%
Connectivity
61 / 80 → 77%
Weight
63 / 10-68 → 91%
Battery
76 / 95 → 79%
Display
81%
Games Performance
73%
Application Performance
84%
AI Performance
94%
Temperature
75 / 95 → 79%
Noise
67 / 90 → 75%
Audio
60%
Camera
24 / 75 → 32%
Average
57%
76%
Gaming - Weighted Average
CO2 Emissions
No Data
Materials
0%
Packaging
15%
Power Use
77.1%
Repairability
50%
Software Updates
22.3%
Recycle Logo Total Sustainability Score: 27.4%

Transparency

The selection of devices to be reviewed is made by our editorial team. The test sample was provided to the author as a loan by the manufacturer or retailer for the purpose of this review. The lender had no influence on this review, nor did the manufacturer receive a copy of this review before publication. There was no obligation to publish this review. We never accept compensation or payment in return for our reviews. As an independent media company, Notebookcheck is not subjected to the authority of manufacturers, retailers or publishers.

This is how Notebookcheck is testing

Every year, Notebookcheck independently reviews hundreds of laptops and smartphones using standardized procedures to ensure that all results are comparable. We have continuously developed our test methods for around 20 years and set industry standards in the process. In our test labs, high-quality measuring equipment is utilized by experienced technicians and editors. These tests involve a multi-stage validation process. Our complex rating system is based on hundreds of well-founded measurements and benchmarks, which maintains objectivity. Further information on our test methods can be found here.

Read all 1 comments / answer
static version load dynamic
Loading Comments
Comment on this article
Please share our article, every link counts!
Mail Logo
> Expert Reviews and News on Laptops, Smartphones and Tech Innovations > Reviews > Gigabyte G5 KF5 2024 laptop review: RTX 4060 gaming at a bargain price - is the deal worth it?
Christian Hintze, 2024-10-23 (Update: 2024-11-11)