Notebookcheck Logo

Intel Core i7-12700 vs Qualcomm Snapdragon 8 Gen 1 vs Intel Core i7-12700F

Intel Core i7-12700

► remove from comparison Intel i7-12700

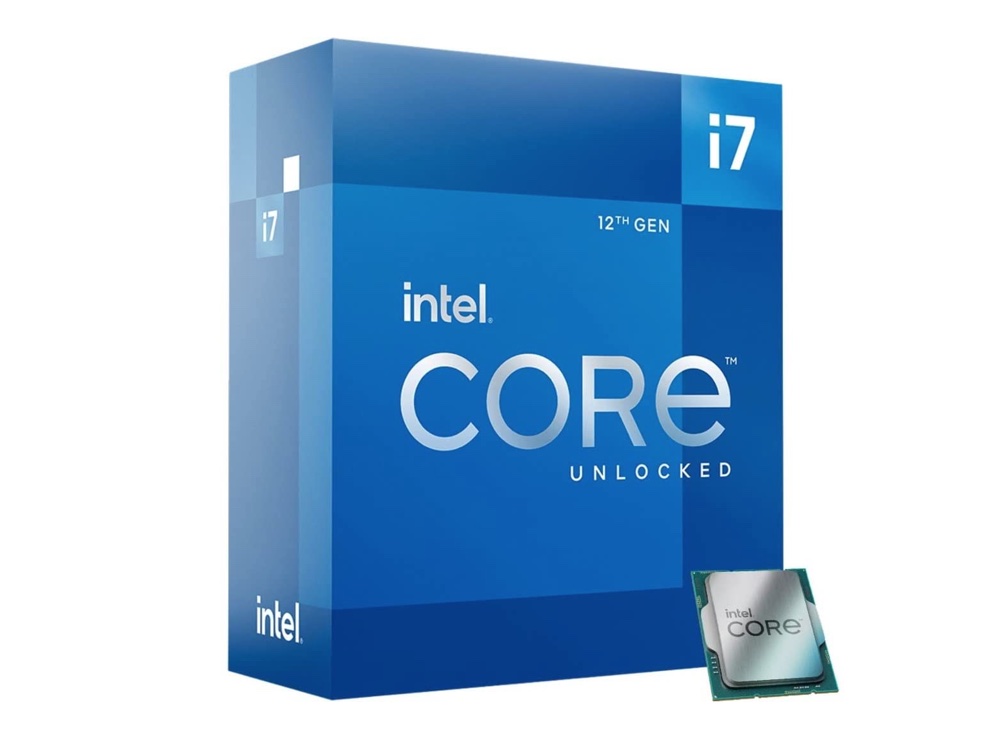
The Intel Core i7-12700F is a fast eight-core desktop processor based on the Alder Lake architecture, which was introduced in November 2021. The processor offers a base clock of 3.3 GHz and reaches up to 4.9 GHz in Turbo. In the same way, the Intel Core i7-12700K the Core i7-12700F is based on a hybrid architecture of 8P and 4E cores. The innovations of the Alder Lake-S processor compared to Rocket Lake, together with the smaller 10 nm manufacturing process, are clearly noticeable. The Intel Core i7-12700 does not offer a free multiplier, which means that overclocking is not possible.

Performance

Compared to the Intel Core i7-11700 , performance has been increased with a better IPC. The additional e-cores are also clearly noticeable in multi-threaded applications. Overall, this provides a noticeable performance boost, which also has an effect on all application areas. The 4 E-Cores provide the P-Cores with significantly more power. If all requirements are met, Intel Turbo Boost 3.0can increase the clock rate of the P-Cores to up to 4.9 GHz. The E-cores also offer a turbo and clock up to 3.6 GHz.

Graphics unit

The Intel Core i7-12700 is a processor with an integrated graphics unit. However, with the Intel UHD Graphics 770 there is only a simple iGPU which is only suitable for office use.

Power consumption

The TDP of the Intel Core i7-12700 is 65 watts, with the option to consume up to 180 watts in Turbo mode. If all restrictions are deactivated in the BIOS, the PL2 value can be achieved permanently. However, a high-quality and powerful cooling unit should be used for this.

Qualcomm Snapdragon 8 Gen 1

► remove from comparison Qualcomm SD 8 Gen 1

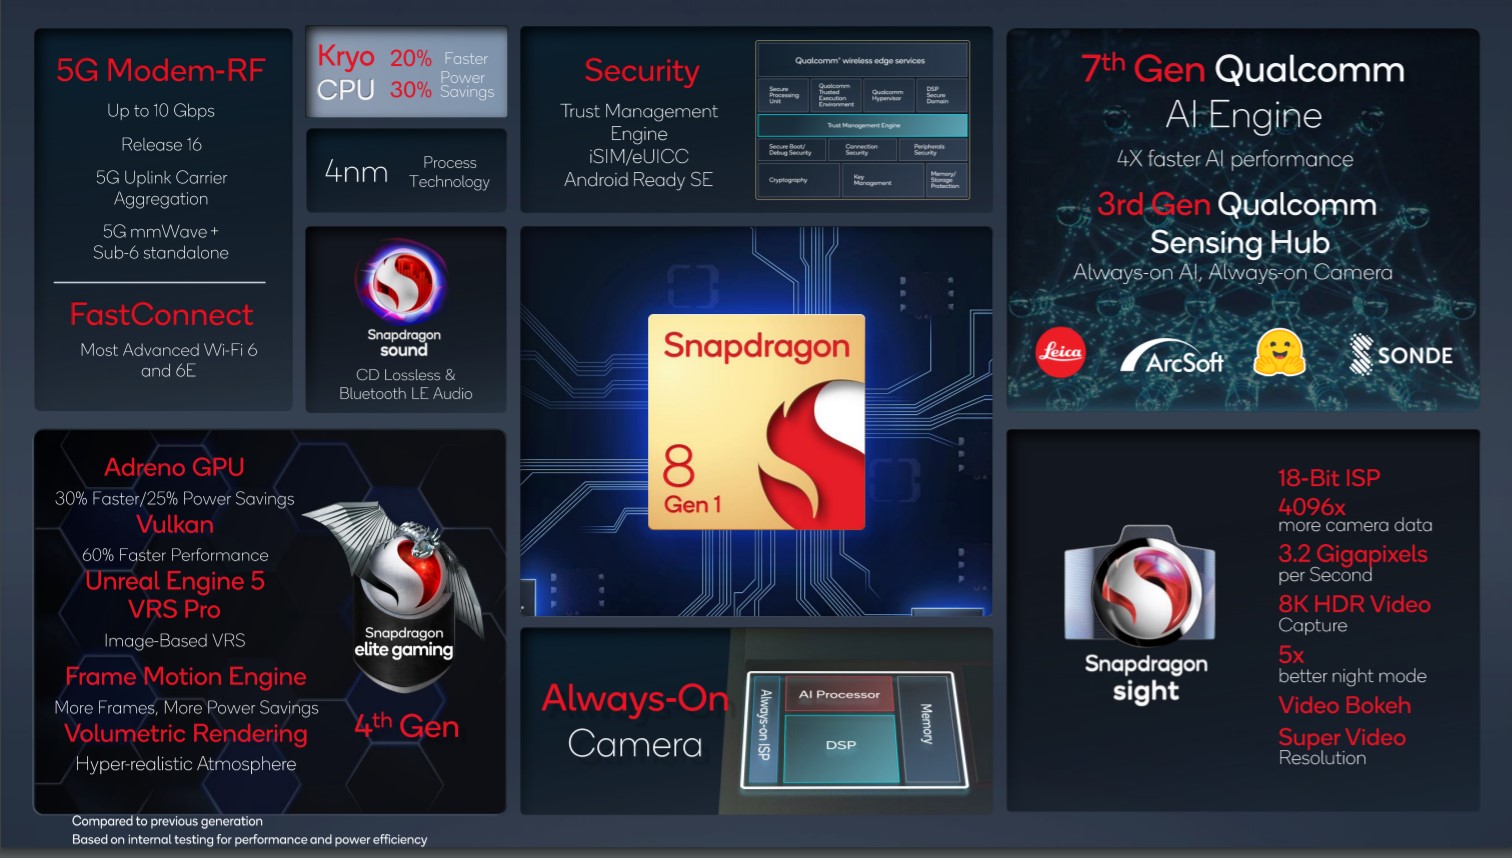
The Qualcomm Snapdragon 8 Gen 1 Mobile Platform is a high-end SoC for smartphones that was introduced in late 2021 and manufactured in 4 nm at Samsung. Integrates one “Prime Core” based on a ARM Cortex-X2 architecture clocked at up to 3 GHz. Three more performance cores are based on the Cortex-A710 but clocked up to 2.5 GHz. Furthermore, four energy saving cores are integrated that are based on the ARM Cortex-A510 architecture and clocked at up to 1.8 GHz. All cores can use the shared 6 MB level 3 cache.

Compared to the Snapdragon 888 (Plus), the CPU part gains 20% performance and 30% power savings according to Qualcomm. This means that the Snapdragon 8 Gen 1 is the fastest CPU for Android based smartphones and should be positioned between the Apple A13 and A14 CPU.

The integrated AI Engine can offer up to 4x faster AI performance thanks to the bigger Tensor engine. The 18-Bit-Spectra-ISP also saw some big improvements and is now called Snapdragon Sight.

The integrated Adreno 730 offers a 30% graphics boost compared to the previous Adreno 660.

The integrated Snapdragon X65 5G modem is also new and offers faster transfer rates (up to 10 Gbps download and 3 Gbps upload). The FastConnect 6900 offers support for the current Wifi 6E and Bluetooth 5.2.

Intel Core i7-12700F

► remove from comparison Intel i7-12700F

The Intel Core i7-12700F is a high end CPU for desktops based on the Alder Lake architecture. It was first announced in November 2021 and offers 8 performance cores and 4 efficiency cores. The performance cores (P-cores) support HyperThreading, leading to 20 threads that can be processed at once. The performance cores can clock with up to 4.9 GHz (Turbo Boost Max 3.0, 2.1 base), the efficiency cores can clock with up to 3.6 GHz (1.6 GHz base). All cores can use 25 MB Smart Cache. The integrated memory controller supports up to 128 GB DDR5 with 4800 MT/s (dual channel).

The Thread Director (in hardware) can support the operating system to decide which thread to use on the performance or efficiency cores for the best performance.

For AI tasks, the CPU also integrates GNA 3.0 and DL Boost. Quick Sync in version 8 is the same as in the Rocket Lake CPUs and supports MPEG-2, AVC, VC-1 decode, JPEG, VP8 decode, VP9, HEVC and AV1 decode in hardware.

The F-series desktop models don't offer an integrated graphics card.

The CPU is rated at 65 W base power and 180 Watt maximum Turbo power. It is manufactured in 10nm, called Intel 7, process at Intel.

ModelIntel Core i7-12700Qualcomm Snapdragon 8 Gen 1Intel Core i7-12700F
CodenameAlder LakeCortex-X2 / A710 / A510 (Kryo) WaipioAlder Lake
SeriesIntel Alder Lake-SQualcomm Snapdragon 8Intel Alder Lake-S
Series: Alder Lake-S Alder Lake
Intel Core i9-12900K3.2 - 5.2 GHz16 / 24 cores30 MB L3
Intel Core i9-129002.4 - 5.1 GHz16 / 24 cores20 MB L3
Intel Core i7-12700K2.7 - 5 GHz12 / 20 cores25 MB L3
Intel Core i7-12700F3.3 - 4.9 GHz12 / 20 cores25 MB L3
Intel Core i7-12700 « 3.3 - 4.9 GHz12 / 20 cores25 MB L3
Intel Core i5-12600K2.8 - 4.9 GHz10 / 16 cores20 MB L3
Qualcomm Snapdragon 8+ Gen 11.8 - 3.2 GHz8 / 8 cores6 MB L3
Qualcomm Snapdragon 8 Gen 1 « 1.8 - 3 GHz8 / 8 cores6 MB L3
Intel Core i9-12900K3.2 - 5.2 GHz16 / 24 cores30 MB L3
Intel Core i9-129002.4 - 5.1 GHz16 / 24 cores20 MB L3
Intel Core i7-12700K2.7 - 5 GHz12 / 20 cores25 MB L3
Intel Core i7-12700F « 3.3 - 4.9 GHz12 / 20 cores25 MB L3
Intel Core i7-127003.3 - 4.9 GHz12 / 20 cores25 MB L3
Intel Core i5-12600K2.8 - 4.9 GHz10 / 16 cores20 MB L3
Clock3300 - 4900 MHz1800 - 2995 MHz3300 - 4900 MHz
L1 Cache1 MB1 MB
L2 Cache12 MB12 MB
L3 Cache25 MB6 MB25 MB
Cores / Threads12 / 208 / 8
1 x 3.0 GHz ARM Cortex-X2
3 x 2.5 GHz ARM Cortex-A710
4 x 1.8 GHz ARM Cortex-A510
12 / 20
TDP65 Watt65 Watt
Technology10 nm4 nm10 nm
Die Size215 mm2215 mm2
max. Temp.100 °C100 °C
SocketLGA 1700LGA 1700
iGPUIntel UHD Graphics 770 (300 - 1500 MHz)Qualcomm Adreno 730
Architecturex86ARM v9x86
$349 U.S.$386 U.S.
Announced
Manufacturerwww.intel.de
FeaturesAdreno 730 GPU, Spectra ISP, Hexagon, X65 5G Modem, FastConnect 6900 WiFi, LPDDR5-6400 Memory Controller

Benchmarks

Performance Rating - CB R15 + R20 + 7-Zip + X265 + Blender + 3DM11 CPU - i7-12700
41.2 pt (69%)
Restrict / Search: Model: Max. age: years
Performance Rating - CB R15 + R20 + 7-Zip + X265 + Blender + 3DM11 CPU - i7-12700F
39.8 pt (66%)
Restrict / Search: Model: Max. age: years
Cinebench R23 - Cinebench R23 Multi Core
21751 Points (20%)
15291 Points (14%)
Cinebench R23 - Cinebench R23 Single Core
1894 Points (80%)
1898 Points (80%)
Cinebench R20 - Cinebench R20 CPU (Single Core)
731 Points (80%)
726 Points (79%)
Cinebench R20 - Cinebench R20 CPU (Multi Core)
8338 Points (20%)
5786 Points (14%)
Cinebench R15 - Cinebench R15 CPU Multi 64 Bit
3151 Points (20%)
2610 Points (16%)
Cinebench R15 - Cinebench R15 CPU Single 64 Bit
272 Points (75%)
271 Points (75%)
Cinebench R11.5 - Cinebench R11.5 CPU Multi 64 Bit
36.9 Points (48%)
33.5 Points (43%)
Cinebench R11.5 - Cinebench R11.5 CPU Single 64 Bit
3.3 Points (78%)
3.3 Points (78%)
Cinebench R10 - Cinebench R10 Rend. Single (32bit)
9171 Points (55%)
9146 Points (55%)
Cinebench R10 - Cinebench R10 Rend. Multi (32bit)
60892 Points (44%)
56067 Points (41%)
Cinebench R10 - Cinebench R10 Rend. Multi (64bit)
103354 Points (66%)
93400 Points (60%)
Cinebench R10 - Cinebench R10 Rend. Single (64bit)
15091 Points (18%)
15176 Points (18%)
wPrime 2.10 - wPrime 2.0 1024m *
272.8 s (3%)
128.3 s (2%)
wPrime 2.10 - wPrime 2.0 32m *
2.9 s (1%)
3 s (1%)
WinRAR - WinRAR 4.0
9328 Points (15%)
8695 Points (14%)
7-Zip 18.03 - 7-Zip 18.03 Multi Thread 4 runs
78331 MIPS (45%)
61218 MIPS (35%)
7-Zip 18.03 - 7-Zip 18.03 Single Thread 4 runs
6292 MIPS (74%)
6145 MIPS (72%)
X264 HD Benchmark 4.0 - x264 Pass 2
172.4 fps (58%)
118.6 fps (40%)
X264 HD Benchmark 4.0 - x264 Pass 1
347 fps (80%)
296.5 fps (68%)
HWBOT x265 Benchmark v2.2 - HWBOT x265 4k Preset
25.5 fps (45%)
17.7 fps (31%)
TrueCrypt - TrueCrypt Serpent
1.5 GB/s (44%)
1.5 GB/s (44%)
TrueCrypt - TrueCrypt Twofish
2.7 GB/s (47%)
2.8 GB/s (48%)
TrueCrypt - TrueCrypt AES
14.5 GB/s (38%)
3.3 GB/s (9%)
Blender - Blender 3.3 Classroom CPU *
242 Seconds (3%)
Blender - Blender 2.79 BMW27 CPU *
151 Seconds (1%)
212 Seconds (1%)
R Benchmark 2.5 - R Benchmark 2.5 *
0.4 sec (9%)
0.4 sec (9%)
3DMark 06 - CPU - 3DMark 06 - CPU
15390 Points (33%)
15823 Points (34%)
Super Pi mod 1.5 XS 1M - Super Pi mod 1.5 XS 1M *
7.5 s (2%)
7.4 s (2%)
Super Pi mod 1.5 XS 2M - Super Pi mod 1.5 XS 2M *
16.8 s (1%)
16.5 s (1%)
Super Pi Mod 1.5 XS 32M - Super Pi mod 1.5 XS 32M *
400.4 s (2%)
386.3 s (2%)
3DMark Vantage - 3DM Vant. Perf. CPU no Physx
72464 Points (56%)
66554 Points (51%)
3DMark 11 - 3DM11 Performance Physics
27022 Points (67%)
23748 Points (58%)
3DMark - 3DMark Ice Storm Physics
86815 Points (71%)
81273 Points (66%)
3DMark - 3DMark Ice Storm Extreme Physics
86587 Points (70%)
77233 Points (63%)
3DMark - 3DMark Ice Storm Unlimited Physics
96264 Points (80%)
79448 Points (66%)
3DMark - 3DMark Cloud Gate Physics
23193 Points (59%)
17840 Points (45%)
3DMark - 3DMark Fire Strike Standard Physics
34681 Points (62%)
31106 Points (55%)
3DMark - 3DMark Time Spy CPU
16400 Points (69%)
11521 Points (49%)
Geekbench 6.4 - Geekbench 6.4 Single-Core
1610 Points (40%)
Geekbench 6.4 - Geekbench 6.4 Multi-Core
3860 Points (15%)
Geekbench 5.5 - Geekbench 5.1 - 5.5 64 Bit Single-Core
1924 Points (75%)
1590 Points (62%)
Geekbench 5.5 - Geekbench 5.1 - 5.5 64 Bit Multi-Core
14961 Points (27%)
10126 Points (18%)
Geekbench 5.0 - Geekbench 5.0 64 Bit Single-Core
1845 Points (8%)
1557 Points (7%)
Geekbench 5.0 - Geekbench 5.0 64 Bit Multi-Core
14883 Points (47%)
10249 Points (32%)
Geekbench 4.4 - Geekbench 4.1 - 4.4 64 Bit Single-Core
8059 Points (80%)
min: 6273     avg: 6608     median: 6668 (67%)     max: 6984 Points
6698 Points (67%)
Geekbench 4.4 - Geekbench 4.1 - 4.4 64 Bit Multi-Core
52676 Points (53%)
min: 14289     avg: 15053     median: 15021 (15%)     max: 15948 Points
39852 Points (40%)
Geekbench 4.0 - Geekbench 4.0 64 Bit Single-Core
5038 Points (56%)
Geekbench 4.0 - Geekbench 4.0 64 Bit Multi-Core
13465 Points (19%)
Geekbench 3 - Geekbench 3 64 Bit Multi-Core
7296 Points (11%)
Geekbench 3 - Geekbench 3 64 Bit Single-Core
3017 Points (45%)
Geekbench 2 - 32 Bit - Geekbench Stream
4412 Points (36%)
Geekbench 2 - 32 Bit - Geekbench Memory
8709 Points (79%)
Geekbench 2 - 32 Bit - Geekbench Floating Point
12775 Points (25%)
Geekbench 2 - 32 Bit - Geekbench Integer
5715 Points (12%)
Geekbench 2 - 32 Bit - Geekbench Total Score
8654 Points (23%)
Mozilla Kraken 1.1 - Kraken 1.1 Total Score *
508 ms (1%)
min: 813.5     avg: 1010     median: 897.3 (1%)     max: 1440.1 ms
522 ms (1%)
Sunspider - Sunspider 1.0 Total Score *
302.5 ms (3%)
Octane V2 - Octane V2 Total Score
min: 27730     avg: 42391     median: 45945 (35%)     max: 50626 Points
94804 Points (72%)
WebXPRT 4 - WebXPRT 4 Score
268 Points (74%)
min: 68     avg: 93     median: 92.5 (25%)     max: 119 Points
271 Points (74%)
WebXPRT 3 - WebXPRT 3 Score
314 Points (56%)
min: 79     avg: 142.9     median: 151 (27%)     max: 193 Points
281 Points (50%)
PCMark for Android - PCM f. Android Storage 2.0 random write internal
min: 36.15     avg: 47.6     median: 43.5 (30%)     max: 69.62 MB/s
PCMark for Android - PCM f. Android Storage 2.0 seq write internal
min: 831     avg: 1096     median: 1169.1 (33%)     max: 1193.1 MB/s
PCMark for Android - PCM f. Android Storage 2.0 random read internal
min: 29.04     avg: 32.6     median: 30.1 (15%)     max: 42.71 MB/s
PCMark for Android - PCM f. Android Storage 2.0 seq read internal
min: 1283     avg: 1482     median: 1526.6 (42%)     max: 1662.25 MB/s
PCMark for Android - PCM f. Android Storage 2.0 score
min: 19708     avg: 30794     median: 30302 (13%)     max: 44918 Points
PCMark for Android - PCM f. Android Work Score 2.0
min: 11351     avg: 11629     median: 11628.5 (76%)     max: 11906 Points
CrossMark - CrossMark Overall
2016 Points (75%)
1841 Points (69%)
Power Consumption - Prime95 Power Consumption - external Monitor *
327 Watt (56%)
114.6 Watt (20%)
Power Consumption - Cinebench R15 Multi Power Consumption - external Monitor *
284 Watt (52%)
127.6 Watt (23%)
Power Consumption - Idle Power Consumption - external Monitor *
82.7 Watt (55%)
29.7 Watt (20%)
Power Consumption - Power Efficiency - Cinebench R15 Multi external Monitor
20.5 Points per Watt (15%)

Average Benchmarks Intel Core i7-12700 → 100% n=8

Average Benchmarks Qualcomm Snapdragon 8 Gen 1 → 49% n=8

Average Benchmarks Intel Core i7-12700F → 86% n=8

- Range of benchmark values for this graphics card
red legend - Average benchmark values for this graphics card
* Smaller numbers mean a higher performance
1 This benchmark is not used for the average calculation

v1.33
log 16. 22:07:59

#0 ran 0s before starting gpusingle class +0s ... 0s

#1 checking url part for id 14995 +0s ... 0s

#2 checking url part for id 14029 +0s ... 0s

#3 checking url part for id 14604 +0s ... 0s

#4 redirected to Ajax server, took 1752696479s time from redirect:0 +0s ... 0s

#5 did not recreate cache, as it is less than 5 days old! Created at Wed, 16 Jul 2025 05:20:08 +0200 +0s ... 0s

#6 composed specs +0.005s ... 0.005s

#7 did output specs +0s ... 0.005s

#8 getting avg benchmarks for device 14995 +0.004s ... 0.009s

#9 got single benchmarks 14995 +0.005s ... 0.014s

#10 getting avg benchmarks for device 14029 +0.001s ... 0.015s

#11 got single benchmarks 14029 +0.015s ... 0.03s

#12 getting avg benchmarks for device 14604 +0.004s ... 0.034s

#13 got single benchmarks 14604 +0.004s ... 0.038s

#14 got avg benchmarks for devices +0s ... 0.038s

#15 min, max, avg, median took s +0.06s ... 0.098s

#16 return log +0s ... 0.098s

Please share our article, every link counts!
Mail Logo
> Expert Reviews and News on Laptops, Smartphones and Tech Innovations > Benchmarks / Tech > Processor Comparison - Head 2 Head
Redaktion, 2017-09- 8 (Update: 2023-07- 1)