

NVIDIA Tegra X1 Maxwell GPU vs Qualcomm Adreno 690 vs Qualcomm Adreno 643
NVIDIA Tegra X1 Maxwell GPU
► remove from comparison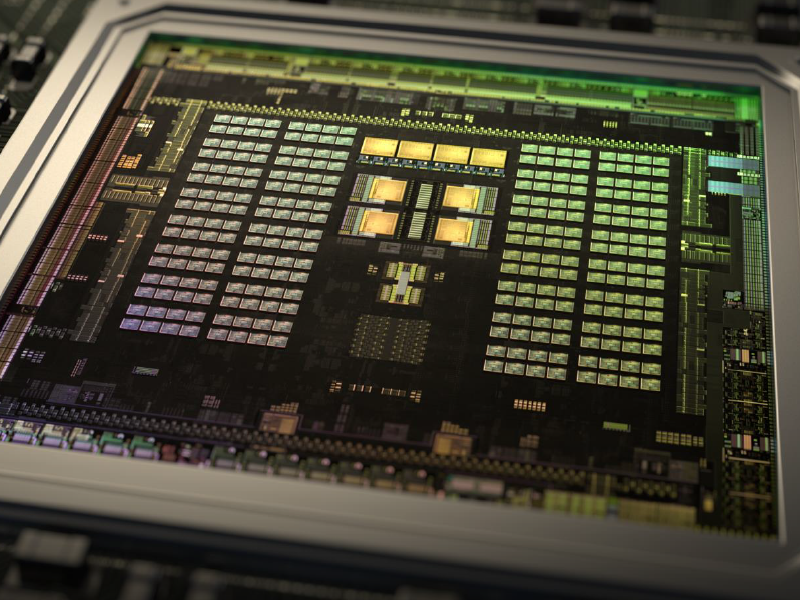
The NVIDIA Tegra X1 Maxwell GPU is an integrated graphics card in the NVIDIA Tegra X1 SoC for (mostly Android based) tablets. It is the successor of the Tegra K1 GPU and based on the Maxwell architecture. It offers the same features as the laptop and desktop Maxwell based products like OpenGL 4.5, CUDA 6.0, OpenGL ES 3.1 and DirectX 11.2. The GPU offers 256 shader cores (2 SMMs) and clocks at up to 1000 MHz. The memory interface offers a maximum bandwidth of 25.6 GB/s (2x 32 Bit LPDDR4-3200).
First benchmarks of the Tegra X1 graphics card using GLBench show twice as high scores as the PowerVR GXA6850 in the Apple A8X. Therefore, the X1 should be the fastest GPU for Android based devices that should not struggle with high end Android games in high resolutions.
The improved video part of the SoC is able to en- and decode 4K videos in H.265 according to Nvidia (decoding at 60fps, encoding at 30fps). Thanks to HDMI 2.0 support, the 4K60 material can be transmitted to external displays (2 displays in parallel at max). The integrated dual ISP is able to drive up to 6 cameras (max. 100 MP, 4096 focus points) at once.
The power consumption of the whole SoC should be rather big compared to other ARM based SoCs. Therefore, Tegra X1 based smartphones are unlikely. As the Tegra K1, the X1 will be most likely seen in tablets with good cooling solutions. Similar to the Apple A8X, the Tegra X1 is manufactured in 20nm.
Qualcomm Adreno 690
► remove from comparison
The Qualcomm Adreno 690 is an integrated graphics card in the Qualcomm Snapdragon 8cx Gen 3 SoC for Windows laptops. According to Qualcomm, the 690 is up to 60% faster than the previous generation. In our tests with the Lenovo ThinkPad X13s, the Adreno 690 was only on par with a low en Intel UHD Graphics iGPU and not well suited for 3D games.
The chip is manufactured in 5nm at Samsung (5LPE) and suited for fanless laptops.
Qualcomm Adreno 643
► remove from comparison
The Qualcomm Adreno 643 is an integrated graphics unit (iGPU) that is used in the Qualcomm QCM6490 and QCS6490. The SoC is not only intended for use in Android-based smartphones and tablets, but also for IoT products with Linux, Ubuntu or Windows 11 IoT Enterprise. In the QCM6490 and QCS6490 the 643 clocks at 812 MHz.
| NVIDIA Tegra X1 Maxwell GPU | Qualcomm Adreno 690 | Qualcomm Adreno 643 | |||||||||||||||||||||||||||||||||||||||||||||||||||||||||||||||||||||||||||||||||||||||||||||||||||||||||||||||||||
| Codename | Erista | ||||||||||||||||||||||||||||||||||||||||||||||||||||||||||||||||||||||||||||||||||||||||||||||||||||||||||||||||||||
| Architecture | Maxwell | ||||||||||||||||||||||||||||||||||||||||||||||||||||||||||||||||||||||||||||||||||||||||||||||||||||||||||||||||||||
| Pipelines | 256 - unified | ||||||||||||||||||||||||||||||||||||||||||||||||||||||||||||||||||||||||||||||||||||||||||||||||||||||||||||||||||||
| Core Speed | 1000 MHz | 812 MHz | |||||||||||||||||||||||||||||||||||||||||||||||||||||||||||||||||||||||||||||||||||||||||||||||||||||||||||||||||||
| Memory Speed | 3200 MHz | ||||||||||||||||||||||||||||||||||||||||||||||||||||||||||||||||||||||||||||||||||||||||||||||||||||||||||||||||||||
| Memory Bus Width | 64 Bit | ||||||||||||||||||||||||||||||||||||||||||||||||||||||||||||||||||||||||||||||||||||||||||||||||||||||||||||||||||||
| Shared Memory | yes | yes | yes | ||||||||||||||||||||||||||||||||||||||||||||||||||||||||||||||||||||||||||||||||||||||||||||||||||||||||||||||||||
| API | DirectX 11.2, OpenGL 4.5 | DirectX 12 | DirectX 12, OpenGL ES 3.2, OpenCL 2.0, Vulkan 1.x | ||||||||||||||||||||||||||||||||||||||||||||||||||||||||||||||||||||||||||||||||||||||||||||||||||||||||||||||||||
| technology | 20 nm | 5 nm | 6 nm | ||||||||||||||||||||||||||||||||||||||||||||||||||||||||||||||||||||||||||||||||||||||||||||||||||||||||||||||||||
| Features | CUDA 6.0, OpenGL ES 3.1, AEP | OpenGL ES 3.2, OpenCL 2.0, DirectX 12, Vulkan 1.1 | |||||||||||||||||||||||||||||||||||||||||||||||||||||||||||||||||||||||||||||||||||||||||||||||||||||||||||||||||||
| Date of Announcement | 05.01.2015 | 06.12.2018 | 12.08.2021 | ||||||||||||||||||||||||||||||||||||||||||||||||||||||||||||||||||||||||||||||||||||||||||||||||||||||||||||||||||
| Adreno 600 Series |
|
| |||||||||||||||||||||||||||||||||||||||||||||||||||||||||||||||||||||||||||||||||||||||||||||||||||||||||||||||||||
| Power Consumption | 7 Watt |
|
|
| ||||||||||||||||||||||||
Benchmarks
Cinebench R15 OpenGL 64 Bit + Qualcomm Adreno 690

GFXBench T-Rex HD Offscreen C24Z16 + NVIDIA Tegra X1 Maxwell GPU
Average Benchmarks NVIDIA Tegra X1 Maxwell GPU → 0% n=0
Average Benchmarks Qualcomm Adreno 690 → 0% n=0
Average Benchmarks Qualcomm Adreno 643 → 0% n=0
* Smaller numbers mean a higher performance
1 This benchmark is not used for the average calculation
Game Benchmarks
The following benchmarks stem from our benchmarks of review laptops. The performance depends on the used graphics memory, clock rate, processor, system settings, drivers, and operating systems. So the results don't have to be representative for all laptops with this GPU. For detailed information on the benchmark results, click on the fps number.

F1 22
2022


X-Plane 11.11
2018
Dota 2 Reborn
2015
The Witcher 3
2015
Dead Trigger 2
2013| NVIDIA Tegra X1 Maxwell GPU | Qualcomm Adreno 690 | Qualcomm Adreno 643 | |||||||||||||||||||
|---|---|---|---|---|---|---|---|---|---|---|---|---|---|---|---|---|---|---|---|---|---|
| low | med. | high | ultra | QHD | 4K | low | med. | high | ultra | QHD | 4K | low | med. | high | ultra | QHD | 4K | ||||
| F1 22 | 26 | 22.5 | 17 | 12.6 | |||||||||||||||||
| X-Plane 11.11 | 14 | 12 | 11 | ||||||||||||||||||
| Final Fantasy XV Benchmark | 19 | 12.3 | 7.29 | ||||||||||||||||||
| Dota 2 Reborn | 58 | 55 | 44 | 37 | |||||||||||||||||
| The Witcher 3 | 25 | 16 | 10 | 4 | |||||||||||||||||
| GTA V | 29.9 | ||||||||||||||||||||
| NVIDIA Tegra X1 Maxwell GPU | Qualcomm Adreno 690 | Qualcomm Adreno 643 | |||||||||||||||||||
| low | med. | high | ultra | QHD | 4K | low | med. | high | ultra | QHD | 4K | low | med. | high | ultra | QHD | 4K | < 30 fps < 60 fps < 120 fps ≥ 120 fps | | | | | | | < 30 fps < 60 fps < 120 fps ≥ 120 fps | 5 1 | 4 1 | 4 1 | 2 1 | | | < 30 fps < 60 fps < 120 fps ≥ 120 fps | | | | | | |
For more games that might be playable and a list of all games and graphics cards visit our Gaming List