

AMD Ryzen 9 9950X vs Intel Core i7-14700 vs Intel Core i5-14600K
AMD Ryzen 9 9950X
► remove from comparison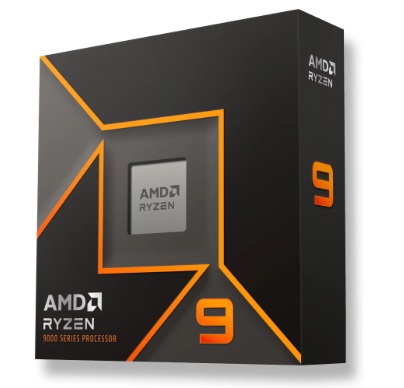
The Ryzen 9 9950X is a very, very powerful desktop CPU of the Granite Ridge product family that features 16 Zen 5 cores (32 threads), PCIe 5 support and a basic iGPU. The Ryzen was launched in June 2024, with sales slated to start in August.
The 9950X shares some of the specifications with the mighty Zen 4-powered Ryzen 9 7950X, including (but not limited to) the 16 MB L2 cache, the 64 MB L3 cache, the 5.7 GHz top clock speed and the 170 W long-term TDP.
Architecture and Features
Just like Strix Point APUs, Granite Ridge processors make use of the new Zen 5 microarchitecture. However, there are no efficient cores here; all of 9950X's cores are full Zen 5 cores. Furthermore, Granite Ridge is a multi-die design with only the CPU cores produced using a fairly modern 4 nm TSMC process. Strix Point processors are a single-die design, from what we know.
According to AMD, Zen 5 delivers a 16% IPC improvement over Zen 4 thanks to branch prediction improvements and other refinements.
Elsewhere, the 9950X has an impressive 64 MB of L3 cache and 24 direct PCIe 5 lanes (3.93 GB/s throughput per lane) with up to 12 additional PCIe 4 lanes available depending on the motherboard. It supports DDR5 RAM as fast as 5,600 MT/s (up to 8,000 MT/s if overclocked).
The 9950X is unlocked for overclocking. Naturally, the AM5 socket CPU supports Windows 11, 64-bit Windows 10 as well as many Linux distros.
Performance
According to early July leaks, its multi-thread performance is about as good as that of the 24-core Core i9-14900K Intel CPU. We'll definitely update this section once we get our hands on a system powered by the 9950X.
Graphics
The Radeon 610M comes equipped with just 128 unified shaders running at up to 2,200 MHz. Its gaming performance is slated to be extremely low and only just sufficient for pre-2020 games in resolutions such as 1024x768.
Power consumption
The CPU cores are built with TSMC's N4P process for good, as of mid 2024, power efficiency. (Apple is the leader in this regard with the second-generation 3 nm process.)
The Ryzen 9's long-term TDP is 170 W. It'll probably consume up to 250 W when under heavy short-term loads. If overclocked, the power consumption figures will increase significantly.
Intel Core i7-14700
► remove from comparison
The Intel Core i7-14700 is a desktop processor based on the Raptor Lake architecture, which inherits the 13th generation of Intel Core processors with minor improvements. The processor offers a base clock of 1.5 GHz or 2.1 GHz and reaches up to 5.4 GHz in Turbo. The basic CPU structure remains unchanged. The Intel Core i7-14700 features 8 P-cores and 12 E-cores, allowing up to 28 threads to be processed in parallel. It is also based on the LGA 1700 socket, which was already introduced with Alder Lake.
Graphics unit
Like the Intel Core i7-13700K, the Intel Core i7-14700 also has an integrated graphics unit. The Intel Iris Xe architecture continues to serve as the basis. In terms of performance, however, nothing has changed with the Intel UHD Graphics 770.
Power consumption
The TDP of the Intel Core i7-14700 is 65 watts, with the option of consuming up to 219 watts in Turbo mode.
Intel Core i5-14600K
► remove from comparison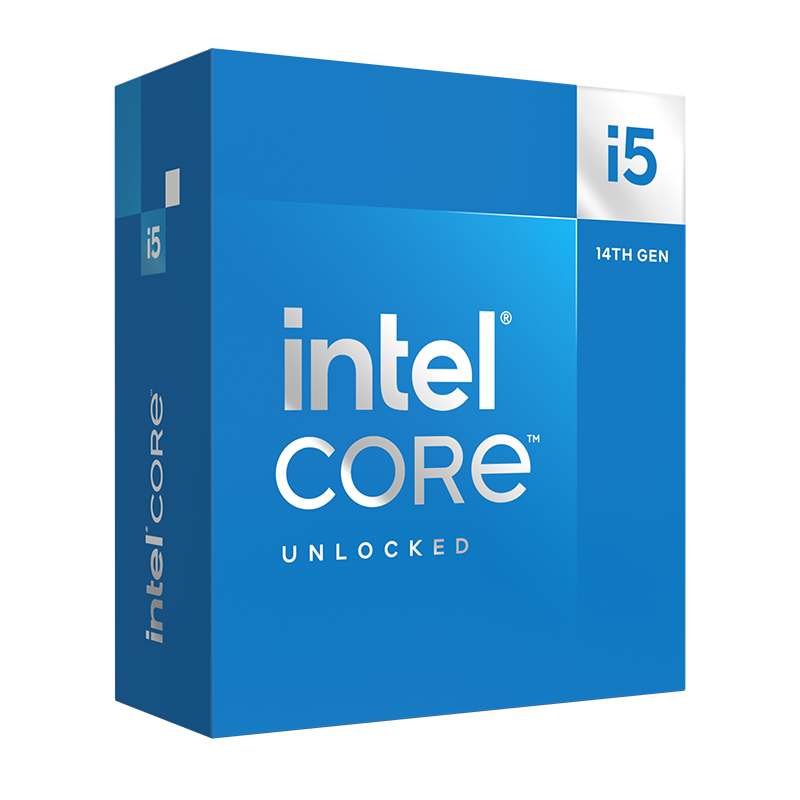
The Intel Core i5-14600K is a modern desktop processor based on the Raptor Lake architecture, which inherits the 13th generation of Intel Core processors with minor improvements. The processor offers a base clock of 3.5 GHz and reaches up to 5.3 GHz in Turbo. The basic CPU structure remains unchanged. This means that the Intel Core i5-14600K also has 6 P-cores and 8 E-cores, which means that up to 20 threads can be processed in parallel. The Intel Core i5-14600K still offers a freely selectable multiplier, which makes overclocking much easier. The LGA 1700 socket, which was already introduced with Alder-Lake, is also used as the basis.
Performance
Compared to the Intel Core i5-13600K , the IPC of the new Core i5-14600K has only been increased slightly. This means that the difference in performance is also only slight. The hybrid architecture relies on the Intel Thread Director, which is responsible for the correct allocation of tasks. As a further innovation, the manufacturer is increasingly relying on AI, which is also used for overclocking. With one click in the Intel Extreme Utility, the tool checks the entire system and makes the necessary settings.
Graphics unit
Like the Intel Core i5-13600K, the Intel Core i5-14600K also has an integrated graphics unit. The Intel Iris Xe architecture continues to serve as the basis. In terms of performance, however, nothing has changed with the Intel UHD Graphics 770.
Power consumption
The TDP of the Intel Core i5-14600K is 125 watts, with the option of consuming up to 181 watts in Turbo mode. If all limits are removed, the energy requirement rises to up to 240 watts. For cooling, we recommend a powerful air cooler or a 240 AiO.
| Model | AMD Ryzen 9 9950X | Intel Core i7-14700 | Intel Core i5-14600K | ||||||||||||||||||||||||||||||||||||||||||||||||||||||||||||||||||||||||||||||||
| Codename | Granite Ridge | Raptor Lake | Raptor Lake | ||||||||||||||||||||||||||||||||||||||||||||||||||||||||||||||||||||||||||||||||
| Series | AMD Granite Ridge (Zen 5, AM5) | Intel Raptor Lake-R | Intel Raptor Lake-R | ||||||||||||||||||||||||||||||||||||||||||||||||||||||||||||||||||||||||||||||||
| Series: Raptor Lake-R Raptor Lake |
|
|
| ||||||||||||||||||||||||||||||||||||||||||||||||||||||||||||||||||||||||||||||||
| Clock | 4300 - 5700 MHz | 1500 - 5400 MHz | 3500 - 5300 MHz | ||||||||||||||||||||||||||||||||||||||||||||||||||||||||||||||||||||||||||||||||
| L1 Cache | 1 MB | ||||||||||||||||||||||||||||||||||||||||||||||||||||||||||||||||||||||||||||||||||
| L2 Cache | 16 MB | 28 MB | 20 MB | ||||||||||||||||||||||||||||||||||||||||||||||||||||||||||||||||||||||||||||||||
| L3 Cache | 64 MB | 33 MB | 24 MB | ||||||||||||||||||||||||||||||||||||||||||||||||||||||||||||||||||||||||||||||||
| Cores / Threads | 16 / 32 16 x 5.7 GHz AMD Zen 5 | 20 / 28 8 x 5.4 GHz Intel Raptor Cove P-Core 12 x 4.2 GHz Intel Gracemont E-Core | 14 / 20 6 x 5.3 GHz Intel Raptor Cove P-Core 8 x 3.5 GHz Intel Gracemont E-Core | ||||||||||||||||||||||||||||||||||||||||||||||||||||||||||||||||||||||||||||||||
| TDP | 170 Watt | 65 Watt | 125 Watt | ||||||||||||||||||||||||||||||||||||||||||||||||||||||||||||||||||||||||||||||||
| Technology | 4 nm & 6 nm | 10 nm | 10 nm | ||||||||||||||||||||||||||||||||||||||||||||||||||||||||||||||||||||||||||||||||
| max. Temp. | 95 °C | 100 °C | 100 °C | ||||||||||||||||||||||||||||||||||||||||||||||||||||||||||||||||||||||||||||||||
| Socket | AM5 | LGA 1700 | LGA 1700 | ||||||||||||||||||||||||||||||||||||||||||||||||||||||||||||||||||||||||||||||||
| Features | DDR5-5600 RAM, PCIe 5 + PCIe 4, SMT, AES, AVX, AVX2, AVX512, FMA3, MMX (+), SHA, SSE, SSE2, SSE3, SSSE3, SSE4.1, SSE4.2, SSE4A | Intel UHD Graphics 770, max. 192 GB of DDR5 5600 MT/s or DDR4 3200 MT/s | Intel UHD Graphics 770, DDR5 5600 MT/s, DDR4 3200 MT/s | ||||||||||||||||||||||||||||||||||||||||||||||||||||||||||||||||||||||||||||||||
| iGPU | AMD Radeon 610M ( - 2200 MHz) | Intel UHD Graphics 770 (300 - 1600 MHz) | Intel UHD Graphics 770 (300 - 1550 MHz) | ||||||||||||||||||||||||||||||||||||||||||||||||||||||||||||||||||||||||||||||||
| Architecture | x86 | x86 | x86 | ||||||||||||||||||||||||||||||||||||||||||||||||||||||||||||||||||||||||||||||||
| Announced | |||||||||||||||||||||||||||||||||||||||||||||||||||||||||||||||||||||||||||||||||||
| Manufacturer | www.amd.com | www.intel.com | www.intel.com | ||||||||||||||||||||||||||||||||||||||||||||||||||||||||||||||||||||||||||||||||
| TDP Turbo PL2 | 219 Watt | ||||||||||||||||||||||||||||||||||||||||||||||||||||||||||||||||||||||||||||||||||
| $384 U.S. | $319 U.S. |

Benchmarks
Average Benchmarks AMD Ryzen 9 9950X → 100% n=25
Average Benchmarks Intel Core i7-14700 → 76% n=25
Average Benchmarks Intel Core i5-14600K → 78% n=25
* Smaller numbers mean a higher performance
1 This benchmark is not used for the average calculation