Notebookcheck Logo

AMD Ryzen 9 7945HX3D vs Intel Core i9-13980HX

AMD Ryzen 9 7945HX3D

► remove from comparison AMD R9 7945HX3D

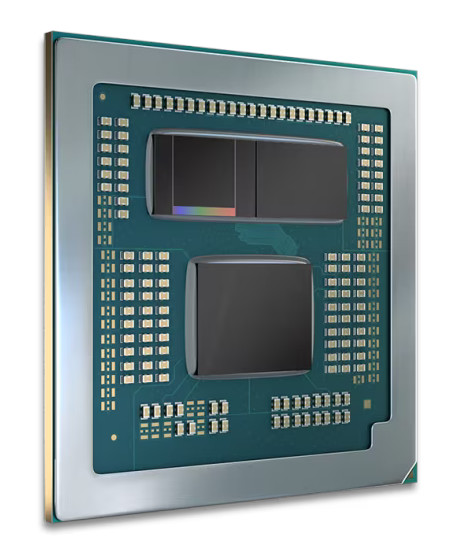
The AMD Ryzen 9 7945HX3D is a fast high-end laptop processor of the Dragon Range series. It offers 16 cores based on the Zen 4 architecture that supports hyperthreading (32 threads). The cores clock from 2.3 (base) up to 5.4 GHz (single core boost). Compared to the similar R9 7945HX, the 7945HX3D offers an additional 64 MB 3D V-Cache on one CCD-Cluster. This helps in some workloads that can use the additional fast cache (e.g. some games). The guaranteed base clock however was reduced from 2.5 to 2.3 GHz.

The performance of the R9 7945HX3D is similar to the R9 7945HX in workloads that wont make use of the bigger L3 cache. Most games however can use the additional memory. AMD e.g. was advertising the HX3D with 4% to 53% higher performance in 1080p high settings.

The Dragon Range series still uses a chiplet design with two CCD-clusters (each with 8 possible cores) in 5nm and an IO-die (including the memory controller and the Radeon 610M iGPU) in 6nm. The chip integrates 4x USB 3.2 Gen2 (10 Gbps) ports (no USB4), 28 PCIe 5.0 lanes (for GPU and SSDs) and a dual-channel DDR5-5200 memory controller.

The R9 7945HX3D is rated at a TDP of 55 Watt and can be configured up to 75 Watt (cTDP).

Intel Core i9-13980HX

► remove from comparison Intel i9-13980HX

The Intel Core i9-13980HX is a fast high-end mobile processor of the Raptor Lake-HX series. Is was announced in early 2023 and is based on the desktop Core i9-13000K with combined 24 cores and 32 threads. Eight fast Raptor Cove performance cores (P-cores) with HyperThreading that clock between 2.2 GHz (base) to 5.6 GHz (single core Turbo). The sixteen Gracemont cores are smaller and slower and optimized for efficiency. They clock between 1.6 GHz (base) and 4 GHz (Turbo).

Compared to Alder Lake, Raptor Lake offers improved P-Cores (Raptor Cove micro-architecture) with bigger Caches and more E-Cores (same Gracemont micro-architecture). Furthermore, the chip supports faster DDR5 memory (up to 5600 MHz for the 13980HX).

Performance

The average 13980HX in our database is in the same league as the Core i9-13950HX and the Ryzen 9 7845HX, as far as multi-thread benchmark scores are concerned.

Thanks to its decent cooling solution and a long-term CPU power limit of 143 W, the Alienware m18 R1 is among the fastest systems built around the 13980HX that we know of. It can be at least 10% faster in CPU-bound workloads than the slowest system featuring the same chip in our database, as of August 2023.

The CPU is still produced on a further improved 10nm FinFET process (Intel 7) that allows the higher clock speeds. The power consumption is specified at 55W base power up to 157 Watt max. Turbo power.

ModelAMD Ryzen 9 7945HX3DIntel Core i9-13980HX
CodenameDragon Range-HX (Zen 4)Raptor Lake-HX
SeriesAMD Dragon Range (Zen 4, Ryzen 7X4X/8X4X)Intel Raptor Lake-HX
Series: Raptor Lake-HX Raptor Lake-HX
AMD Ryzen 9 7945HX3D « 2.3 - 5.4 GHz16 / 32 cores128 MB L3
AMD Ryzen 9 7945HX compare2.5 - 5.4 GHz16 / 32 cores64 MB L3
AMD Ryzen 9 7940HX compare2.4 - 5.2 GHz16 / 32 cores64 MB L3
AMD Ryzen 9 7845HX compare3 - 5.2 GHz12 / 24 cores64 MB L3
AMD Ryzen 9 7840HX compare2.9 - 5.1 GHz12 / 24 cores64 MB L3
Intel Core i9-13980HX « 1.6 - 5.6 GHz24 / 32 cores36 MB L3
Intel Core i9-13950HX compare1.6 - 5.5 GHz24 / 32 cores36 MB L3
Intel Core i9-13900HX compare1.6 - 5.4 GHz24 / 32 cores36 MB L3
Intel Core i7-13850HX compare1.5 - 5.3 GHz20 / 28 cores30 MB L3
Intel Core i7-13700HX compare1.5 - 5 GHz16 / 24 cores30 MB L3
Intel Core i7-13650HX compare1.9 - 4.9 GHz14 / 20 cores24 MB L3
Intel Core i5-13600HX compare1.9 - 4.8 GHz14 / 20 cores24 MB L3
Intel Core i5-13500HX compare1.8 - 4.7 GHz14 / 20 cores24 MB L3
Intel Core i5-13450HX compare1.8 - 4.6 GHz10 / 16 cores20 MB L3
Clock2300 - 5400 MHz1600 - 5600 MHz
L1 Cache1 MB
L2 Cache16 MB32 MB
L3 Cache128 MB36 MB
Cores / Threads16 / 32
16 x 5.4 GHz AMD Zen 4
24 / 32
8 x 5.6 GHz Intel Raptor Cove P-Core
16 x 4.0 GHz Intel Gracemont E-Core
TDP55 Watt55 Watt
Technology5 nm10 nm
max. Temp.89 °C100 °C
SocketFL1BGA1964
iGPUAMD Radeon 610M (400 - 2200 MHz)Intel UHD Graphics 770 ( - 1650 MHz)
Architecturex86x86
Announced
Manufacturerwww.amd.comark.intel.com
Die Size257 mm2
FeaturesDDR4-3200/DDR5-5600 RAM, PCIe 5, Thr. Dir., DL Boost, GNA, MMX, SSE, SSE2, SSE3, SSSE3, SSE4.1, SSE4.2, AVX, AVX2, BMI2, ABM, FMA, ADX, SMEP, SMAP, EIST, TM1, TM2, Hyper-Threading, Turbo, SST, AES-NI, RDRAND, RDSEED, SHA

Benchmarks

Performance Rating - CB R15 + R20 + 7-Zip + X265 + Blender + 3DM11 CPU - R9 7945HX3D
47.4 pt (79%)
Restrict / Search: Model: Max. age: years
Performance Rating - CB R15 + R20 + 7-Zip + X265 + Blender + 3DM11 CPU - i9-13980HX
46 pt (77%)
Restrict / Search: Model: Max. age: years
Cinebench 2024 - Cinebench 2024 CPU Single Core
115 Points (65%)
Cinebench 2024 - Cinebench 2024 CPU Multi Core
1772 Points (33%)
Cinebench R23 - Cinebench R23 Multi Core
32782 Points (30%)
min: 28301     avg: 30428     median: 30273 (28%)     max: 33052 Points
Cinebench R23 - Cinebench R23 Single Core
1935 Points (81%)
min: 1825     avg: 2081     median: 2110 (89%)     max: 2169 Points
Cinebench R20 - Cinebench R20 CPU (Single Core)
755 Points (82%)
min: 717     avg: 790     median: 807 (88%)     max: 825 Points
Cinebench R20 - Cinebench R20 CPU (Multi Core)
13033 Points (32%)
min: 10353     avg: 11583     median: 11510 (28%)     max: 12437 Points
Cinebench R15 - Cinebench R15 CPU Multi 64 Bit
5600 Points (35%)
min: 4358     avg: 4724     median: 4717 (30%)     max: 5172 Points
Cinebench R15 - Cinebench R15 CPU Single 64 Bit
311 Points (86%)
min: 289     avg: 303.6     median: 304.5 (84%)     max: 312 Points
Cinebench R11.5 - Cinebench R11.5 CPU Multi 64 Bit
61.9 Points (80%)
55.8 Points (72%)
Cinebench R11.5 - Cinebench R11.5 CPU Single 64 Bit
3.7 Points (88%)
3.7 Points (89%)
Cinebench R10 - Cinebench R10 Rend. Single (32bit)
8478 Points (51%)
11940 Points (72%)
Cinebench R10 - Cinebench R10 Rend. Multi (32bit)
70414 Points (51%)
85088 Points (62%)
Cinebench R10 - Cinebench R10 Rend. Multi (64bit)
125983 Points (80%)
Cinebench R10 - Cinebench R10 Rend. Single (64bit)
17400 Points (21%)
wPrime 2.10 - wPrime 2.0 1024m *
249.9 s (3%)
183.5 s (2%)
wPrime 2.10 - wPrime 2.0 32m *
5.9 s (1%)
3 s (1%)
WinRAR - WinRAR 4.0
51122 Points (81%)
11438 Points (18%)
7-Zip 18.03 - 7-Zip 18.03 Multi Thread 4 runs
136201 MIPS (78%)
min: 104616     avg: 118958     median: 119244 (68%)     max: 129804 MIPS
7-Zip 18.03 - 7-Zip 18.03 Single Thread 4 runs
7573 MIPS (89%)
min: 6889     avg: 6991     median: 6972 (82%)     max: 7163 MIPS
X264 HD Benchmark 4.0 - x264 Pass 2
198.1 fps (5%)
X264 HD Benchmark 4.0 - x264 Pass 1
374 fps (10%)
HWBOT x265 Benchmark v2.2 - HWBOT x265 4k Preset
36.4 fps (64%)
min: 27     avg: 31.1     median: 31.6 (56%)     max: 33.4 fps
TrueCrypt - TrueCrypt Serpent
2.5 GB/s (74%)
2.5 GB/s (74%)
TrueCrypt - TrueCrypt Twofish
3.8 GB/s (66%)
4.9 GB/s (84%)
TrueCrypt - TrueCrypt AES
23.4 GB/s (61%)
18.4 GB/s (48%)
Blender - Blender 3.3 Classroom CPU *
150 Seconds (2%)
min: 170     avg: 194.7     median: 190 (2%)     max: 249 Seconds
Blender - Blender 2.79 BMW27 CPU *
95 Seconds (1%)
min: 97     avg: 108.4     median: 106 (1%)     max: 136 Seconds
R Benchmark 2.5 - R Benchmark 2.5 *
0.4 sec (9%)
min: 0.3793     avg: 0.4     median: 0.4 (8%)     max: 0.4041 sec
3DMark 06 - CPU - 3DMark 06 - CPU
19734 Points (42%)
Super Pi mod 1.5 XS 1M - Super Pi mod 1.5 XS 1M *
6.4 s (1%)
7.4 s (2%)
Super Pi mod 1.5 XS 2M - Super Pi mod 1.5 XS 2M *
13.9 s (1%)
15.5 s (1%)
Super Pi Mod 1.5 XS 32M - Super Pi mod 1.5 XS 32M *
337.8 s (2%)
345.8 s (2%)
3DMark 11 - 3DM11 Performance Physics
29707 Points (73%)
min: 12665     avg: 23608     median: 25051 (62%)     max: 27094 Points
3DMark - 3DMark Ice Storm Physics
min: 91195     avg: 94076     median: 94075.5 (76%)     max: 96956 Points
3DMark - 3DMark Ice Storm Extreme Physics
91414 Points (74%)
3DMark - 3DMark Ice Storm Unlimited Physics
94552 Points (76%)
3DMark - 3DMark Cloud Gate Physics
min: 15674     avg: 20652     median: 21142 (53%)     max: 24650 Points
3DMark - 3DMark Fire Strike Standard Physics
38826 Points (69%)
min: 19708     avg: 37344     median: 40175 (72%)     max: 41644 Points
3DMark - 3DMark Time Spy CPU
14131 Points (60%)
min: 14503     avg: 16587     median: 17026 (72%)     max: 18234 Points
Geekbench 6.5 - Geekbench 6.5 Single-Core
2916 Points (71%)
min: 2802     avg: 2882     median: 2881.5 (70%)     max: 2961 Points
Geekbench 6.5 - Geekbench 6.5 Multi-Core
16957 Points (66%)
min: 17472     avg: 17564     median: 17564 (68%)     max: 17656 Points
Geekbench 6.0 - Geekbench 6.0 Single-Core
min: 2735     avg: 2790     median: 2789.5 (89%)     max: 2844 Points
Geekbench 6.0 - Geekbench 6.0 Multi-Core
min: 16383     avg: 16665     median: 16665 (68%)     max: 16947 Points
Geekbench 5.5 - Geekbench 5.1 - 5.5 64 Bit Single-Core
2133 Points (81%)
min: 1986     avg: 2079     median: 2099 (80%)     max: 2139 Points
Geekbench 5.5 - Geekbench 5.1 - 5.5 64 Bit Multi-Core
19875 Points (36%)
min: 18475     avg: 20205     median: 20329 (36%)     max: 22200 Points
Geekbench 5.0 - Geekbench 5.0 64 Bit Single-Core
1987 Points (9%)
Geekbench 5.0 - Geekbench 5.0 64 Bit Multi-Core
22107 Points (70%)
Mozilla Kraken 1.1 - Kraken 1.1 Total Score *
421.3 ms (0%)
min: 446     avg: 459.9     median: 451 (1%)     max: 515 ms
Octane V2 - Octane V2 Total Score
97066 Points (71%)
min: 96184     avg: 102620     median: 102620 (75%)     max: 109055 Points
WebXPRT 4 - WebXPRT 4 Score
328 Points (90%)
min: 254     avg: 298.6     median: 306 (84%)     max: 318 Points
WebXPRT 3 - WebXPRT 3 Score
480 Points (86%)
min: 277     avg: 330.2     median: 337 (61%)     max: 349 Points
CrossMark - CrossMark Overall
2086 Points (78%)
min: 1935     avg: 2079     median: 2080 (78%)     max: 2182 Points
Power Consumption - Prime95 Power Consumption - external Monitor *
157.2 Watt (27%)
min: 157.3     avg: 197.5     median: 191.9 (33%)     max: 262 Watt
Power Consumption - Cinebench R15 Multi Power Consumption - external Monitor *
187.3 Watt (34%)
min: 172.2     avg: 222.5     median: 225 (41%)     max: 291 Watt
Power Consumption - Geekbench 5.5 Power Consumption 150cd *
230 Watt (100%)
Power Consumption - Idle Power Consumption - external Monitor *
28.9 Watt (19%)
min: 19.8     avg: 25.3     median: 23.2 (15%)     max: 32.3 Watt
Power Consumption - Idle Power Consumption 150cd 1min *
17.2 Watt (21%)
min: 15.2     avg: 25.2     median: 24.9 (30%)     max: 37.8 Watt
Power Consumption - Power Efficiency - Cinebench R15 Multi external Monitor
29.9 Points per Watt (22%)
min: 18.3     avg: 21.1     median: 20.4 (15%)     max: 25.3 Points per Watt

Average Benchmarks AMD Ryzen 9 7945HX3D → 100% n=37

Average Benchmarks Intel Core i9-13980HX → 99% n=37

- Range of benchmark values for this graphics card
red legend - Average benchmark values for this graphics card
* Smaller numbers mean a higher performance
1 This benchmark is not used for the average calculation

Add one or more devices and compare

In the following list you can select (and also search for) devices that should be added to the comparison. You can select more than one device.

restrict list:
v1.34
log 03. 23:13:13

#0 ran 0s before starting gpusingle class +0s ... 0s

#1 checking url part for id 15073 +0s ... 0s

#2 checking url part for id 14665 +0s ... 0s

#3 redirected to Ajax server, took 1759525993s time from redirect:0 +0s ... 0s

#4 did not recreate cache, as it is less than 5 days old! Created at Thu, 02 Oct 2025 12:30:24 +0200 +0s ... 0s

#5 composed specs +0.003s ... 0.003s

#6 did output specs +0s ... 0.003s

#7 getting avg benchmarks for device 15073 +0.001s ... 0.005s

#8 got single benchmarks 15073 +0s ... 0.005s

#9 getting avg benchmarks for device 14665 +0.001s ... 0.006s

#10 got single benchmarks 14665 +0.002s ... 0.008s

#11 got avg benchmarks for devices +0s ... 0.008s

#12 min, max, avg, median took s +0.023s ... 0.031s

#13 return log +0.002s ... 0.033s

Please share our article, every link counts!
Mail Logo
> Expert Reviews and News on Laptops, Smartphones and Tech Innovations > Benchmarks / Tech > Processor Comparison - Head 2 Head
Redaktion, 2017-09- 8 (Update: 2023-07- 1)