

AMD Ryzen 7 7700 vs Intel Core i9-14900 vs AMD Ryzen 5 7600
AMD Ryzen 7 7700
► remove from comparison
The AMD Ryzen 7 7700 is a fast high-end desktop processor of the Raphael series. It offers 8 cores based on the Zen 4 architecture that supports hyperthreading (16 threads). The cores clock from 3.8 (base) up to 5.3 GHz (single core boost). Compared to the faster Ryzen 9 CPUs (like the 7900X), the R7 offers less cores and slightly lower clock speeds.
The performance of the R7 7700 is slightly below the higher clocked AMD R7 7700X (that also features a higher TDP).
The Raphael series still uses a chiplet design with two CCD-clusters (each with 8 possible cores, so only one used for the 7700X) in 5nm and an IO-die (including the memory controller and the Radeon Graphics iGPU) in 6nm.
The Ryzen 7 7700 is rated at a TDP of only 65 Watt and therefore suited for smaller desktops (and cooling solutions).
Intel Core i9-14900
► remove from comparison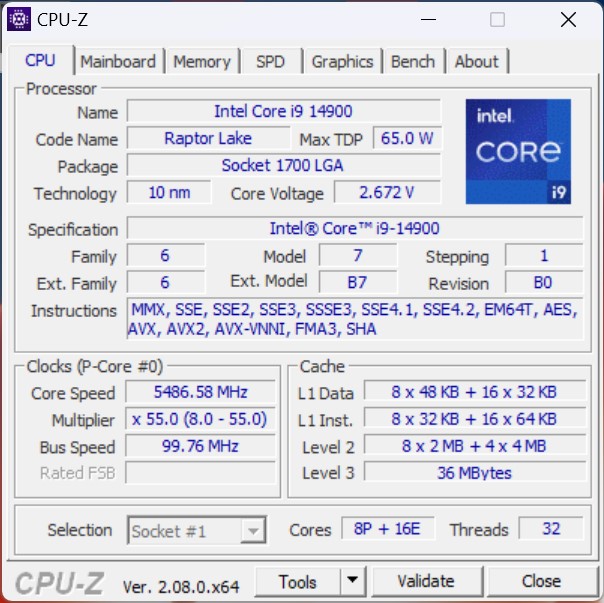
The Intel Core i9-14900 is a high-end processor based on the Raptor Lake architecture. The base clock is 2 GHz and can reach up to 5.8 GHz under optimal conditions. Similar to the top model (Intel Core i9-14900K), the total of 32 threads are divided into 8 p- and 16 e-cores. The 8 performance cores (p-cores) also offer hyperthreading, which means that a total of 32 threads can be processed simultaneously. The non-K model is an economical processor. There is still the option of DDR4 or DDR5 memory.
Performance
Compared to the Intel Core i9-14900K, the Core i9-14900 offers the same number of physical computing units. However, due to the lower power consumption, the Intel Core i9-14900 delivers slightly less performance. The intended use is primarily for compact PCs with limited cooling options.
Graphics unit
Like the Intel Core i9-14900K, the Intel Core i9-14900 offers an integrated graphics unit. The Intel Iris Xe architecture continues to serve as the basis. In terms of performance, however, nothing has changed with the Intel UHD Graphics 770.
Power consumption
The Intel Core i9-14900 is specified with a TDP of 65 watts, which corresponds to the PL1 value. In boost mode, the processor's performance can increase to up to 219 watts (PL2). However, this requires very good cooling. Compared to the Intel Core i9-13900, the specified power consumption has not changed.
AMD Ryzen 5 7600
► remove from comparison
The AMD Ryzen 5 7600 is a fast mid-range desktop processor of the Raphael series. It offers 6 cores based on the Zen 4 architecture that supports hyperthreading (12 threads). The cores clock from 3.8 (base) up to 5.1 GHz (single core boost).
The Raphael series still uses a chiplet design with two CCD-clusters (each with 8 possible cores) in 5nm and an IO-die (including the memory controller and the Radeon Graphics iGPU) in 6nm.
The R5 7600X is rated at 65 Watt TDP.
| Model | AMD Ryzen 7 7700 | Intel Core i9-14900 | AMD Ryzen 5 7600 | ||||||||||||||||||||||||||||||||||||||||||||||||||||||||||||||||||||||||||||||||||||||||||||
| Codename | Raphael (Zen4) | Raptor Lake | Raphael (Zen4) | ||||||||||||||||||||||||||||||||||||||||||||||||||||||||||||||||||||||||||||||||||||||||||||
| Series | AMD Raphael (Zen 4, Ryzen 7000) | Intel Raptor Lake-R | AMD Raphael (Zen 4, Ryzen 7000) | ||||||||||||||||||||||||||||||||||||||||||||||||||||||||||||||||||||||||||||||||||||||||||||
| Series: Raphael (Zen 4, Ryzen 7000) Raphael (Zen4) |
|
|
| ||||||||||||||||||||||||||||||||||||||||||||||||||||||||||||||||||||||||||||||||||||||||||||
| Clock | 3800 - 5300 MHz | 2000 - 5800 MHz | 3800 - 5100 MHz | ||||||||||||||||||||||||||||||||||||||||||||||||||||||||||||||||||||||||||||||||||||||||||||
| L1 Cache | 512 KB | 384 KB | |||||||||||||||||||||||||||||||||||||||||||||||||||||||||||||||||||||||||||||||||||||||||||||
| L2 Cache | 8 MB | 32 MB | 6 MB | ||||||||||||||||||||||||||||||||||||||||||||||||||||||||||||||||||||||||||||||||||||||||||||
| L3 Cache | 32 MB | 36 MB | 32 MB | ||||||||||||||||||||||||||||||||||||||||||||||||||||||||||||||||||||||||||||||||||||||||||||
| Cores / Threads | 8 / 16 | 24 / 32 8 x 5.8 GHz Intel Raptor Cove P-Core 16 x 4.3 GHz Intel Gracemont E-Core | 6 / 12 | ||||||||||||||||||||||||||||||||||||||||||||||||||||||||||||||||||||||||||||||||||||||||||||
| TDP | 65 Watt | 65 Watt | 65 Watt | ||||||||||||||||||||||||||||||||||||||||||||||||||||||||||||||||||||||||||||||||||||||||||||
| Transistors | 9900 Million | CCD: 6,5 Mrd + IOD: 3,4 Mrd Million | |||||||||||||||||||||||||||||||||||||||||||||||||||||||||||||||||||||||||||||||||||||||||||||
| Technology | 5 nm | 10 nm | 5 nm | ||||||||||||||||||||||||||||||||||||||||||||||||||||||||||||||||||||||||||||||||||||||||||||
| Voltage | 0.650 - 1.475V V | 0.650 - 1.475V V | |||||||||||||||||||||||||||||||||||||||||||||||||||||||||||||||||||||||||||||||||||||||||||||
| Die Size | 2x 70 (CCD) mm2 + 122 (I/O) mm2 | 257 mm2 | 1x 70 (CCD) mm2 + 122 (I/O) mm2 | ||||||||||||||||||||||||||||||||||||||||||||||||||||||||||||||||||||||||||||||||||||||||||||
| max. Temp. | 95 °C | 100 °C | 95 °C | ||||||||||||||||||||||||||||||||||||||||||||||||||||||||||||||||||||||||||||||||||||||||||||
| Socket | AM5 (LGA 1718) | LGA 1700 | AM5 (LGA 1718) | ||||||||||||||||||||||||||||||||||||||||||||||||||||||||||||||||||||||||||||||||||||||||||||
| Features | MMX(+), SSE, SSE2, SSE3, SSSE3, SSE4.1, SSE4.2, SSE4A, x86-64, AMD-V, AES, AVX, AVX2, AVX512F, FMA3, SHA, Precision Boost 2 | MMX(+), SSE, SSE2, SSE3, SSSE3, SSE4.1, SSE4.2, SSE4A, x86-64, AMD-V, AES, AVX, AVX2, AVX512F, FMA3, SHA, Precision Boost 2 | |||||||||||||||||||||||||||||||||||||||||||||||||||||||||||||||||||||||||||||||||||||||||||||
| iGPU | AMD Radeon Graphics (Ryzen 7000) (400 - 2200 MHz) | Intel UHD Graphics 770 (300 - 1650 MHz) | AMD Radeon Graphics (Ryzen 7000) (400 - 2200 MHz) | ||||||||||||||||||||||||||||||||||||||||||||||||||||||||||||||||||||||||||||||||||||||||||||
| Architecture | x86 | x86 | x86 | ||||||||||||||||||||||||||||||||||||||||||||||||||||||||||||||||||||||||||||||||||||||||||||
| Announced | |||||||||||||||||||||||||||||||||||||||||||||||||||||||||||||||||||||||||||||||||||||||||||||||
| Manufacturer | www.amd.com | www.intel.de | www.amd.com | ||||||||||||||||||||||||||||||||||||||||||||||||||||||||||||||||||||||||||||||||||||||||||||
| TDP Turbo PL2 | 219 Watt | ||||||||||||||||||||||||||||||||||||||||||||||||||||||||||||||||||||||||||||||||||||||||||||||
| $549 U.S. |

Benchmarks

Average Benchmarks AMD Ryzen 7 7700 → 100% n=40
Average Benchmarks Intel Core i9-14900 → 120% n=40
Average Benchmarks AMD Ryzen 5 7600 → 86% n=40
* Smaller numbers mean a higher performance
1 This benchmark is not used for the average calculation