AMD Ryzen 7 1800X vs AMD Ryzen 3 2200U vs AMD Ryzen 7 1700
AMD Ryzen 7 1800X ► remove from comparison
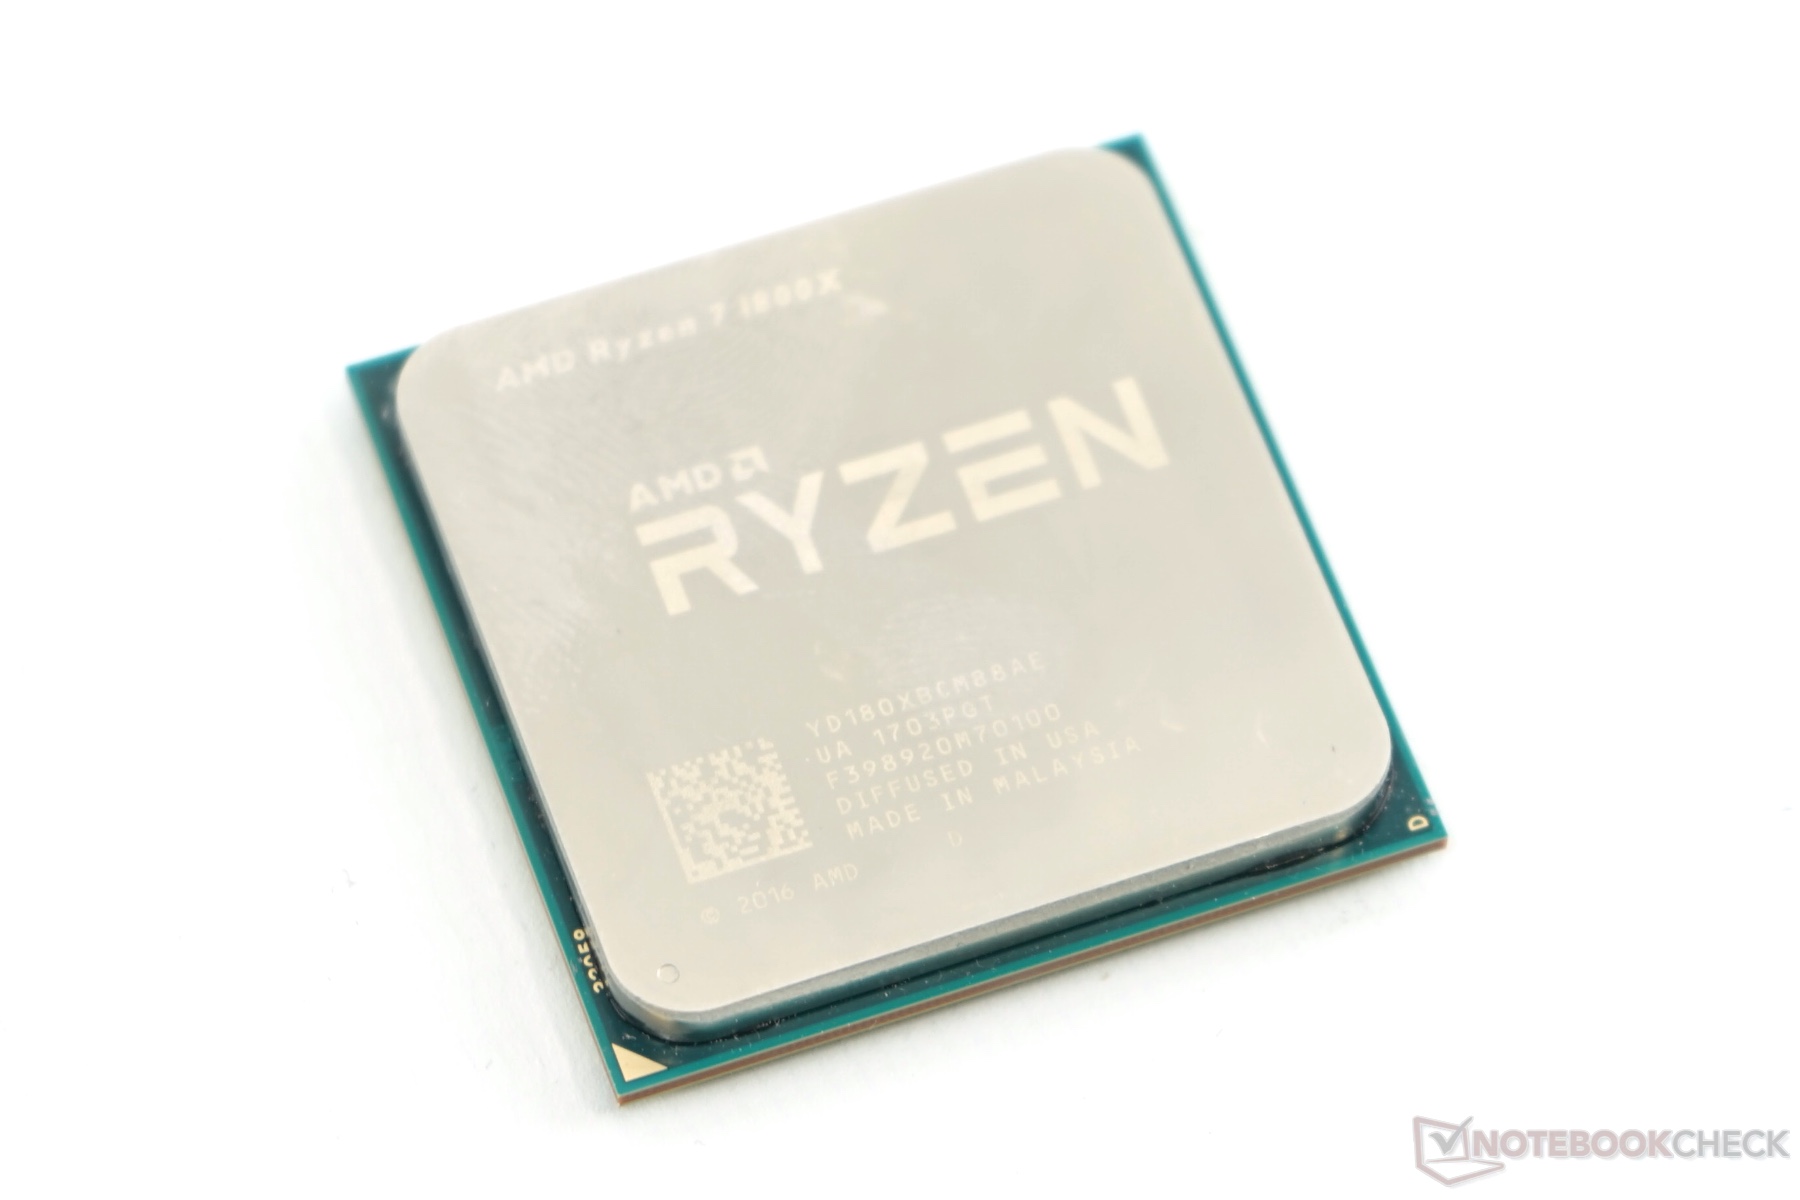
The AMD Ryzen 7 1800X is a fast desktop processor with 8 cores and SMT (16 threads) that was introduced in early 2017. It is based on the new Zen architecture and it is the fastest model at the time of announcement.
The CPU cores clock from 3.6 base speed up to 4.1 GHz (XFR). The 2-core Turbo is specified at 4 GHz and using all 8 cores, the CPU can reach up to 3.7 GHz. Therefore, the CPU offers 200 MHz more than the Ryzen 7 1700X .
The performance in applications that can make use of all 8 cores is very competitive to high end Intel CPUs at a very good price point. However, non optimized apps like many games can't make full use of the new architecture.
A detailed look at the new Ryzen 7 1800X, 1700X and 1700 can be found in our review .
AMD Ryzen 3 2200U ► remove from comparison
The AMD Ryzen 3 2200U is a mobile APU for thin and light laptops that was announced in October 2017. It includes two Zen cores clocked at 2.5 to 3.4 GHz and offers SMT (four threads at once) and 4 MB L3-Cache. The integrated graphics card is called Radeon RX Vega 3 and offers only 3 CUs (192 Shaders) clocked at up to 1000 MHz. The TDP is configurable between 12 and 25 Watt (15 Watt nominal).
More information on Raven Ridge can be found in our launch article.
AMD Ryzen 7 1700 ► remove from comparison
The AMD Ryzen 7 1700 is a fast desktop processor with 8 cores and SMT (16 threads) that was introduced in early 2017. It is based on the new Zen architecture and it is the slowest model at the time of announcement. With 65 Watt it is also less power hungry than the Ryzen 1700X .
The CPU cores clock from 3 base speed up to 3.75 GHz (XFR). The 2-core Turbo is specified at 3.7 GHz and using all 8 cores, the CPU can reach up to 3.2 GHz. The clock rate and TDP rating is the only difference to the faster Ryzen 7 models.
The performance in applications that can make use of all 8 cores is very competitive to high end Intel CPUs at a very good price point. However, non optimized apps like many games can't make full use of the new architecture.
A detailed look at the new Ryzen 7 1800X, 1700X and 1700 can be found in our review .
Model AMD Ryzen 7 1800X AMD Ryzen 3 2200U AMD Ryzen 7 1700 Series AMD Ryzen 7 AMD Raven Ridge (Ryzen 2000 APU) AMD Ryzen 7 Codename Zen Zen Zen Series: Ryzen 7 Zen Clock 3600 - 4000 MHz 2500 - 3400 MHz 3000 - 3700 MHz L2 Cache 4 MB 1 MB 4 MB L3 Cache 16 MB 4 MB 16 MB Cores / Threads 8 / 16 2 / 4 8 / 16 TDP 95 Watt 15 Watt 65 Watt Transistors 4800 Million 4500 Million 4800 Million Technology 14 nm 14 nm 14 nm Socket AM4 AM4 AM4 Features XFR, FMA3, SSE 4.2, AVX2, SMT XFR, FMA3, SSE 4.2, AVX2, SMT XFR, FMA3, SSE 4.2, AVX2, SMT Architecture x86 x86 x86 $499 U.S. $329 U.S. Announced L1 Cache 192 KB iGPU AMD Radeon RX Vega 3 ( - 1000 MHz)
Benchmarks Performance Rating - CB R15 + R20 + 7-Zip + X265 + Blender + 3DM11 CPU - R7 1800X
31.3 pt (43%)
...
...
Cinebench R23 - Cinebench R23 Multi Core
8891 Points (8%)
Cinebench R23 - Cinebench R23 Single Core
939 Points (40%)
Cinebench R20 - Cinebench R20 CPU (Single Core)
min: 394 avg: 398.5 median: 398.5 (44%) max: 403 Points
Cinebench R20 - Cinebench R20 CPU (Multi Core)
min: 3544 avg: 3611 median: 3610.5 (9%) max: 3677 Points
Cinebench R15 - Cinebench R15 CPU Multi 64 Bit
min: 1598 avg: 1620 median: 1618 (10%) max: 1647 Points
min: 275 avg: 311.8 median: 312 (2%) max: 348 Points
min: 1408 avg: 1415 median: 1414 (9%) max: 1424 Points
Cinebench R15 - Cinebench R15 CPU Single 64 Bit
min: 157 avg: 160.7 median: 160.8 (48%) max: 164 Points
min: 105 avg: 116.8 median: 117 (35%) max: 128 Points
min: 144 avg: 146.2 median: 147 (44%) max: 147.6 Points
Cinebench R11.5 - Cinebench R11.5 CPU Multi 64 Bit
18 Points (23%)
min: 2.68 avg: 3 median: 3 (4%) max: 3.29 Points
min: 15.56 avg: 15.7 median: 15.7 (20%) max: 15.76 Points
Cinebench R11.5 - Cinebench R11.5 CPU Single 64 Bit
1.8 Points (45%)
min: 0.85 avg: 1.1 median: 1.1 (28%) max: 1.44 Points
min: 1.63 avg: 1.7 median: 1.7 (41%) max: 1.67 Points
Cinebench R10 - Cinebench R10 Rend. Single (32bit)
5062 Points (31%)
min: 3729 avg: 3978 median: 3977.5 (24%) max: 4226 Points
min: 4286 avg: 4449 median: 4419 (27%) max: 4643 Points
Cinebench R10 - Cinebench R10 Rend. Multi (32bit)
32833 Points (24%)
min: 6745 avg: 7776 median: 7775.5 (6%) max: 8806 Points
min: 28947 avg: 29222 median: 29330 (21%) max: 29388 Points
wPrime 2.10 - wPrime 2.0 1024m *
min: 103 avg: 103.5 median: 103.5 (1%) max: 104 s
459.3 s (5%)
120 s (1%)
wPrime 2.10 - wPrime 2.0 32m *
min: 3.8 avg: 4.6 median: 4.6 (1%) max: 5.4 s
14.3 s (3%)
6 s (1%)
min: 3814 avg: 3967 median: 3967 (6%) max: 4120 Points
min: 1436 avg: 1545 median: 1545 (2%) max: 1654 Points
min: 3364 avg: 3447 median: 3447 (5%) max: 3530 Points
7-Zip 18.03 - 7-Zip 18.03 Multli Thread 4 runs
min: 40195 avg: 40776 median: 40776 (23%) max: 41357 MIPS
7-Zip 18.03 - 7-Zip 18.03 Single Thread 4 runs
min: 3907 avg: 4062 median: 4062 (49%) max: 4217 MIPS
X264 HD Benchmark 4.0 - x264 Pass 2
min: 73 avg: 84 median: 84 (29%) max: 95 fps
17.8 fps (6%)
min: 67 avg: 74.4 median: 74.4 (26%) max: 81.8 fps
X264 HD Benchmark 4.0 - x264 Pass 1
min: 163 avg: 179 median: 179 (41%) max: 195 fps
92 fps (21%)
min: 147 avg: 153.9 median: 153.9 (35%) max: 160.7 fps
HWBOT x265 Benchmark v2.2 - HWBOT x265 4k Preset
min: 9.69 avg: 9.8 median: 9.8 (17%) max: 9.83 fps
TrueCrypt - TrueCrypt Serpent
0.9 GB/s (0%)
min: 0.201 avg: 0.2 median: 0.2 (0%) max: 0.22 GB/s
min: 0.823 avg: 0.8 median: 0.8 (0%) max: 0.83 GB/s
TrueCrypt - TrueCrypt Twofish
1.5 GB/s (26%)
min: 0.285 avg: 0.3 median: 0.3 (6%) max: 0.355 GB/s
1.3 GB/s (22%)
TrueCrypt - TrueCrypt AES
min: 9.6 avg: 9.7 median: 9.7 (25%) max: 9.8 GB/s
min: 2 avg: 2.1 median: 2.1 (5%) max: 2.2 GB/s
min: 6 avg: 7.2 median: 7.2 (19%) max: 8.4 GB/s
Blender - Blender 2.79 BMW27 CPU *
min: 290 avg: 294.8 median: 294.8 (2%) max: 299.5 Seconds
R Benchmark 2.5 - R Benchmark 2.5 *
min: 0.66 avg: 0.7 median: 0.7 (15%) max: 0.685 sec
3DMark 06 - CPU - 3DMark 06 - CPU
min: 8462 avg: 9302 median: 9585 (20%) max: 9858 Points
min: 3006 avg: 3387 median: 3386.5 (7%) max: 3767 Points
min: 7730 avg: 8335 median: 8335 (18%) max: 8940 Points
Super Pi mod 1.5 XS 1M - Super Pi mod 1.5 XS 1M *
12.7 s (3%)
min: 12.96 avg: 13 median: 13 (3%) max: 13 s
min: 11.4 avg: 11.8 median: 11.8 (3%) max: 12.1 s
Super Pi mod 1.5 XS 2M - Super Pi mod 1.5 XS 2M *
27.1 s (1%)
min: 29.71 avg: 30.9 median: 30.9 (1%) max: 32 s
min: 24.9 avg: 25.7 median: 25.7 (1%) max: 26.4 s
Super Pi Mod 1.5 XS 32M - Super Pi mod 1.5 XS 32M *
613 s (3%)
min: 750 avg: 757 median: 756.5 (3%) max: 763 s
min: 594 avg: 636 median: 635.5 (3%) max: 677 s
3DMark Vantage - 3DM Vant. Perf. CPU no Physx
54690 Points (48%)
min: 9576 avg: 9917 median: 9916.5 (9%) max: 10257 Points
3DMark 11 - 3DM11 Performance Physics
min: 12983 avg: 13638 median: 13782 (37%) max: 14150 Points
min: 2831 avg: 3344 median: 3327 (9%) max: 3873 Points
min: 10162 avg: 12003 median: 12723 (34%) max: 13124 Points
3DMark - 3DMark Ice Storm Physics
min: 68390 avg: 69090 median: 69090 (56%) max: 69790 Points
43616 Points (35%)
60924 Points (50%)
3DMark - 3DMark Ice Storm Extreme Physics
min: 67876 avg: 68235 median: 68234.5 (55%) max: 68593 Points
43415 Points (35%)
3DMark - 3DMark Ice Storm Unlimited Physics
min: 66264 avg: 67071 median: 67070.5 (57%) max: 67877 Points
min: 36120 avg: 42472 median: 42471.5 (36%) max: 48823 Points
3DMark - 3DMark Cloud Gate Physics
min: 13294 avg: 13818 median: 13818 (35%) max: 14342 Points
min: 2206 avg: 2687 median: 2716 (7%) max: 3140 Points
12048 Points (30%)
3DMark - 3DMark Fire Strike Standard Physics
min: 18915 avg: 19158 median: 19232 (34%) max: 19328 Points
min: 4073 avg: 4412 median: 4571 (8%) max: 4591 Points
min: 16715 avg: 16759 median: 16732 (30%) max: 16830 Points
3DMark - 3DMark Time Spy CPU
min: 7497 avg: 7917 median: 8003 (34%) max: 8252 Points
1310 Points (6%)
min: 6411 avg: 6981 median: 7116 (30%) max: 7415 Points
Geekbench 5.5 - Geekbench 5.1 - 5.4 64 Bit Single-Core
min: 969 avg: 1072 median: 1023 (43%) max: 1223 Points
667 Points (28%)
Geekbench 5.5 - Geekbench 5.1 - 5.4 64 Bit Multi-Core
min: 6372 avg: 6646 median: 6545 (12%) max: 7021 Points
1267 Points (2%)
Geekbench 5.0 - Geekbench 5.0 64 Bit Single-Core
min: 983 avg: 1007 median: 1006.5 (4%) max: 1030 Points
Geekbench 5.0 - Geekbench 5.0 64 Bit Multi-Core
min: 6850 avg: 7036 median: 7036 (22%) max: 7222 Points
Geekbench 4.4 - Geekbench 4.1 - 4.4 64 Bit Single-Core
min: 4274 avg: 4489 median: 4488.5 (45%) max: 4703 Points
3583 Points (36%)
3884 Points (39%)
Geekbench 4.4 - Geekbench 4.1 - 4.4 64 Bit Multi-Core
min: 25106 avg: 26147 median: 26147 (29%) max: 27188 Points
6937 Points (8%)
18457 Points (21%)
Geekbench 4.0 - Geekbench 4.0 64 Bit Single-Core
min: 4481 avg: 4490 median: 4490 (61%) max: 4499 Points
3459 Points (47%)
min: 4110 avg: 4145 median: 4144.5 (56%) max: 4179 Points
Geekbench 4.0 - Geekbench 4.0 64 Bit Multi-Core
min: 21180 avg: 21595 median: 21594.5 (53%) max: 22009 Points
6644 Points (16%)
min: 18800 avg: 19292 median: 19292 (47%) max: 19784 Points
Geekbench 3 - Geekbench 3 32 Bit Multi-Core
30389 Points (54%)
min: 6766 avg: 6827 median: 6826.5 (12%) max: 6887 Points
23920 Points (42%)
Geekbench 3 - Geekbench 3 32 Bit Single-Core
4014 Points (78%)
min: 2898 avg: 2925 median: 2925 (57%) max: 2952 Points
3343 Points (65%)
Geekbench 3 - Geekbench 3 64 Bit Multi-Core
min: 7169 avg: 7279 median: 7279 (11%) max: 7389 Points
min: 25002 avg: 25451 median: 25451 (40%) max: 25900 Points
Geekbench 3 - Geekbench 3 64 Bit Single-Core
min: 3163 avg: 3190 median: 3190 (48%) max: 3217 Points
min: 3609 avg: 3805 median: 3804.5 (57%) max: 4000 Points
Geekbench 2 - 32 Bit - Geekbench Stream
9682 Points (78%)
7302 Points (59%)
Geekbench 2 - 32 Bit - Geekbench Memory
7385 Points (67%)
5378 Points (49%)
Geekbench 2 - 32 Bit - Geekbench Floating Point
27037 Points (53%)
8741 Points (17%)
Geekbench 2 - 32 Bit - Geekbench Integer
24878 Points (50%)
7307 Points (15%)
Geekbench 2 - 32 Bit - Geekbench Total Score
20615 Points (54%)
7422 Points (19%)
18461 Points (48%)
Mozilla Kraken 1.1 - Kraken 1.1 Total Score *
min: 931 avg: 945 median: 948 (1%) max: 955 ms
min: 1396 avg: 1688 median: 1687.5 (2%) max: 1979 ms
1054 ms (1%)
Sunspider - Sunspider 1.0 Total Score *
107.7 ms (1%)
115.9 ms (1%)
84.6 ms (1%)
Octane V2 - Octane V2 Total Score
31263 Points (28%)
min: 20430 avg: 22930 median: 22930 (21%) max: 25430 Points
32176 Points (29%)
WebXPRT 3 - WebXPRT 3 Score
min: 186 avg: 186.5 median: 186.5 (39%) max: 187 Points
Power Consumption - Prime95 Power Consumption - external Monitor *
155 Watt (27%)
25.5 Watt (4%)
141 Watt (24%)
Power Consumption - Cinebench R15 Multi Power Consumption - external Monitor *
162 Watt (30%)
24 Watt (4%)
133 Watt (24%)
Power Consumption - Cinebench R15 Multi Power Efficiency - external Monitor
12.8 Points per Watt (10%)
Average Benchmarks AMD Ryzen 7 1800X → 100% n=33 Average Benchmarks AMD Ryzen 3 2200U → 53% n=33 Average Benchmarks AMD Ryzen 7 1700 → 90% n=33
- Range of benchmark values for this graphics card
- Average benchmark values for this graphics card
* Smaller numbers mean a higher performance
1 This benchmark is not used for the average calculation
v1.26
log 03. 15:59:40
#0 checking url part for id 8514 +0s ... 0s
#1 checking url part for id 9670 +0s ... 0s
#2 checking url part for id 8516 +0s ... 0s
#3 not redirecting to Ajax server +0s ... 0s
#4 did not recreate cache, as it is less than 5 days old! Created at Wed, 01 May 2024 05:34:47 +0200 +0.001s ... 0.001s
#5 composed specs +0.032s ... 0.033s
#6 did output specs +0s ... 0.033s
#7 getting avg benchmarks for device 8514 +0.018s ... 0.051s
#8 got single benchmarks 8514 +0.019s ... 0.07s
#9 getting avg benchmarks for device 9670 +0.003s ... 0.073s
#10 got single benchmarks 9670 +0.025s ... 0.097s
#11 getting avg benchmarks for device 8516 +0.003s ... 0.1s
#12 got single benchmarks 8516 +0.011s ... 0.111s
#13 got avg benchmarks for devices +0s ... 0.111s
#14 min, max, avg, median took s +0.408s ... 0.519s
#15 return log +0s ... 0.519s
Please share our article, every link counts!
Redaktion, 2017-09- 8 (Update: 2023-07- 1)
 Deutsch
 English
 Español
 Français
 Italiano
 Nederlands
 Polski
 Português
 Русский
 Türkçe
 Svenska
 Chinese
 Magyar