

AMD Ryzen 5 7520U vs Intel Core 5 120U
AMD Ryzen 5 7520U
► remove from comparison
The AMD Ryzen 5 7520U is a mobile processor for cheap laptops of the Mendocino series. It integrates four older Zen 2 cores (similar to the Ryzen 4000 series like the Ryzen 3 4300U). The CPU cores clock from 2.8 GHz (base) to 4.3 GHz (single core Turbo) and can use 4 MB L3 cache. Thanks to SMT/Hyperthreading, the CPU can work on 8 threads simultaneously. The integrated memory controller only supports fast LPDDR5 memory (5500 MHz max.).
The integrated graphics adapter (Radeon 610M iGPU) uses the modern RDNA 2 architecture, but only 2 CUs (128 shaders) and clocks with up to 1.9 GHz.
Performance
The average 7520U in our extensive database is in the same league as the Core i7-1185G7, as far as multi-thread benchmark scores are concerned. This is a so-so result and indicative of a lower mid-range chip, as of Q3 2023.
Your mileage may vary depending on how high the CPU power limits are and how competent the cooling solution of your system is.
Mendocino series chips are produced on a relatively modern 6nm FinFET process at TSMC and should offer a good power efficiency. The R5 7520U is rated at 8-15 W TDP and therefore well suited for thin and light laptops.
Intel Core 5 120U
► remove from comparison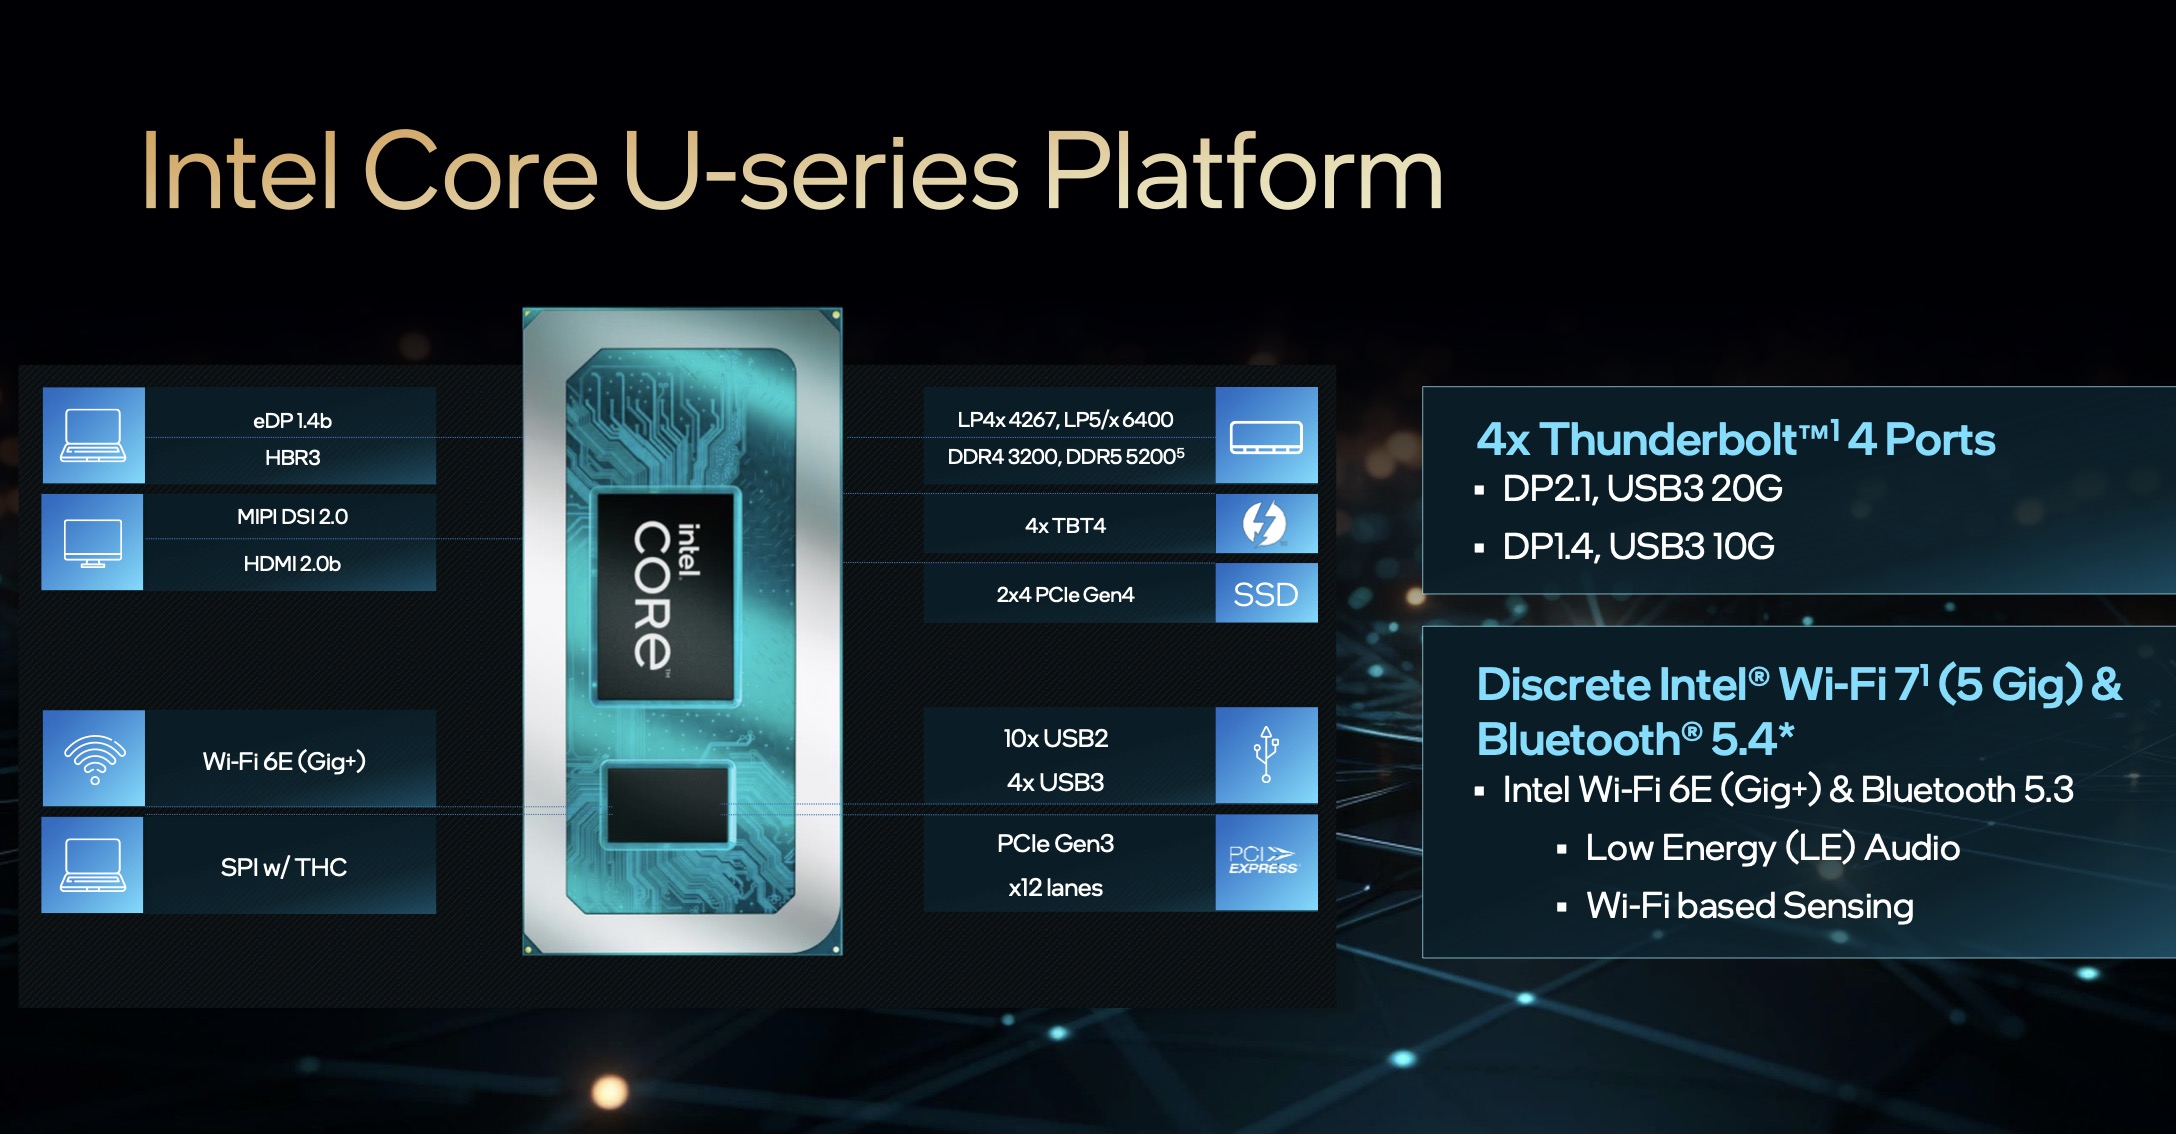
The Intel Core 5 120U is a mid-range notebook CPU based on the Raptor Lake-U Refresh (RPL-U) series (Alder Lake architecture), which was introduced in January 2024. The CPU offers 2 performance cores (P-cores, Golden Cove architecture) and 8 efficiency cores (E-cores, Gracemont architecture). The P-cores support hyperthreading (therefore 12 threads together) and clock from 1.4 to 5 GHz. The E-cores clock from 0.9 - 3.8 GHz and should offer comparable performance to old Skylake cores (e.g. i7-6300HQ). The C5 120U also supports vPro Essentials management features.
Performance
Due to the high clock rates, the performance is comparable to the old Core i7-1355U. As usual with Alder Lake, the performance is heavily dependent on the cooling and the TDP settings.
Graphics unit
Like its predecessor, Intel integrates an Intel Xe-based graphics unit in Alder Lake. 80 of the 96 EUs are activated on the 120U.
Features
Like Tiger Lake, Alder-Lake-P also has WiFi 6E and Thunderbolt 4 (4x) partially integrated. The integrated memory controller supports LPDDR5-6400 and the integrated Gaussian and Neural Accelerator (GNA) is installed in version 3.0. The Quick Sync 8 media engine is the same as in Rocket Lake and supports MPEG-2, AVC, VC-1 decode, JPEG, VP8 decode, VP9, HEVC and AV1 decode. The chip still only supports PCIe 4.0 (x8 for GPU and two x4 for SSDs).
Power consumption
The Intel Core 5 120U is specified with 15 watts (PL1) TDP and 55 watts (PL2) max. turbo power. The processor is manufactured using the further improved Intel 7 process (10 nm SuperFin).
| Model | AMD Ryzen 5 7520U | Intel Core 5 120U | ||||||||||||||||||||
| Codename | Mendocino-U (Zen 2) | Raptor Lake-U Refresh | ||||||||||||||||||||
| Series | AMD Mendocino (Zen 2, Ryzen 7020) | Intel Raptor Lake-U | ||||||||||||||||||||
| Series: Raptor Lake-U Raptor Lake-U Refresh |
|
| ||||||||||||||||||||
| Clock | 2800 - 4300 MHz | 900 - 5000 MHz | ||||||||||||||||||||
| L1 Cache | 256 KB | 928 KB | ||||||||||||||||||||
| L2 Cache | 2 MB | 9.5 MB | ||||||||||||||||||||
| L3 Cache | 4 MB | 12 MB | ||||||||||||||||||||
| Cores / Threads | 4 / 8 | 10 / 12 2 x 5.0 GHz Intel Golden Cove P-Core 8 x 3.8 GHz Intel Gracemont E-Core | ||||||||||||||||||||
| TDP | 15 Watt | 15 Watt | ||||||||||||||||||||
| Technology | 6 nm | 10 nm | ||||||||||||||||||||
| Features | LPDDR5-5500 RAM, PCIe 3, MMX (+), SSE, SSE2, SSE3, SSSE3, SSE4.1, SSE4.2, SSE4A, AES, AVX, AVX2, FMA3, SHA | Thread Director | ||||||||||||||||||||
| iGPU | AMD Radeon 610M ( - 1900 MHz) | Intel Iris Xe Graphics G7 80EUs ( - 1250 MHz) | ||||||||||||||||||||
| Architecture | x86 | x86 | ||||||||||||||||||||
| Announced | ||||||||||||||||||||||
| Manufacturer | www.amd.com | ark.intel.com | ||||||||||||||||||||
| TDP Turbo PL2 | 55 Watt | |||||||||||||||||||||
| max. Temp. | 100 °C | |||||||||||||||||||||
| Socket | BGA1700 |

Benchmarks

Average Benchmarks AMD Ryzen 5 7520U → 100% n=24
Average Benchmarks Intel Core 5 120U → 164% n=24
* Smaller numbers mean a higher performance
1 This benchmark is not used for the average calculation