Notebookcheck Logo

Intel Celeron N3060 vs Intel Pentium Silver N6000 vs Intel Celeron N5095

Intel Celeron N3060

► remove from comparison Intel N3060

The Intel Celeron N3060 is a low-end dual-core SoC for notebooks, which has been presented in April 2015. It is clocked at 1.6 - 2.48 GHz and part of the Braswell platform. Thanks to its new 14 nanometer low-power process (P1273) with tri-gate transistors, energy efficiency has been significantly improved compared to its predecessor architecture Bay Trail (e.g. Celeron N2840). The N3060 is successor (refresh) to the Celeron N3050 and compared to it it offers a improved Turbo clock rate (2.48 vs 2.1 GHZ).

In addition to the CPU cores, the SoC offers a DirectX 11.2-capable GPU as well as a DDR3L Memory Controller (2x 64 bit, 25.6 GB/s).
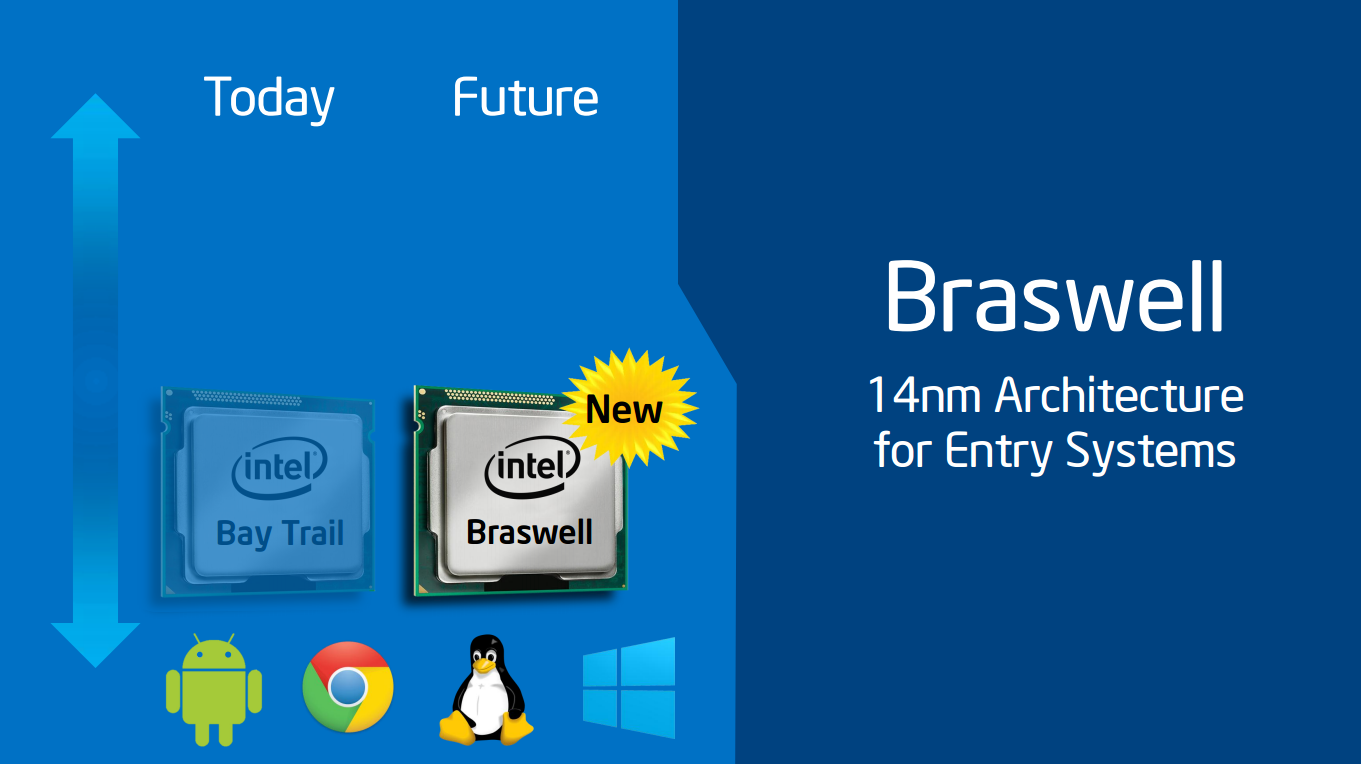
Architecture

The processor cores are based on the Airmont architecture, which is basically a slightly modified shrink of the previous Silvermont core. While performance per clock has not been improved, the more efficient 14 nm process leads to a better utilization of the CPU Burst (alias Turbo Boost) and a therefore somewhat higher overall performance.

Performance

Depending on the cooling of the SoC, the Boost clock rate of 2.48 can be held for longer periods and therefore leading to a faster performance as the older Celeron N3050 that can only reach 2.16 GHz. Using Windows, the CPU is adequate for simple everyday tasks such as light Internet browsing or office applications, but not for complex software or modern games.

Graphics

The HD Graphics 400 (Braswell) is based on the Intel Gen8 architecture, which supports DirectX 11.2 and is also found in the Broadwell series (e.g. HD Graphics 5300). With 12 EUs (Execution Units) and a clock speed of up to 600 MHz, the GPU is almost twice as fast as the HD Graphics (Bay Trail), but still not powerful enough to handle modern 3D games. The GPU also supports 4K/H.265 video acceleration. Although featuring a different name, the GPU was not changed from the N3050 (named HD Graphics alone).

Power Consumption

The entire SoC is rated at an TDP of 6 watts (SDP 4 watts). Thus, the chip can be cooled passively.

Intel Pentium Silver N6000

► remove from comparison Intel Pentium N6000

The Intel Pentium Silver N6000 is a quad-core SoC of the Jasper Lake series that is primarily intended for inexpensive notebooks and was announced in early 2021. The four Tremont CPU cores clock between 1.1 and 3.3 GHz (single core Burst) and offer no HyperThreading (SMT). The N6000 uses 1.5 MB L2 and 4 MB L3 cache. The chip is manufactured on the first-gen 10 nm Intel process, the same process as Ice Lake.

Architecture

The processor architecture is called Tremont and a complete redesign compared to the old Golmont Plus cores in the predecessor. According to Intel, the single thread performance of a core could be improved by 30% on average (10 - 80% in all tests of SPECint and SPECfp).

Features

In addition to the four CPU cores, the SoC integrates a 32 EU Intel UHD Graphics GPU clocked from 350 - 850 MHz and a dual-channel DDR4 / quad-channel LPDDR4x memory controller (up to 16 GB and 2933 MHz). The chip now also partly integrates Wi-Fi 6 (Gig+), 8 PCIe 3.0 lanes, 14 USB 2.0/ 3.2 ports and two SATA 6.0 ports. The package got bigger and measures 35 x 24 mm (compared to 25 x 24 mm for the N5030 e.g.). The SoC is directly soldered to the mainboard (BGA) and can't be easily replaced.

Performance

The average N6000 in our database proves to be an OK entry-level processor, as of late 2022, its multi-thread benchmark scores nearly matching those of the AMD Ryzen 3 3200U. Yes, the chip is a whole lot slower than the latest Ryzen 3 and Core i3 processors, but it will at least let you run your day-to-day apps without annoying slowdowns.

The Asus Vivobook 13 Slate is among the fastest systems built around the N6000 that we know of, thanks to the long-term CPU power limit of 10 W. It can be more than 20% faster in CPU-bound workloads than the slowest system featuring the same chip in our database, as of August 2023.

Power consumption

Like nearly all other N-class Intel processors, the Pentium N6000 has a default TDP of 6 W (also known as the long-term power limit). This is low and thus good enough for passively cooled tablets, laptops, mini-PCs.

The SoC is built with Intel's 2nd generation 10 nm process (not 10 nm SuperFin or Intel 7) for low, as of mid 2023, energy efficiency.

Intel Celeron N5095

► remove from comparison Intel Celeron N5095

The Celeron N5095 is an inexpensive quad-core SoC of the Jasper Lake product family designed for use in affordable SFF desktops and laptops. It features four Tremont CPU cores running at 2 GHz that Boost to up to 2.9 GHz with no thread-doubling Hyper-Threading technology in sight. A pretty basic iGPU is present as well.

The only difference between the N5095 and the N5095A is that the latter comes with support for more proprietary Intel technologies such as the Smart Sound DSP, Wake on Voice and HD Audio.

Architecture and Features

Tremont brings many improvements over Goldmont Plus, the architecture that we know from the N5030 and myriads of other N-class CPUs. An up to 30% boost in single-thread performance is to be expected thanks to smarter prefetchers, branch prediction improvements and other refinements, according to Intel. These new chips are physically larger than their immediate predecessors as a result. Either way, this is still a "small" core rather than a "big" one according to ChipsAndCheese.

The Celeron has 1.5 MB of L2 and 4 MB of L3 cache and is compatible with DDR4-2933 and LPDDR4x-2933 memory or slower. Support for Intel CNVi Wi-Fi 6 modules is baked into the chip, as are 8 PCIe 3.0 lanes for NVMe SSD speeds up to 3.9 GB/s. USB 4 or Thunderbolt aren't supported however.

Please also note that the Celeron gets soldered to the motherboard (BGA1338 socket interface) for good and is thus not user-replaceable.

Performance

The average N5095 in our database is about as fast as the Core i3-10110U, Core i3-1005G1, Celeron N5105 and also the Ryzen 3 3200U in multi-threaded workloads. Which is just enough for the most basic of tasks in late 2024.

Performance will get a significant hit if the power target is set to 10 W or 6 W instead of the Intel-recommended 15 W value.

Graphics

The DirectX 12.1-capable 16 EU UHD Graphics runs at up to 750 MHz and is in many respects similar to what Ice Lake CPUs come equipped with. This graphics adapter is capable of driving up to 3 SUHD displays simultaneously; HEVC, AVC, VP9, MPEG-2 and other popular video codecs can all be hardware-decoded. AV1 and VVC can't.

As far as gaming is concerned, it is reasonable to expect playable framerates in really old games (like Dota 2 Reborn) provided one sticks to lower resolutions such as HD 720p.

Power consumption

While most N-class chips have a 6 W long-term power target, the Celeron N5095 has a 15 W TDP to mimic much faster U-class Core processors. This isn't a great CPU for passively cooled designs.

The N5095 is built with the same 10 nm Intel process as Ice Lake-U processors for pretty unimpressive power efficiency, as of late 2024.

ModelIntel Celeron N3060Intel Pentium Silver N6000Intel Celeron N5095
CodenameBraswellJasper LakeJasper Lake
SeriesIntel CeleronIntel Jasper LakeIntel Jasper Lake
Series: Jasper Lake Jasper Lake
Intel Celeron N31601.6 - 2.24 GHz4 / 4 cores
Intel Celeron N31501.6 - 2.08 GHz4 / 4 cores
Intel Celeron N3060 « 1.6 - 2.48 GHz2 / 2 cores
Intel Celeron N30501.6 - 2.16 GHz2 / 2 cores
Intel Celeron N30001.04 - 2.08 GHz2 / 2 cores
Intel Pentium Silver N60052 - 3.3 GHz4 / 4 cores4 MB L3
Intel Pentium Silver N6000 « 1.1 - 3.3 GHz4 / 4 cores4 MB L3
Intel Celeron N5095A2 - 2.9 GHz4 / 4 cores4 MB L3
Intel Celeron N50952 - 2.9 GHz4 / 4 cores4 MB L3
Intel Celeron N51052 - 2.9 GHz4 / 4 cores4 MB L3
Intel Celeron N51001.1 - 2.8 GHz4 / 4 cores4 MB L3
Intel Celeron N45052 - 2.9 GHz2 / 2 cores4 MB L3
Intel Celeron N45001.1 - 2.8 GHz2 / 2 cores4 MB L3
Intel Pentium Silver N60052 - 3.3 GHz4 / 4 cores4 MB L3
Intel Pentium Silver N60001.1 - 3.3 GHz4 / 4 cores4 MB L3
Intel Celeron N5095A2 - 2.9 GHz4 / 4 cores4 MB L3
Intel Celeron N5095 « 2 - 2.9 GHz4 / 4 cores4 MB L3
Intel Celeron N51052 - 2.9 GHz4 / 4 cores4 MB L3
Intel Celeron N51001.1 - 2.8 GHz4 / 4 cores4 MB L3
Intel Celeron N45052 - 2.9 GHz2 / 2 cores4 MB L3
Intel Celeron N45001.1 - 2.8 GHz2 / 2 cores4 MB L3
Clock1600 - 2480 MHz1100 - 3300 MHz2000 - 2900 MHz
L2 Cache2 MB1.5 MB1.5 MB
Cores / Threads2 / 24 / 44 / 4
4 x 2.9 GHz Intel Tremont
TDP6 Watt6 Watt15 Watt
Technology14 nm10 nm10 nm
max. Temp.90 °C105 °C105 °C
SocketFCBGA1170BGA1338BGA1338
FeaturesIntel HD Graphics 400 (Braswell, 12 EUs, 320 - 700 MHz), Wireless Display, Quick Sync, AES-NI, max. 8 GB Dual-Channel DDR3L-1600 (25,6 GB/s), 5x USB 3.0, 4x PCIe 2.0, 2x SATA 6.0 Gbit/sDDR4-2933/LPDDR4x-2933 RAM, PCIe 3 x 8, GNA, MMX, SSE, SSE2, SSE3, SSSE3, SSE4.1, SSE4.2, SMEP, SMAP, EIST, TM1, TM2, Turbo, SST, AES-NI, RDRAND, RDSEED, SHADDR4-2933/LPDDR4x-2933 RAM, PCIe 3, GNA, MMX, SSE, SSE2, SSE3, SSSE3, SSE4.1, SSE4.2, VMX, SMEP, SMAP, EIST, TM1, TM2, Turbo, SST, AES-NI, RDRAND, RDSEED, SHA
iGPUIntel HD Graphics 400 (Braswell) (320 - 700 MHz)Intel UHD Graphics (Jasper Lake 32 EU) (350 - 850 MHz)Intel UHD Graphics (Jasper Lake 16 EU) (450 - 750 MHz)
Architecturex86x86x86
$107 U.S.
Announced
Manufacturerark.intel.comark.intel.comark.intel.com
L3 Cache4 MB4 MB

Benchmarks

Performance Rating - CB R15 + R20 + 7-Zip + X265 + Blender + 3DM11 CPU - Pentium N6000
21 pt (35%)
Restrict / Search: Model: Max. age: years
Performance Rating - CB R15 + R20 + 7-Zip + X265 + Blender + 3DM11 CPU - Celeron N5095
20.6 pt (34%)
Restrict / Search: Model: Max. age: years
Cinebench R23 - Cinebench R23 Multi Core
min: 1610     avg: 1730     median: 1699 (2%)     max: 1911 Points
min: 2150     avg: 2174     median: 2164 (2%)     max: 2219 Points
Cinebench R23 - Cinebench R23 Single Core
min: 653     avg: 669     median: 672.5 (28%)     max: 679 Points
min: 587     avg: 608     median: 611 (26%)     max: 621 Points
Cinebench R20 - Cinebench R20 CPU (Single Core)
min: 237     avg: 253.8     median: 255 (28%)     max: 268 Points
min: 228     avg: 234     median: 234 (25%)     max: 239 Points
Cinebench R20 - Cinebench R20 CPU (Multi Core)
min: 595     avg: 657     median: 650.5 (2%)     max: 730 Points
min: 804     avg: 825     median: 827 (2%)     max: 844 Points
Cinebench R15 - Cinebench R15 CPU Multi 64 Bit
min: 68     avg: 71.8     median: 72.5 (0%)     max: 74 Points
min: 266     avg: 292.5     median: 291 (2%)     max: 322 Points
min: 221     avg: 343     median: 364 (2%)     max: 379 Points
Cinebench R15 - Cinebench R15 CPU Single 64 Bit
min: 36     avg: 37.8     median: 38 (11%)     max: 39 Points
min: 109     avg: 114.3     median: 113.7 (31%)     max: 121 Points
min: 95.4     avg: 103.9     median: 106 (29%)     max: 109 Points
Cinebench R11.5 - Cinebench R11.5 CPU Multi 64 Bit
min: 0.8     avg: 0.8     median: 0.8 (1%)     max: 0.86 Points
min: 3.47     avg: 3.6     median: 3.6 (5%)     max: 3.71 Points
min: 4.65     avg: 4.7     median: 4.7 (6%)     max: 4.76 Points
Cinebench R11.5 - Cinebench R11.5 CPU Single 64 Bit
min: 0.41     avg: 0.4     median: 0.4 (10%)     max: 0.46 Points
min: 1.36     avg: 1.4     median: 1.4 (33%)     max: 1.46 Points
min: 1.25     avg: 1.3     median: 1.3 (30%)     max: 1.29 Points
Cinebench R10 - Cinebench R10 Rend. Single (32bit)
min: 1216     avg: 1253     median: 1267 (8%)     max: 1275 Points
min: 4057     avg: 4132     median: 4131.5 (25%)     max: 4206 Points
min: 3527     avg: 3545     median: 3544.5 (21%)     max: 3562 Points
Cinebench R10 - Cinebench R10 Rend. Multi (32bit)
min: 2256     avg: 2352     median: 2397 (2%)     max: 2402 Points
min: 9343     avg: 9643     median: 9642.5 (7%)     max: 9942 Points
min: 12218     avg: 12283     median: 12283 (9%)     max: 12348 Points
Cinebench R10 - Cinebench R10 Rend. Multi (64bit)
100%
1 N3060 +
3426 Points (2%)
min: 16442     avg: 16860     median: 16860 (11%)     max: 17278 Points
Cinebench R10 - Cinebench R10 Rend. Single (64bit)
100%
1 N3060 +
1800 Points (2%)
min: 5224     avg: 5338     median: 5337.5 (7%)     max: 5451 Points
wPrime 2.10 - wPrime 2.0 1024m *
1361 s (16%)
727 s (9%)
min: 605.375     avg: 611     median: 611.4 (7%)     max: 617.326 s
wPrime 2.10 - wPrime 2.0 32m *
43.1 s (9%)
16.9 s (3%)
min: 19.202     avg: 19.5     median: 19.5 (4%)     max: 19.779 s
WinRAR - WinRAR 4.0
1330 Points (2%)
min: 1630     avg: 1706     median: 1705.5 (3%)     max: 1781 Points
7-Zip 18.03 - 7-Zip 18.03 Multi Thread 4 runs
min: 8096     avg: 8953     median: 9212 (5%)     max: 9668 MIPS
min: 10924     avg: 11024     median: 11013 (6%)     max: 11168 MIPS
7-Zip 18.03 - 7-Zip 18.03 Single Thread 4 runs
min: 2320     avg: 2934     median: 3305 (39%)     max: 3387 MIPS
min: 2935     avg: 3074     median: 3100 (37%)     max: 3124 MIPS
X264 HD Benchmark 4.0 - x264 Pass 2
5.5 fps (0%)
18.4 fps (0%)
min: 24.75     avg: 25     median: 25 (1%)     max: 25.25 fps
X264 HD Benchmark 4.0 - x264 Pass 1
28.4 fps (1%)
93.4 fps (2%)
min: 112.75     avg: 116.5     median: 116.5 (3%)     max: 120.25 fps
HWBOT x265 Benchmark v2.2 - HWBOT x265 4k Preset
min: 1.55     avg: 1.6     median: 1.6 (3%)     max: 1.76 fps
min: 1.9     avg: 2     median: 2 (4%)     max: 2.05 fps
TrueCrypt - TrueCrypt Serpent
0.1 GB/s (2%)
0.2 GB/s (6%)
0.2 GB/s (6%)
TrueCrypt - TrueCrypt Twofish
0.1 GB/s (2%)
0.4 GB/s (7%)
0.4 GB/s (6%)
TrueCrypt - TrueCrypt AES
0.5 GB/s (1%)
2.8 GB/s (7%)
2.5 GB/s (7%)
Blender - Blender 3.3 Classroom CPU *
3786 Seconds (48%)
2936 Seconds (37%)
Blender - Blender 2.79 BMW27 CPU *
min: 1738     avg: 2163     median: 1935 (14%)     max: 3157 Seconds
min: 1502     avg: 1548     median: 1547 (11%)     max: 1624 Seconds
R Benchmark 2.5 - R Benchmark 2.5 *
min: 1.084     avg: 1.2     median: 1.2 (26%)     max: 1.278 sec
min: 1.16     avg: 1.2     median: 1.2 (25%)     max: 1.2 sec
3DMark 06 - CPU - 3DMark 06 - CPU
3985 Points (8%)
min: 5266     avg: 5272     median: 5272 (11%)     max: 5278 Points
Super Pi mod 1.5 XS 1M - Super Pi mod 1.5 XS 1M *
27.5 s (6%)
17.5 s (4%)
20.5 s (4%)
Super Pi mod 1.5 XS 2M - Super Pi mod 1.5 XS 2M *
100%
1 N3060 +
61.2 s (3%)
45.7 s (2%)
Super Pi Mod 1.5 XS 32M - Super Pi mod 1.5 XS 32M *
1566 s (7%)
895 s (4%)
1039 s (5%)
3DMark 11 - 3DM11 Performance Physics
min: 918     avg: 995     median: 993 (2%)     max: 1076 Points
min: 3134     avg: 3617     median: 3563 (9%)     max: 4155 Points
min: 4224     avg: 4309     median: 4287 (11%)     max: 4439 Points
3DMark - 3DMark Ice Storm Physics
10140 Points (8%)
min: 30345     avg: 32921     median: 32921 (27%)     max: 35497 Points
min: 41689     avg: 42092     median: 42091.5 (34%)     max: 42494 Points
3DMark - 3DMark Ice Storm Extreme Physics
8087 Points (7%)
min: 30120     avg: 32790     median: 32790 (27%)     max: 35460 Points
min: 41654     avg: 42066     median: 42065.5 (34%)     max: 42477 Points
3DMark - 3DMark Ice Storm Unlimited Physics
min: 10498     avg: 11007     median: 11006.5 (9%)     max: 11515 Points
min: 38897     avg: 43994     median: 43993.5 (35%)     max: 49090 Points
min: 46730     avg: 47458     median: 47458 (38%)     max: 48186 Points
3DMark - 3DMark Cloud Gate Physics
min: 668     avg: 735     median: 735 (2%)     max: 802 Points
min: 2524     avg: 2897     median: 2947 (7%)     max: 3220 Points
min: 3720     avg: 3823     median: 3846 (10%)     max: 3888 Points
3DMark - 3DMark Fire Strike Standard Physics
1124 Points (2%)
min: 3838     avg: 4315     median: 4063 (7%)     max: 5296 Points
min: 5400     avg: 5496     median: 5499 (10%)     max: 5572 Points
3DMark - 3DMark Time Spy CPU
min: 1161     avg: 1301     median: 1259.5 (5%)     max: 1523 Points
min: 1595     avg: 1649     median: 1656 (7%)     max: 1696 Points
Geekbench 6.5 - Geekbench 6.5 Single-Core
569 Points (14%)
520 Points (13%)
Geekbench 6.5 - Geekbench 6.5 Multi-Core
1376 Points (5%)
1529 Points (6%)
Geekbench 5.5 - Geekbench 5.1 - 5.5 64 Bit Single-Core
min: 720     avg: 728     median: 727 (28%)     max: 736 Points
min: 637     avg: 649     median: 650.5 (25%)     max: 659 Points
Geekbench 5.5 - Geekbench 5.1 - 5.5 64 Bit Multi-Core
min: 1784     avg: 1912     median: 1915 (3%)     max: 2004 Points
min: 1933     avg: 2010     median: 2028 (4%)     max: 2052 Points
Geekbench 5.0 - Geekbench 5.0 64 Bit Single-Core
min: 723     avg: 725     median: 724.5 (3%)     max: 726 Points
min: 628     avg: 644     median: 646.5 (3%)     max: 655 Points
Geekbench 5.0 - Geekbench 5.0 64 Bit Multi-Core
min: 1881     avg: 1912     median: 1911.5 (6%)     max: 1942 Points
min: 1985     avg: 2029     median: 2030.5 (6%)     max: 2070 Points
Geekbench 4.4 - Geekbench 4.1 - 4.4 64 Bit Single-Core
1127 Points (11%)
3188 Points (32%)
min: 2858     avg: 2896     median: 2900 (29%)     max: 2929 Points
Geekbench 4.4 - Geekbench 4.1 - 4.4 64 Bit Multi-Core
1911 Points (2%)
8341 Points (8%)
min: 7759     avg: 7856     median: 7842 (8%)     max: 7968 Points
Geekbench 4.0 - Geekbench 4.0 64 Bit Single-Core
100%
1 N3060 +
1087 Points (12%)
Geekbench 4.0 - Geekbench 4.0 64 Bit Multi-Core
100%
1 N3060 +
1834 Points (2%)
Geekbench 3 - Geekbench 3 32 Bit Multi-Core
100%
1 N3060 +
1708 Points (3%)
Geekbench 3 - Geekbench 3 32 Bit Single-Core
100%
1 N3060 +
913 Points (12%)
Mozilla Kraken 1.1 - Kraken 1.1 Total Score *
min: 4901     avg: 4929     median: 4928.5 (6%)     max: 4956 ms
min: 1388     avg: 1412     median: 1405 (2%)     max: 1451 ms
min: 1557     avg: 1578     median: 1571.5 (2%)     max: 1619 ms
Sunspider - Sunspider 1.0 Total Score *
100%
1 N3060 +
min: 366.5     avg: 785     median: 976 (11%)     max: 1013 ms
293.2 ms (3%)
Octane V2 - Octane V2 Total Score
100%
1 N3060 +
min: 7341     avg: 7793     median: 7735 (6%)     max: 8303 Points
min: 25840     avg: 32251     median: 34145.5 (25%)     max: 34874 Points
WebXPRT 4 - WebXPRT 4 Score
104.2 Points (29%)
min: 94.2     avg: 95.2     median: 95.2 (26%)     max: 96.2 Points
WebXPRT 3 - WebXPRT 3 Score
min: 138.4     avg: 143.8     median: 146 (26%)     max: 147 Points
min: 114.3     avg: 123.4     median: 125.3 (22%)     max: 127.2 Points
CrossMark - CrossMark Overall
min: 440     avg: 469     median: 469 (18%)     max: 498 Points
min: 473     avg: 486     median: 490 (18%)     max: 495 Points
Power Consumption - Prime95 Power Consumption - external Monitor *
min: 11.3     avg: 12     median: 12 (2%)     max: 12.6 Watt
min: 24.1     avg: 24.4     median: 24.4 (4%)     max: 24.8 Watt
Power Consumption - Cinebench R15 Multi Power Consumption - external Monitor *
min: 10.5     avg: 13.3     median: 12.9 (2%)     max: 16.4 Watt
min: 20.7     avg: 22     median: 22.1 (4%)     max: 23 Watt
Power Consumption - Idle Power Consumption - external Monitor *
3.1 Watt (2%)
4.9 Watt (3%)
Power Consumption - Idle Power Consumption 150cd 1min *
min: 3.37     avg: 5.4     median: 4.8 (6%)     max: 8.08 Watt
Power Consumption - Power Efficiency - Cinebench R15 Multi external Monitor
min: 19.6     avg: 22.3     median: 20.6 (15%)     max: 26.7 Points per Watt
min: 15.6     avg: 17     median: 17.2 (13%)     max: 18.3 Points per Watt

Average Benchmarks Intel Celeron N3060 → 100% n=24

Average Benchmarks Intel Pentium Silver N6000 → 346% n=24

Average Benchmarks Intel Celeron N5095 → 377% n=24

- Range of benchmark values for this graphics card
red legend - Average benchmark values for this graphics card
* Smaller numbers mean a higher performance
1 This benchmark is not used for the average calculation

v1.34
log 04. 17:10:31

#0 ran 0s before starting gpusingle class +0s ... 0s

#1 checking url part for id 8067 +0s ... 0s

#2 checking url part for id 13075 +0s ... 0s

#3 checking url part for id 13189 +0s ... 0s

#4 redirected to Ajax server, took 1759590631s time from redirect:0 +0s ... 0s

#5 did not recreate cache, as it is less than 5 days old! Created at Sat, 04 Oct 2025 05:18:30 +0200 +0s ... 0s

#6 composed specs +0.009s ... 0.01s

#7 did output specs +0s ... 0.01s

#8 getting avg benchmarks for device 8067 +0.001s ... 0.01s

#9 got single benchmarks 8067 +0.017s ... 0.027s

#10 getting avg benchmarks for device 13075 +0.003s ... 0.03s

#11 got single benchmarks 13075 +0.009s ... 0.039s

#12 getting avg benchmarks for device 13189 +0.003s ... 0.042s

#13 got single benchmarks 13189 +0.007s ... 0.049s

#14 got avg benchmarks for devices +0s ... 0.049s

#15 min, max, avg, median took s +0.059s ... 0.108s

#16 return log +0s ... 0.108s

Please share our article, every link counts!
Mail Logo
> Expert Reviews and News on Laptops, Smartphones and Tech Innovations > Benchmarks / Tech > Processor Comparison - Head 2 Head
Redaktion, 2017-09- 8 (Update: 2023-07- 1)