Notebookcheck Logo

Mediatek MT8183 vs Intel Atom x5-Z8550

Mediatek MT8183

► remove from comparison  MT8183

The Mediatek MT8183 is a mainstream ARM SoC (System on a Chip) that was introduced in Late 2019 and is primarily used for Android based tablets. It is manufactured in a 12 nm process (unverified) and has a total of eight CPU cores with four powerful Cortex-A73 and four small Cortex-A53 cores in a big.LITTLE configuration. The integrated graphics card is a ARM Mali-G72 with three clusters (MP3).

Features

Besides CPU and GPU, the chip is also equipped with an LPDDR3/LPDDR4x memory controller, a Wi-Fi 5 (a/b/g/n/ac) modem (but no cellular modem). Furthermore, Mediatek states that it integrated an AI accelerator with a performance of 0.5 TOPS.

The maximum display resolution is only 2,400 x 1,080 pixels.

Intel Atom x5-Z8550

► remove from comparison Intel Z8550

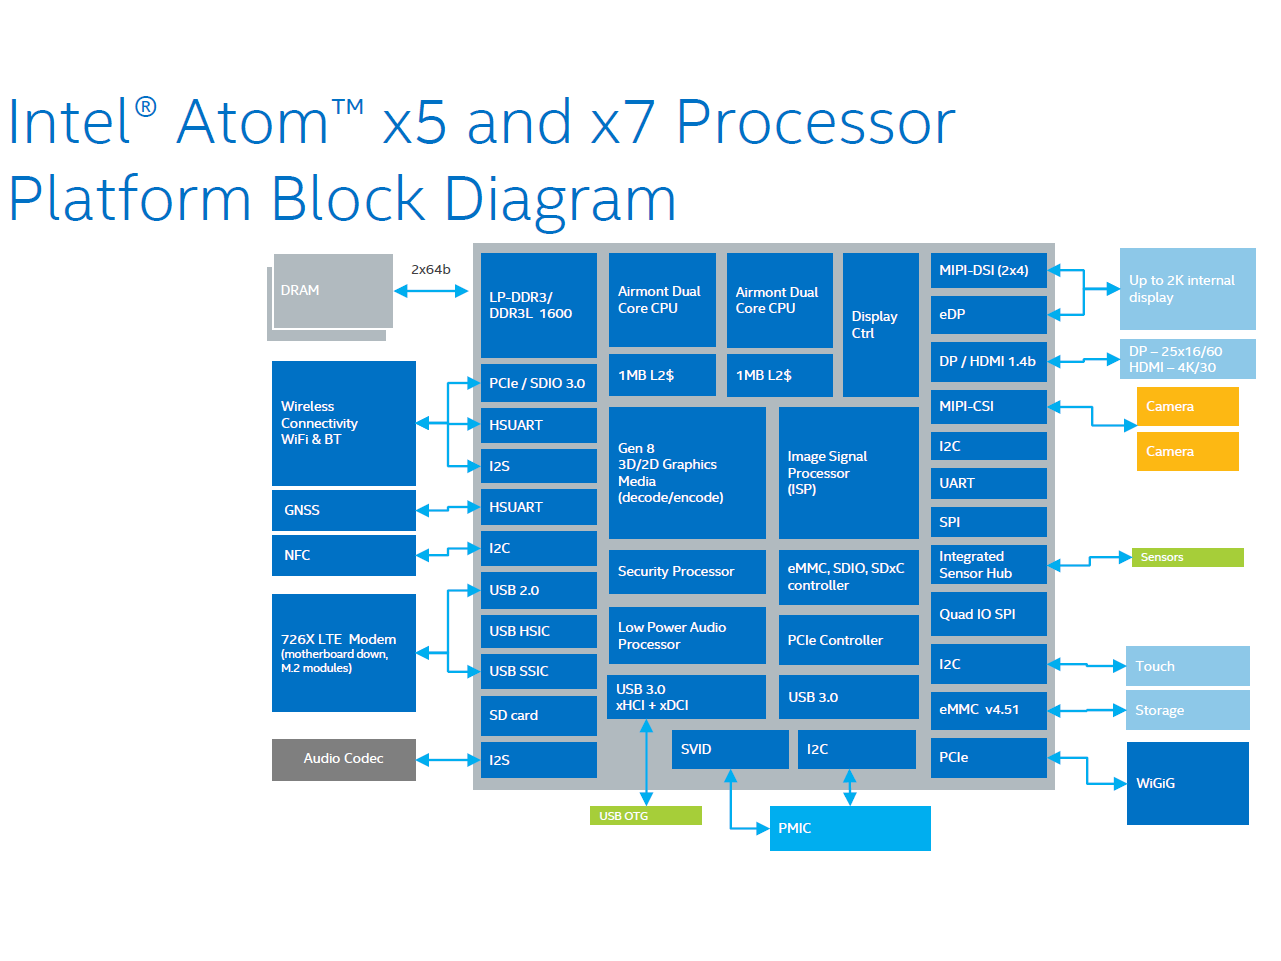
The Intel Atom x5-Z8550 is a power efficient quad-core SoC for Windows and Android devices (tablets and convertibles), which has been presented in February 2016. It is clocked at 1.44 - 2.4 GHz and part of the Cherry Trail platform. Thanks to its new 14 nanometer low-power process (P1273) with tri-gate transistors, energy efficiency has been significantly improved over its predecessor Bay Trail-T (e.g. Atom Z3795). In addition to the CPU cores, the SoC offers a DirectX 11.2-capable GPU as well as a LPDDR3 Memory Controller (2x 64 bit, 25.6 GB/s). Compared to the previous year x5-Z8500, the boost clock speed gained 160 MHz (from 2.24 to 2.4 GHz).

Architecture

The processor cores are based on the Airmont architecture, which is basically a slightly modified shrink of the previous Silvermont core. While performance per clock has not been improved, the more efficient 14 nm process may lead to a better utilization of the CPU Burst (alias Turbo Boost) and therefore a somewhat higher performance in certain situations.

Performance

Compared to the Atom x7-Z8700, the Atom x5-Z8550 offers a similar boost speed and should therefore perform on a similar level. Compared to ARM-based SoCs it should offer a similar performance as a Qualcomm Snapdragon 810 (CPU wise). 

Using Windows, the chip is adequate for everyday tasks such as Internet or Office, but not for very complex software or modern games.

Graphics

The HD Graphics (Cherry Trail) was renamed to Intel HD Graphics 400 in this generation. It is still based on the Intel Gen8 architecture, which supports DirectX 11.2 and is also found in the Broadwell series (e.g. HD Graphics 5300). With 12 EUs (Execution Units) and a clock speed of up to 600 MHz, the GPU is about twice as fast as the HD Graphics (Bay Trail) and will handle older and less demandig Windows games (e.g. Counter-Strike: GO) in very low settings at decent frame rates. The GPU also supports 4K/H.265 video acceleration.

Compared to ARM SoCs, the HD Graphics offers a performance similar to the Qualcomm Adreno 330 or PowerVR G6430.

Power Consumption

The entire SoC is rated at an SDP of 2 watts, which indicates a TDP of less than 4 watts. Thus, the chip can be used in passively cooled tablets.

ModelMediatek MT8183Intel Atom x5-Z8550
CodenameCortex-A73/-A53Cherry Trail
Series Mediatek MT8Intel Atom x5
Clock2000 MHz1440 - 2400 MHz
Cores / Threads8 / 84 / 4
Technology12 nm14 nm
Features32 MP Camera ISP, 1080p H.264 Video Encoder, H.265 DecoderIntel HD Graphics (Cherry Trail, 200 - 600 MHz), Wireless Display, AES-NI, max. 8 GB Dual-Channel LPDDR3-1600 (25,6 GB/s), 3x USB 3.0, 2x PCIe 2.0
iGPUARM Mali-G72 MP3Intel HD Graphics 400 (Braswell) (200 - 600 MHz)
ArchitectureARMx86
Announced
Series: Atom x5 Cherry Trail
Intel Atom x5-Z8550 « 1.44 - 2.4 GHz4 / 4 cores
Intel Atom x5-Z8500 compare1.44 - 2.24 GHz4 / 4 cores
Intel Atom x5-Z8350 compare1.44 - 1.92 GHz4 / 4 cores
Intel Atom x5-Z8300 compare1.44 - 1.84 GHz4 / 4 cores
Intel Atom x5-E8000 compare1.04 - 2 GHz4 / 4 cores
L2 Cache2 MB
max. Temp.90 °C
Manufacturerark.intel.com

Benchmarks

Performance Rating - Geekbench 5.5, PCM Work, Sling Shot Physics, Antutu v8 CPU - MT8183
0.5 pt (36%)
Restrict / Search: Model: Max. age: years
Cinebench R15 - Cinebench R15 CPU Multi 64 Bit
100%
1 Z8550 +
134 Points (1%)
Cinebench R15 - Cinebench R15 CPU Single 64 Bit
100%
1 Z8550 +
36 Points (10%)
3DMark 11 - 3DM11 Performance Physics
100%
1 Z8550 +
1737 Points (4%)
3DMark - 3DMark Ice Storm Unlimited Physics
min: 15776     avg: 18163     median: 18829 (16%)     max: 19883 Points
13056 Points (11%)
3DMark - 3DMark Cloud Gate Physics
100%
1 Z8550 +
1369 Points (3%)
3DMark - 3DMark Sling Shot Extreme (ES 3.1) Unlimited Physics
min: 2085     avg: 2543     median: 2560.5 (24%)     max: 2966 Points
1520 Points (14%)
3DMark - 3DMark Sling Shot (ES 3.0) Unlimited Physics
min: 2322     avg: 2590     median: 2543 (29%)     max: 2963 Points
1642 Points (19%)
Geekbench 6.4 - Geekbench 6.4 Single-Core
100%
1 MT8183 +
323 Points (8%)
Geekbench 6.4 - Geekbench 6.4 Multi-Core
100%
1 MT8183 +
1214 Points (5%)
Geekbench 5.5 - Geekbench 5.1 - 5.5 64 Bit Single-Core
100%
1 MT8183 +
min: 260     avg: 292.8     median: 300 (12%)     max: 305 Points
Geekbench 5.5 - Geekbench 5.1 - 5.5 64 Bit Multi-Core
100%
1 MT8183 +
min: 909     avg: 1208     median: 1293 (2%)     max: 1430 Points
Geekbench 5.0 - Geekbench 5.0 64 Bit Single-Core
0 Points (0%)
Geekbench 5.0 - Geekbench 5.0 64 Bit Multi-Core
0 Points (0%)
Geekbench 4.4 - Geekbench 4.1 - 4.4 64 Bit Single-Core
100%
1 MT8183 +
min: 1397     avg: 1431     median: 1430.5 (14%)     max: 1464 Points
Geekbench 4.4 - Geekbench 4.1 - 4.4 64 Bit Multi-Core
100%
1 MT8183 +
min: 5308     avg: 5377     median: 5376.5 (5%)     max: 5445 Points
Geekbench 4.0 - Geekbench 4.0 64 Bit Single-Core
1395 Points (15%)
1025 Points (11%)
Geekbench 4.0 - Geekbench 4.0 64 Bit Multi-Core
4968 Points (7%)
3118 Points (4%)
Geekbench 3 - Geekbench 3 64 Bit Multi-Core
100%
1 MT8183 +
min: 5754     avg: 6212     median: 6212 (10%)     max: 6670 Points
Geekbench 3 - Geekbench 3 64 Bit Single-Core
100%
1 MT8183 +
min: 1410     avg: 1469     median: 1468.5 (22%)     max: 1527 Points
Geekbench 2 - 32 Bit - Geekbench Stream
100%
1 MT8183 +
805 Points (6%)
Geekbench 2 - 32 Bit - Geekbench Memory
100%
1 MT8183 +
1718 Points (16%)
Geekbench 2 - 32 Bit - Geekbench Floating Point
100%
1 MT8183 +
10758 Points (21%)
Geekbench 2 - 32 Bit - Geekbench Integer
100%
1 MT8183 +
5381 Points (11%)
Geekbench 2 - 32 Bit - Geekbench Total Score
100%
1 MT8183 +
6072 Points (16%)
Mozilla Kraken 1.1 - Kraken 1.1 Total Score *
min: 3957     avg: 4403     median: 4337.5 (5%)     max: 4979 ms
4419 ms (5%)
Octane V2 - Octane V2 Total Score
min: 8665     avg: 9742     median: 9822 (7%)     max: 10670 Points
8060 Points (6%)
WebXPRT 3 - WebXPRT 3 Score
100%
1 MT8183 +
min: 46     avg: 54.3     median: 55.5 (10%)     max: 60 Points
AnTuTu v6 - AnTuTu v6 Total Score
100%
1 Z8550 +
88989 Points (30%)
AnTuTu v7 - AnTuTu v7 MEM
0 Points (0%)
AnTuTu v7 - AnTuTu v7 UX
0 Points (0%)
AnTuTu v7 - AnTuTu v7 GPU
0 Points (0%)
AnTuTu v7 - AnTuTu v7 CPU
0 Points (0%)
AnTuTu v7 - AnTuTu v7 Total Score
0 Points (0%)
AnTuTu v8 - AnTuTu v8 UX
100%
1 MT8183 +
32912 Points (28%)
AnTuTu v8 - AnTuTu v8 MEM
100%
1 MT8183 +
32293 Points (26%)
AnTuTu v8 - AnTuTu v8 GPU
100%
1 MT8183 +
25424 Points (5%)
AnTuTu v8 - AnTuTu v8 CPU
100%
1 MT8183 +
67925 Points (25%)
AnTuTu v8 - AnTuTu v8 Total Score
100%
1 MT8183 +
158554 Points (15%)
Antutu v9 - AnTuTu v9 Total Score
100%
1 MT8183 +
160693 Points (8%)
Antutu v9 - AnTuTu v9 CPU
100%
1 MT8183 +
69184 Points (17%)
PassMark PerformanceTest Mobile V1 - PerformanceTest Mobile V1 CPU Tests
100%
1 MT8183 +
175006 Points (23%)
PCMark for Android - PCM f. Android Storage 2.0 score
100%
1 MT8183 +
min: 6087     avg: 13047     median: 13046.5 (6%)     max: 20006 Points
PCMark for Android - PCM f. Android Work Score 3.0
100%
1 MT8183 +
min: 5224     avg: 5900     median: 5830.5 (21%)     max: 6716 Points
PCMark for Android - PCM f. Android Computer Vision
100%
1 MT8183 +
min: 2714     avg: 3143     median: 3143 (17%)     max: 3572 Points
PCMark for Android - PCM f. Android Storage
100%
1 MT8183 +
min: 6470     avg: 11152     median: 11152 (24%)     max: 15834 Points
PCMark for Android - PCM f. Android Work Score 2.0
100%
1 MT8183 +
min: 5056     avg: 5633     median: 5264 (34%)     max: 6735 Points
PCMark for Android - PCM f. Android Work Score
min: 6284     avg: 7442     median: 7441.5 (37%)     max: 8599 Points
4504 Points (23%)
Power Consumption - Geekbench 5.5 Power Consumption 150cd *
100%
1 MT8183 +
min: 3.4     avg: 3.4     median: 3.4 (1%)     max: 3.44 Watt
Power Consumption - Idle Power Consumption 150cd 1min *
100%
1 MT8183 +
min: 1.871     avg: 1.9     median: 1.9 (2%)     max: 1.889 Watt

Average Benchmarks Mediatek MT8183 → 100% n=8

Average Benchmarks Intel Atom x5-Z8550 → 71% n=8

- Range of benchmark values for this graphics card
red legend - Average benchmark values for this graphics card
* Smaller numbers mean a higher performance
1 This benchmark is not used for the average calculation

Add one or more devices and compare

In the following list you can select (and also search for) devices that should be added to the comparison. You can select more than one device.

restrict list:
v1.33
log 28. 19:16:37

#0 ran 0s before starting gpusingle class +0s ... 0s

#1 checking url part for id 11547 +0s ... 0s

#2 checking url part for id 8305 +0s ... 0s

#3 redirected to Ajax server, took 1753722997s time from redirect:0 +0s ... 0s

#4 did not recreate cache, as it is less than 5 days old! Created at Mon, 28 Jul 2025 05:17:35 +0200 +0s ... 0s

#5 composed specs +0.007s ... 0.007s

#6 did output specs +0s ... 0.007s

#7 getting avg benchmarks for device 11547 +0.004s ... 0.01s

#8 got single benchmarks 11547 +0.007s ... 0.017s

#9 getting avg benchmarks for device 8305 +0s ... 0.018s

#10 got single benchmarks 8305 +0.004s ... 0.022s

#11 got avg benchmarks for devices +0s ... 0.022s

#12 No cached benchmark found, getting uncached values +0.006s ... 0.028s

#13 No cached benchmark found, getting uncached values +0s ... 0.028s

#14 No cached benchmark found, getting uncached values +0.007s ... 0.035s

#15 No cached benchmark found, getting uncached values +0s ... 0.035s

#16 No cached benchmark found, getting uncached values +0s ... 0.036s

#17 No cached benchmark found, getting uncached values +0s ... 0.036s

#18 No cached benchmark found, getting uncached values +0s ... 0.036s

#19 min, max, avg, median took s +0.006s ... 0.042s

#20 return log +0.019s ... 0.061s

Please share our article, every link counts!
Mail Logo
> Expert Reviews and News on Laptops, Smartphones and Tech Innovations > Benchmarks / Tech > Processor Comparison - Head 2 Head
Redaktion, 2017-09- 8 (Update: 2023-07- 1)