Notebookcheck Logo

Samsung Exynos 990 vs HiSilicon Kirin 980 vs HiSilicon Kirin 990 5G

Samsung Exynos 990

► remove from comparison Samsung Exynos 990

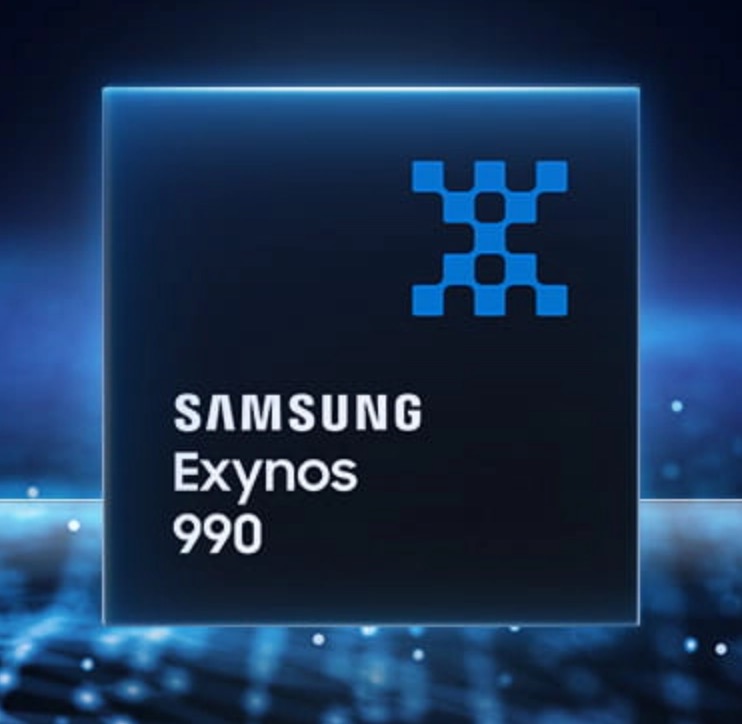
The Samsung Exynos 990 is a mobile high-end SoC for smartphones and tablets. It was announced in the Samsung S20 line in early 2020. The processor integrates three clusters of processor cores with different architectures. Two big Samsung custom M5 (Mongoose 5) cores clock up to 2.73 GHz and deliver peak performance. Two additional ARM Cortex-A76 are also for performance tasks and clock at up to 2.5 GHz. Finally, four small and power efficient ARM-Cortex A55 cores clock at up to 2 GHz are in the third cluster. The different clusters can run simultaneously thanks to DinamIQ.

The integrated LTE modem supports LTE-Advanced Pro Cat.20/18 (2000 Mbps download, 210 Mbps upload). The integrated graphics card is a ARM Mali G77MP11 with 11 cores.

The performance of the CPU part is positioned in the high end segment for smartphone processors. In Geekbench it offers a very good single thread performance on par with the Snapdragon 865 and older Apple A11. The multi-threaded-performance is a bit below the fastest current smartphone SoCs. In Geekbench 5 it slots in below the Kirin 990 and above the older Snapdragon 855 Plus.

The SoC is produced at Samsung in the new 7nm LPP (with EUV) process.

HiSilicon Kirin 980

► remove from comparison HiSilicon Kirin 980

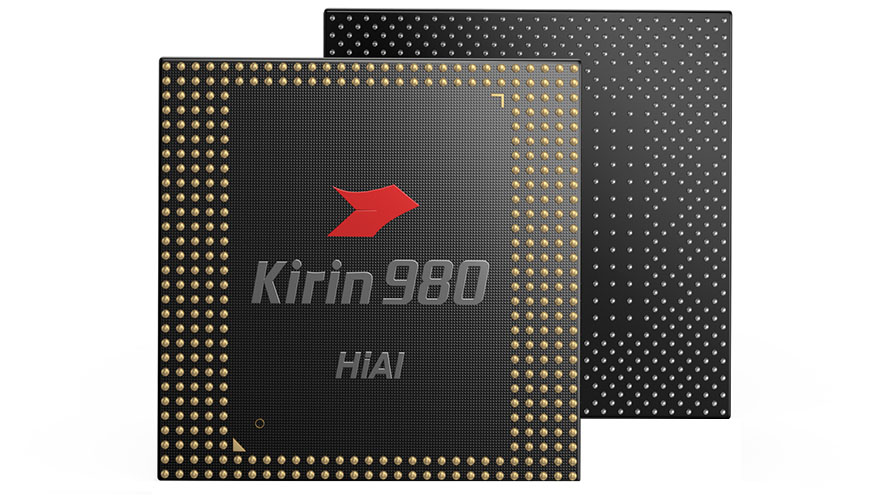
The HiSilicon Kirin 980 is an ARM based high-end octa-core SoC for smartphones and tablets, which was introduced with the Huawei Mate 20 Pro in late 2018. It integrates eight CPU cores in three clusters. The performance cluster contains two Cortex-A76 cores with up to 2.6 GHz, the balanced cluster contains also two Cortex-A76 cores but with only up to 1.92 GHz and finally the power saving cluster contains four small ARM Cortex-A53 cores with up to 1.8 GHz. Furthermore, the SoC integrates a modern LTE radio with Cat 21/18 (max. 1400 Mbps download, 200 Mbps upload), 2x faster dual ISP (versus 970), a LPDDR4X 2133 MHz memory controller (34.1 GB/s versus 29.9 GB/s of the Kirin 970) and a 2160p30 H.265 video encoder (2160p60 decoding). The Kirin 980 is produced in the modern 7nm process at TSMC as the first Android SoC (after the Apple A12).

HiSilicon Kirin 990 5G

► remove from comparison HiSilicon Kirin 990 5G

The HiSilicon Kirin 990 5G is an ARM based high-end octa-core SoC for smartphones and tablets, which was introduced with the Huawei Mate 30 Pro in late 2019. It integrates eight CPU cores in three clusters. The performance cluster contains two Cortex-A76 cores with up to 2.86 GHz, the balanced cluster contains also two Cortex-A76 cores but with only up to 2.36 GHz and finally the power saving cluster contains four small ARM Cortex-A55 cores with up to 1.95 GHz. Furthermore, the SoC integrates a neural processor (2 + 1 cores) for AI tasks and a ARM Mali-G76 MP16 GPU clocked at up to 700 MHz. Compared to the 4G version, the 5G Kirin 990 integrates a Balong 5G modem and is slightly higher clocked (2 of the 3 clusters and the GPU).

The Kirin 990 5G is produced in the modern 7nm (7FF+ with EUV) process at TSMC, the 4G version is still produced in the slightly older 7nm process as the Kirin 980.

ModelSamsung Exynos 990HiSilicon Kirin 980HiSilicon Kirin 990 5G
SeriesSamsung ExynosHiSilicon HiSilicon
CodenameExynos M5 / Cortex A-76 / Cortex-A55Cortex-A76/-A55Cortex-A76/-A55
Clock2000 - 2730 MHz <=2600 MHz <=2860 MHz
Cores / Threads8 / 88 / 88 / 8
Technology7 nm7 nm7 nm
FeaturesARM Mali-G77MP11 GPU, 2x Samsung Mongoose 5 Custom CPU, 2x Cortex-A76, 4x Cortex-A55 big.LITTLE, LPDDR5-5500 Memory ControllerARM Mali-G76 GPU, 2x Cortex-A76 (2.6 GHz) + 2x Cortex-A76 (1.92) + 4x Cortex-A53 (1.8 GHz, big.LITTLE), 2x LTE Dual-SIM (1.4 Gbps down Cat21)ARM Mali-G76MP16 GPU, 2x Cortex-A76 (2.86 GHz) + 2x Cortex-A76 (2.36) + 4x Cortex-A53 (1.95 GHz, big.LITTLE), Balong 5G Modem
ArchitectureARMARMARM
Announced
Manufacturerwww.samsung.com
Series: Cortex-A76/-A55
HiSilicon Kirin 990 5G - 2.86 GHz8 / 8 cores Cortex-A76/-A55
HiSilicon Kirin 990 - 2.86 GHz8 / 8 cores Cortex-A76/-A55
HiSilicon Kirin 8201.84 - 2.36 GHz8 / 8 cores Cortex-A76/-A55
HiSilicon Kirin 820e1.84 - 2.22 GHz8 / 8 cores Cortex-A76/-A55
HiSilicon Kirin 8101.88 - 2.27 GHz8 / 8 cores Cortex-A76/-A55
HiSilicon Kirin 980 « - 2.6 GHz8 / 8 cores Cortex-A76/-A55
HiSilicon Kirin 990 5G « - 2.86 GHz8 / 8 cores Cortex-A76/-A55
HiSilicon Kirin 990 - 2.86 GHz8 / 8 cores Cortex-A76/-A55
HiSilicon Kirin 8201.84 - 2.36 GHz8 / 8 cores Cortex-A76/-A55
HiSilicon Kirin 820e1.84 - 2.22 GHz8 / 8 cores Cortex-A76/-A55
HiSilicon Kirin 8101.88 - 2.27 GHz8 / 8 cores Cortex-A76/-A55
HiSilicon Kirin 980 - 2.6 GHz8 / 8 cores Cortex-A76/-A55
Transistors6900 Million10300 Million
iGPUARM Mali-G76 MP10 ( - 720 MHz)ARM Mali-G76 MP16 ( - 700 MHz)

Benchmarks

Performance Rating - Geekbench 5.5, PCM Work, Sling Shot Physics, Antutu v8 CPU - Exynos 990
1 pt (77%)
Performance Rating - Geekbench 5.5, PCM Work, Sling Shot Physics, Antutu v8 CPU - Kirin 980
0.9 pt (71%)
Performance Rating - Geekbench 5.5, PCM Work, Sling Shot Physics, Antutu v8 CPU - Kirin 990 5G
min: 1.102     avg: 1.1     median: 1.1 (85%)     max: 1.3 pt
3DMark - 3DMark Ice Storm Unlimited Physics
min: 27431     avg: 37265     median: 39747.5 (33%)     max: 42135 Points
min: 22857     avg: 35317     median: 35840.5 (30%)     max: 46731 Points
3DMark - 3DMark Sling Shot Extreme (ES 3.1) Unlimited Physics
min: 4063     avg: 4284     median: 4273 (50%)     max: 4495 Points
min: 2497     avg: 4729     median: 5326 (63%)     max: 5766 Points
3DMark - 3DMark Sling Shot (ES 3.0) Unlimited Physics
min: 3935     avg: 4240     median: 4247 (49%)     max: 4455 Points
min: 4836     avg: 5318     median: 5358 (61%)     max: 5721 Points
Geekbench 5.5 - Geekbench 5.1 - 5.4 64 Bit Single-Core
min: 903     avg: 929     median: 940 (40%)     max: 944 Points
min: 706     avg: 707     median: 707 (30%)     max: 708 Points
min: 755     avg: 771     median: 772.5 (33%)     max: 783 Points
Geekbench 5.5 - Geekbench 5.1 - 5.4 64 Bit Multi-Core
min: 2731     avg: 2800     median: 2787 (5%)     max: 2899 Points
min: 2553     avg: 2558     median: 2558 (5%)     max: 2563 Points
min: 2972     avg: 3077     median: 3076.5 (6%)     max: 3183 Points
Geekbench 5.0 - Geekbench 5.0 64 Bit Single-Core
min: 685     avg: 696     median: 695.5 (3%)     max: 707 Points
769 Points (3%)
Geekbench 5.0 - Geekbench 5.0 64 Bit Multi-Core
min: 2347     avg: 2474     median: 2500 (8%)     max: 2549 Points
3083 Points (10%)
Geekbench 4.4 - Geekbench 4.1 - 4.4 64 Bit Single-Core
min: 4791     avg: 4878     median: 4878 (49%)     max: 4965 Points
min: 3915     avg: 3925     median: 3925 (39%)     max: 3935 Points
Geekbench 4.4 - Geekbench 4.1 - 4.4 64 Bit Multi-Core
min: 12557     avg: 12559     median: 12559 (14%)     max: 12561 Points
min: 12324     avg: 12549     median: 12549 (14%)     max: 12774 Points
Geekbench 4.0 - Geekbench 4.0 64 Bit Single-Core
4761 Points (65%)
min: 3563     avg: 3601     median: 3601 (49%)     max: 3639 Points
min: 3984     avg: 3992     median: 3991.5 (54%)     max: 3999 Points
Geekbench 4.0 - Geekbench 4.0 64 Bit Multi-Core
12169 Points (30%)
min: 9577     avg: 9735     median: 9734.5 (24%)     max: 9892 Points
min: 11812     avg: 12006     median: 12005.5 (29%)     max: 12199 Points
Geekbench 3 - Geekbench 3 64 Bit Multi-Core
9220 Points (14%)
min: 8473     avg: 8680     median: 8679.5 (14%)     max: 8886 Points
Geekbench 3 - Geekbench 3 64 Bit Single-Core
2746 Points (41%)
min: 2922     avg: 2994     median: 2994 (45%)     max: 3066 Points
Geekbench 3 - Geekbench 3 32 Bit Multi-Core
0 Points (0%)
Geekbench 3 - Geekbench 3 32 Bit Single-Core
0 Points (0%)
Geekbench 2 - 32 Bit - Geekbench Stream
3463 Points (28%)
min: 1576     avg: 2232     median: 2231.5 (18%)     max: 2887 Points
min: 1615     avg: 2579     median: 2578.5 (21%)     max: 3542 Points
Geekbench 2 - 32 Bit - Geekbench Memory
7366 Points (67%)
min: 2969     avg: 5181     median: 5180.5 (47%)     max: 7392 Points
min: 4881     avg: 5643     median: 5643 (51%)     max: 6405 Points
Geekbench 2 - 32 Bit - Geekbench Floating Point
16423 Points (32%)
min: 15206     avg: 16273     median: 16273 (32%)     max: 17340 Points
min: 19287     avg: 20143     median: 20143 (39%)     max: 20999 Points
Geekbench 2 - 32 Bit - Geekbench Integer
8407 Points (17%)
min: 7157     avg: 7523     median: 7523 (15%)     max: 7889 Points
min: 9013     avg: 9236     median: 9235.5 (19%)     max: 9458 Points
Geekbench 2 - 32 Bit - Geekbench Total Score
10510 Points (27%)
min: 8578     avg: 9588     median: 9587.5 (25%)     max: 10597 Points
min: 11042     avg: 11669     median: 11668.5 (31%)     max: 12295 Points
Mozilla Kraken 1.1 - Kraken 1.1 Total Score *
min: 2294     avg: 2387     median: 2345 (3%)     max: 2511 ms
min: 1948     avg: 2176     median: 2053.5 (2%)     max: 3098 ms
min: 1914     avg: 2084     median: 2066.5 (2%)     max: 2287 ms
Sunspider - Sunspider 1.0 Total Score *
478.8 ms (5%)
345.4 ms (4%)
Octane V2 - Octane V2 Total Score
min: 18094     avg: 19019     median: 19122 (17%)     max: 20022 Points
min: 20618     avg: 21733     median: 21603.5 (19%)     max: 23285 Points
min: 20917     avg: 22323     median: 22343 (20%)     max: 23690 Points
WebXPRT 3 - WebXPRT 3 Score
min: 86     avg: 94.4     median: 97 (20%)     max: 102 Points
min: 86     avg: 105.1     median: 99 (21%)     max: 124 Points
min: 95     avg: 105.7     median: 98 (20%)     max: 124 Points
AnTuTu v6 - AnTuTu v6 Total Score
min: 245662     avg: 250407     median: 250848 (85%)     max: 254229 Points
AnTuTu v7 - AnTuTu v7 GPU
min: 95964     avg: 110298     median: 111697 (35%)     max: 122632 Points
AnTuTu v7 - AnTuTu v7 CPU
min: 101537     avg: 108108     median: 106863 (65%)     max: 117617 Points
AnTuTu v7 - AnTuTu v7 Total Score
min: 268359     avg: 295586     median: 295634 (52%)     max: 322616 Points
AnTuTu v8 - AnTuTu v8 UX
min: 14541     avg: 61956     median: 72814 (61%)     max: 79291 Points
min: 66660     avg: 67111     median: 67110.5 (56%)     max: 67561 Points
min: 67274     avg: 75033     median: 73056 (61%)     max: 86746 Points
AnTuTu v8 - AnTuTu v8 MEM
min: 70388     avg: 81327     median: 80945 (65%)     max: 91469 Points
min: 71845     avg: 71918     median: 71917.5 (58%)     max: 71990 Points
min: 66292     avg: 98762     median: 103022 (83%)     max: 122714 Points
AnTuTu v8 - AnTuTu v8 GPU
min: 77884     avg: 180239     median: 207238 (38%)     max: 214615 Points
min: 135337     avg: 137666     median: 137666 (25%)     max: 139995 Points
min: 159628     avg: 167229     median: 167842 (31%)     max: 173605 Points
AnTuTu v8 - AnTuTu v8 CPU
min: 123376     avg: 146474     median: 150214 (54%)     max: 157764 Points
min: 136978     avg: 137360     median: 137360 (50%)     max: 137741 Points
min: 136344     avg: 145447     median: 145294 (53%)     max: 154856 Points
AnTuTu v8 - AnTuTu v8 Total Score
min: 296746     avg: 469996     median: 504192 (49%)     max: 527820 Points
min: 410820     avg: 414054     median: 414054 (40%)     max: 417287 Points
min: 450373     avg: 486472     median: 483829 (47%)     max: 527856 Points
Antutu v9 - AnTuTu v9 Total Score
653269 Points (40%)
Antutu v9 - AnTuTu v9 CPU
173967 Points (48%)
PassMark PerformanceTest Mobile V1 - PerformanceTest Mobile V1 CPU Tests
min: 246439     avg: 246733     median: 246733 (32%)     max: 247027 Points
PCMark for Android - PCM f. Android Computer Vision
min: 6116     avg: 6221     median: 6178 (33%)     max: 6370 Points
min: 4919     avg: 7101     median: 7789 (41%)     max: 7905 Points
min: 5869     avg: 7653     median: 7653 (40%)     max: 9437 Points
PCMark for Android - PCM f. Android Storage
min: 16279     avg: 16886     median: 16672 (36%)     max: 17707 Points
29206 Points (62%)
PCMark for Android - PCM f. Android Work Score 2.0
min: 10008     avg: 10612     median: 10431 (68%)     max: 11784 Points
min: 8512     avg: 10025     median: 10038.5 (66%)     max: 11509 Points
PCMark for Android - PCM f. Android Work Score
min: 13627     avg: 14391     median: 14551 (73%)     max: 14760 Points
min: 10628     avg: 12766     median: 12810 (64%)     max: 14814 Points
CrossMark - CrossMark Overall
507 Points (19%)
676 Points (26%)

Average Benchmarks Samsung Exynos 990 → 100% n=28

Average Benchmarks HiSilicon Kirin 980 → 83% n=28

Average Benchmarks HiSilicon Kirin 990 5G → 96% n=28

- Range of benchmark values for this graphics card
- Average benchmark values for this graphics card
* Smaller numbers mean a higher performance
1 This benchmark is not used for the average calculation

v1.26
log 29. 06:00:44

#0 checking url part for id 11939 +0s ... 0s

#1 checking url part for id 10436 +0s ... 0s

#2 checking url part for id 11508 +0s ... 0s

#3 not redirecting to Ajax server +0s ... 0s

#4 did not recreate cache, as it is less than 5 days old! Created at Sun, 28 Apr 2024 05:39:51 +0200 +0.001s ... 0.001s

#5 composed specs +0.176s ... 0.177s

#6 did output specs +0s ... 0.177s

#7 getting avg benchmarks for device 11939 +0.016s ... 0.193s

#8 got single benchmarks 11939 +0.016s ... 0.21s

#9 getting avg benchmarks for device 10436 +0.012s ... 0.221s

#10 got single benchmarks 10436 +0.027s ... 0.249s

#11 getting avg benchmarks for device 11508 +0.01s ... 0.258s

#12 got single benchmarks 11508 +0.019s ... 0.277s

#13 got avg benchmarks for devices +0s ... 0.277s

#14 No cached benchmark found, getting uncached values +0.131s ... 0.408s

#15 No cached benchmark found, getting uncached values +0.007s ... 0.415s

#16 No cached benchmark found, getting uncached values +0.003s ... 0.418s

#17 No cached benchmark found, getting uncached values +0.003s ... 0.421s

#18 No cached benchmark found, getting uncached values +0.136s ... 0.557s

#19 min, max, avg, median took s +0.018s ... 0.575s

#20 return log +0s ... 0.575s

Please share our article, every link counts!
> Expert Reviews and News on Laptops, Smartphones and Tech Innovations > Benchmarks / Tech > Processor Comparison - Head 2 Head
Redaktion, 2017-09- 8 (Update: 2023-07- 1)