Dell XPS 15 9575 vs. HP Spectre x360 15 2018: Kaby Lake-G Showdown
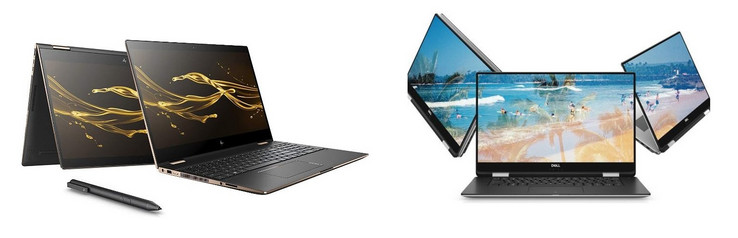
The Dell XPS 15 9575 and HP Spectre x360 15 2018 are unique in that they are the only 15-inch convertibles with Kaby Lake-G processors currently in the market. Both OEMs have carved themselves a small niche with these powerful but unpopular CPUs designed for multimedia and mainstream gaming.
As a consequence of carrying the same CPU with similar 2-in-1 form factors, the 15-inch Dell and HP convertibles have been in direct competition with one another ever since launch. To our surprise, the systems are more dissimilar than what their paper specifications would otherwise suggest. Our comparison below highlights the differences between them in terms of features, performance, noise, brightness, connectivity, and more.
We encourage users to check out our dedicated review pages below for more data and detailed analyses of each of the two models.
- Dell XPS 15 9575 (Core i5-8305G)
- Dell XPS 15 9575 (Core i7-8705G)
- HP Spectre x360 15 2018 (Core i7-8705G)
- HP Spectre x360 15 2018 (Core i7-8550U)
- HP Spectre x360 15 2017 (Core i7-8550U)
| HP Spectre x360 15 2018 | Dell XPS 15 9575 | |
|---|---|---|
| CPU | Core i7-8550U or Core i7-8705G | Core i5-8305G or Core i7-8705G |
| GPU | Nvidia GeForce MX150 or AMD Radeon RX Vega M GL w/ 4 GB HBM2 VRAM | AMD Radeon RX Vega M GL w/ 4 GB HBM2 VRAM |
| RAM | 2x SODIMM, 8 GB to 16 GB DDR4-2400 | Soldered, 8 GB or 16 GB DDR4-2400 |
| Display | 4K UHD touchscreen (BOE0730) | 4K UHD touchscreen (Sharp SHP148E) |
| Storage | 1x M.2 2280 slot, Upgradeable | 1x M.2 2280 slot, Upgradeable |
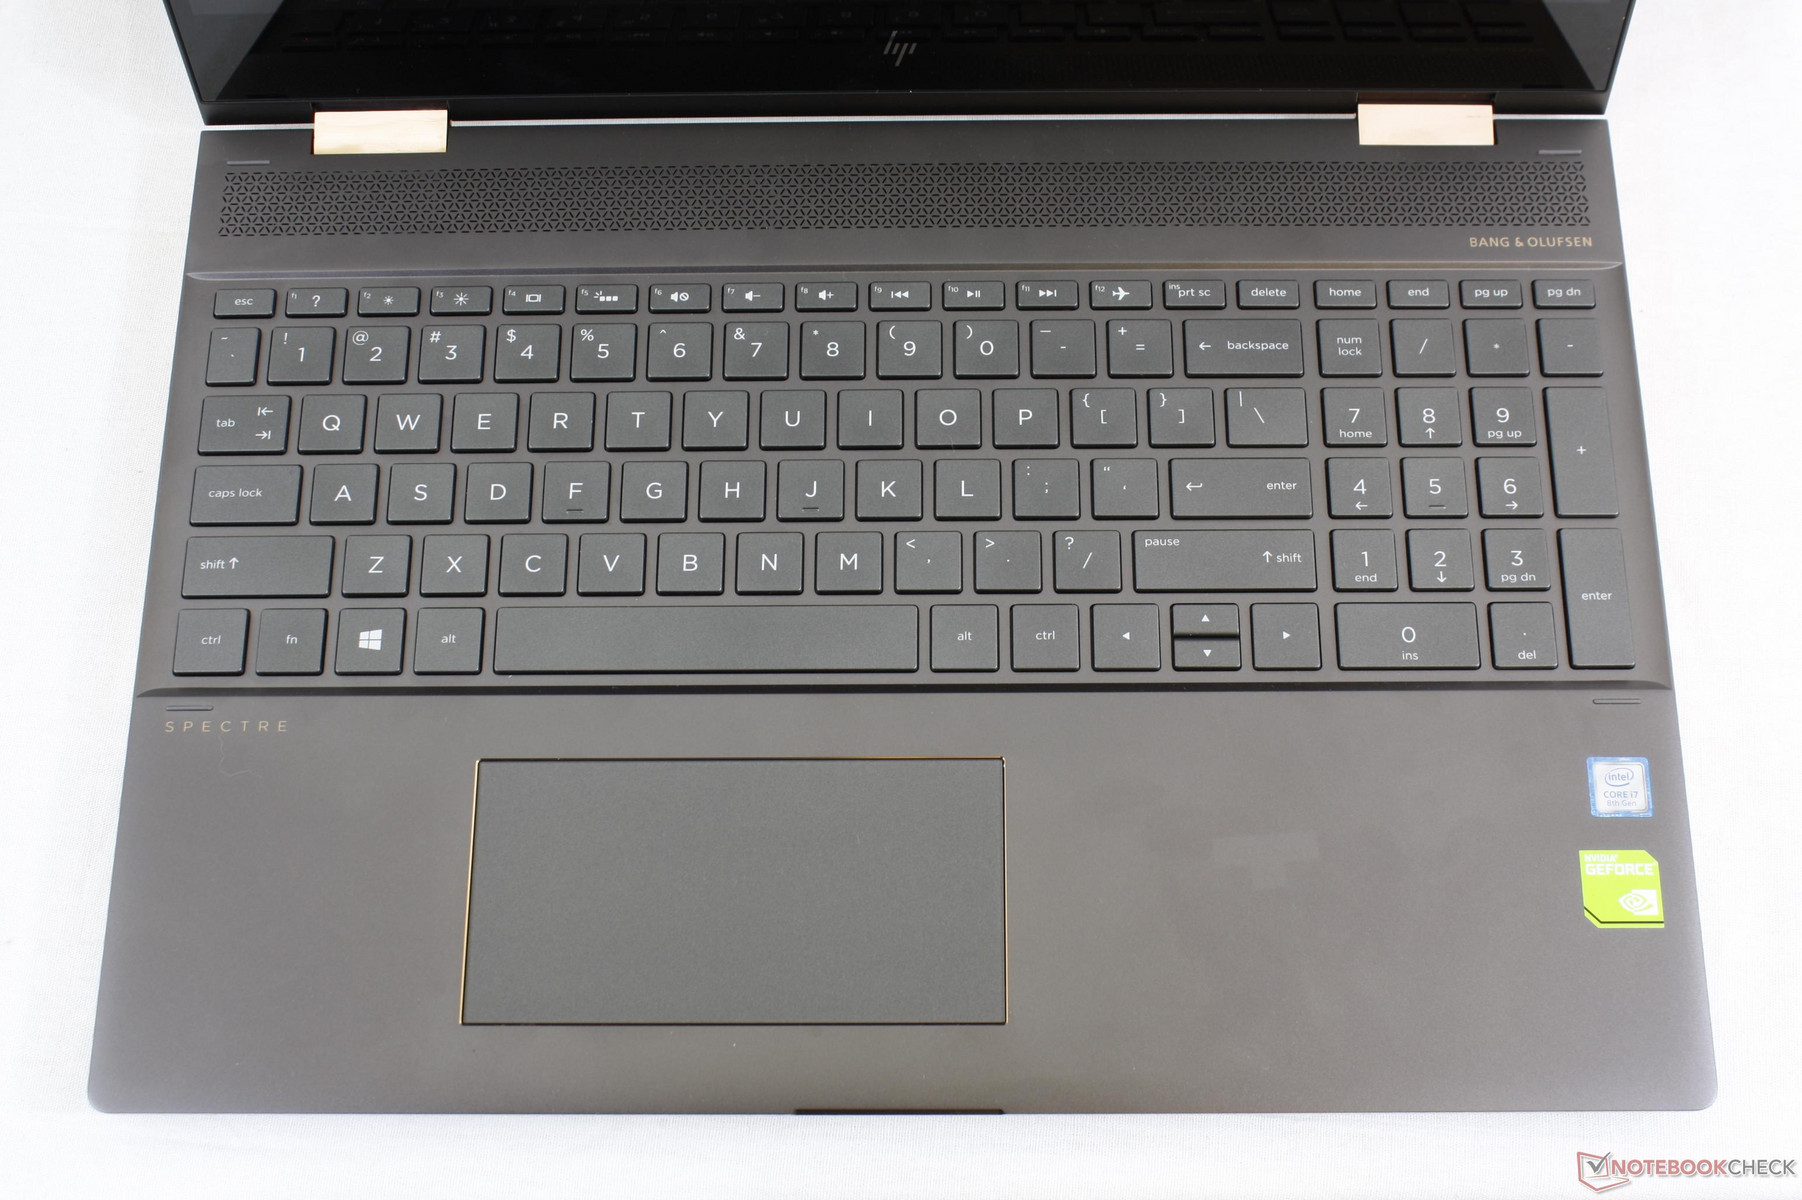
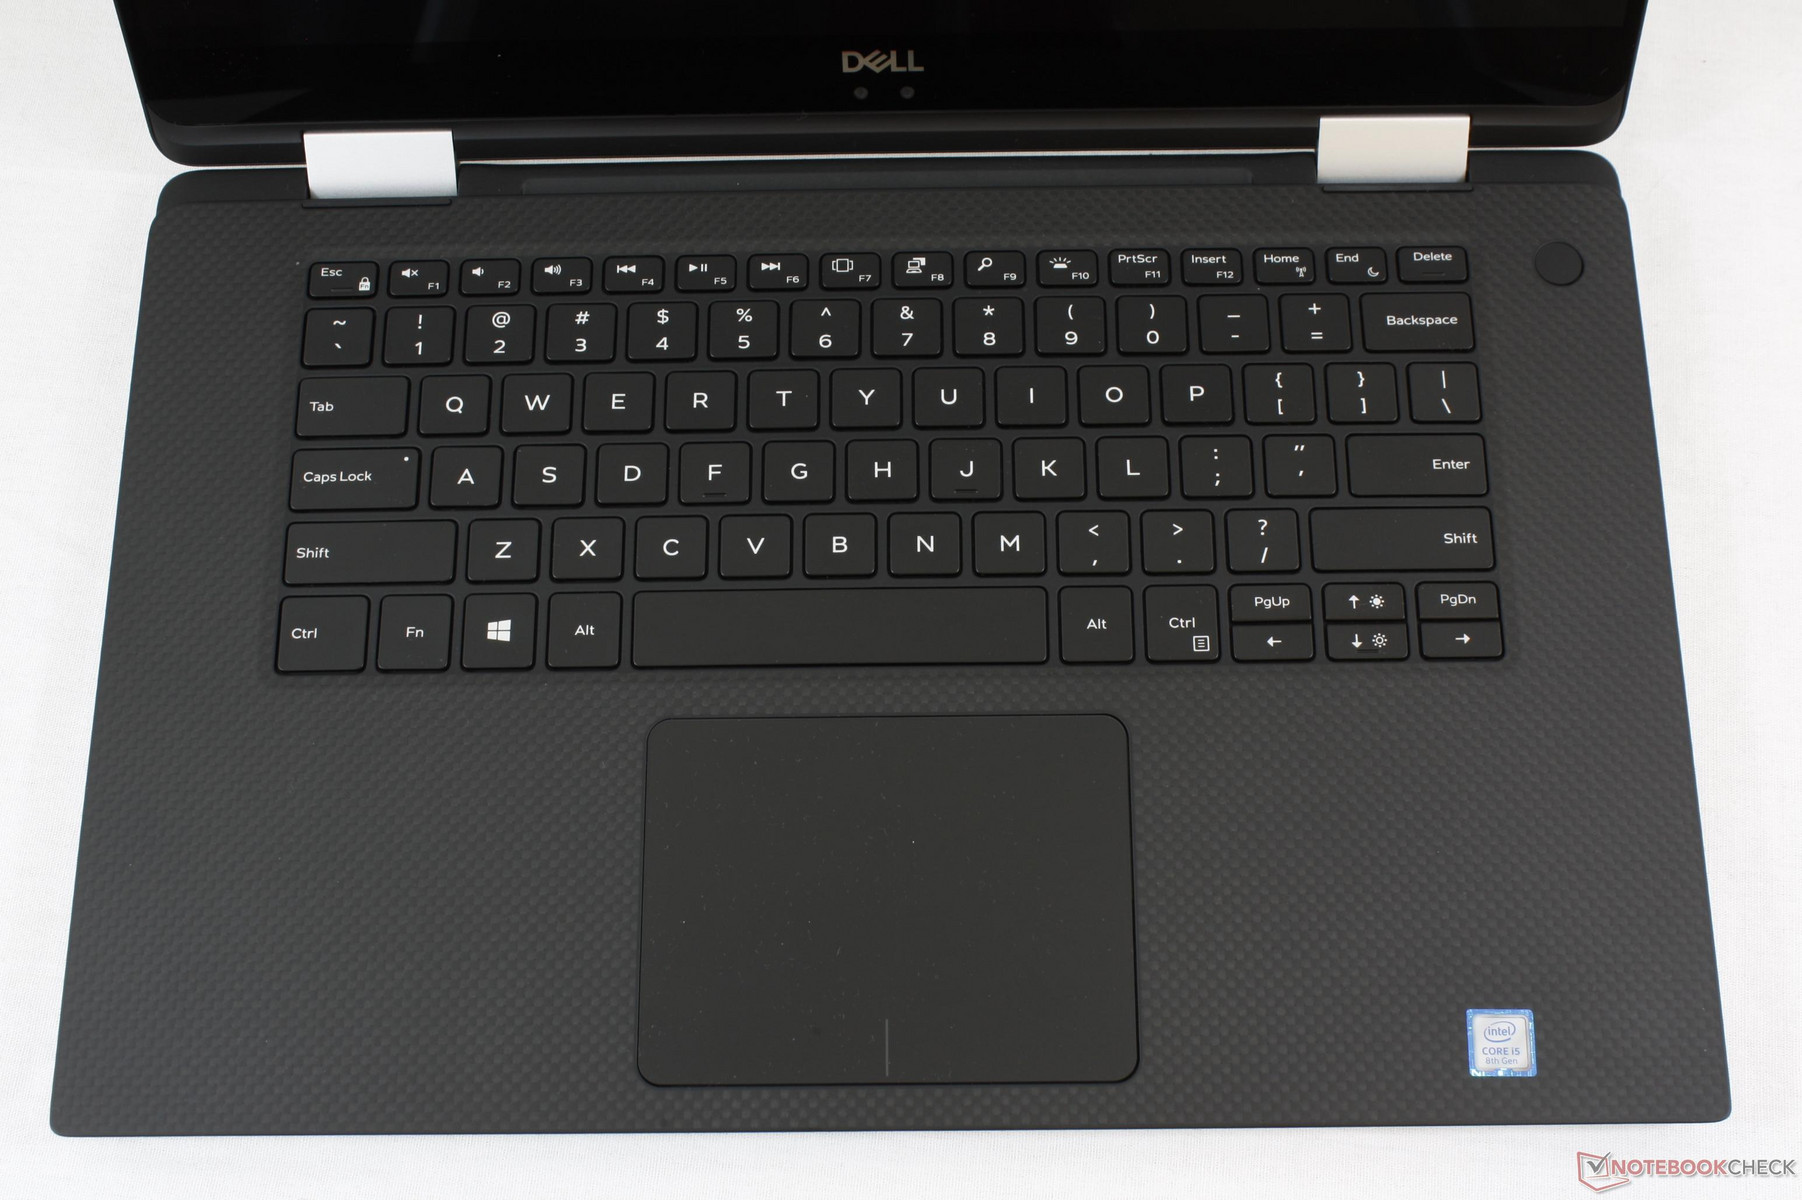
| Keyboard | Membrane-based, 2.2 mm travel | Maglev, 0.7 mm travel |
| Touchpad | 12 x 6 cm | 10.5 x 8.0 cm |
| Speakers | Bang & Olufsen stereo (2 W x 2) | Stereo (1 W x 2) |
| Camera | FHD IR, top of display | 720p IR, bottom of display |
| Connectivity | See below | See below |
| Weight | 2.1 kg | 2.0 kg |
| Dimensions | 359 x 250 x 19.3 mm | 354 x 235 x 16 mm |
| MSRP | Varies | Varies |
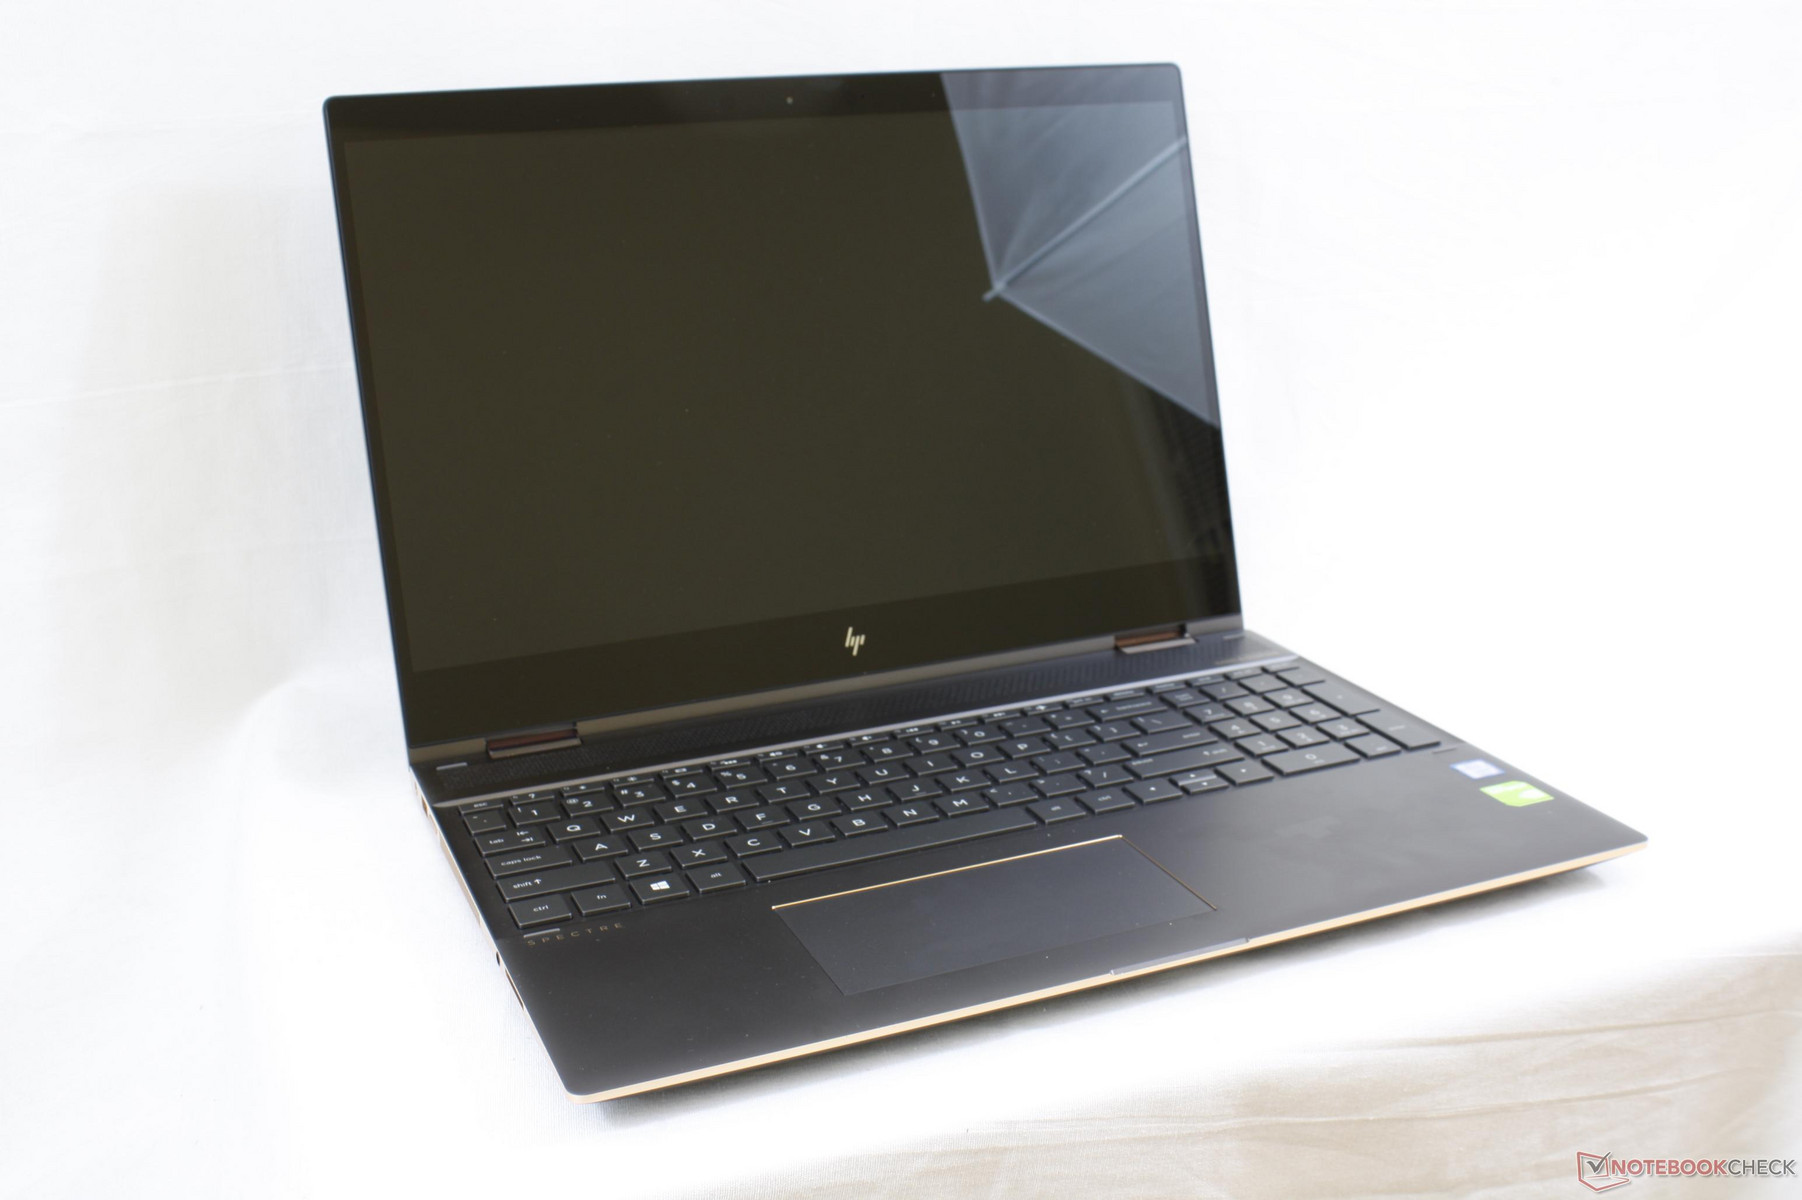
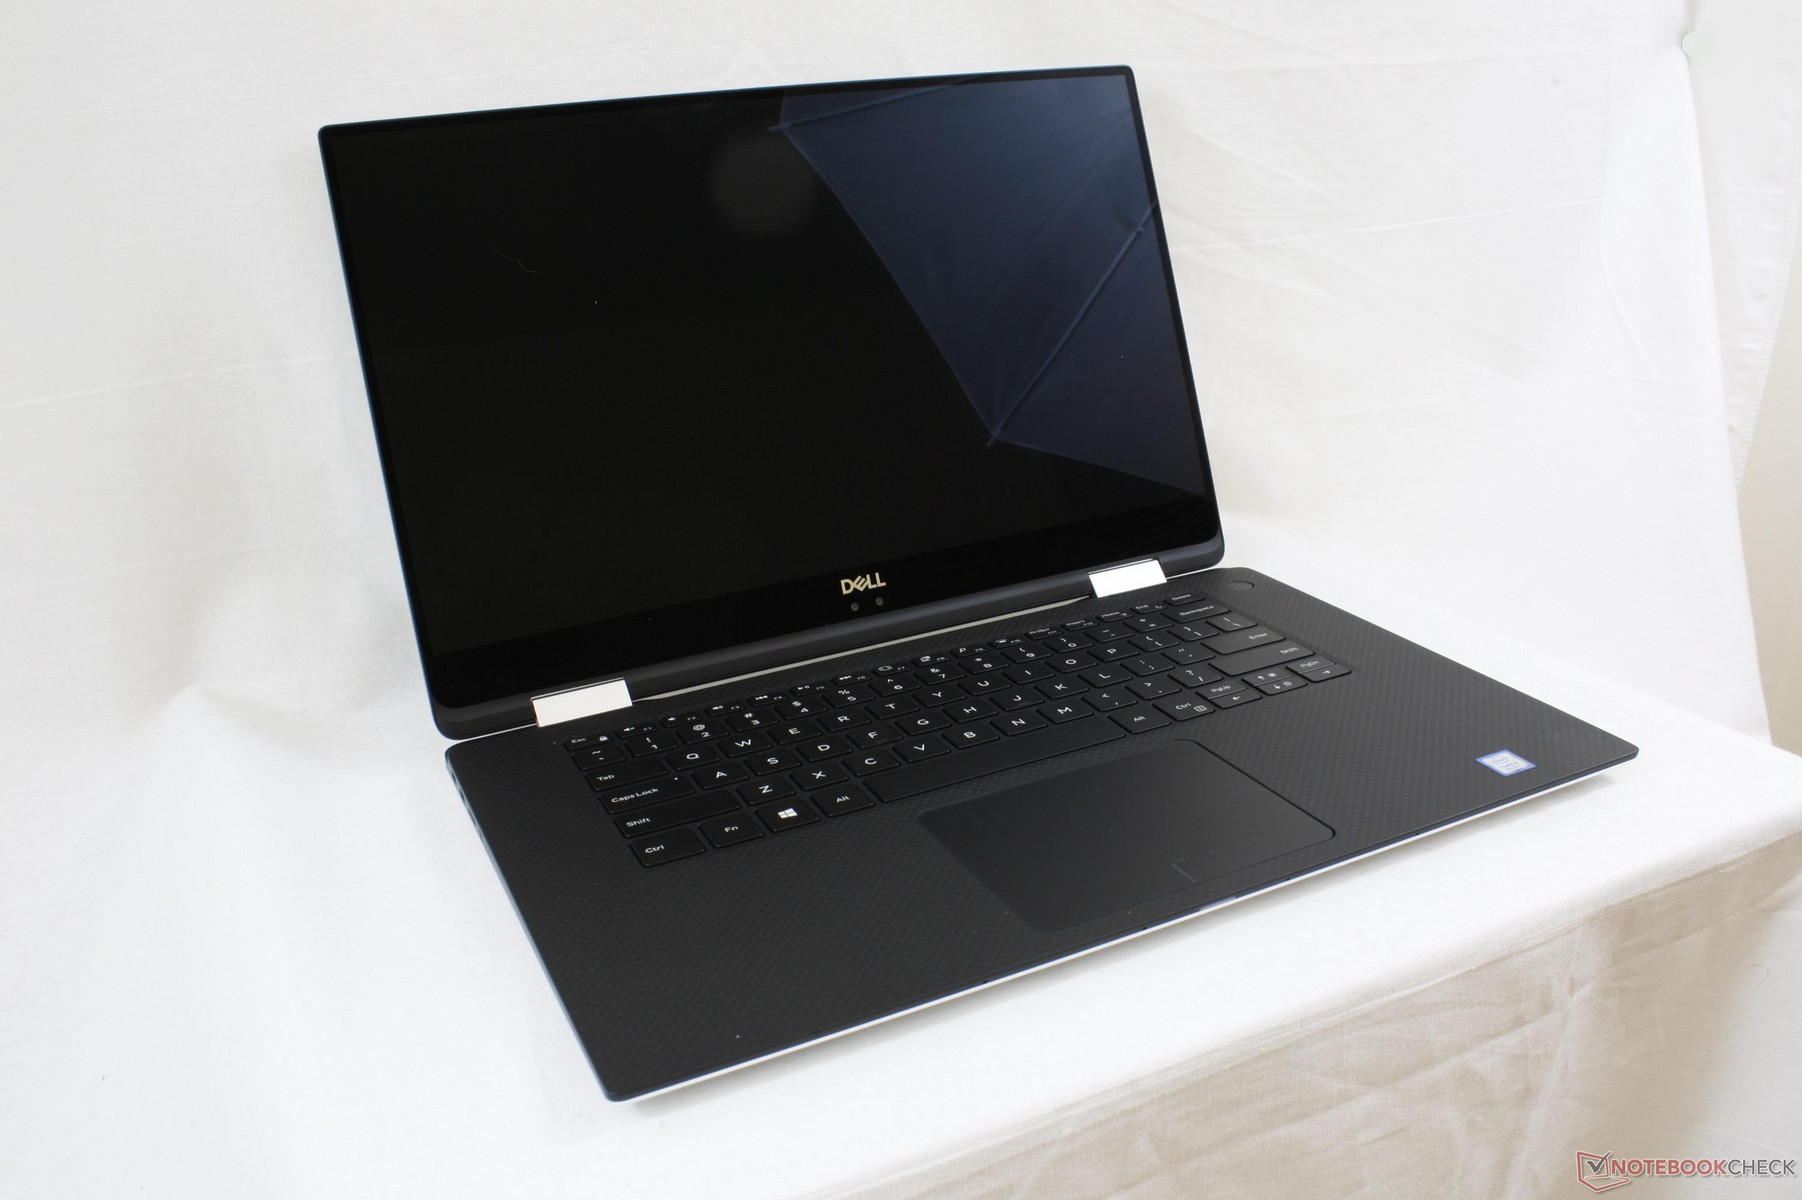
Case
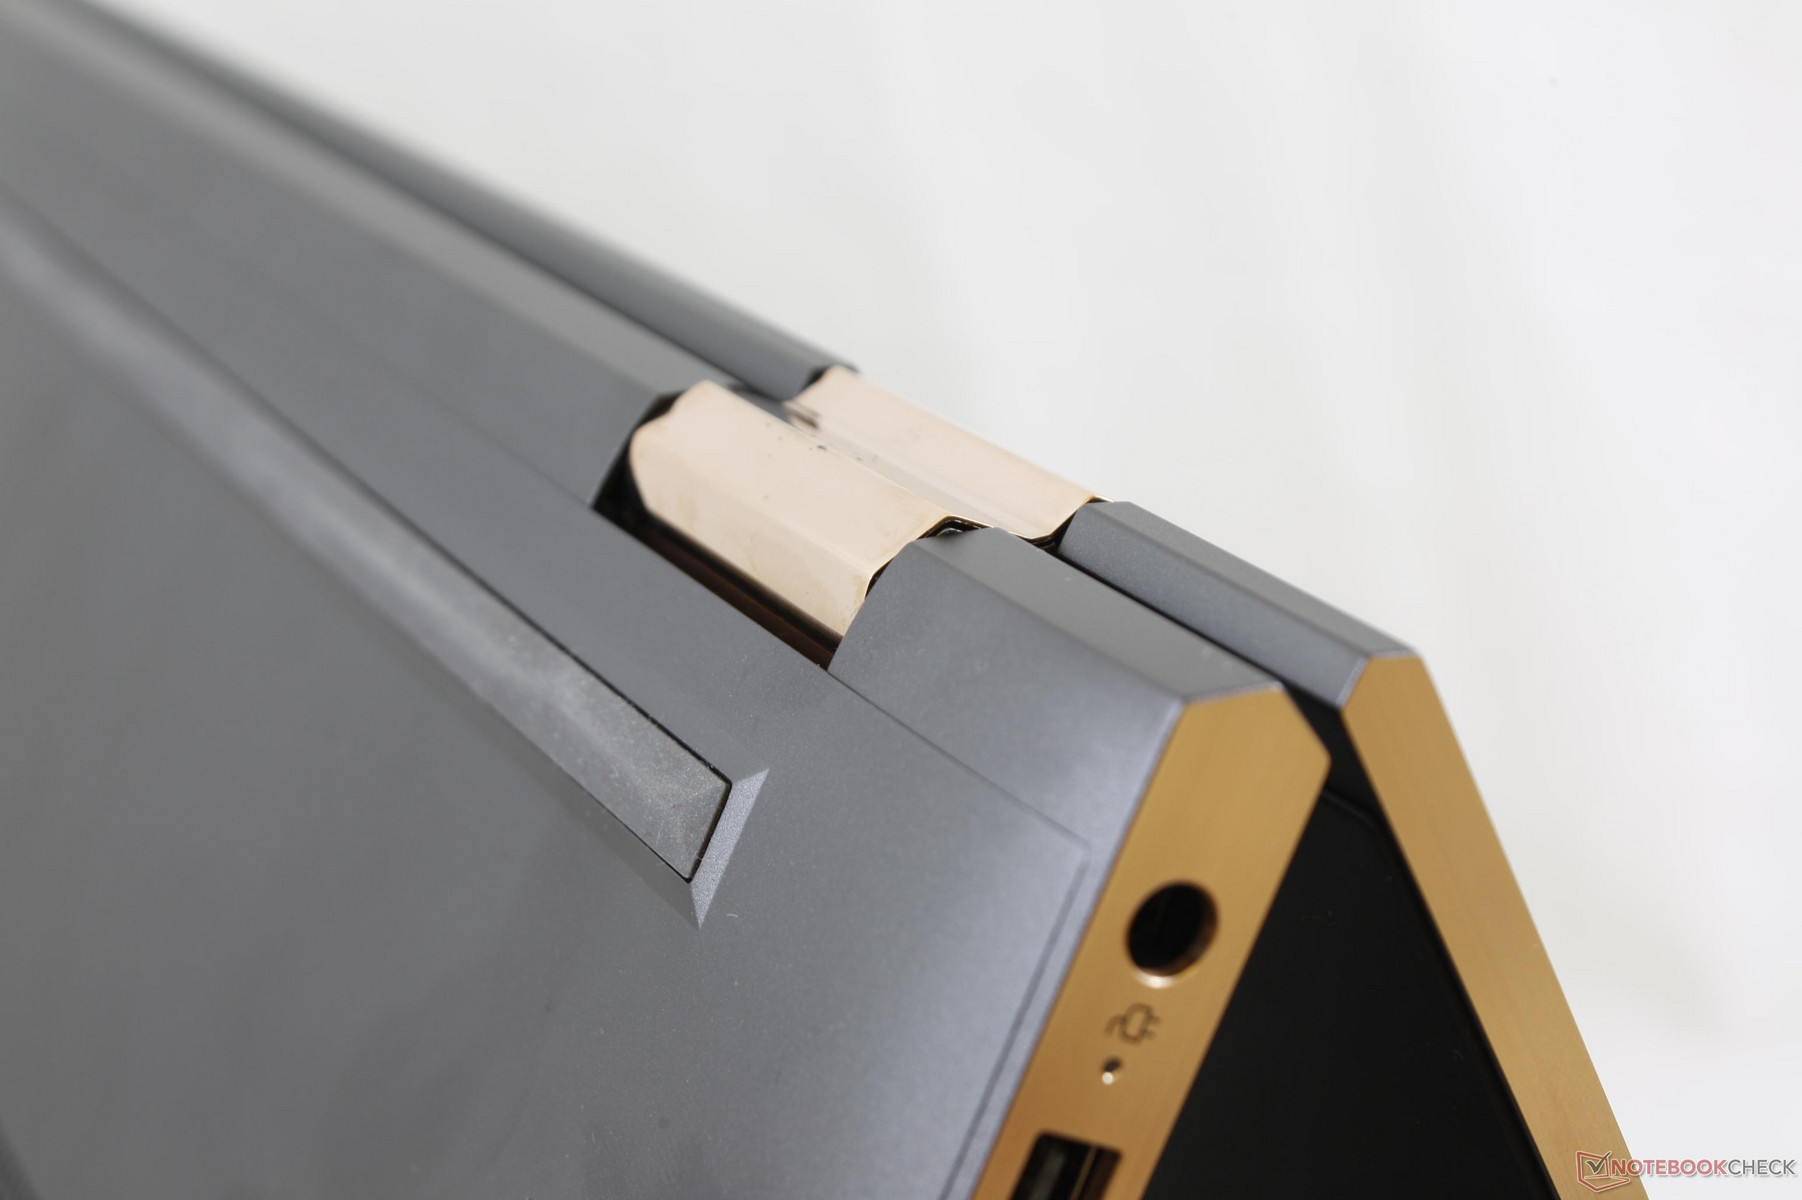
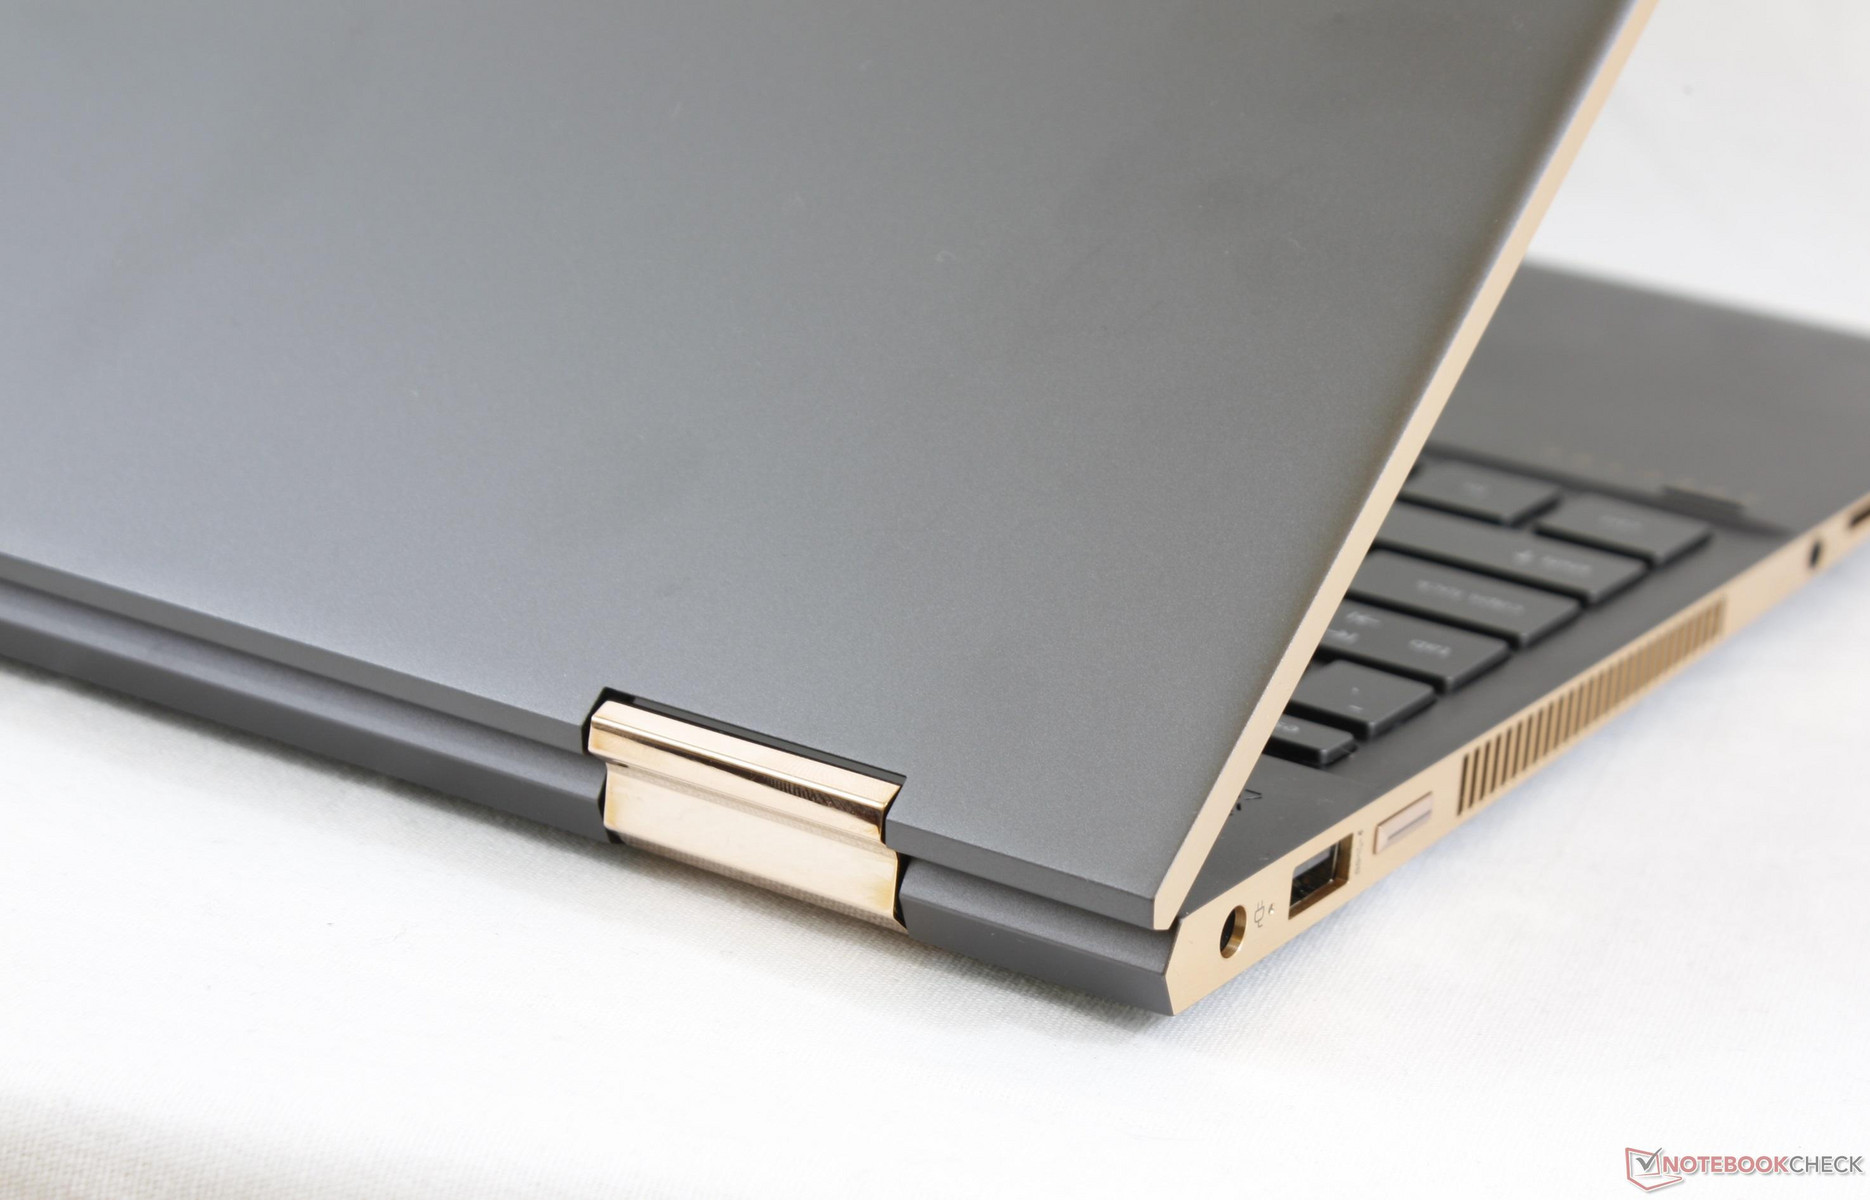
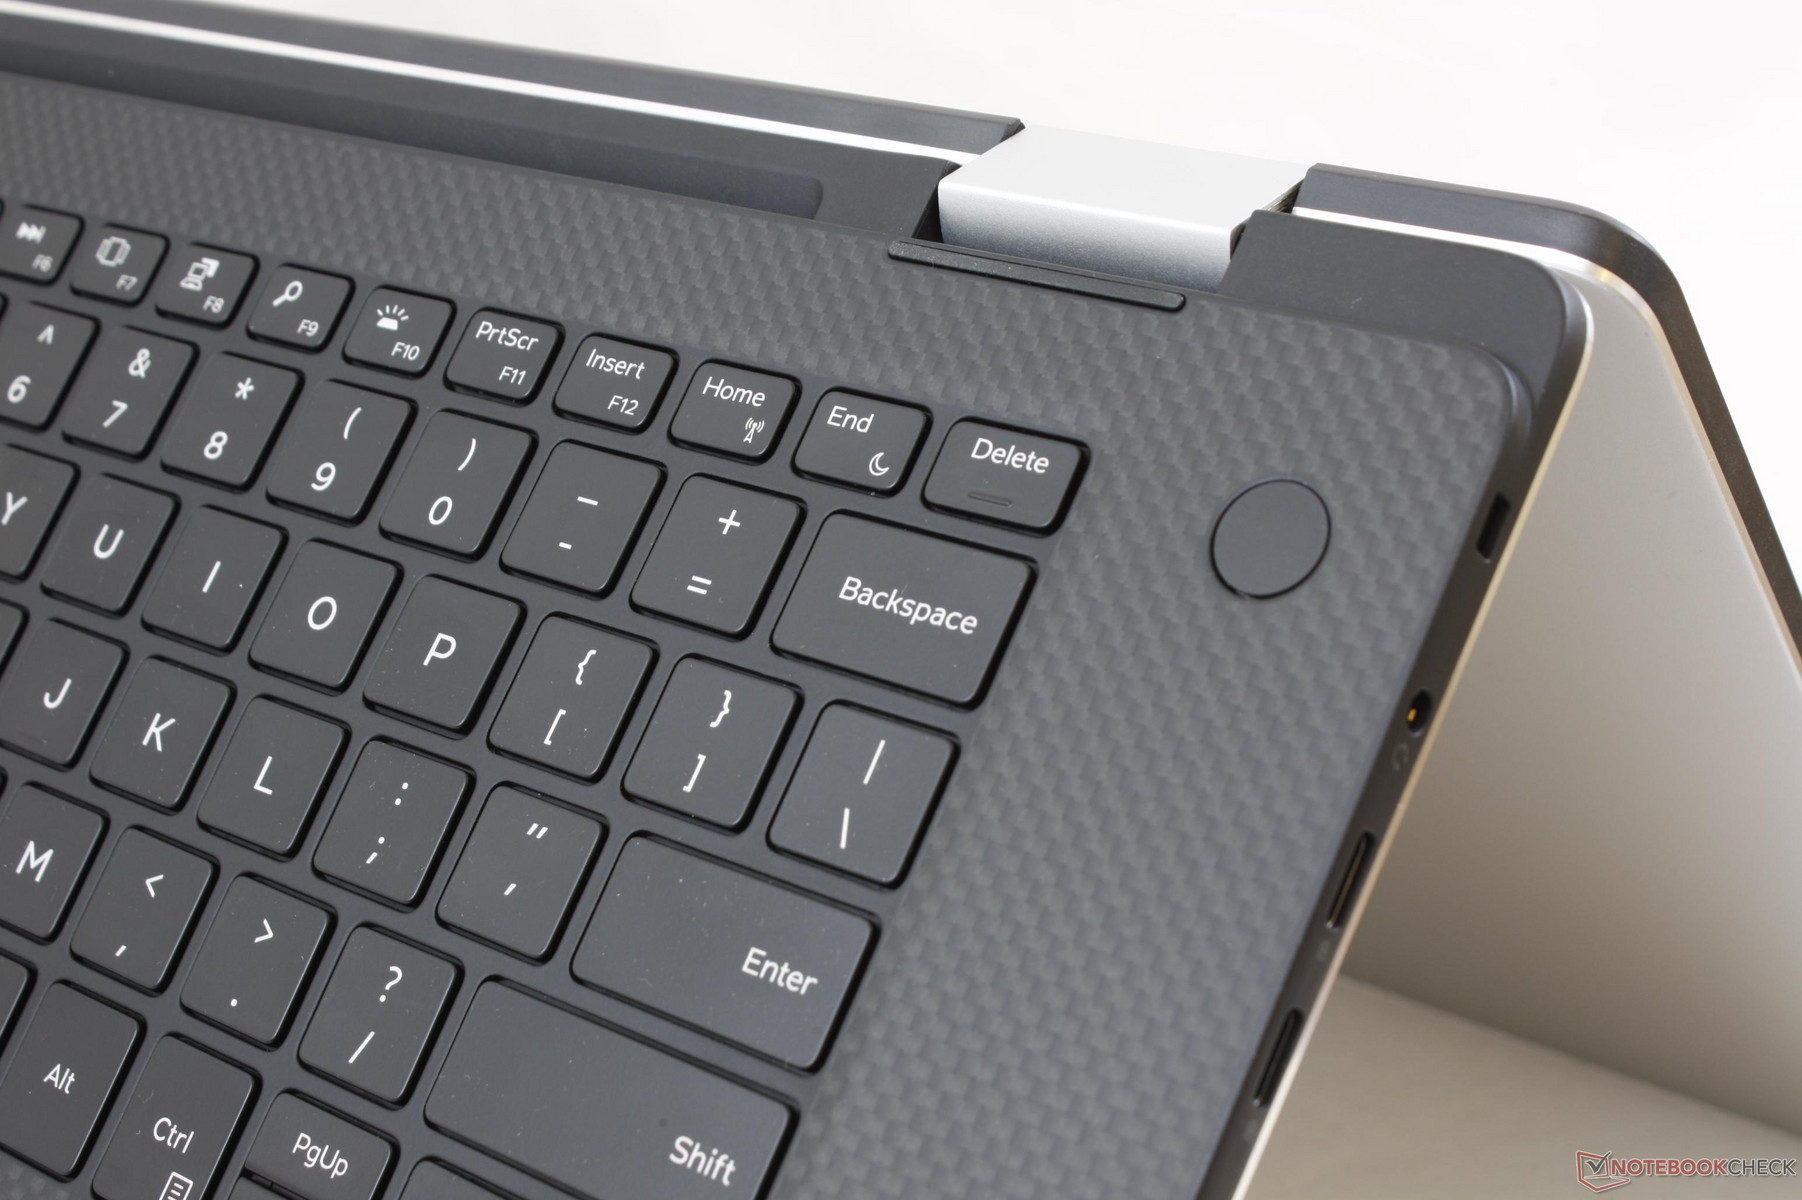
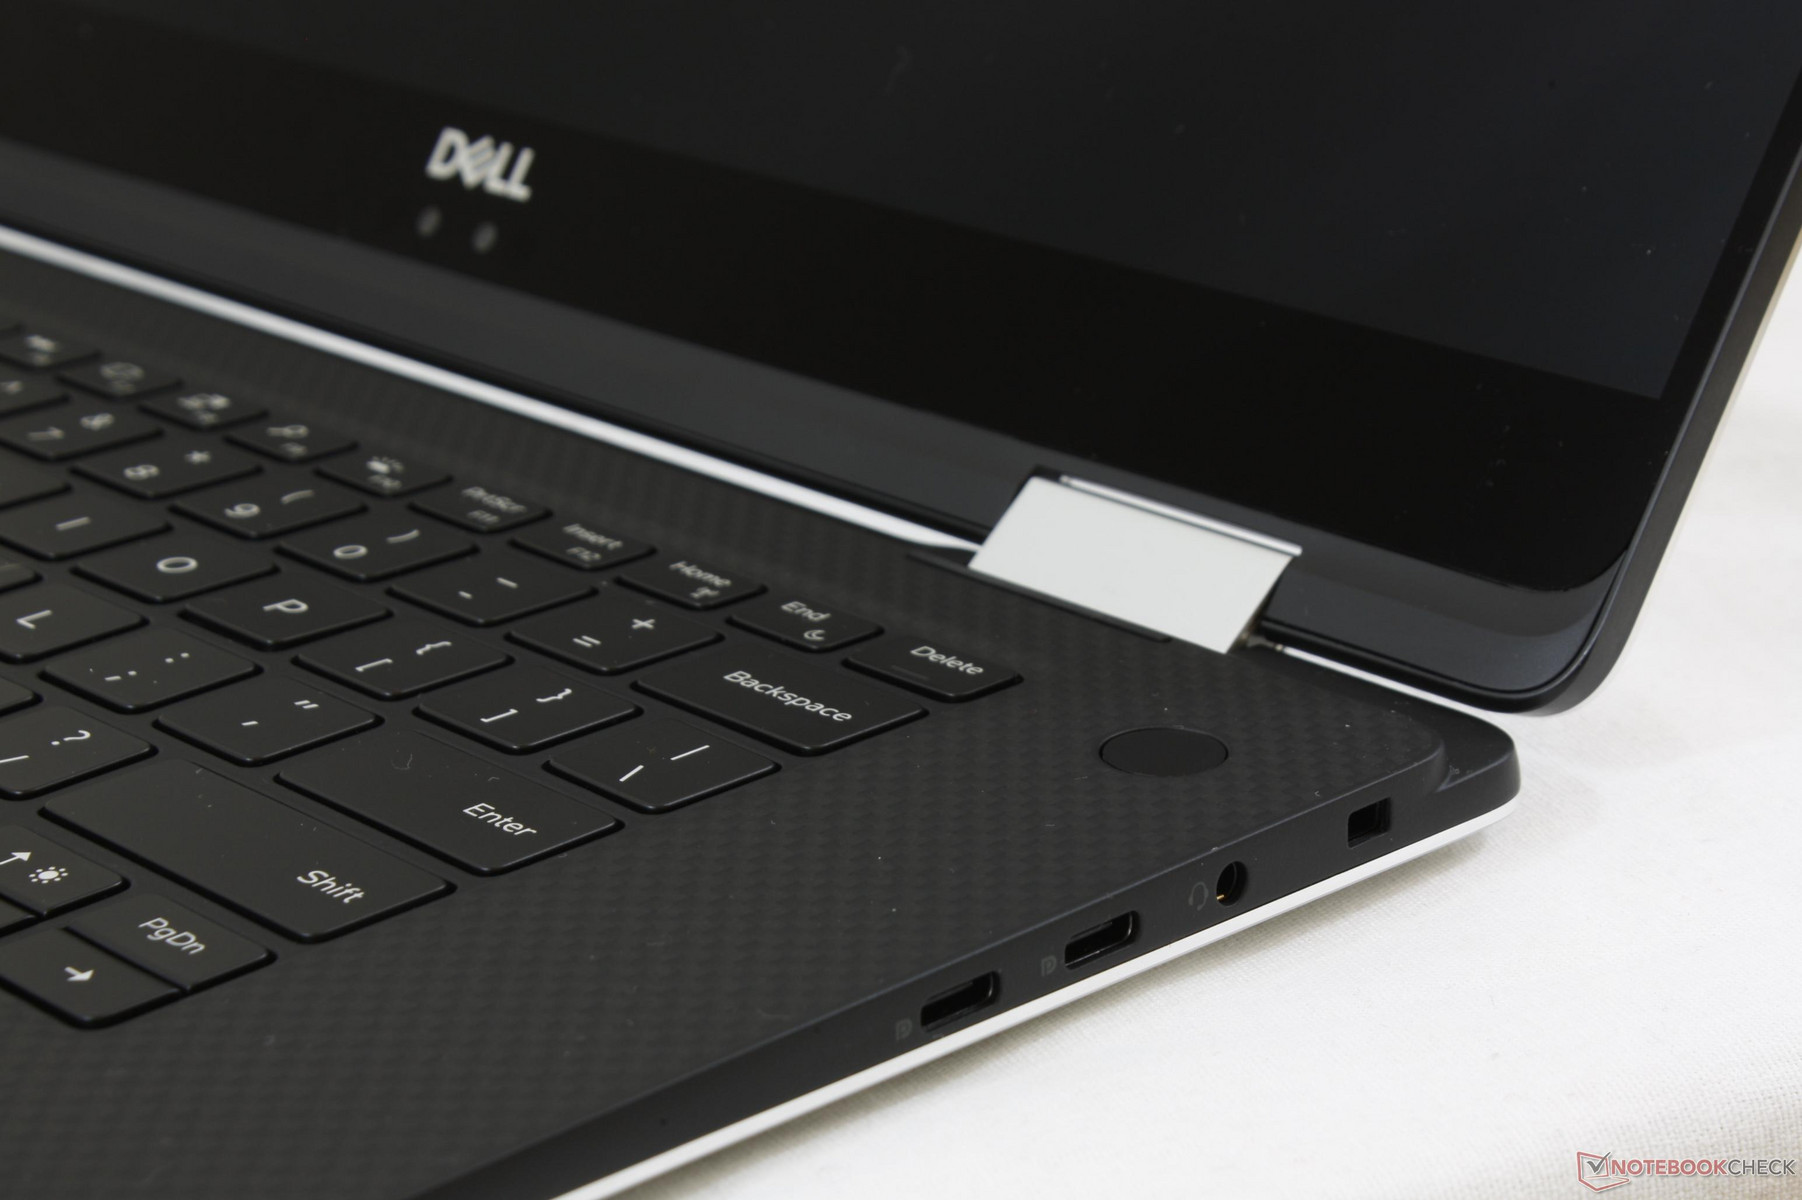
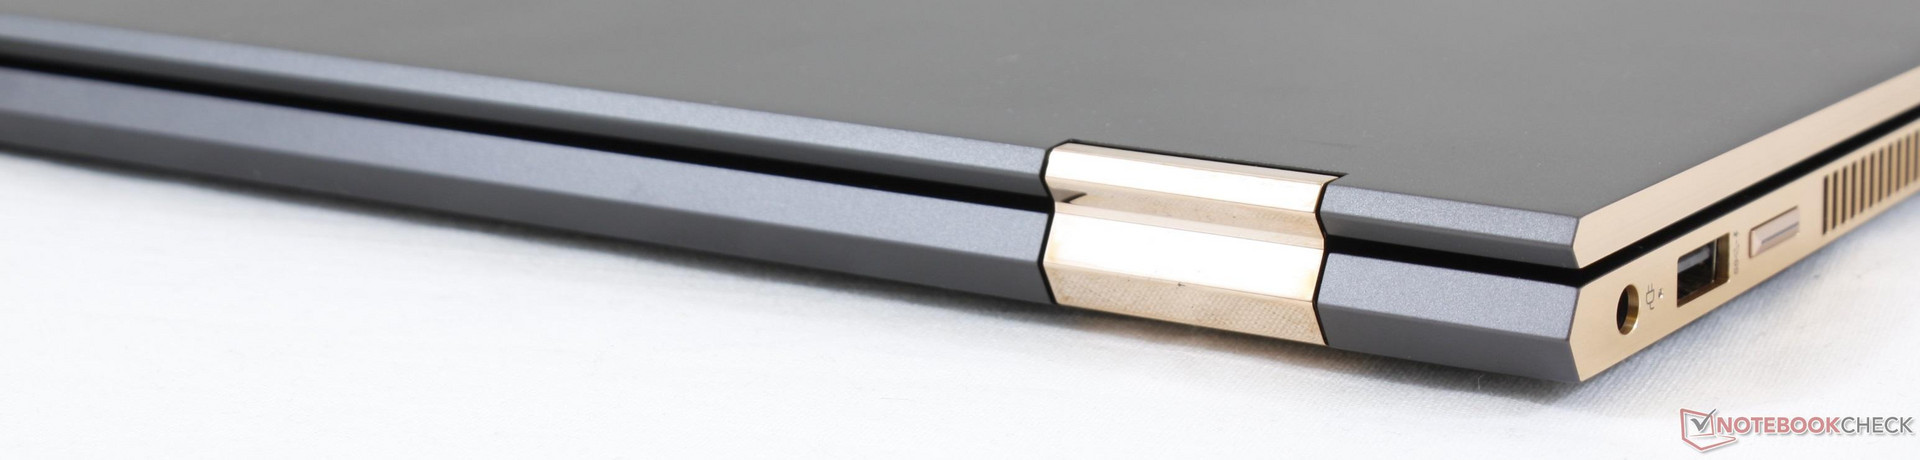
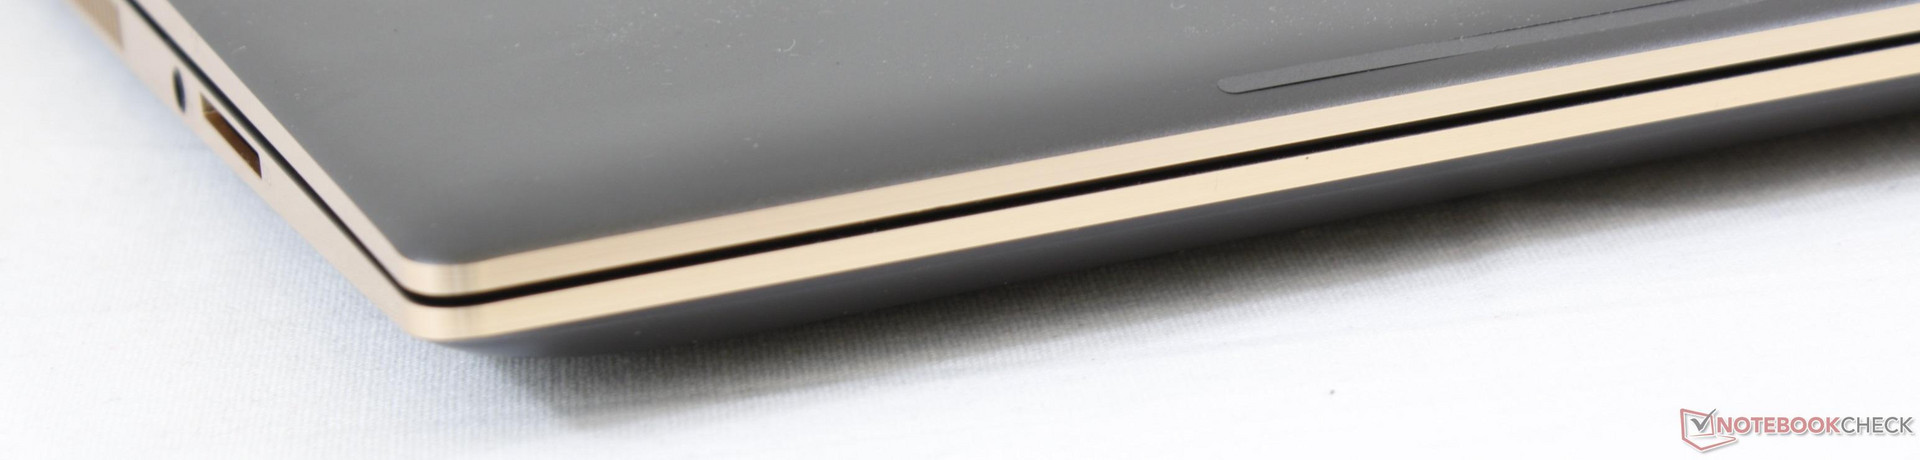
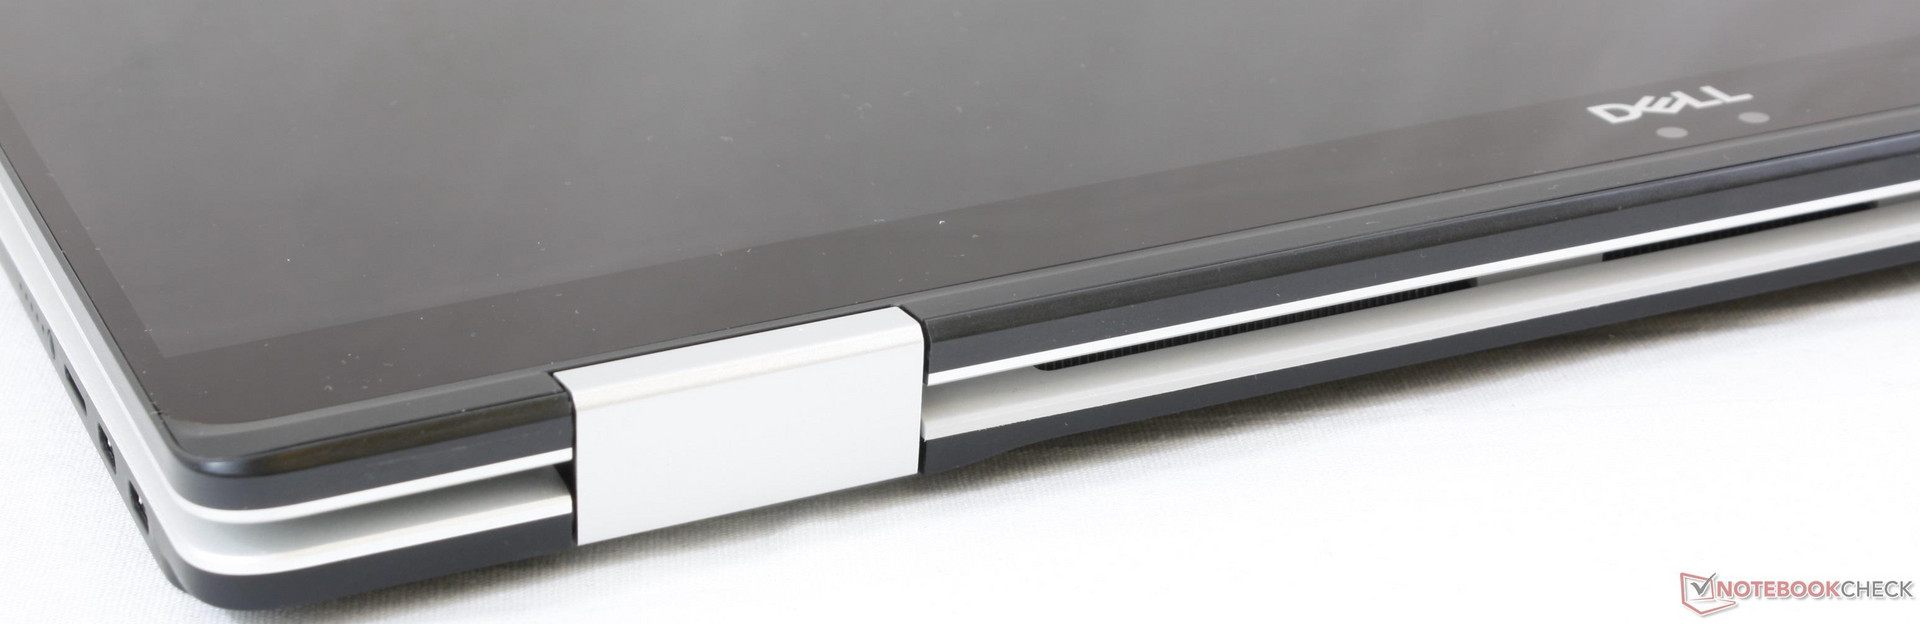
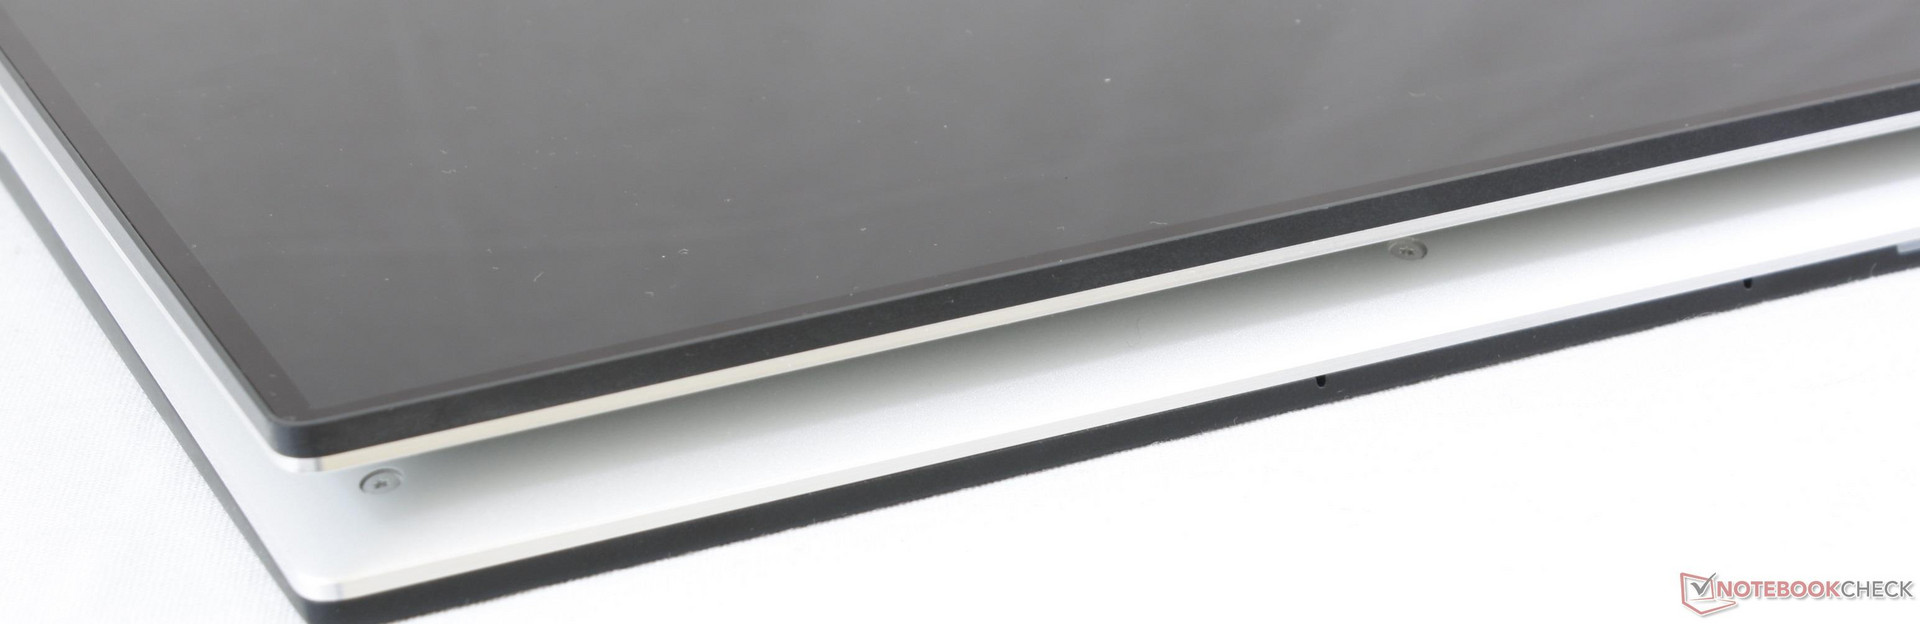
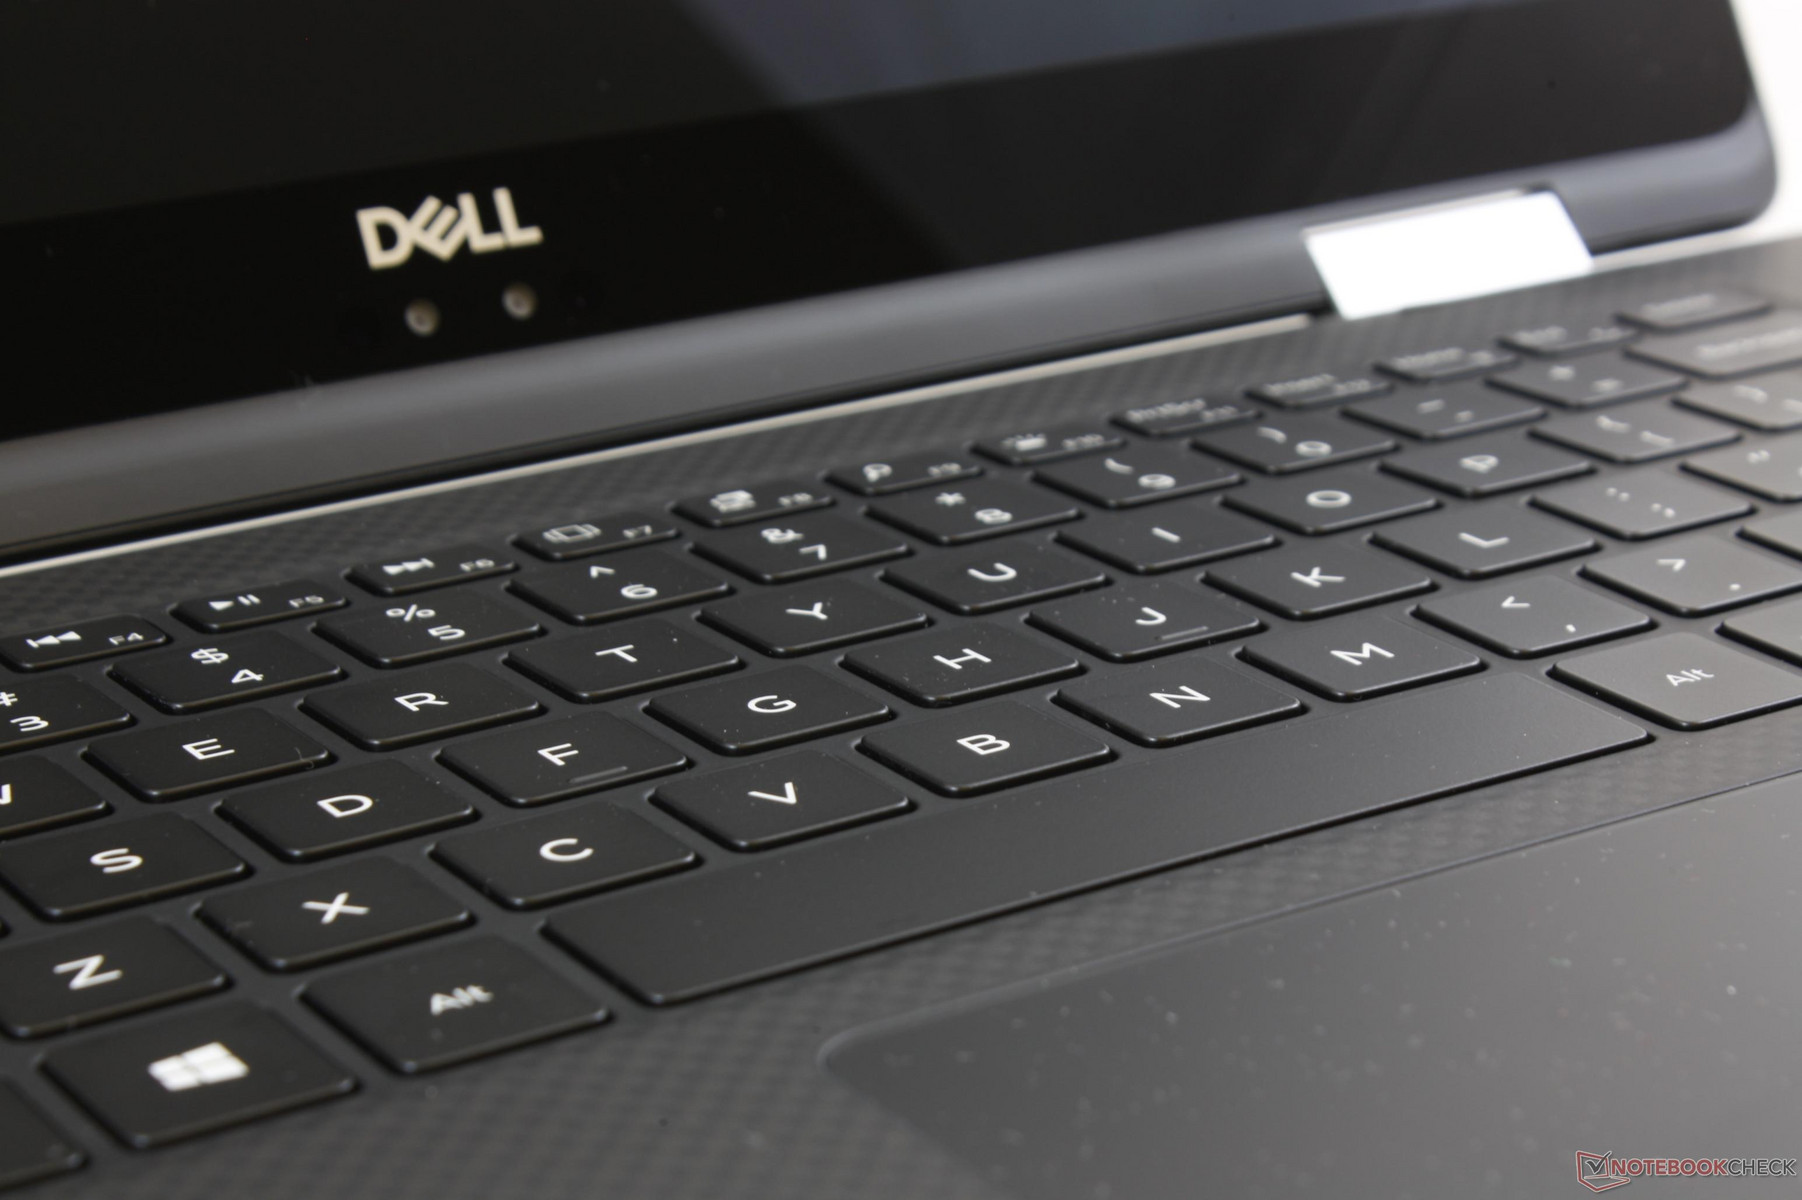
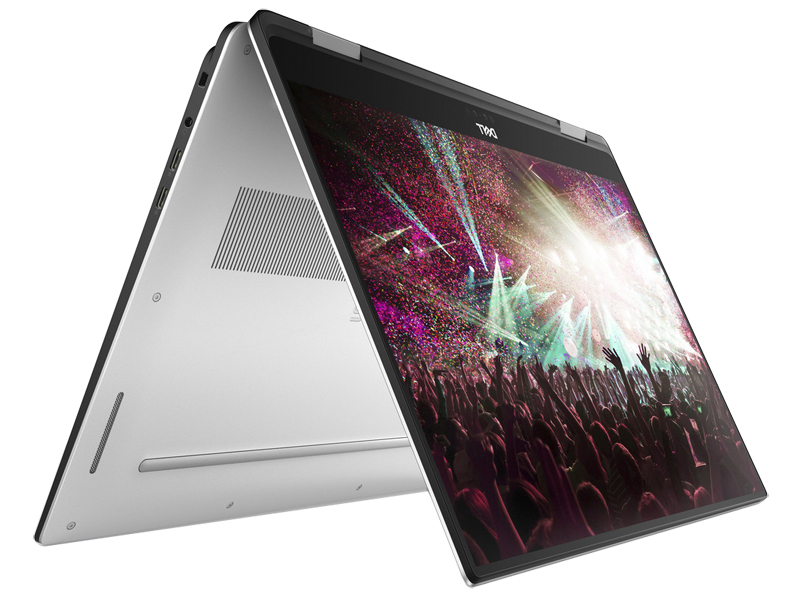
The Dell system is lighter, thinner, and smaller than the HP equivalent by several millimeters in each dimension. Users accustomed to handling an XPS 15 9550/9560/9570 will know exactly what to expect with the XPS 15 9575 as Dell has translated the design language almost perfectly for the 2-in-1 form factor. Both models show excellent build quality with minimal warping down the outer lid and keyboard base. We can't objectively rank one system better than the other in this regard.
We can, however, give the HP a small edge over the Dell. Its all-aluminum surfaces are much better at hiding fingerprints than the carbon fiber palm rests of the Dell and we believe this will help keep the HP system looking cleaner and newer over time. Otherwise, the Dell is preferable if portability and size are top concerns.
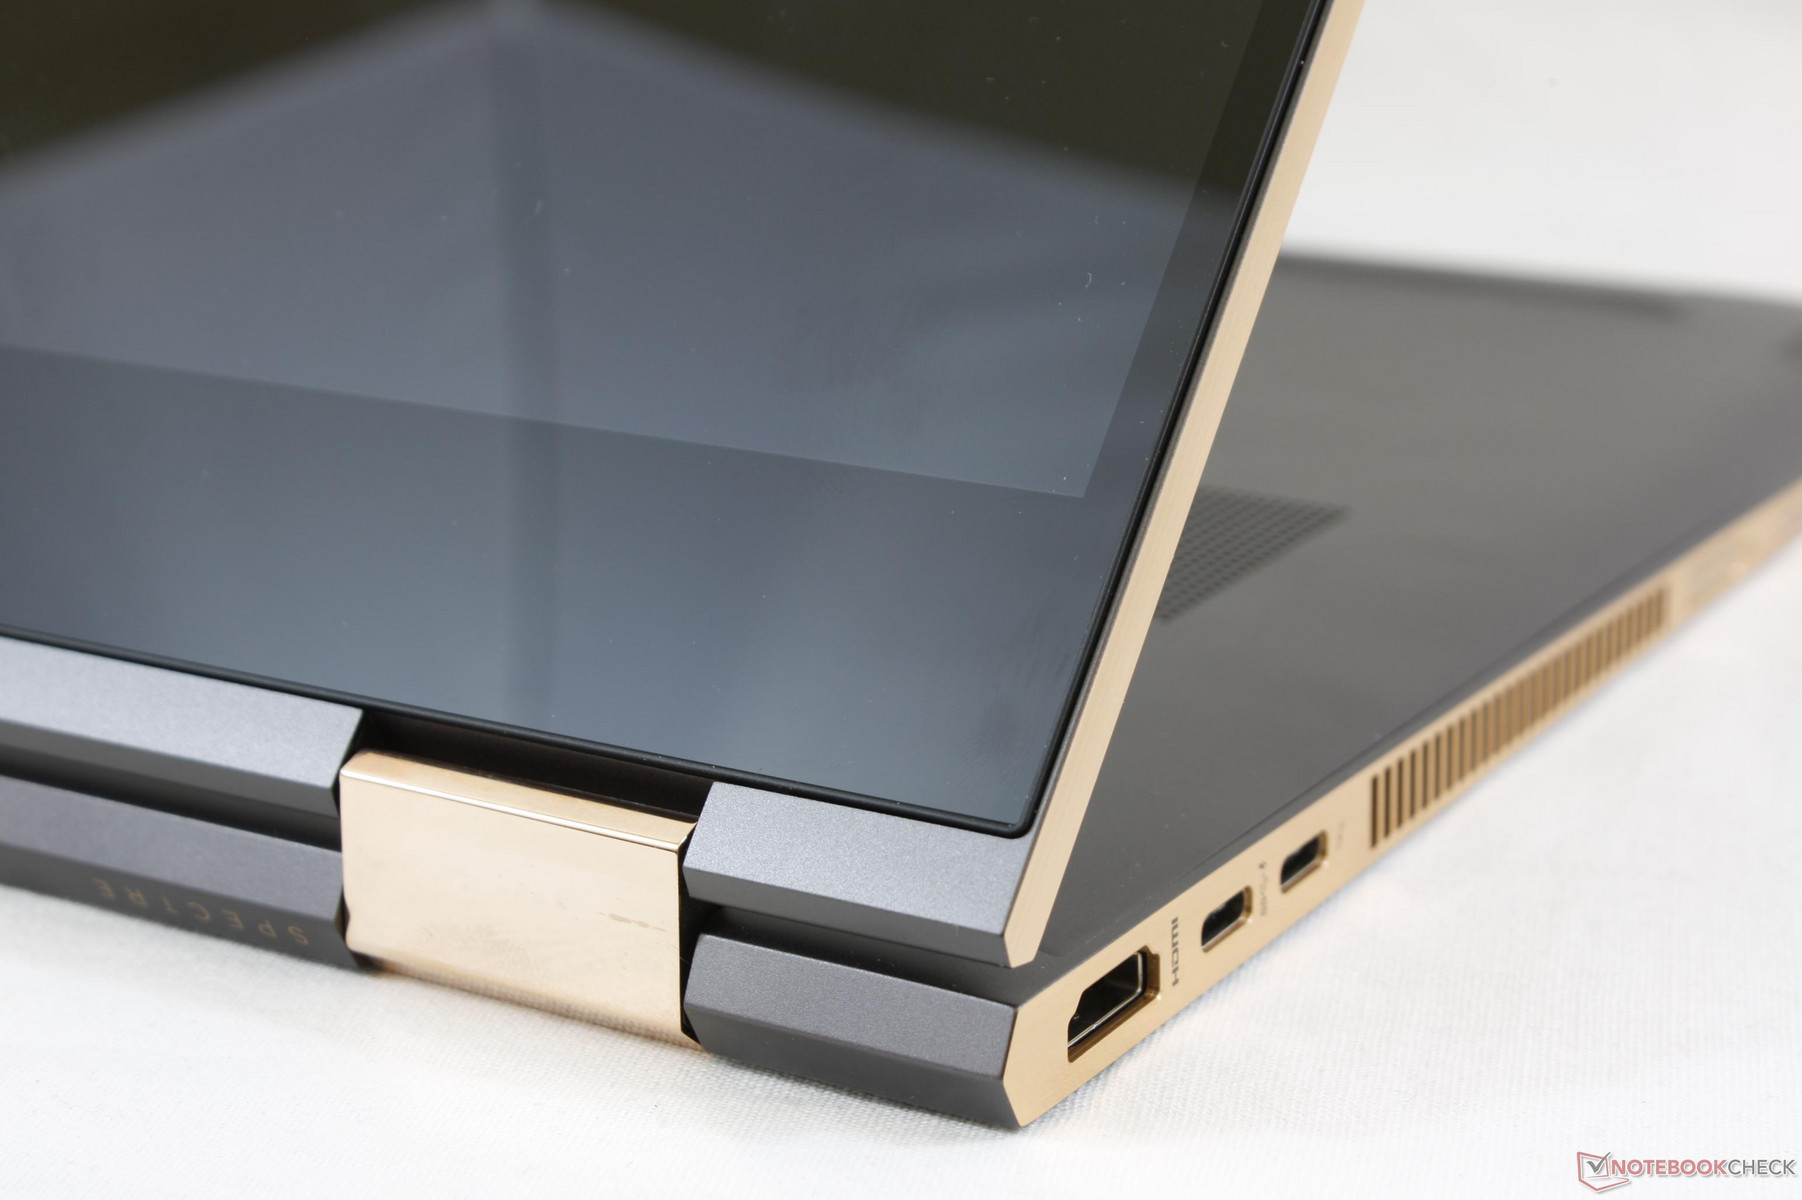
Connectivity
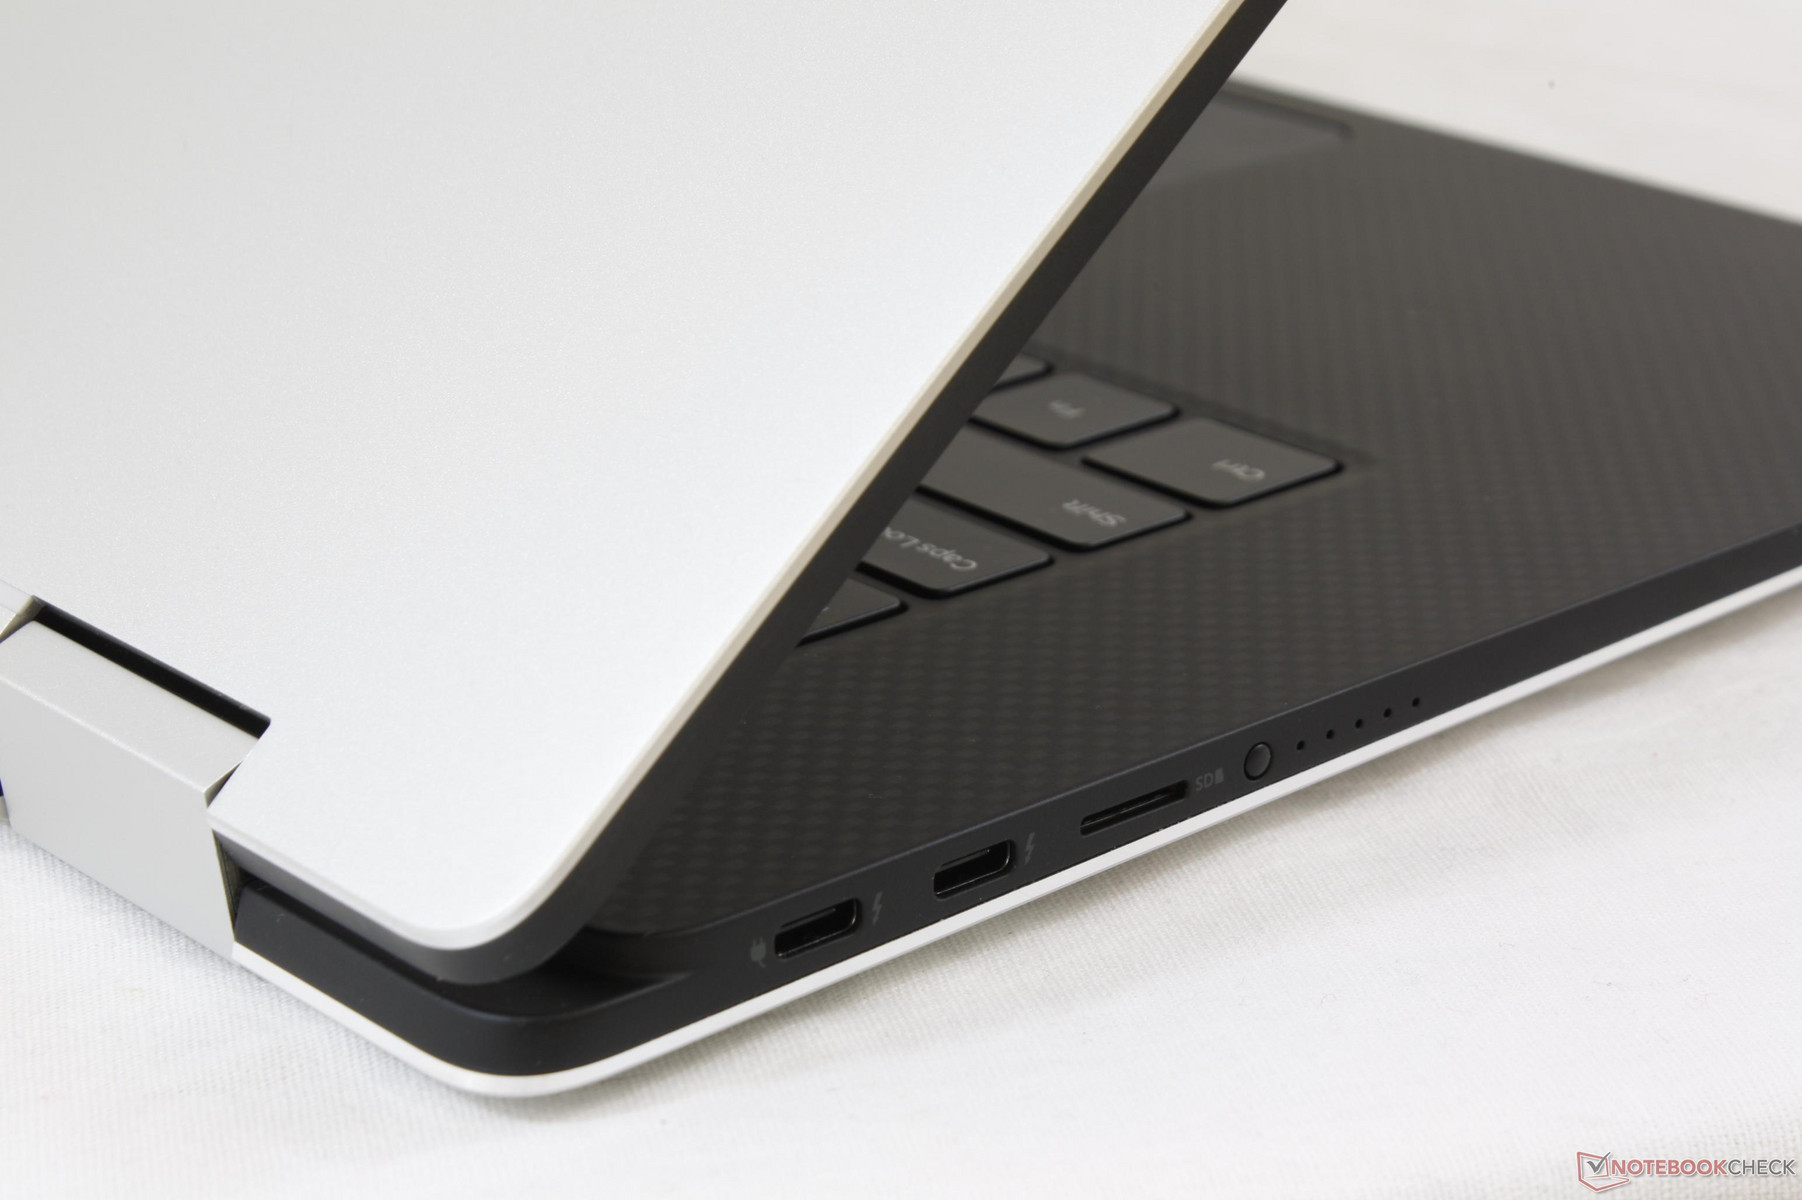
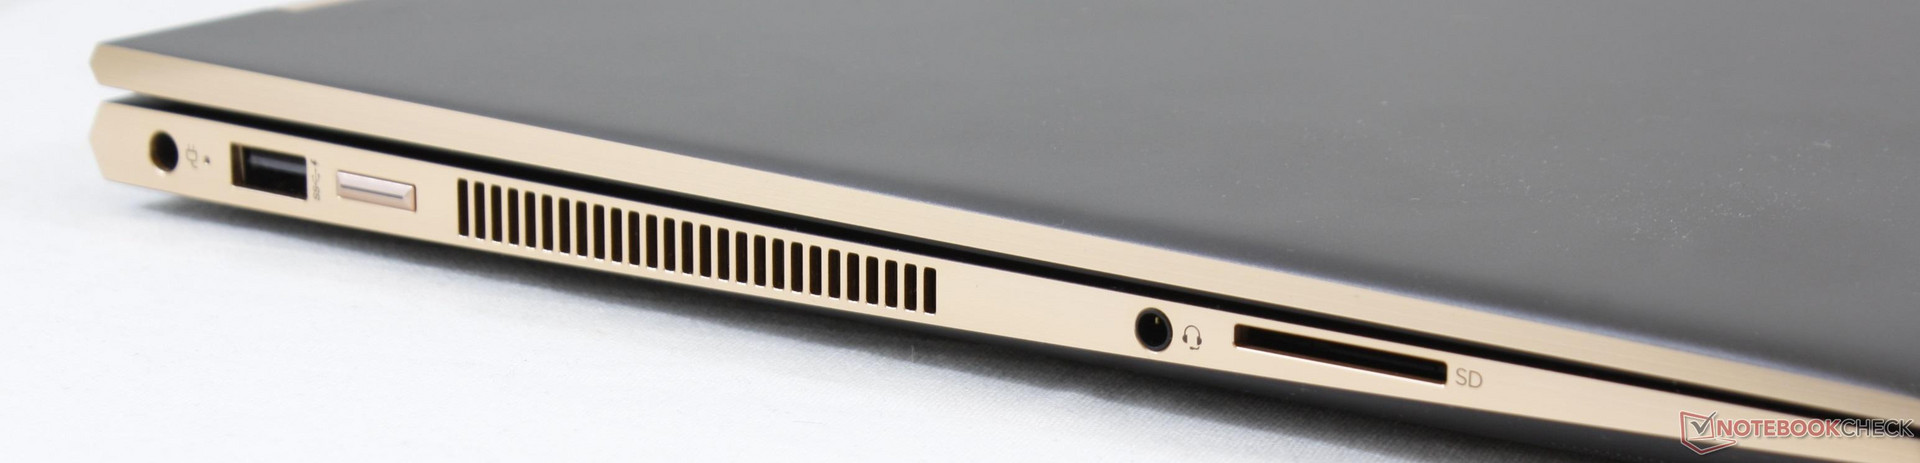
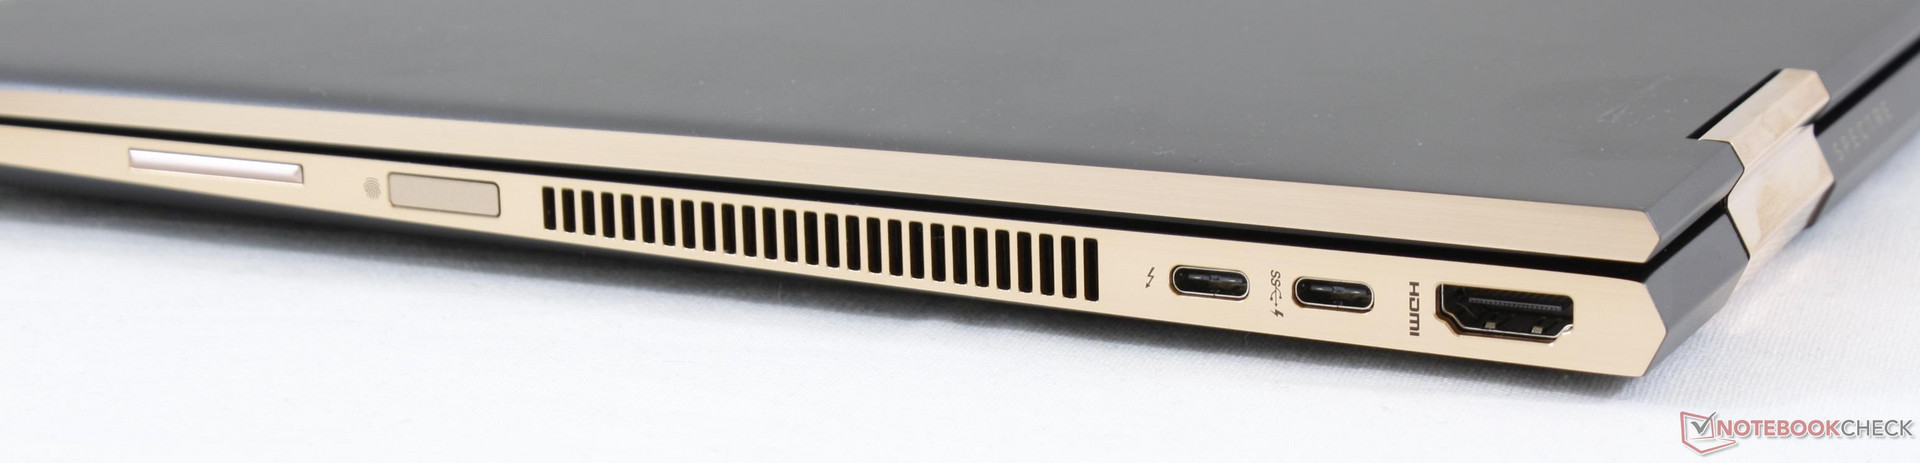
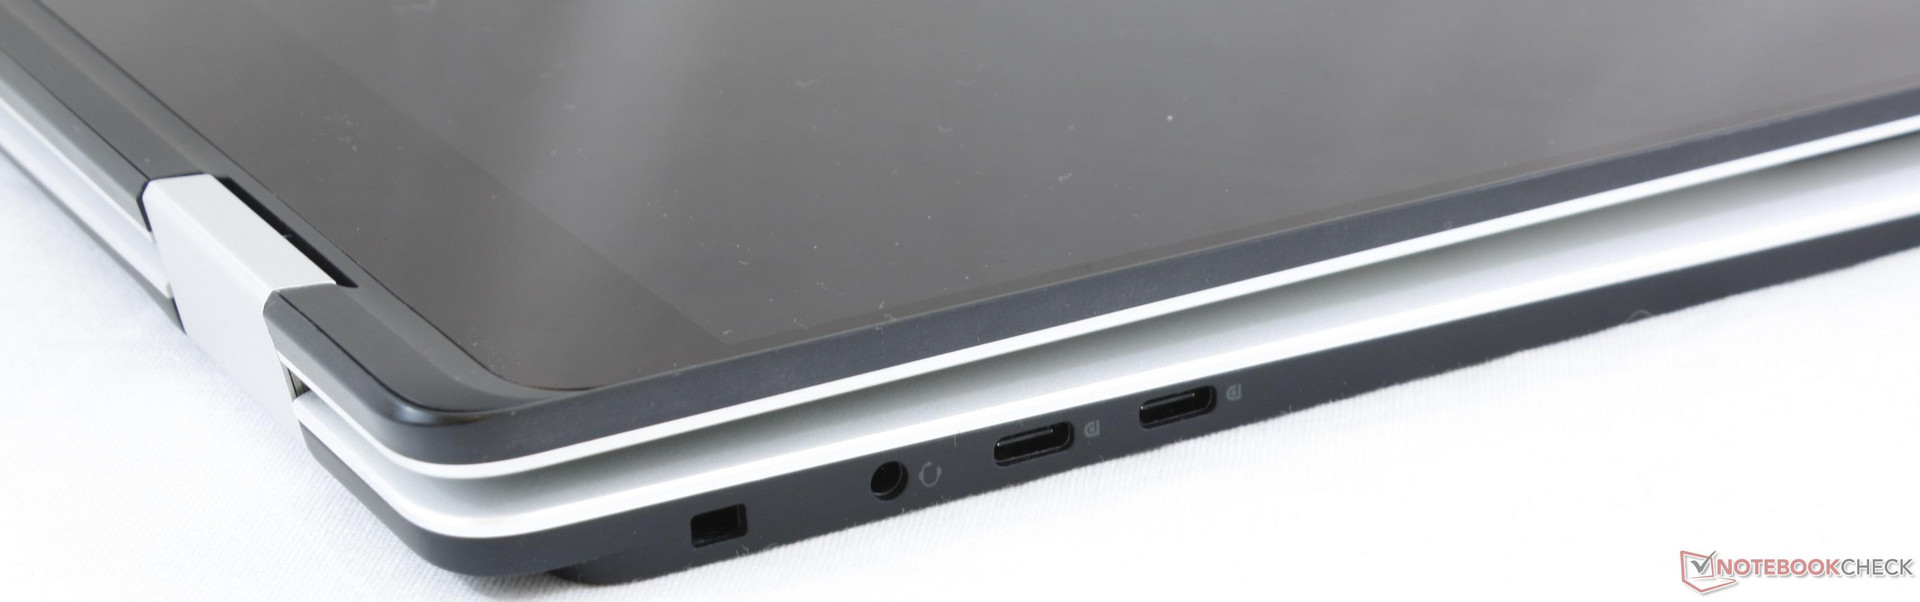
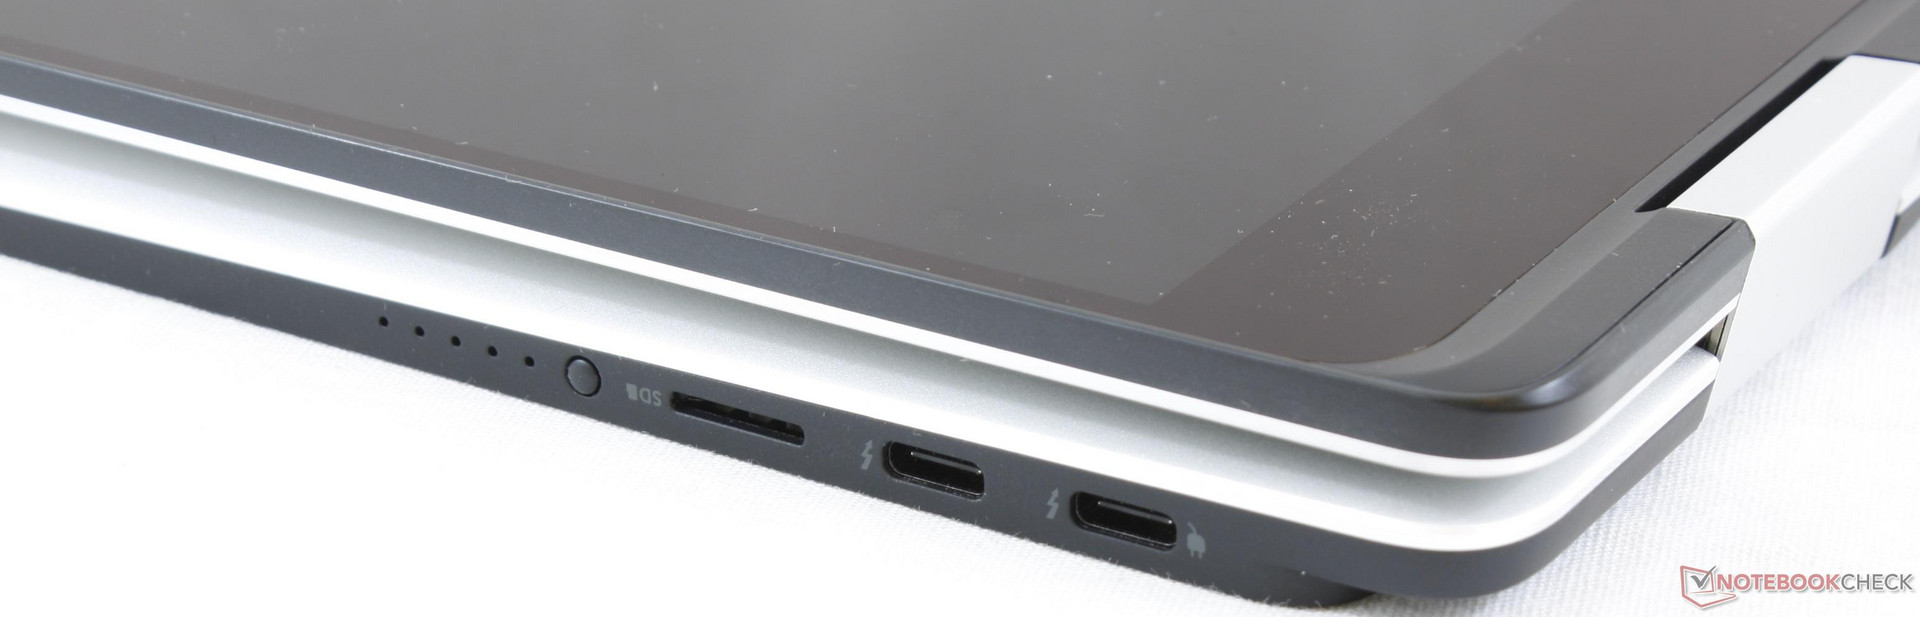
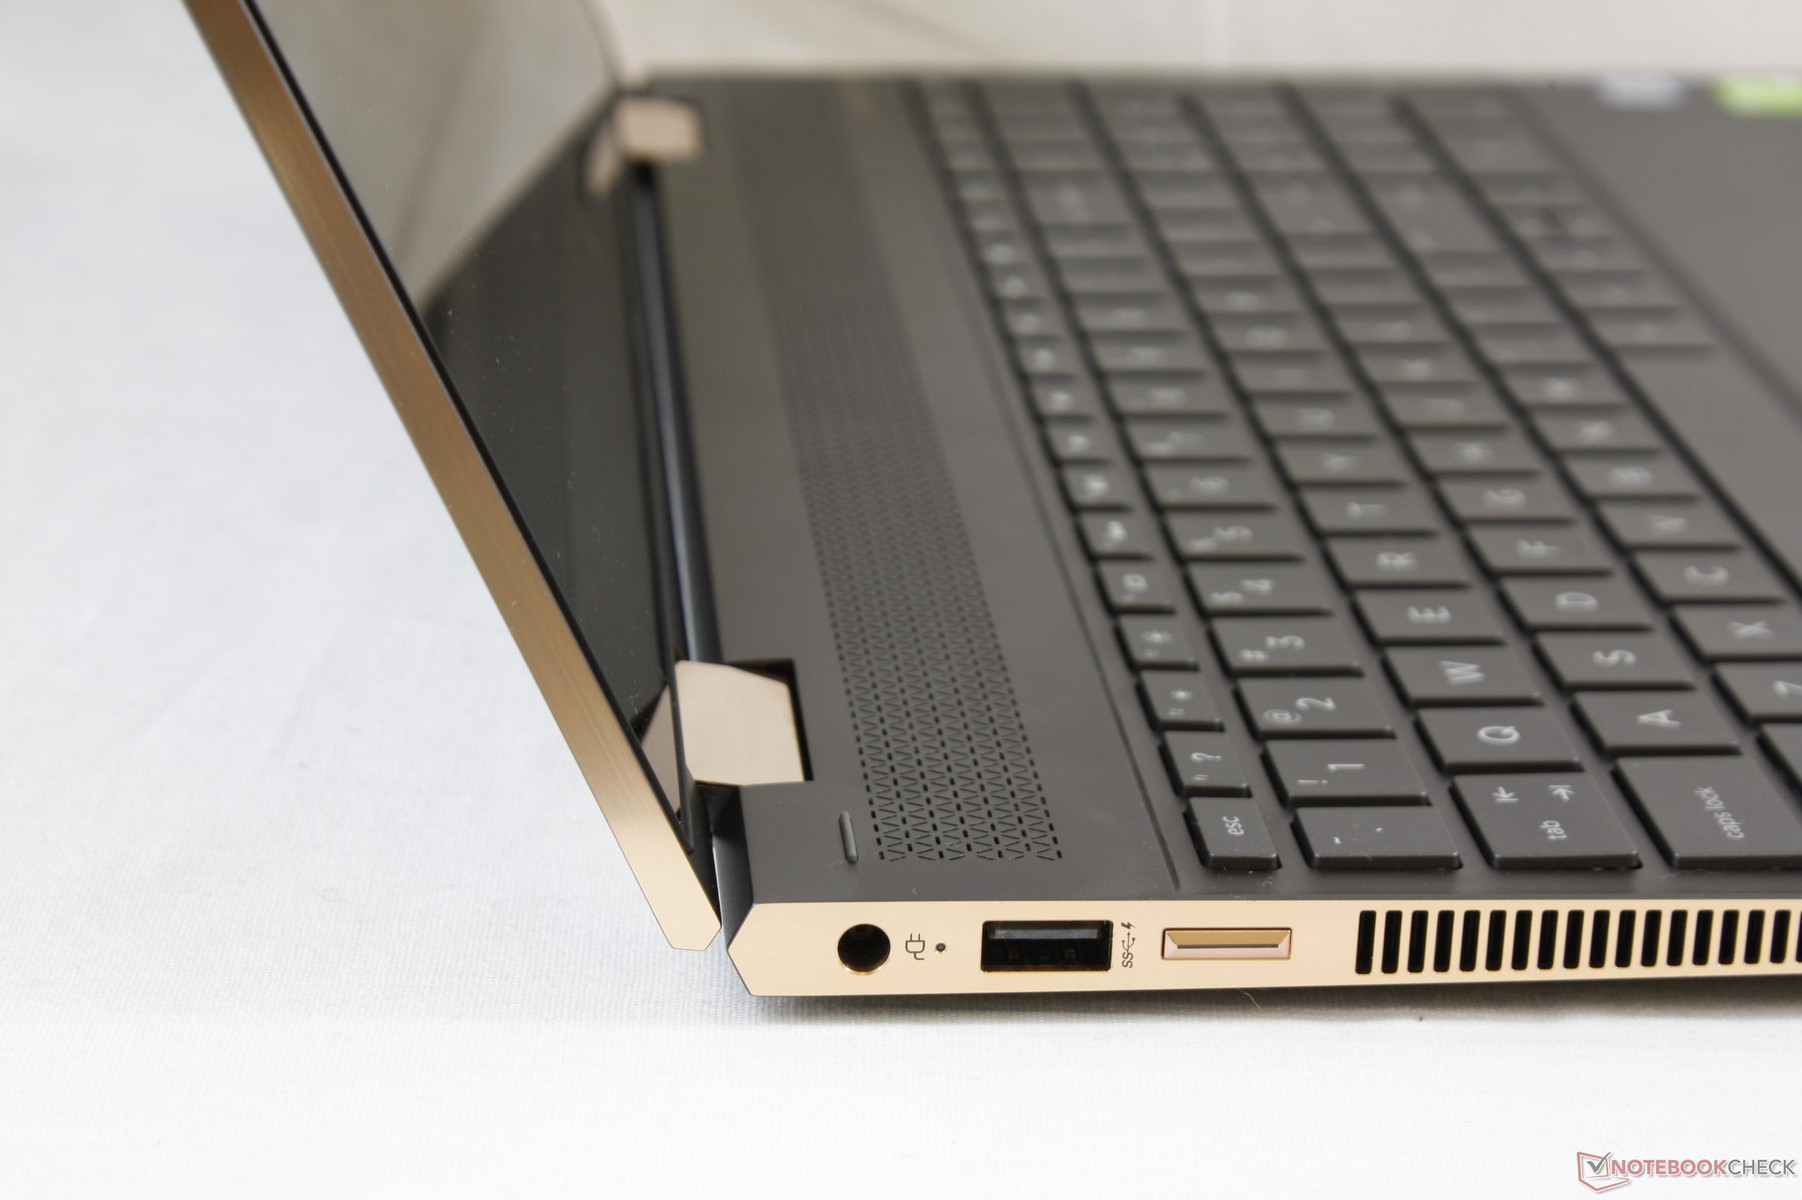
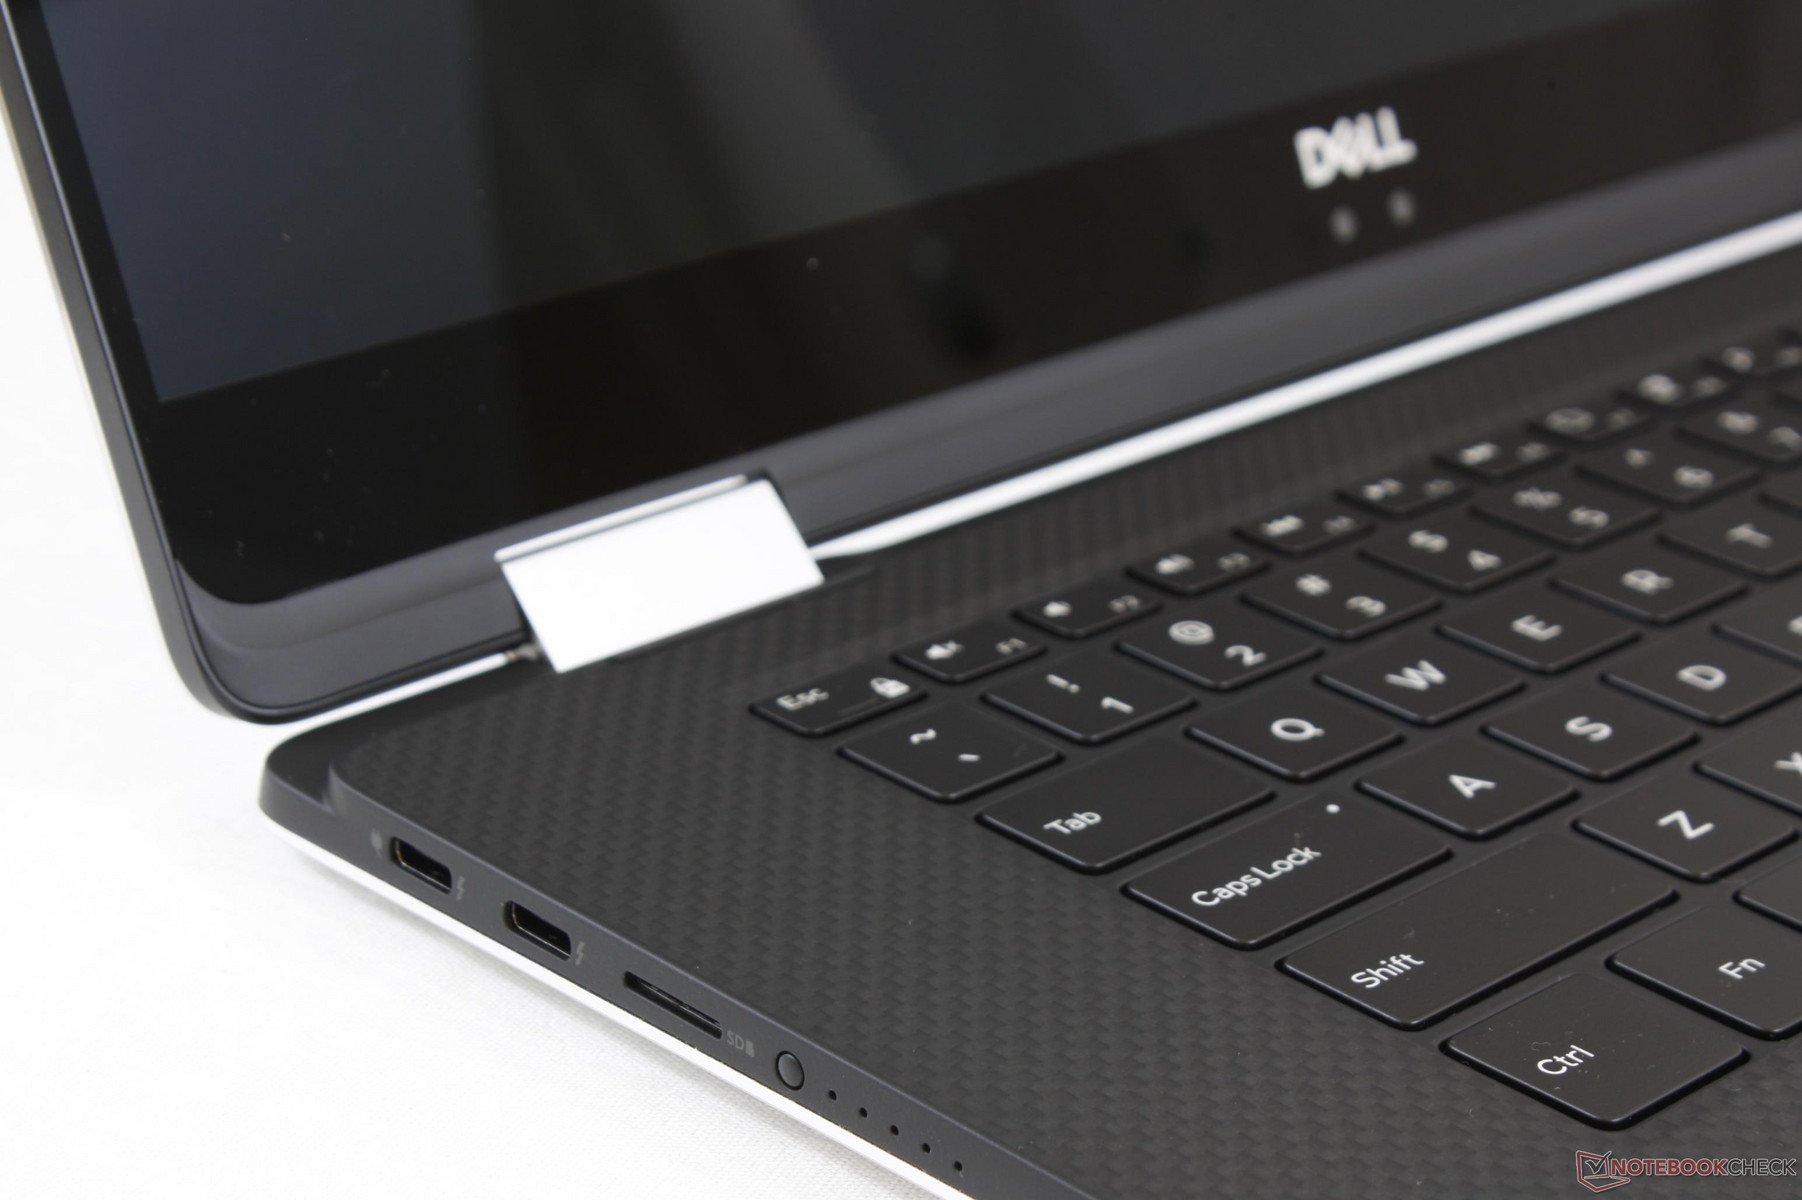
HP has the clear advantage here as far as port selection is concerned. The full-size SD reader, HDMI-out, and USB Type-A are all absent on the XPS 15 9575. Even the volume rocker is present on the HP only. In contrast, Dell owners should be prepared to carry Type-C adapters wherever they go as the system offers almost nothing other than four USB Type-C ports.
It’s important to remember that the Dell system utilizes USB Type-C for charging whereas the HP relies on a proprietary AC adapter port. The more versatile Dell adapter can also be used to charge other USB Type-C devices including smartphones and tablets.
| HP Spectre x360 15 2018 | Dell XPS 15 9575 | |
| USB | 1x USB 3.1 Type-A, 2x USB Type-C + Thunderbolt 3 | 4x USB Type-C (2x Thunderbolt 3) |
| Video-out | 1x HDMI, mDP via USB Type-C | mDP via USB Type-C |
| Audio | 3.5 mm combo | 3.5 mm combo |
| Other | SD reader | MicroSD reader |
| Storage Bays | 1x M.2 2280 | 1x M.2 2280 |
| SD Card Reader | |
| average JPG Copy Test (av. of 3 runs) | |
| HP Spectre x360 15-ch000 | |
| Dell XPS 15 9575 i7-8705G | |
| maximum AS SSD Seq Read Test (1GB) | |
| HP Spectre x360 15-ch000 | |
| Dell XPS 15 9575 i7-8705G | |
| Networking | |
| iperf3 transmit AX12 | |
| Dell XPS 15 9575 i7-8705G | |
| HP Spectre x360 15-ch000 | |
| iperf3 receive AX12 | |
| Dell XPS 15 9575 i7-8705G | |
| HP Spectre x360 15-ch000 | |
Input Devices
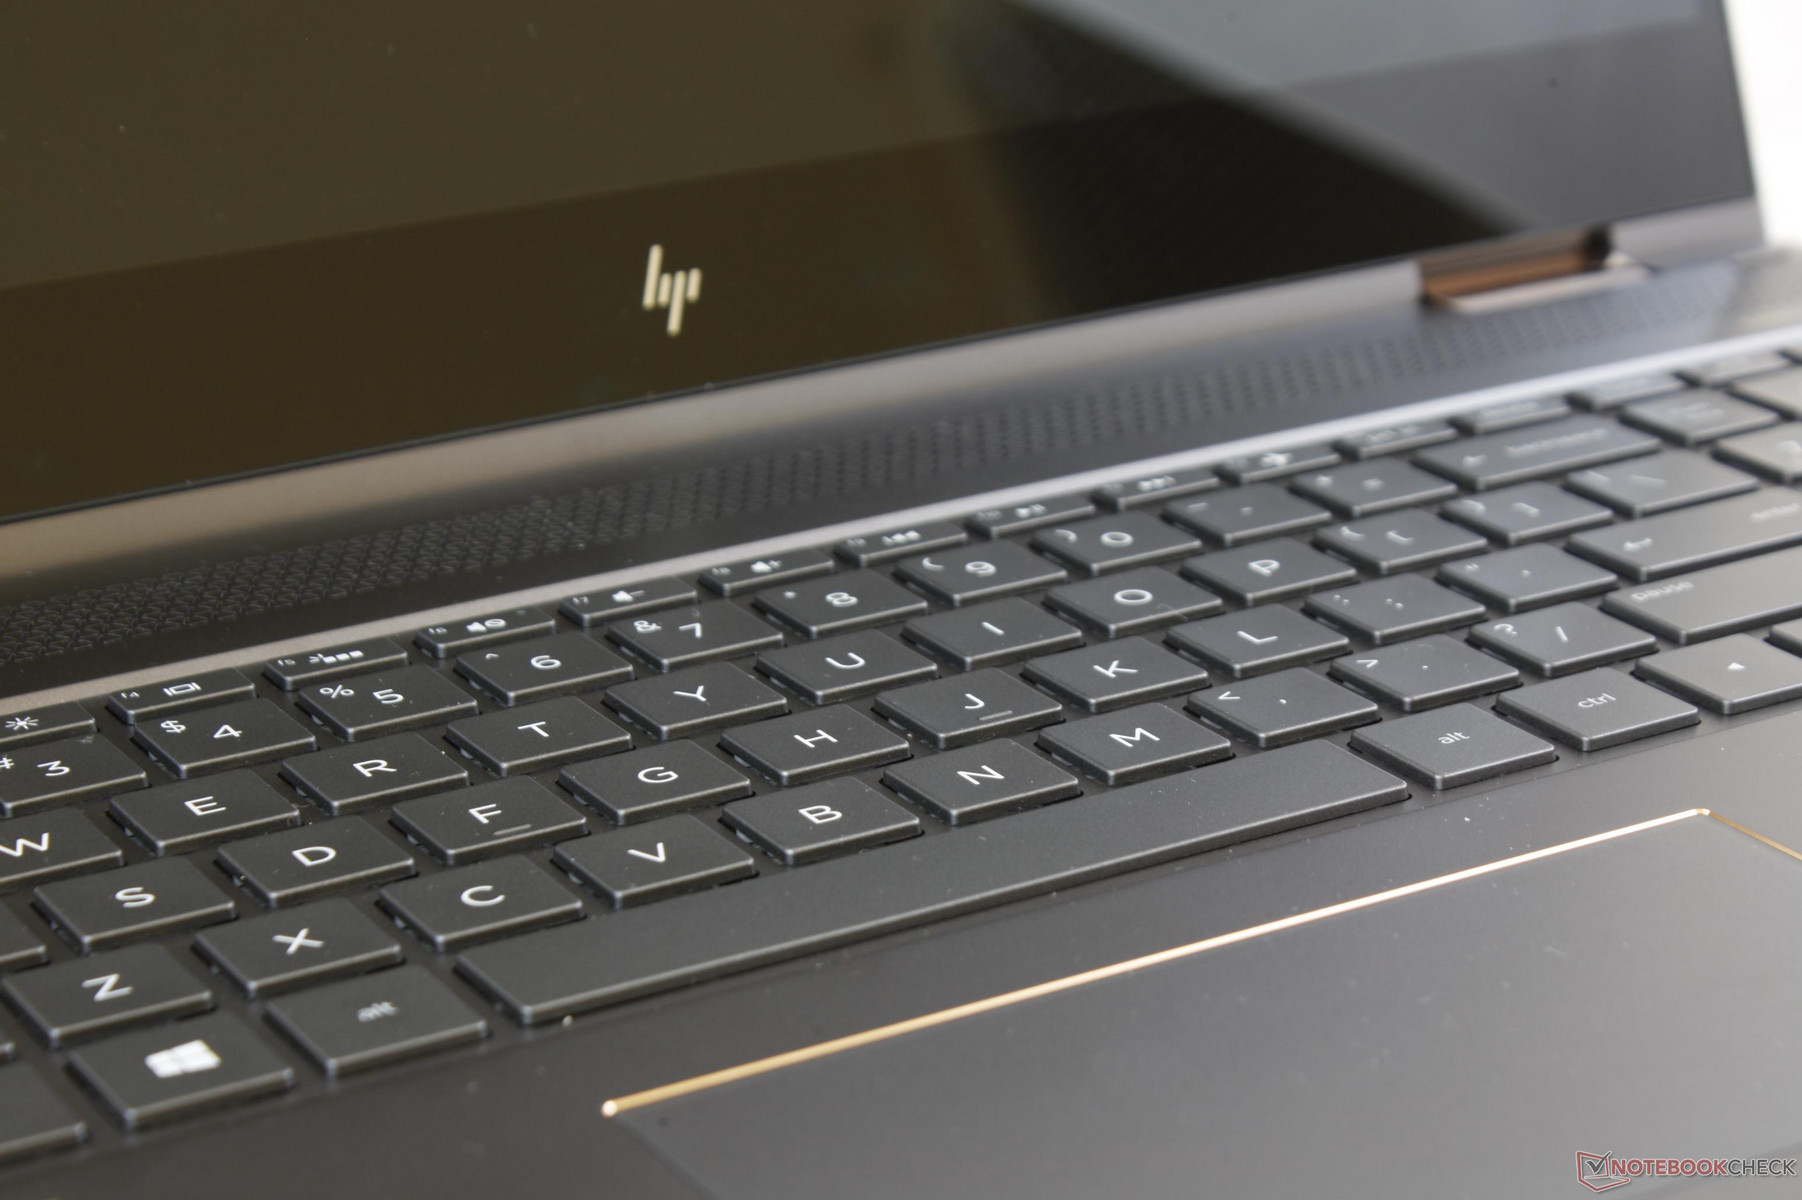
The keyboards and trackpads couldn’t be more different between the HP and Dell. While the Spectre utilizes a more traditional membrane-based keyboard with a dedicated NumPad, the XPS 15 9575 opts for a one-of-a-kind MagLev keyboard with no NumPad. Key travel is over three times deeper on the HP as a result since the MagLev keys are designed to provide firm feedback without requiring deep key depth.
A notable advantage for the XPS 15 9575 is that its MagLev keys promise excellent feedback consistency over time whereas the traditional keys on the HP may eventually wear down from heavy use. Otherwise, typing quality comes down to user preference as we don’t particularly find one set of keys to be objectively better than the other.
The roomier and squarer trackpad of the Dell is generally more comfortable to use for multi-touch inputs compared to the unique 2:1 aspect ratio of the HP trackpad. Regardless, the integrated trackpad mouse keys are about equally poor and spongy on both systems.
Display
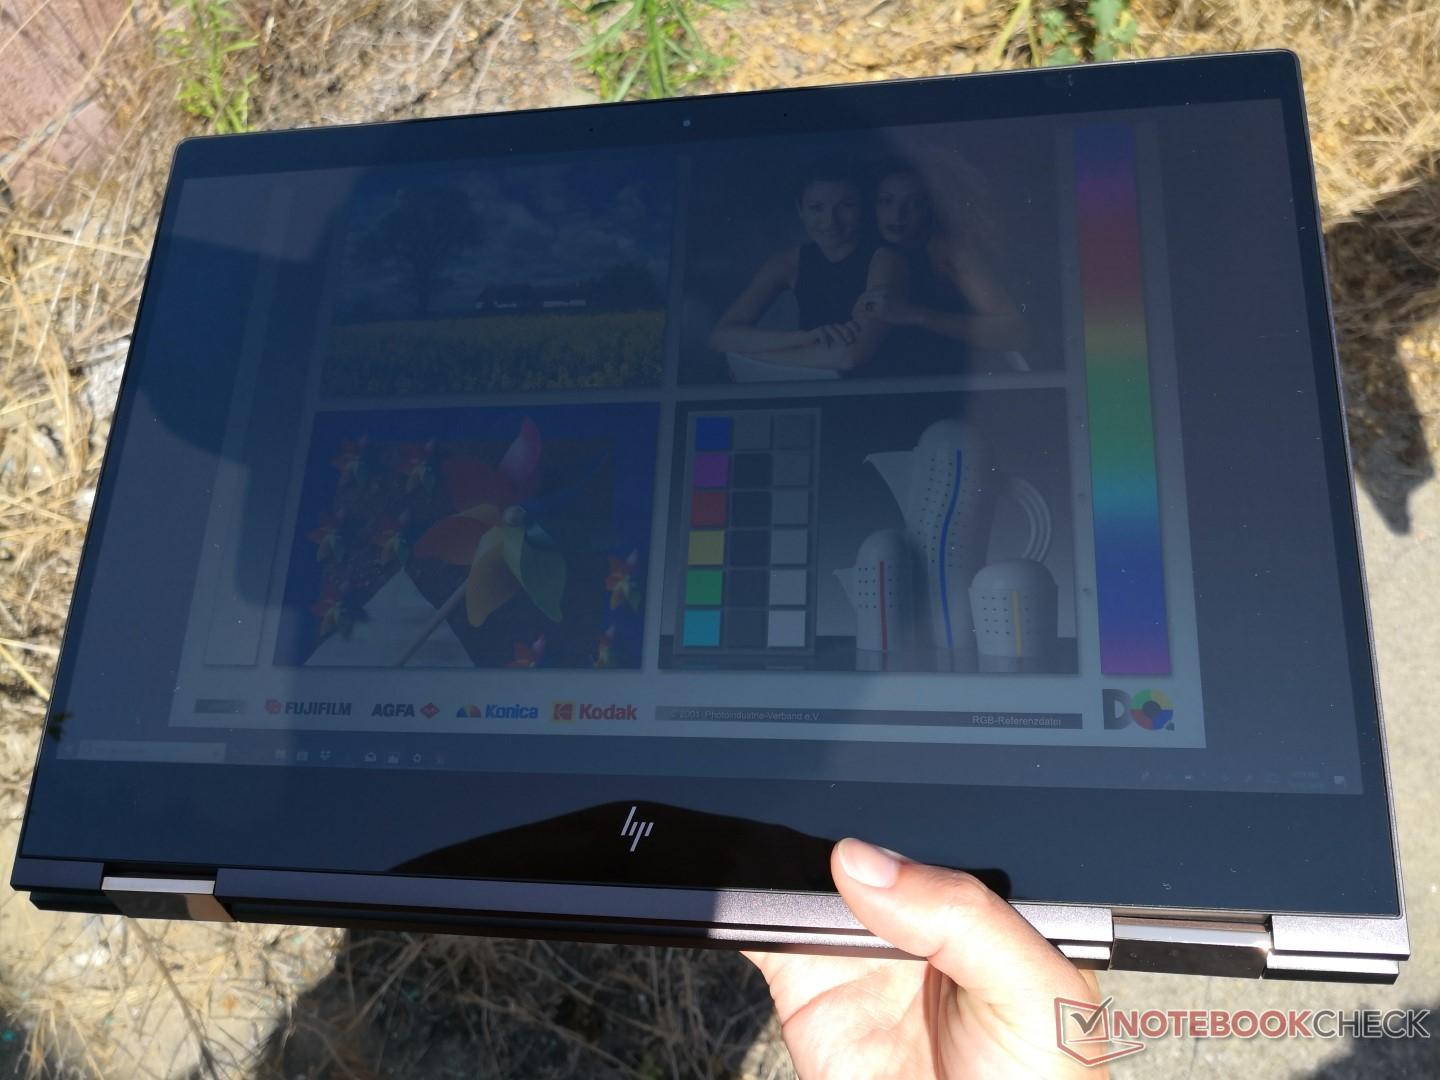
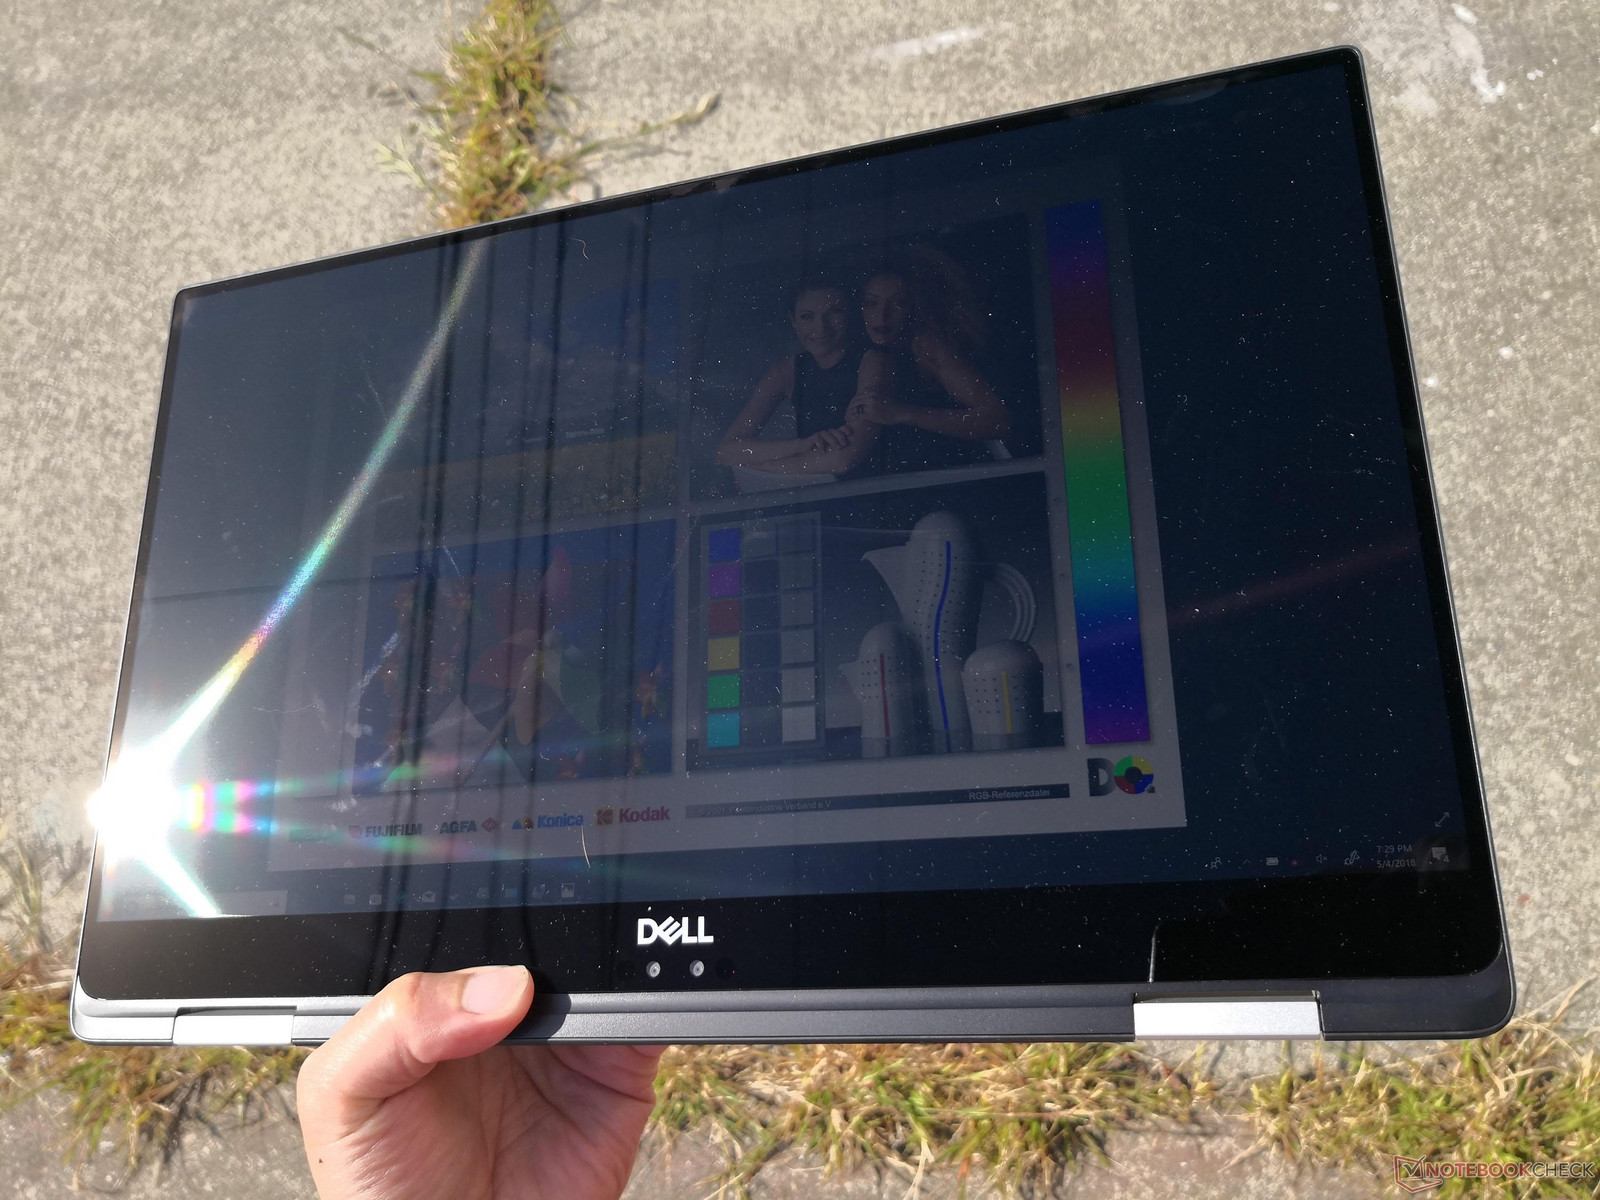
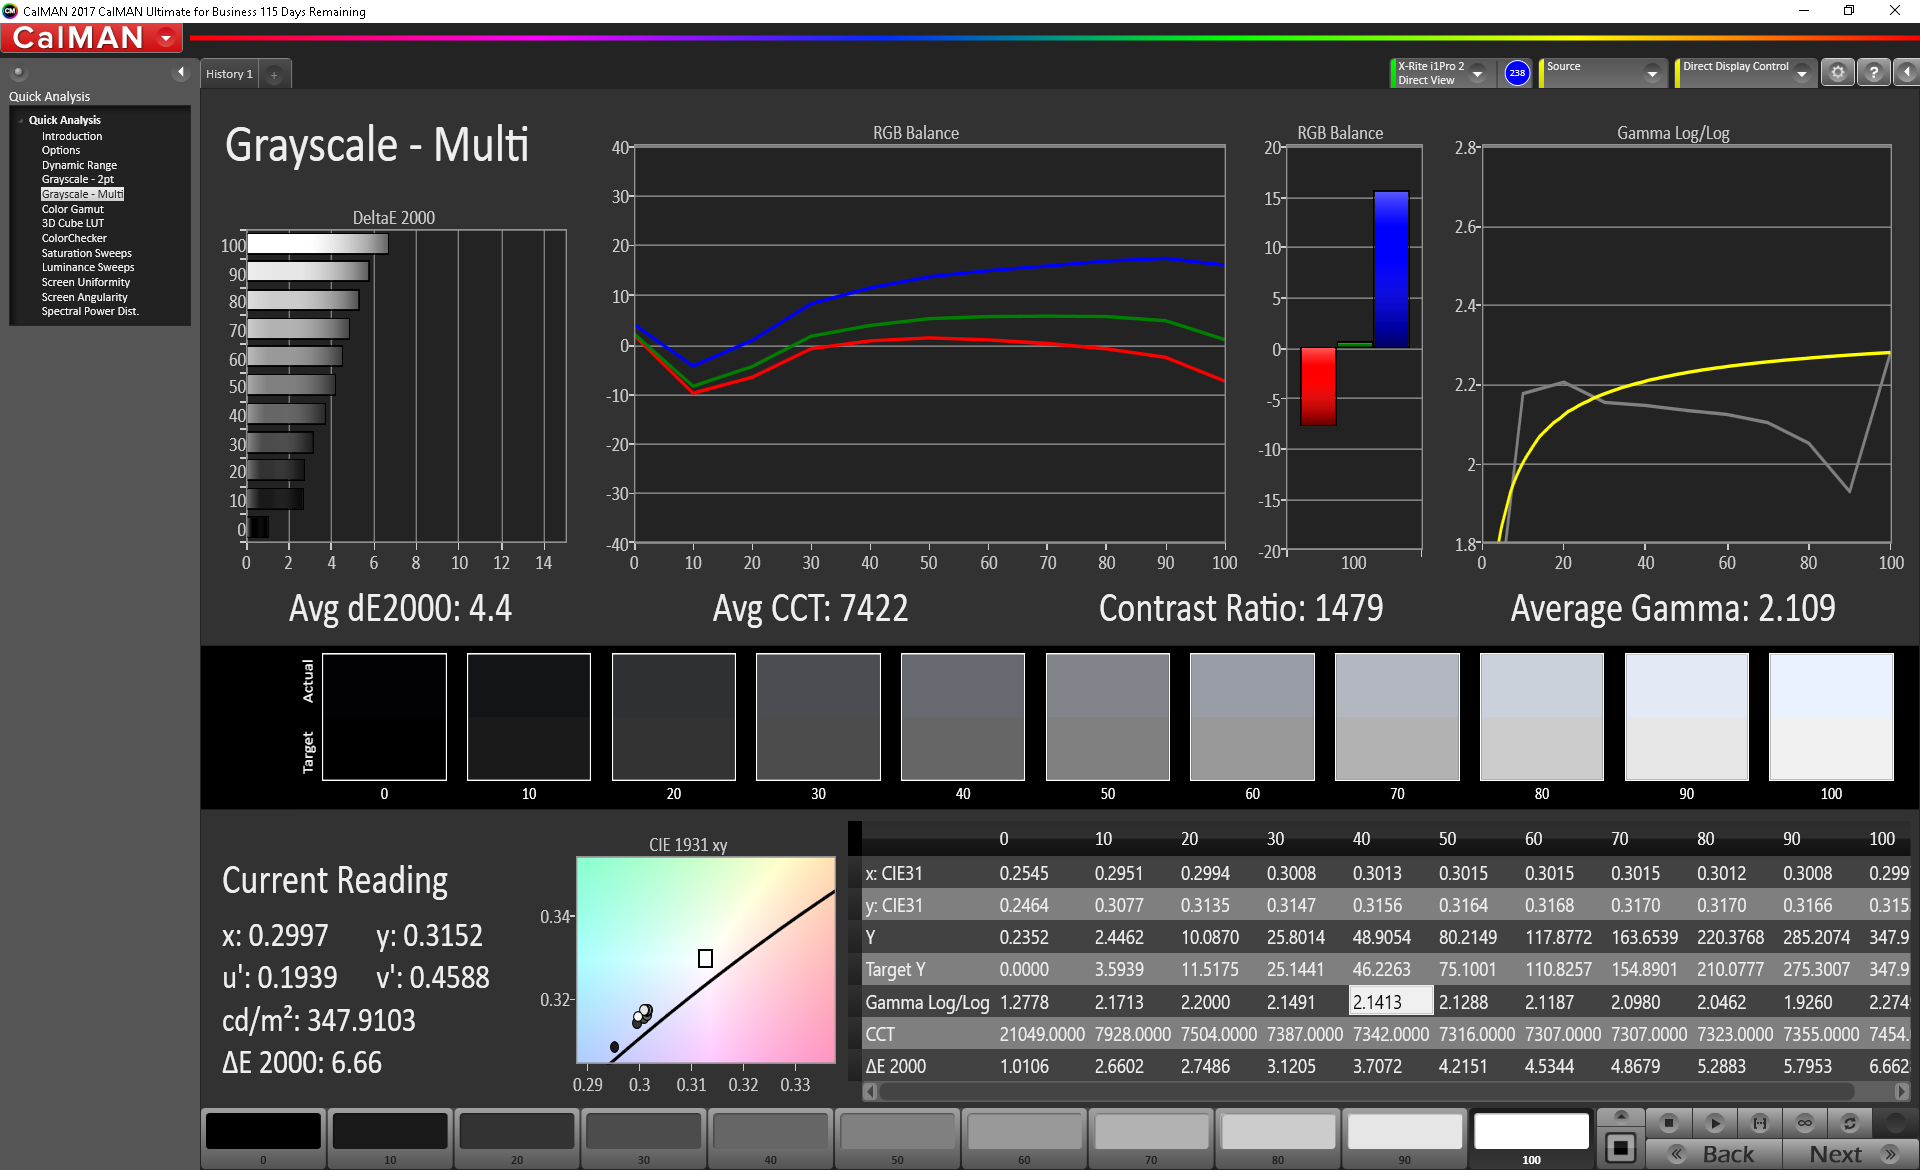
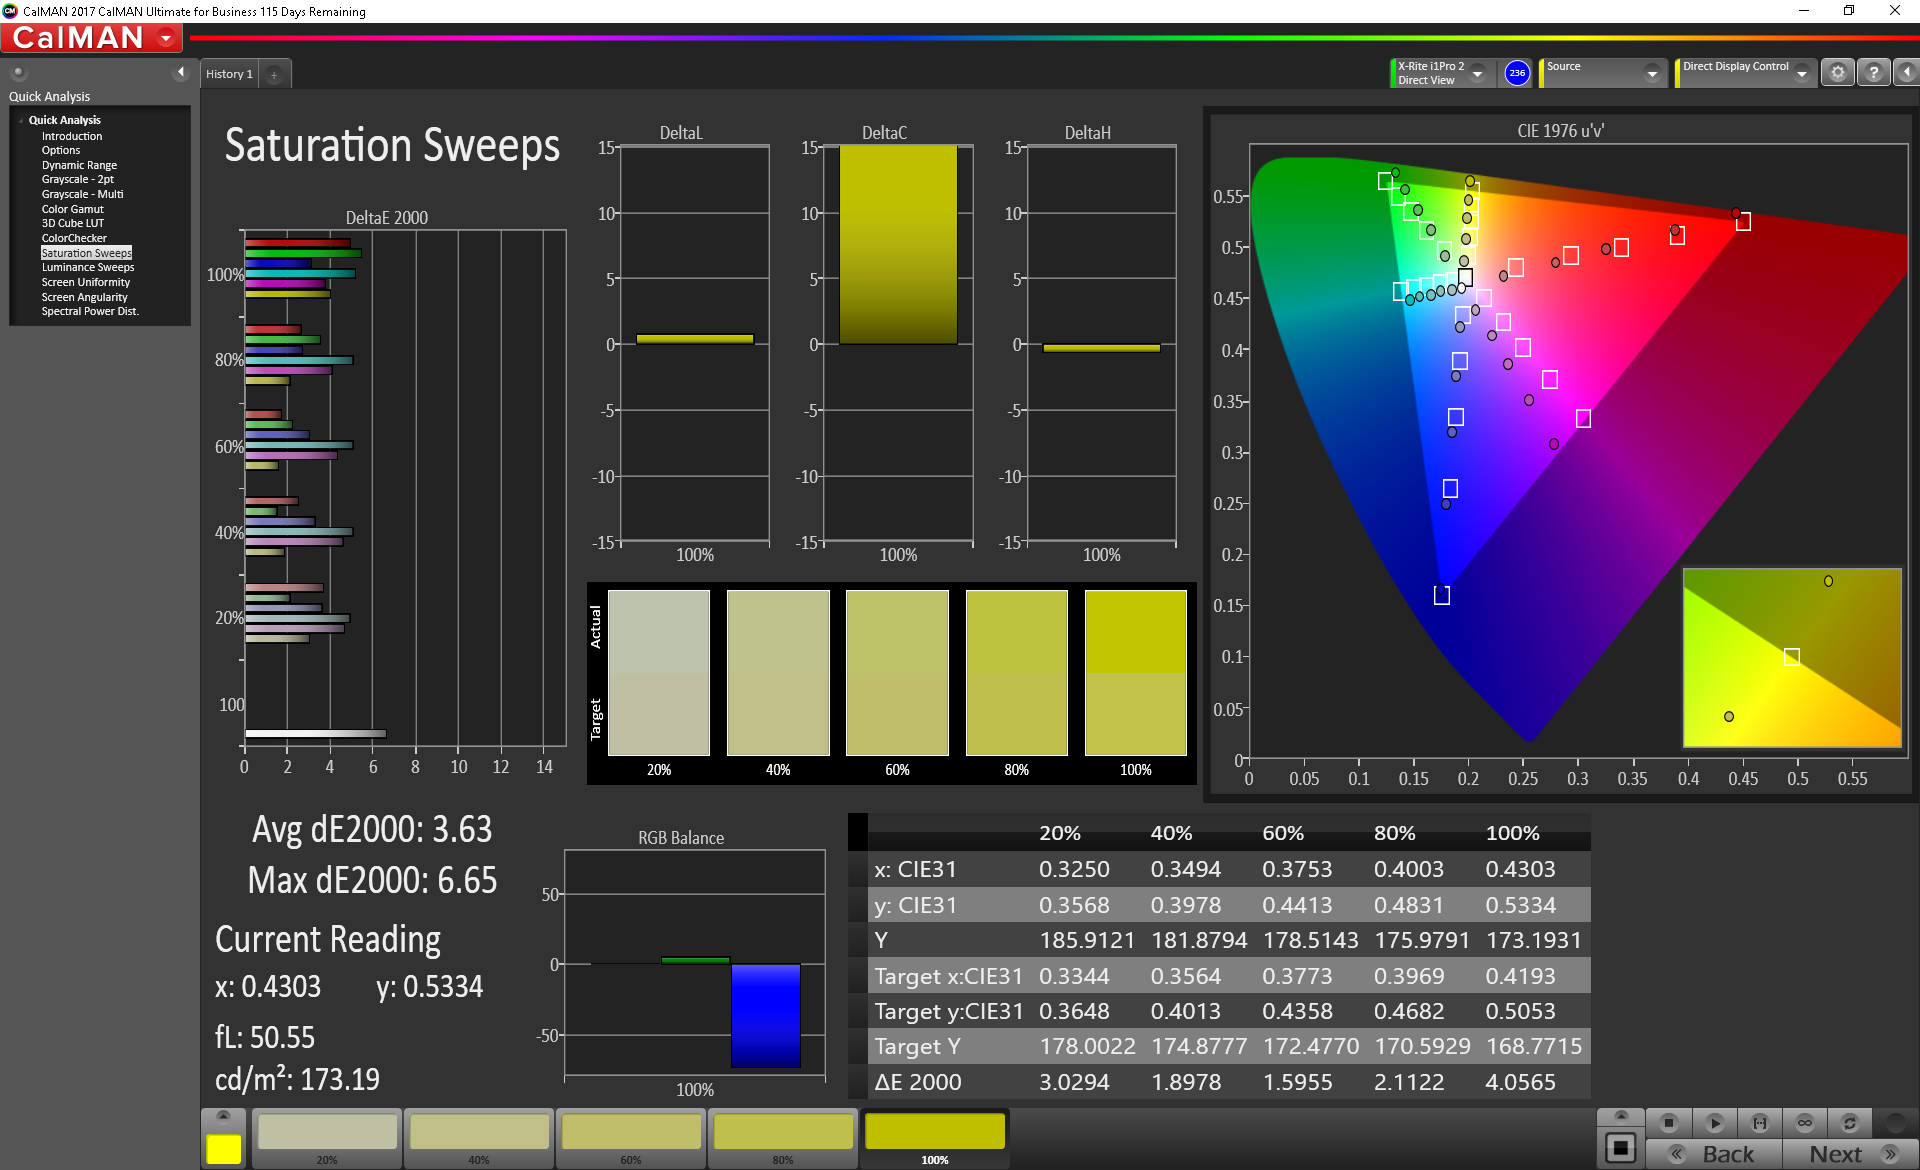
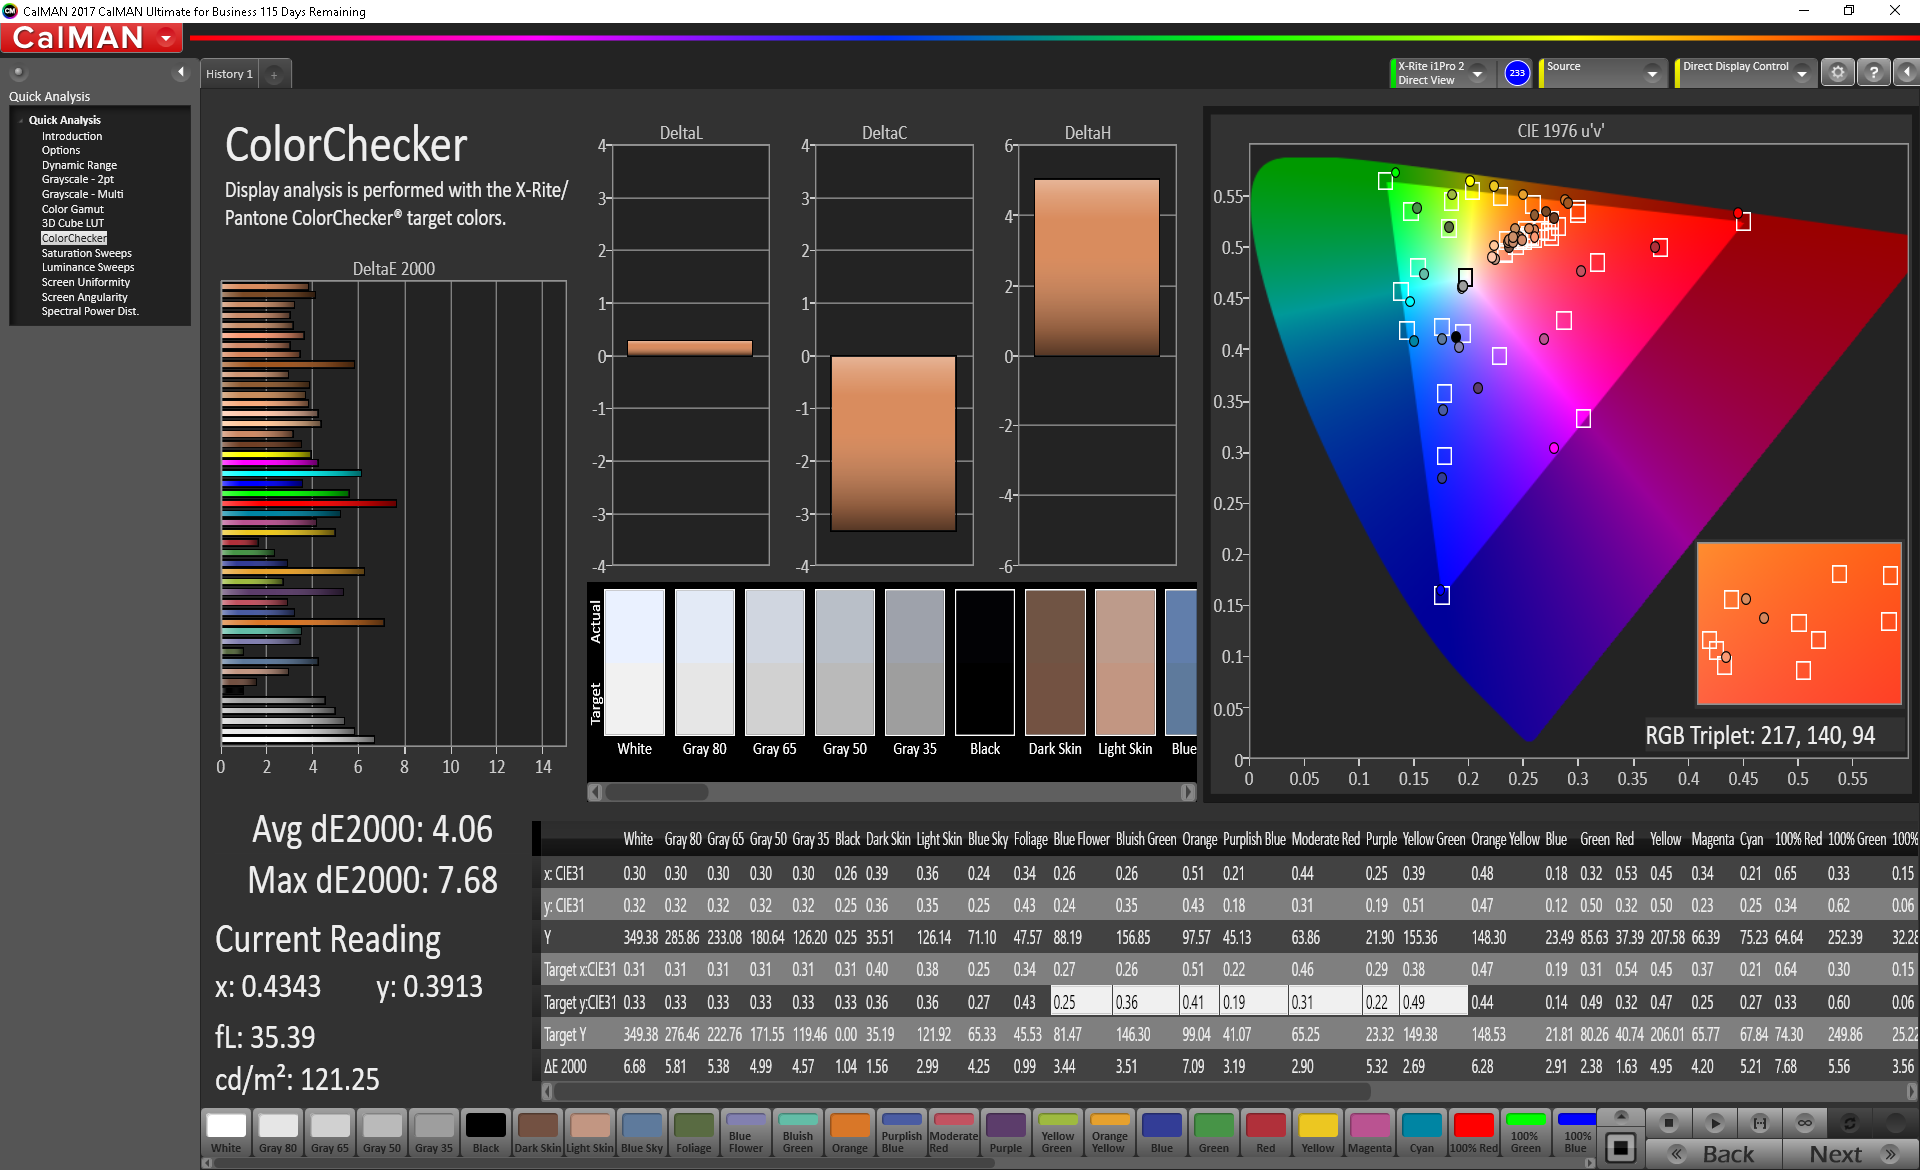
On the surface, both competing models offer the same crisp Gorilla Glass-protected 4K UHD touchscreen with support for WACOM pen inputs. However, the devil is in the details once again because each manufacturer utilizes a different panel supplier than the other. The BOE0730 panel on the HP is dimmer, of lower contrast, and with a narrower color gamut than the Sharp SHP148E panel on the Dell. This ultimately means that the Dell is able to offer more accurate colors and deeper blacks that may appeal to heavy multimedia users and artists. In return, the HP system offers faster response times for less ghosting when gaming.
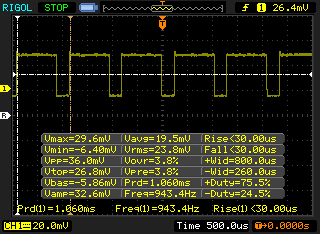
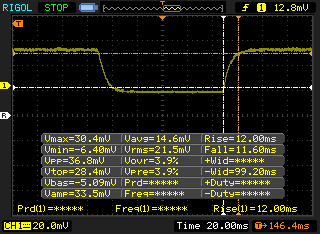
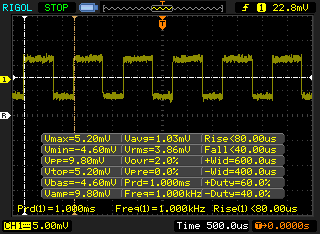
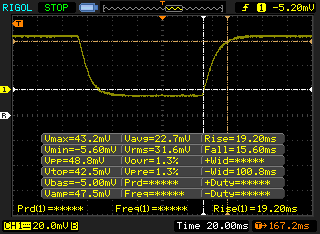
Users sensitive to onscreen flickering should note that both the HP and Dell systems exhibit very similar pulse-width modulation (PWM) frequencies. PWM on the HP, however, is present on all brightness levels except the maximum while PWM is only present on the Dell at a brightness setting of 25 percent or under. The Spectre has a higher chance of causing eyestrain after prolong use.


| HP Spectre x360 15-ch000 | Dell XPS 15 9575 i7-8705G | |
|---|---|---|
| Display | ||
| Display P3 Coverage (%) | 66.7 | 78.7 |
| sRGB Coverage (%) | 87.4 | 97.9 |
| AdobeRGB 1998 Coverage (%) | 63.8 | 79.2 |
| Response Times | ||
| Response Time Grey 50% / Grey 80% * (ms) | 36 ? | 48.4 ? |
| Response Time Black / White * (ms) | 23.6 ? | 34.8 ? |
| PWM Frequency (Hz) | 943 ? | 1000 ? |
| Screen | ||
| Brightness middle (cd/m²) | 349.5 | 488 |
| Brightness (cd/m²) | 330 | 440 |
| Brightness Distribution (%) | 90 | 81 |
| Black Level * (cd/m²) | 0.29 | 0.3 |
| Contrast (:1) | 1205 | 1627 |
| Colorchecker dE 2000 * | 4.06 | 3.16 |
| Colorchecker dE 2000 max. * | 7.68 | 8.8 |
| Colorchecker dE 2000 calibrated * | 4.22 | |
| Greyscale dE 2000 * | 4.4 | 3.3 |
| Gamma | 2.11 104% | 2.178 101% |
| CCT | 7422 88% | 6811 95% |
| Color Space (Percent of AdobeRGB 1998) (%) | 56.5 | 71.7 |
| Color Space (Percent of sRGB) (%) | 86.9 | 97.9 |
| Total Average (Program / Settings) |
* ... smaller is better

Performance
CPU Performance
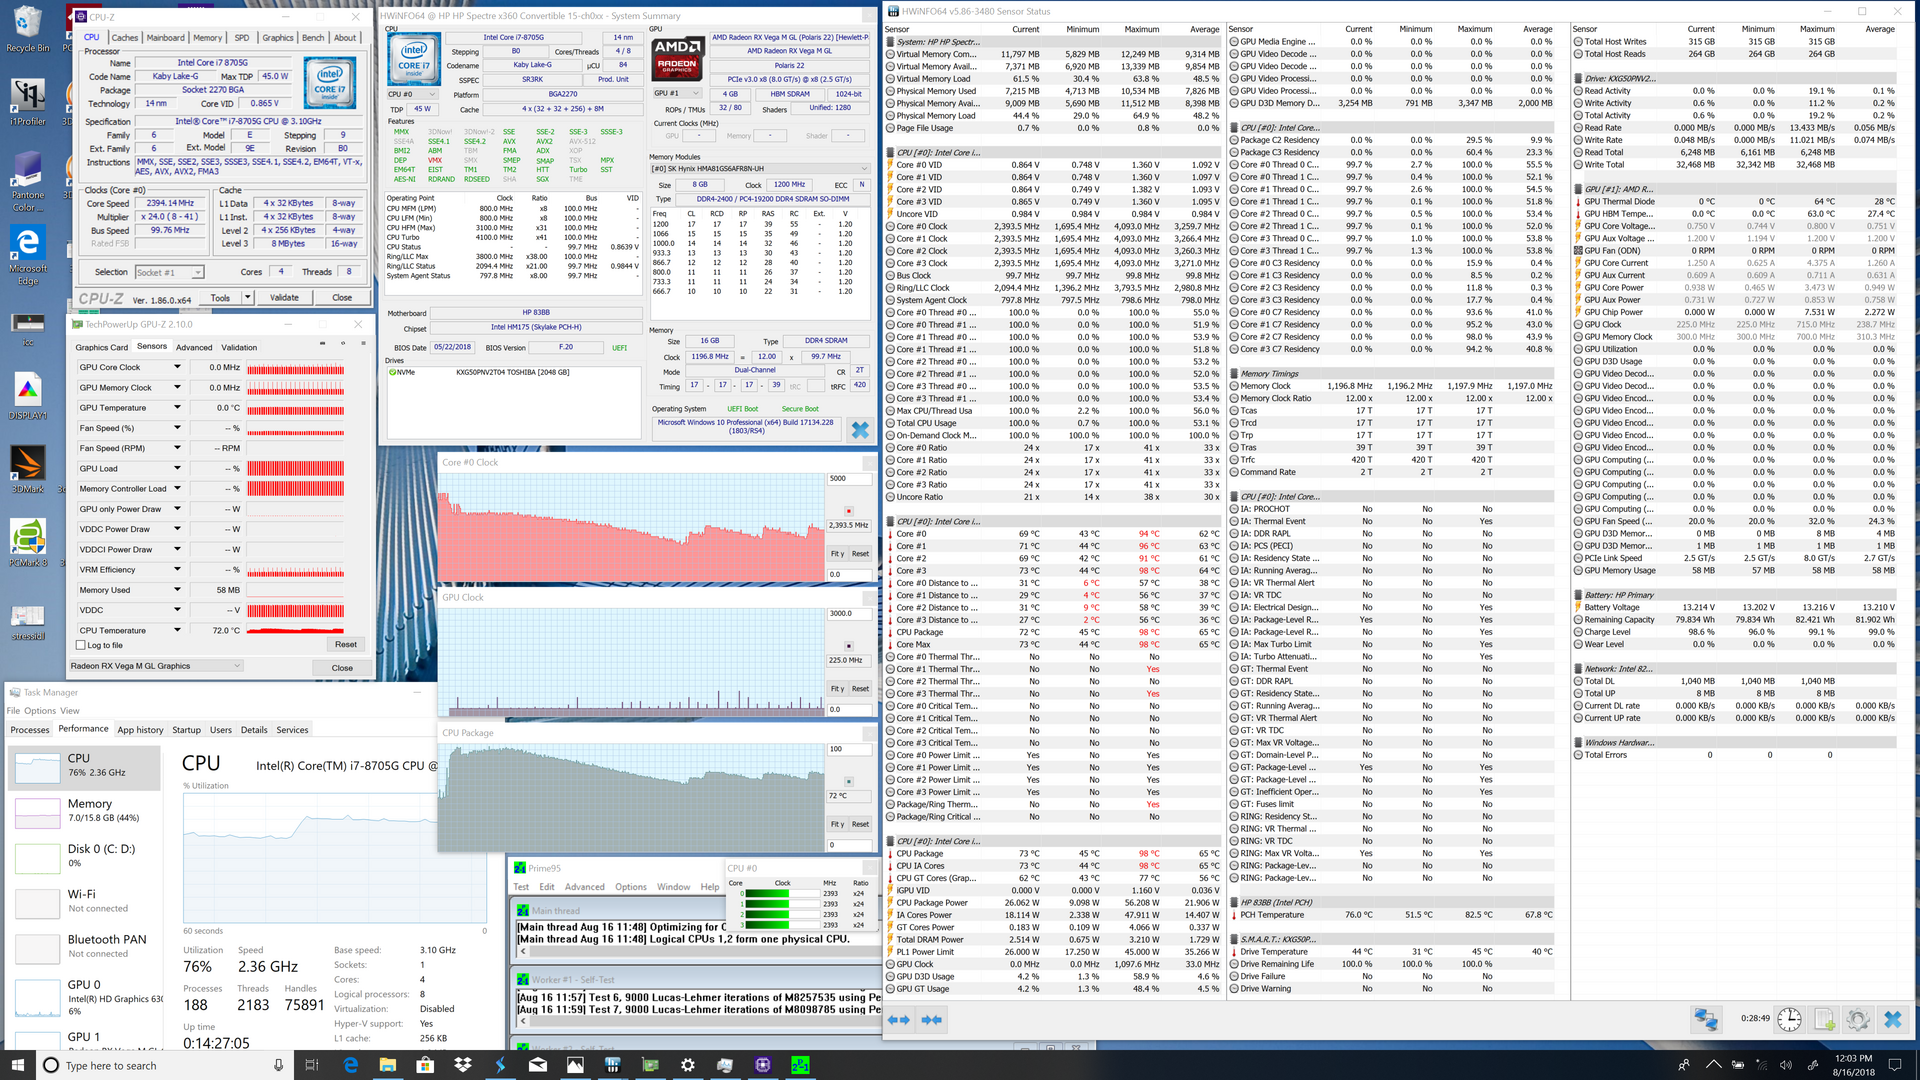
Both models return very similar CineBench scores as one would expect since they use the same Core i7-8705G SoC. The Dell and HP score 732 and 746 points in CineBench R15 Multi-Thread, respectively, to represent a performance difference of less than 1 percent. Dig deeper, however, and differences begin to show.
Performance sustainability is superior on the Dell system when compared to the HP despite both performing similarly on a cold boot. By running CineBench R15 Multi-Thread in a loop, we can observe that the HP system experiences steeper declines in performance over time. The HP averages about 630 points after about ten loops compared to 680 points on the Dell.
See our dedicated pages on the Core i7-8705G for more technical information. For the sake of completion, we've also included the Intel Hades Canyon NUC and Core i5-8305G below.
GPU Performance
Raw GPU performance is consistently below that of our Dell counterpart by single-digit percentage points according to 3DMark benchmarks. Both the slower CPU and GPU clock rates of the HP when gaming are responsible for the slightly lower scores.
For the sake of completion, we’ve also included benchmark scores for the XPS 15 9575 Core i5-8305G, Intel Hades Canyon Core i7-8809G, and the HP Spectre x360 15 Core i7-8550U below.
See our Radeon RX Vega M GL page for more technical information and benchmark comparisons.
| Cinebench R15 - OpenGL 64Bit | |
| Intel Hades Canyon NUC8i7HVK | |
| Dell XPS 15 9575 i7-8705G | |
| HP Spectre x360 15-ch000 | |
| Dell XPS 15 9575 i5-8305G | |
| HP Spectre x360 15-ch011nr | |
| Rise of the Tomb Raider - 1920x1080 High Preset AA:FX AF:4x (sort by value) | |
| Dell XPS 15 9575 i7-8705G | |
| HP Spectre x360 15-ch000 | |
| Dell XPS 15 9575 i5-8305G | |
| Intel Hades Canyon NUC8i7HVK | |
| HP Spectre x360 15-ch011nr | |
| BioShock Infinite - 1920x1080 Ultra Preset, DX11 (DDOF) (sort by value) | |
| Dell XPS 15 9575 i7-8705G | |
| HP Spectre x360 15-ch000 | |
| Dell XPS 15 9575 i5-8305G | |
| Intel Hades Canyon NUC8i7HVK | |
| HP Spectre x360 15-ch011nr | |
Stress Test
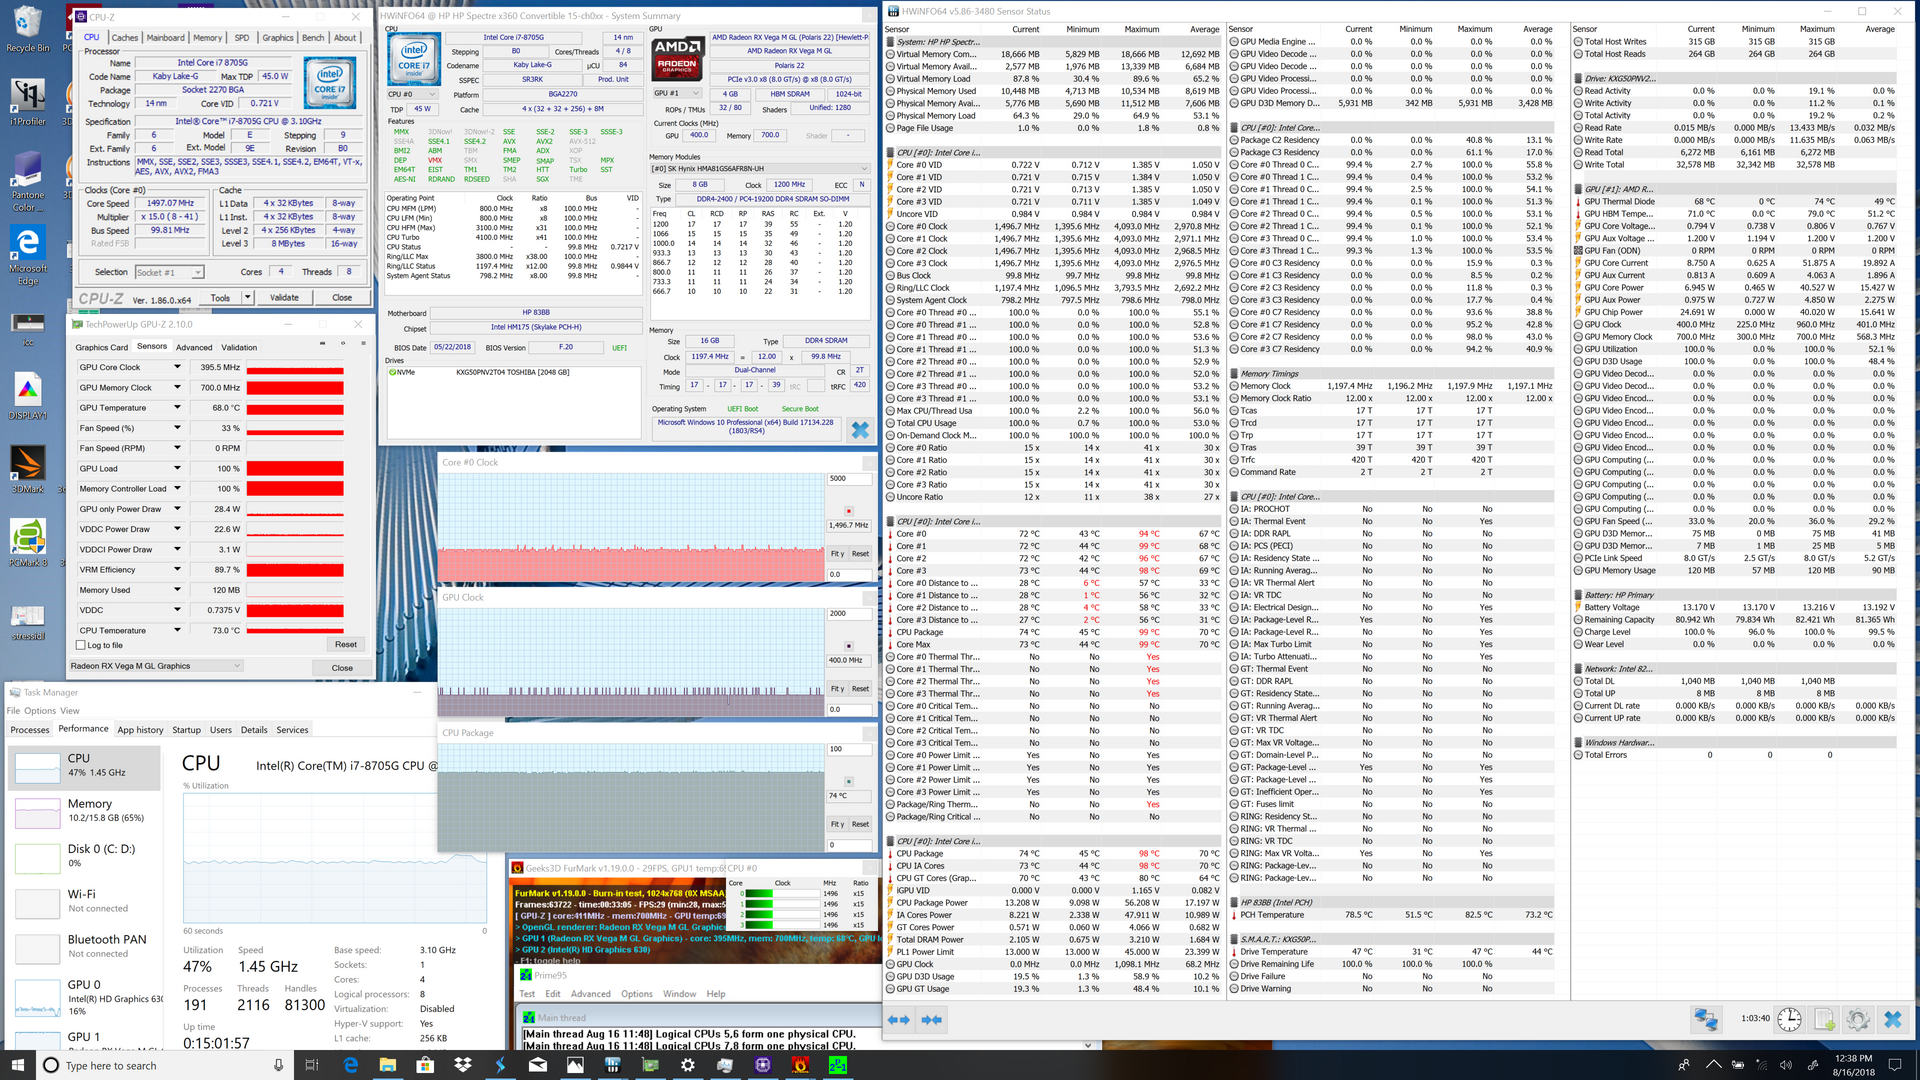
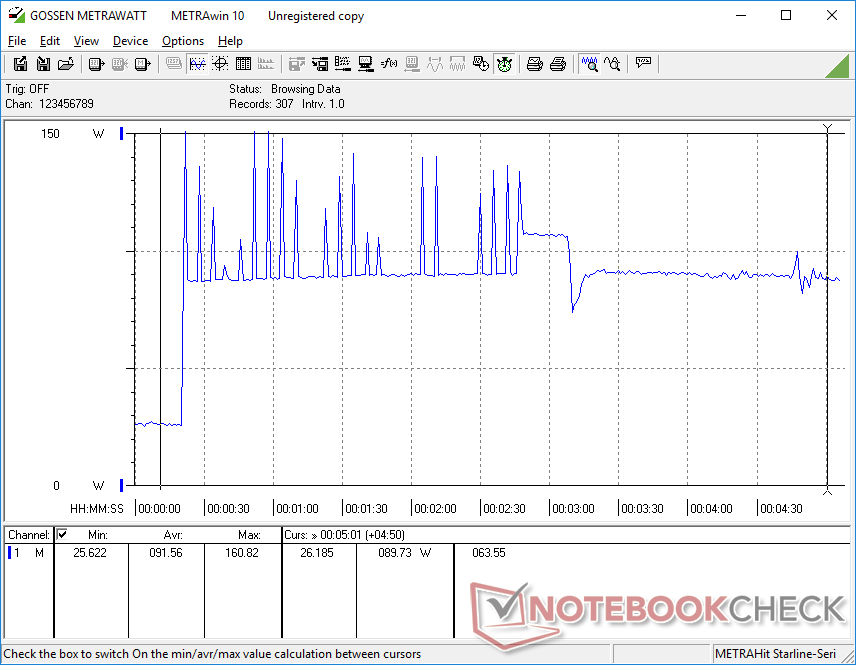
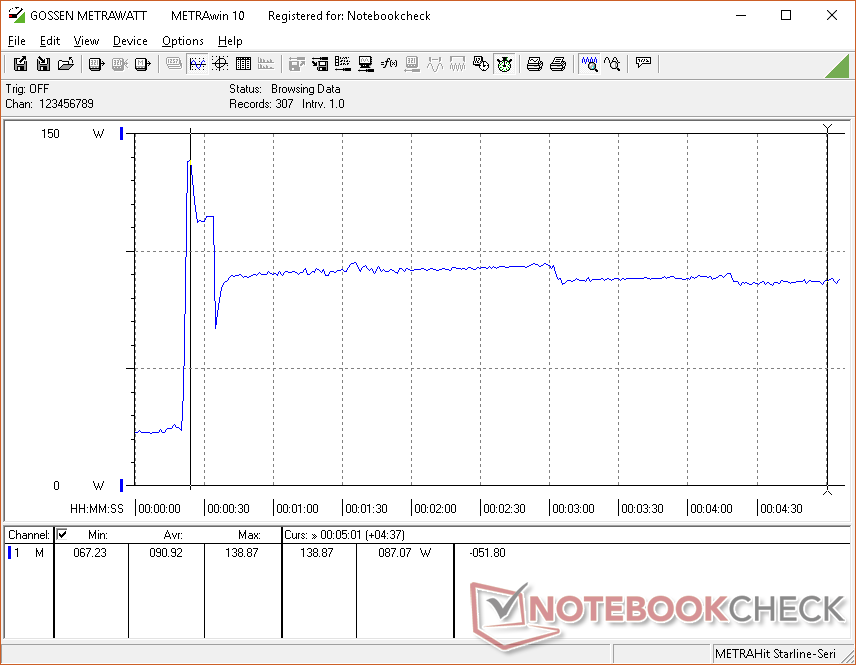
We subject the system to extreme processing stress to test for stability and behavior when under high loads. When running Prime95, the CPU in the Spectre stabilizes in the 2.0 to 2.7 GHz range compared to 3.1 to 3.5 GHz on the XPS 15 9575. The notable difference mirrors our CineBench loop test from above where the Dell system would consistently outscore the HP over longer periods.
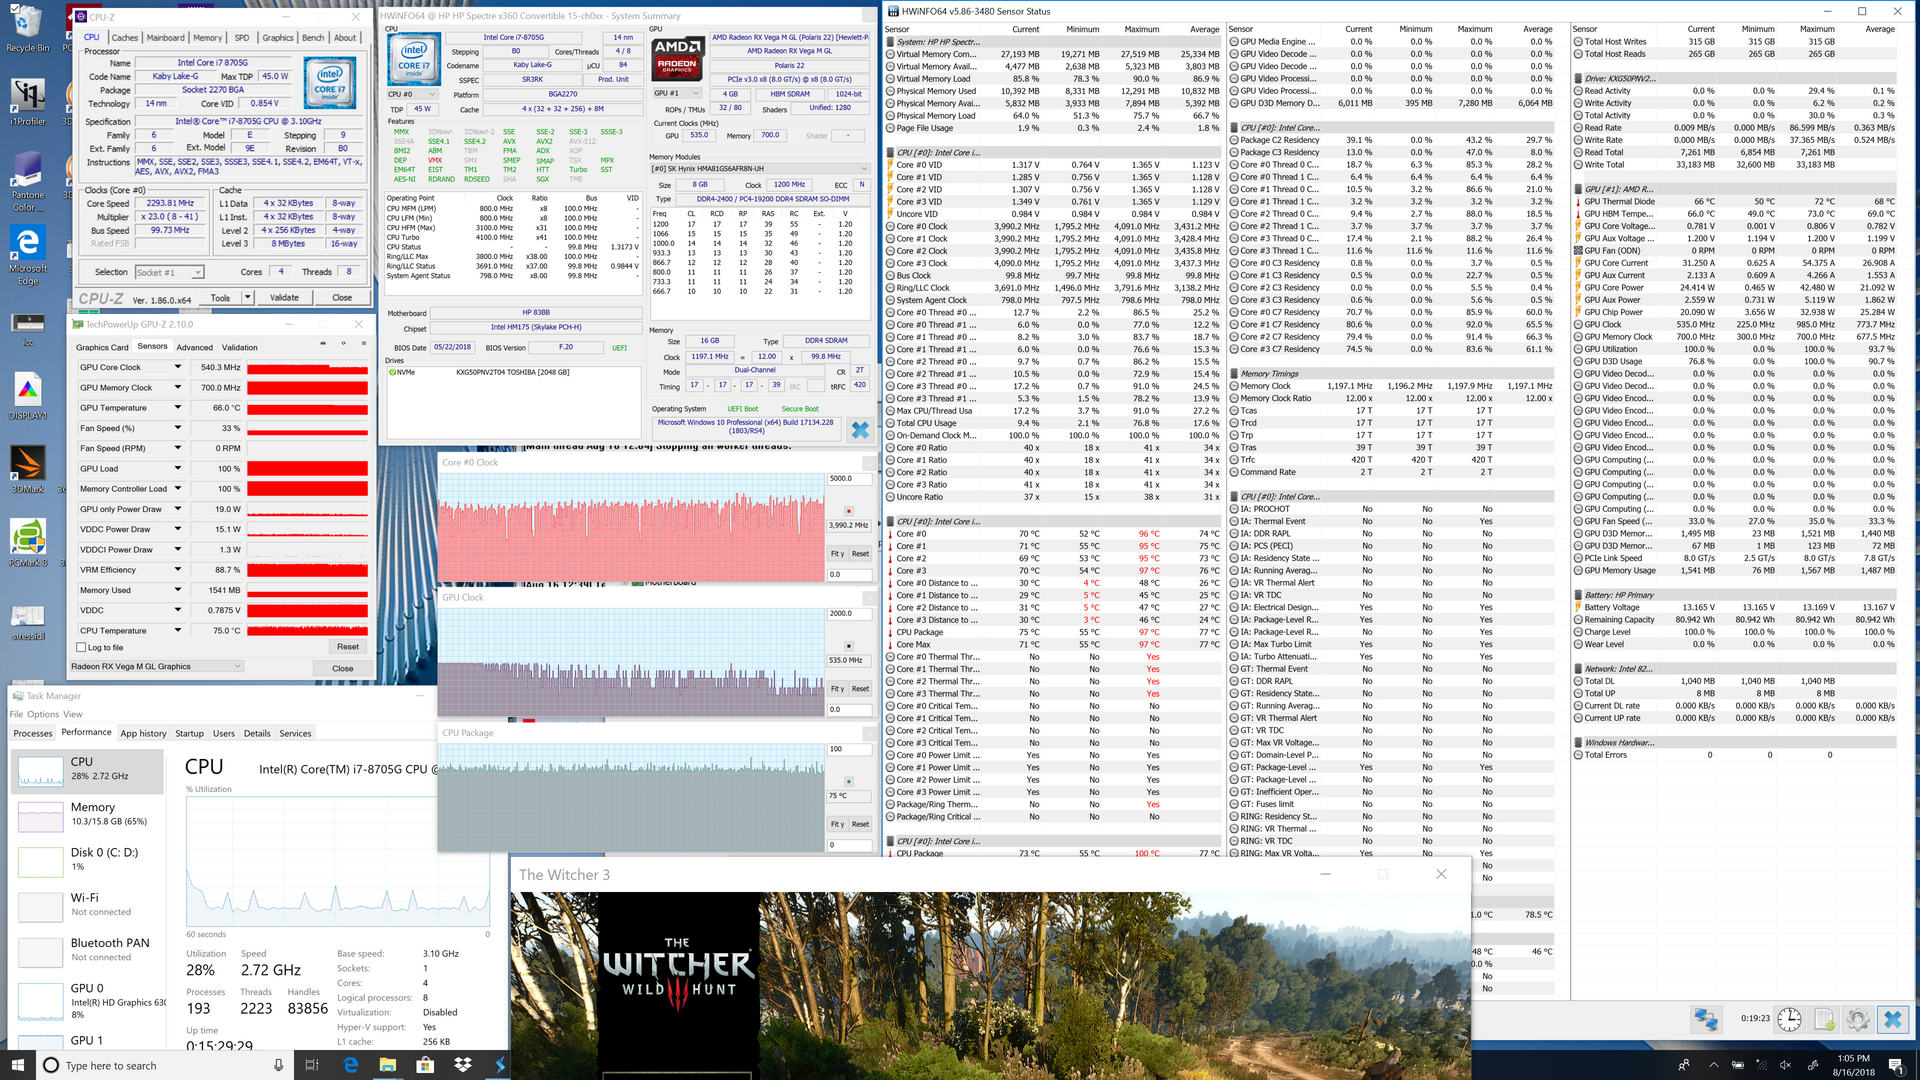
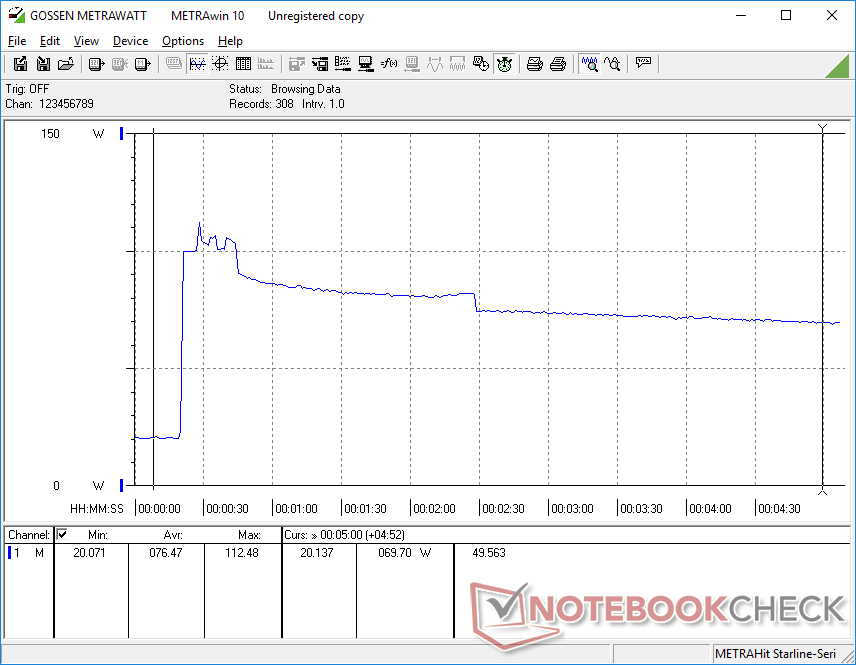
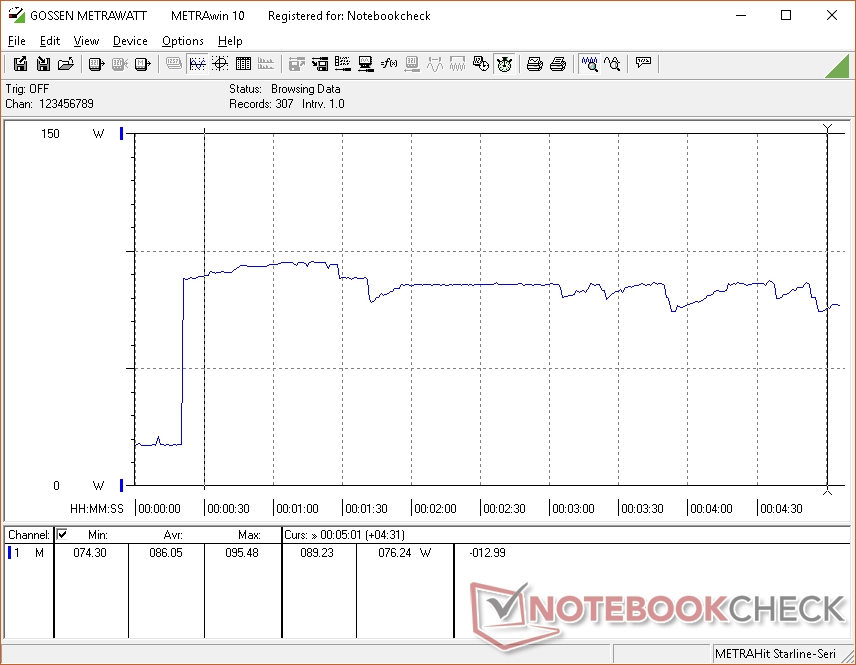
Running Witcher 3 is more representative of real-world gaming conditions. The GPU in the Spectre can be observed stabilizing at just 400 to 535 MHz after about 15 minutes compared to the steady 1011 MHz on the Dell. The steep frame rate drops above reflect the very low GPU clock rates on the HP. Furthermore, core temperatures are notably higher on the HP than on the Dell by about over 10 degrees C. The HP is not only slower, but it also runs warmer as well. Its performance is extremely disappointing for any gamer or video editor interested in the Kaby Lake-G Spectre.
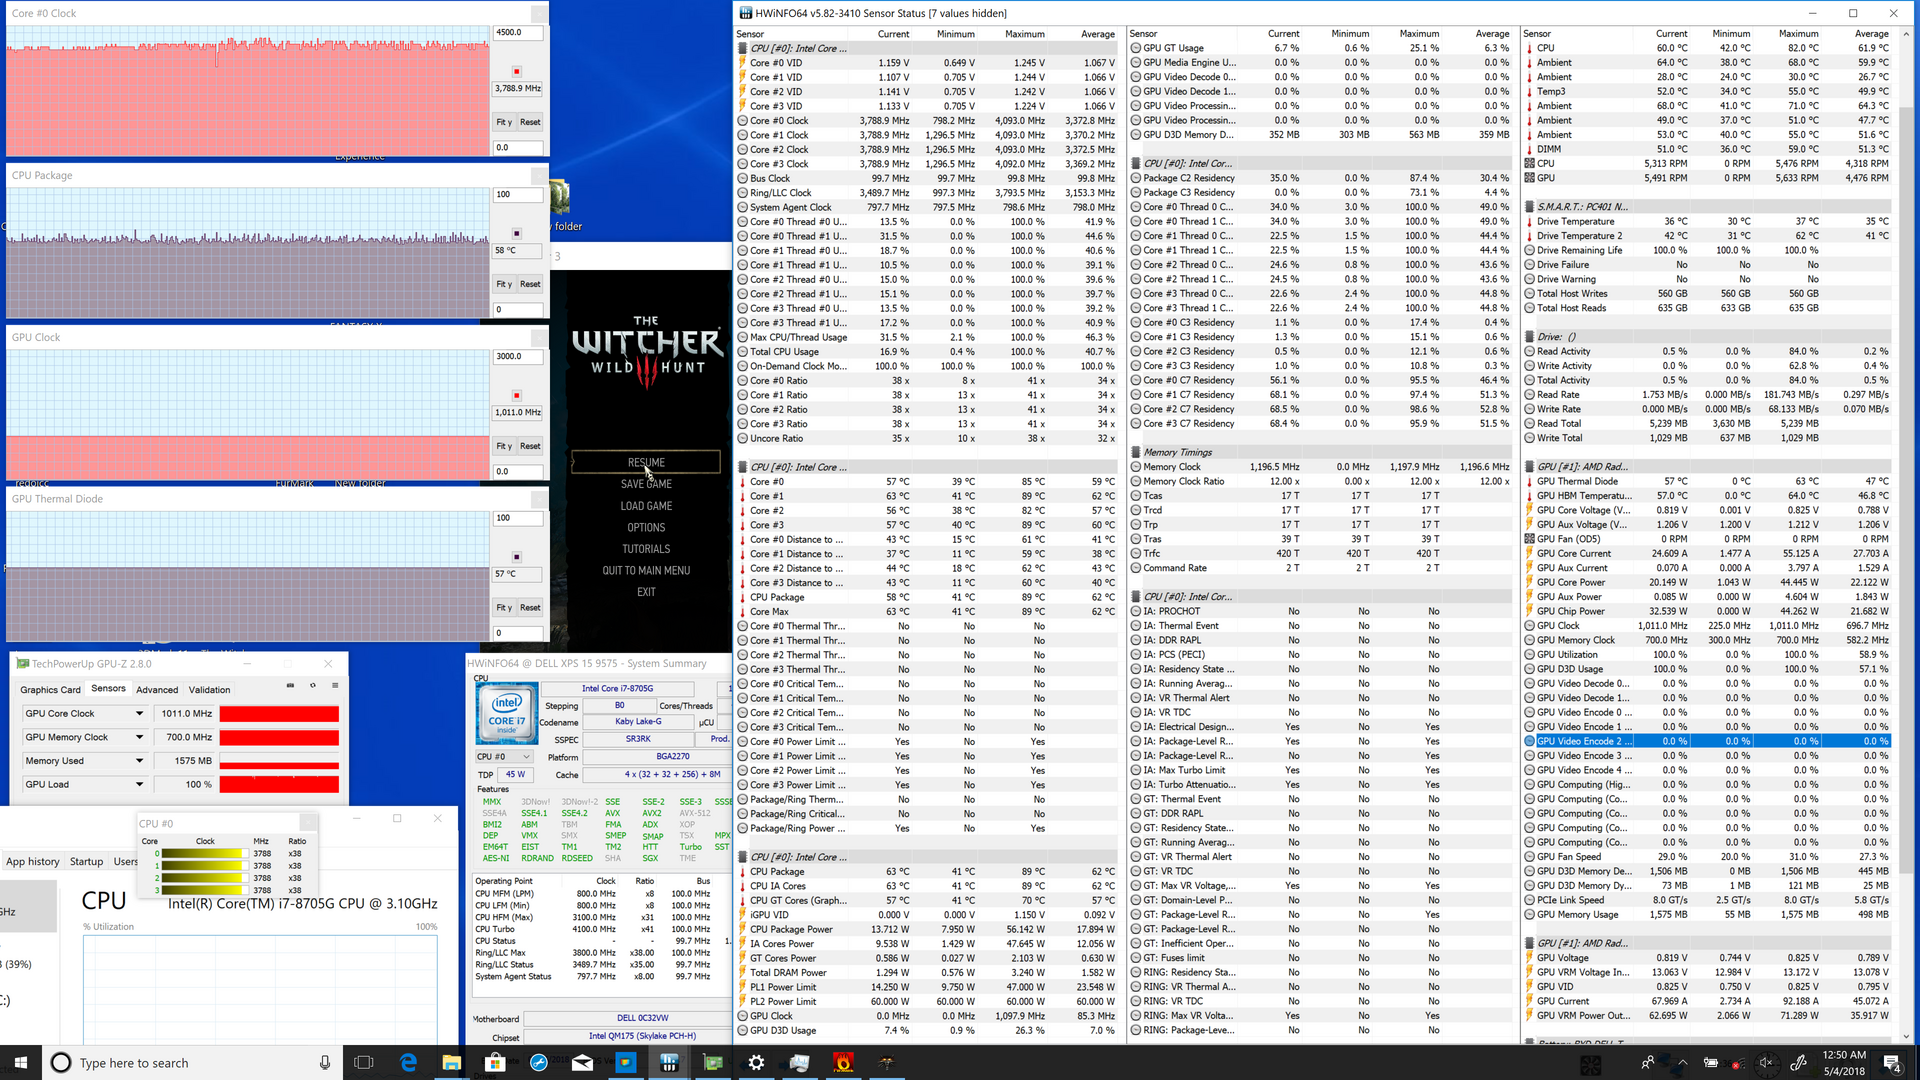
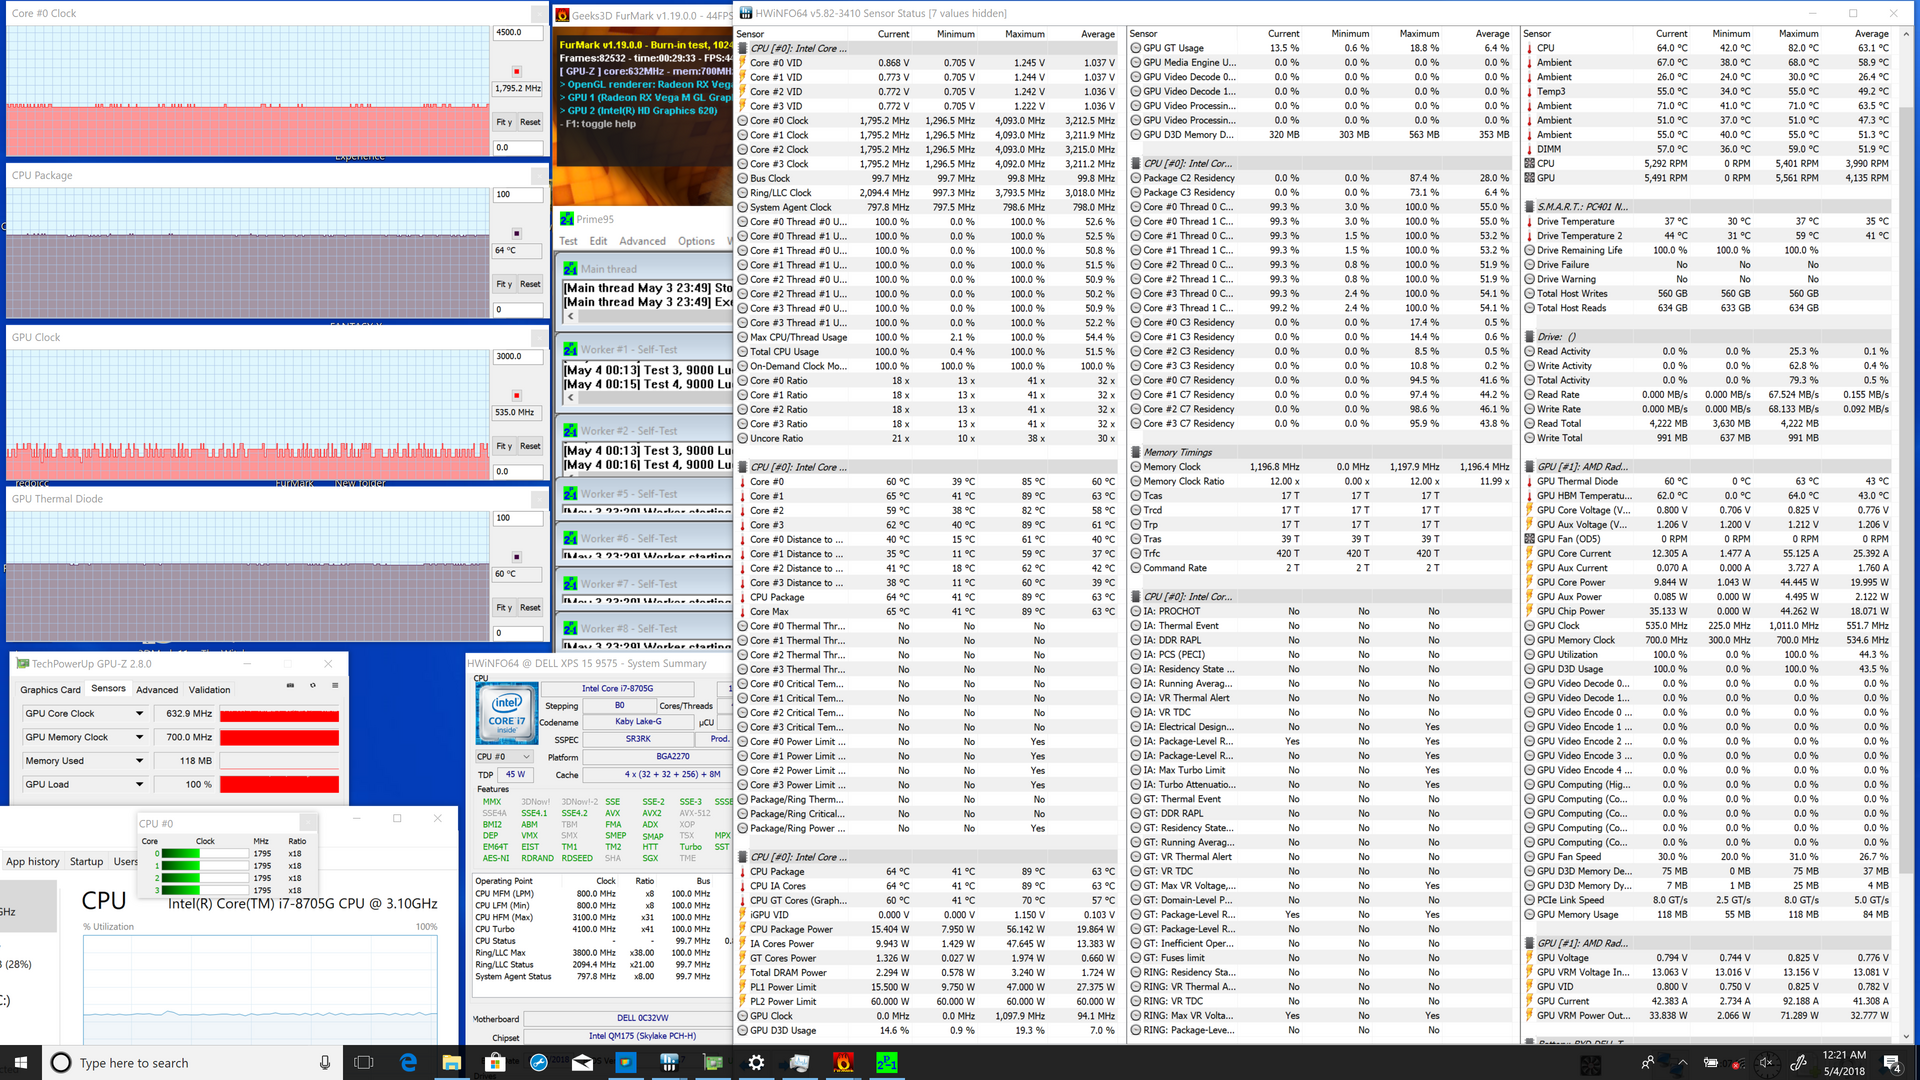
| HP Spectre x360 15 2018 | Dell XPS 15 9575 | |
| Processor | Core i7-8705G | Core i7-8705G |
| Rated GPU Core Clock (MHz) | 931 | 931 |
| Stable GPU Core Clock on Witcher 3 (MHz) | 400 - 535 | 1011 |
| Rated CPU Core Clock (GHz) | 3.1 | 3.1 |
| Stable CPU Core Clock on Prime95 (GHz) | 2.0 - 2.7 | 3.1 - 3.5 |
| Average CPU temperature on Witcher 3 | 75 C | 58 C |
| Average GPU temperature on Witcher 3 | 66 C | 57 C |
Emissions and Energy
System Noise and Temperature
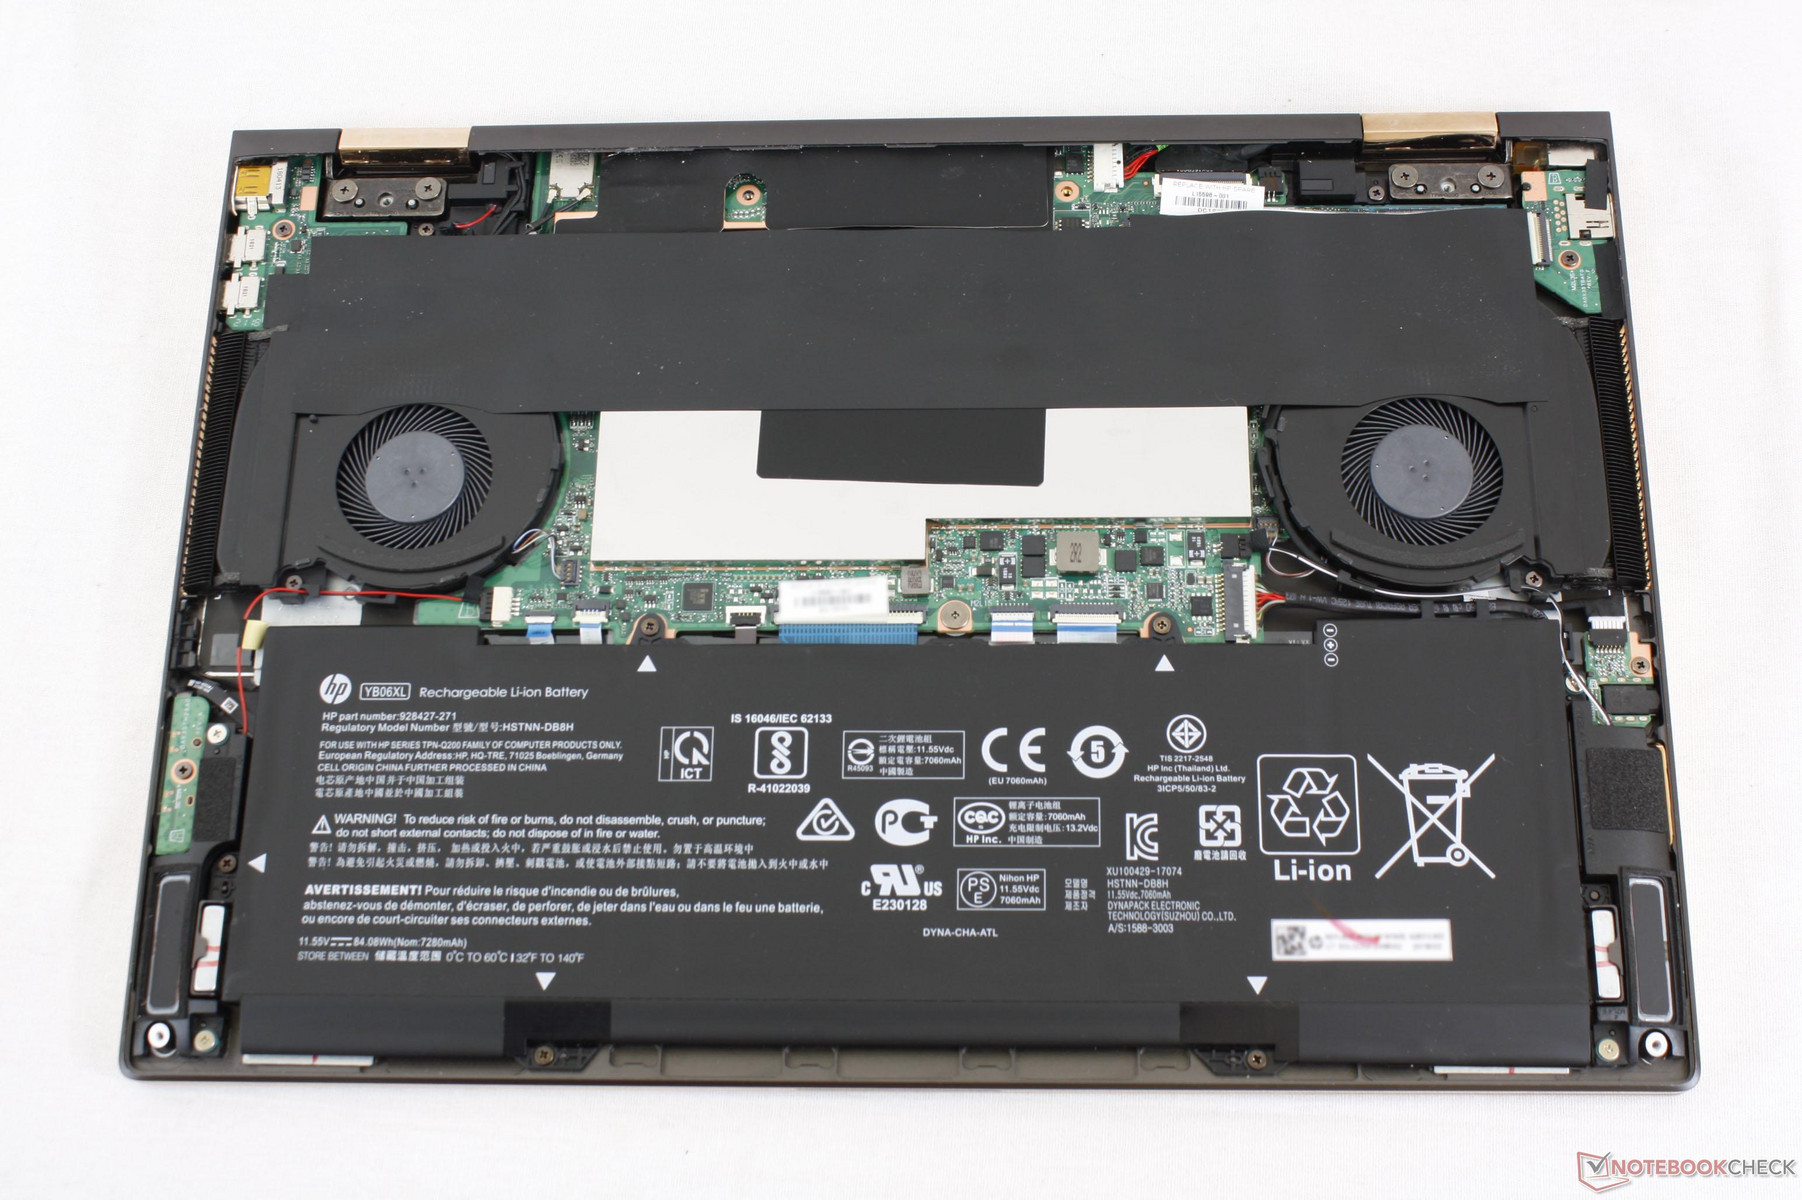
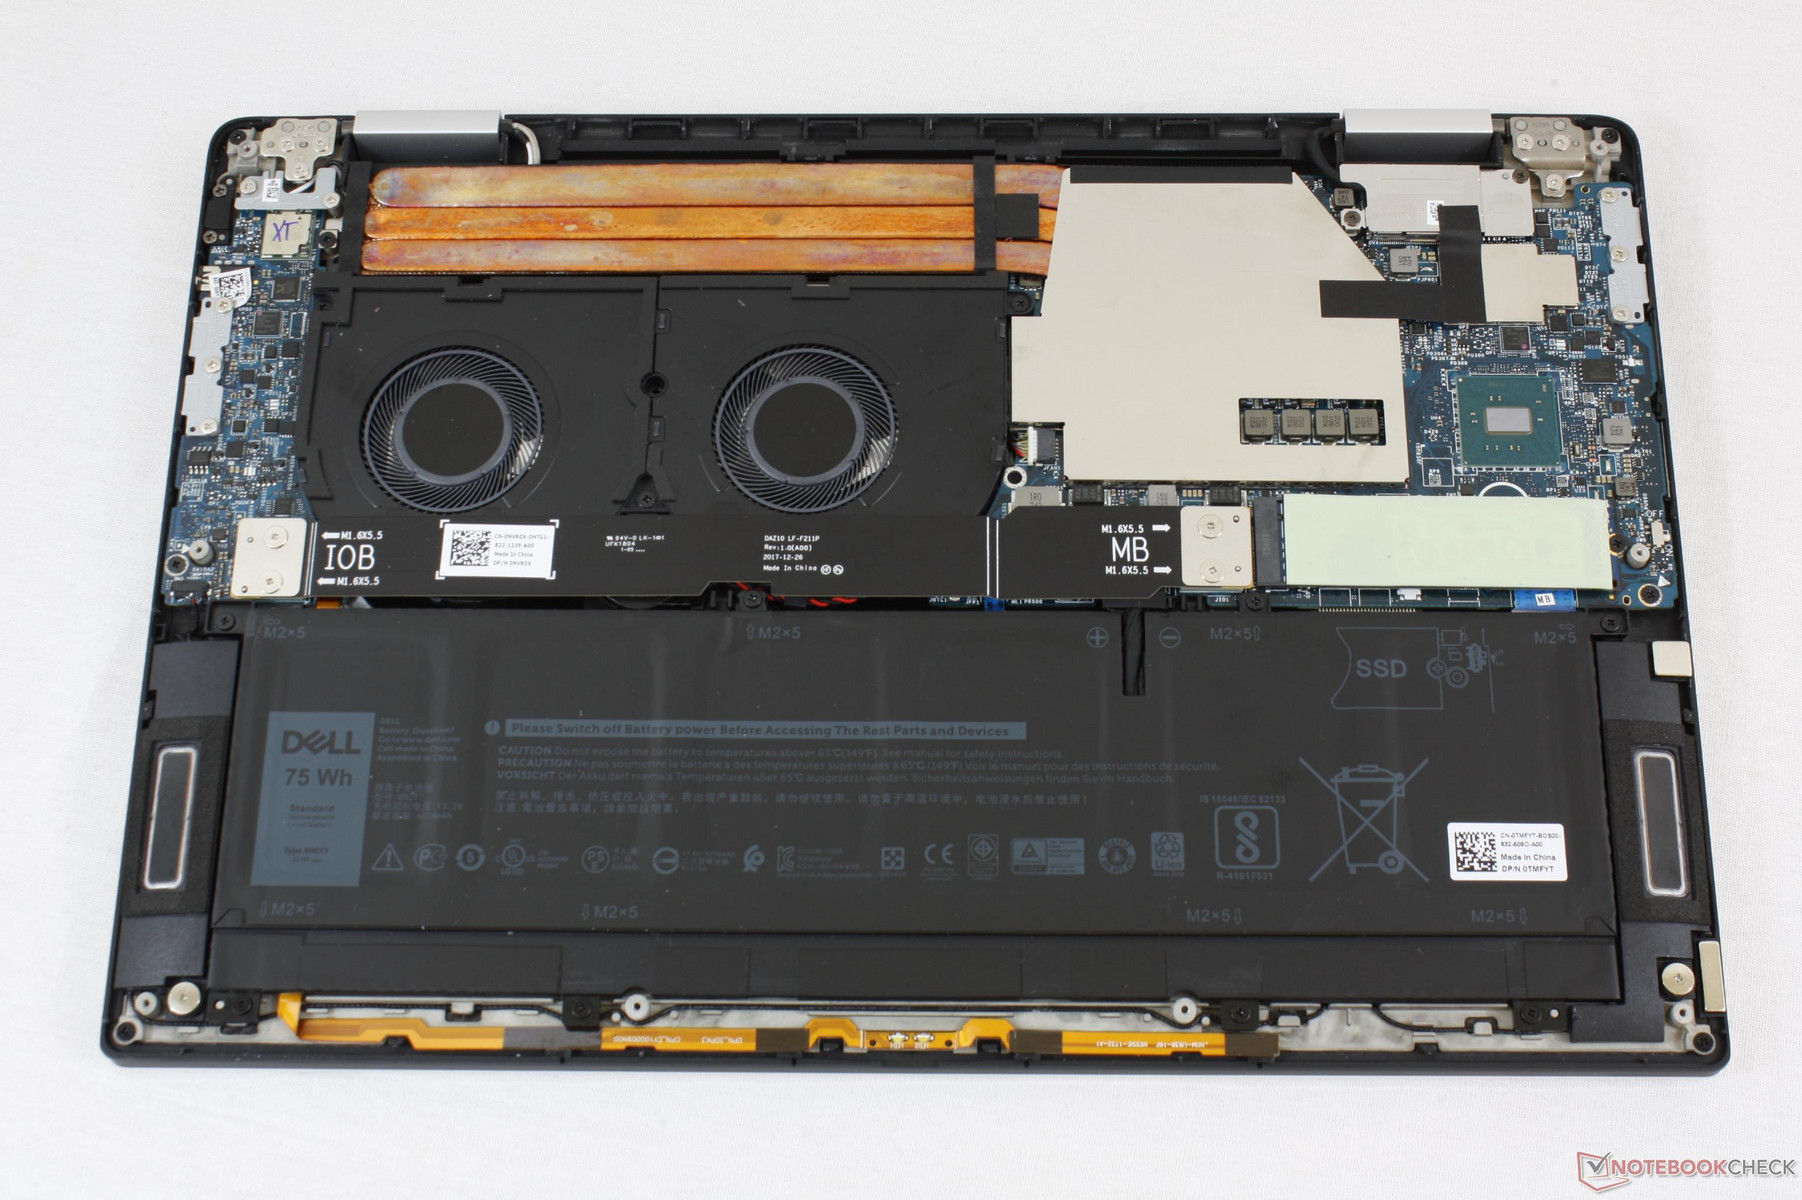
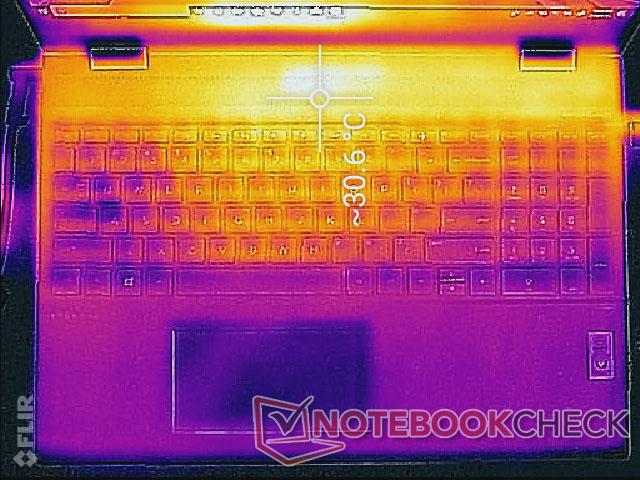
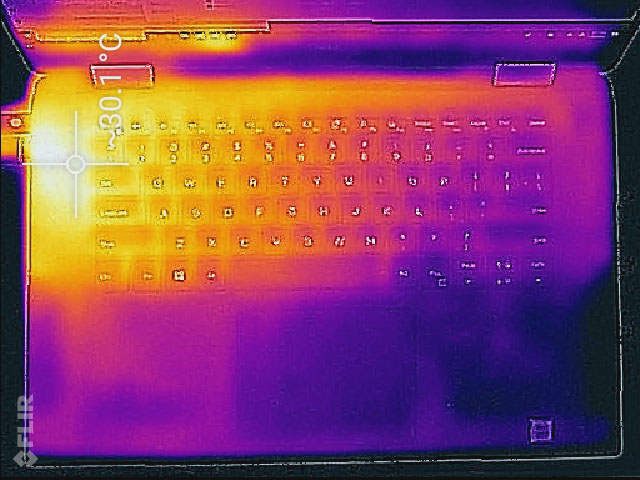
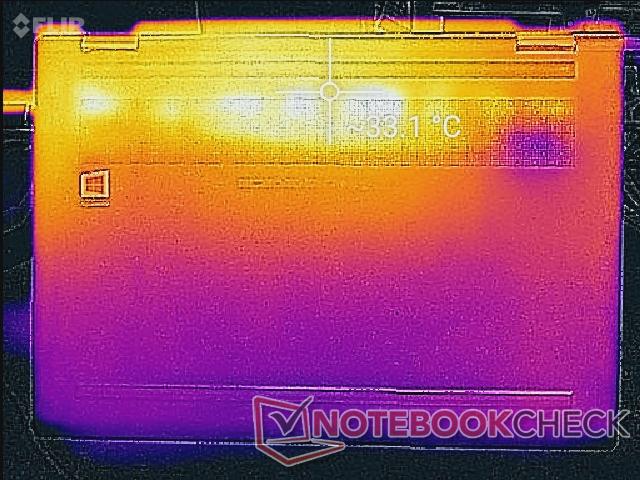
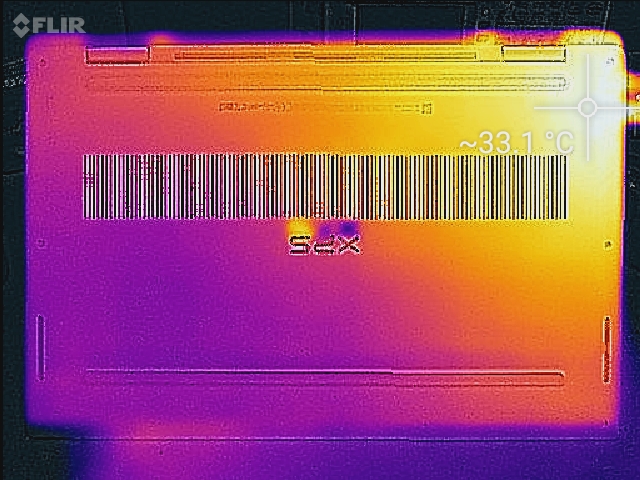
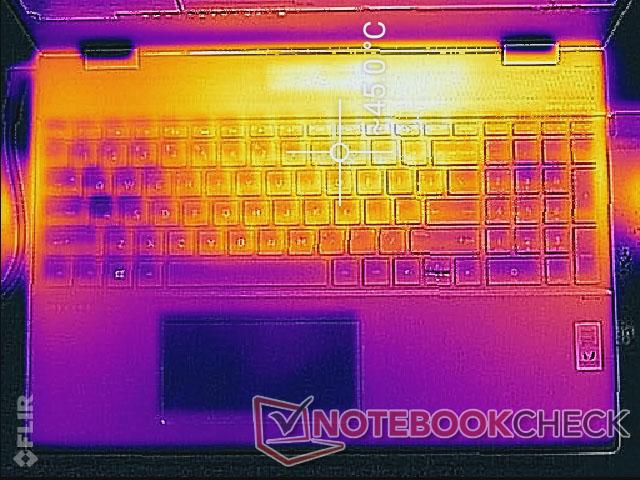
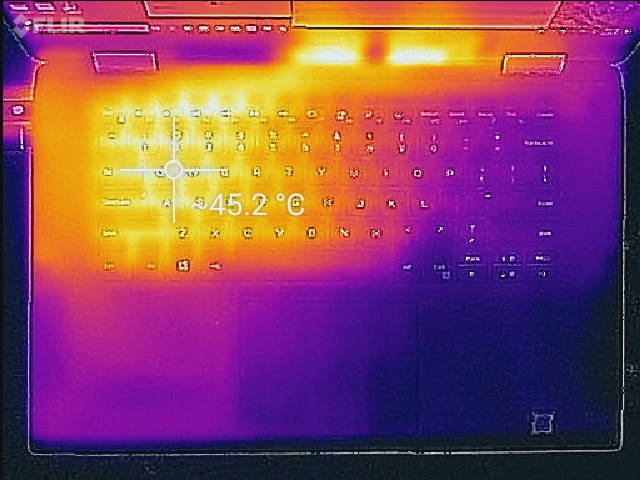
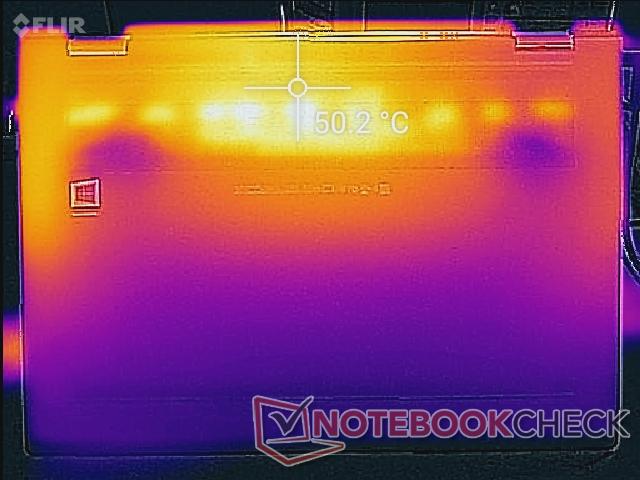
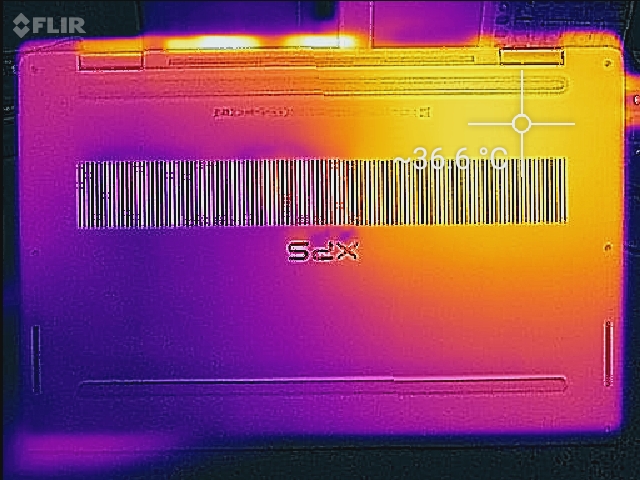
The symmetrical cooling system of the HP is preferable for gaming because the commonly used WASD and NumPad keys remain relatively cool. In contrast, the left half of the Dell will always be noticeably warmer than the right simply because of how the heat pipes are arranged underneath. The inevitable temperature difference between the left and right hand palms is less than ideal when typing or gaming.
As for their hot spots, both systems are quite similar in absolute temperature at about 45 C and 50 C on the front and back, respectively, despite the XPS 15 9575 being thinner and lighter. Dell is able to achieve this by utilizing special GORE insulators not found on notebooks outside of the XPS family.
Dell has the advantage yet again when it comes to fan noise. The XPS 15 9575 is more likely to remain silent when emailing or word processing whereas the fans on the Spectre are always active no matter the load. Gaming is generally louder on the HP despite its under-performing GPU.
| HP Spectre x360 15-ch000 | HP Spectre x360 15-ch011nr | Dell XPS 15 9575 i7-8705G | Dell XPS 15 9575 i5-8305G | |
|---|---|---|---|---|
| Noise | ||||
| off / environment * (dB) | 28.1 | 28.6 | 28.2 | 27.8 |
| Idle Minimum * (dB) | 30.8 | 29.2 | 28.2 | 27.8 |
| Idle Average * (dB) | 30.9 | 29.2 | 28.2 | 27.8 |
| Idle Maximum * (dB) | 30.9 | 29.2 | 28.2 | 27.8 |
| Load Average * (dB) | 31.8 | 29.2 | 29 | 35 |
| Witcher 3 ultra * (dB) | 48.1 | 38.4 | 44.7 | 44.2 |
| Load Maximum * (dB) | 44.2 | 45.7 | 47.4 | 44.2 |
* ... smaller is better
Power Consumption
Idling on desktop will draw anywhere between 11 W and 19 W on the HP compared to just 6 W and 14 W on the Dell. Our HP unit exhibits spikes in power consumption when idling to suggest that there is background activity responsible for the slightly higher power consumption.
When subjected to medium or extreme loads, both systems show similar power consumption levels. Running Witcher 3 demands about 85 W from each system even though performance is lower on the HP.
| HP Spectre x360 15-ch000 | HP Spectre x360 15-ch011nr | Dell XPS 15 9575 i7-8705G | |
|---|---|---|---|
| Power Consumption | |||
| Idle Minimum * (Watt) | 11.7 | 5.3 | 6.2 |
| Idle Average * (Watt) | 16.8 | 9.8 | 12.9 |
| Idle Maximum * (Watt) | 18.9 | 12.6 | 13.6 |
| Load Average * (Watt) | 82.3 | 73 | 76.1 |
| Witcher 3 ultra * (Watt) | 87.2 | 67.6 | 84.3 |
| Load Maximum * (Watt) | 94.9 | 80 | 99.4 |
* ... smaller is better
Battery Life
The HP has a 12 percent larger battery capacity than the Dell for a total of 84 W. Nonetheless, the equivalent Dell configuration is still able to outlast the HP by about an hour when subjected to similar WLAN conditions. Kaby Lake-G appears to be less power efficient than Kaby Lake-R during low loads as the Kaby Lake-R version of the Spectre x360 15 can run for almost twice as long.
Charging from empty is faster on the HP at about 2 hours compared to 2.5 hours on the XPS 15 9575.
| HP Spectre x360 15-ch000 84 Wh | HP Spectre x360 15-ch011nr 84 Wh | Dell XPS 15 9575 i7-8705G 75 Wh | Dell XPS 15 9575 i5-8305G 75 Wh | |
|---|---|---|---|---|
| Battery runtime | ||||
| Reader / Idle (h) | 9 | 15.5 | 11.2 | 11.1 |
| WiFi v1.3 (h) | 5.7 | 10.4 | 7 | 9.4 |
| Load (h) | 1.1 | 2.3 | 1.1 | 1.3 |
Verdict
Normally for our "Versus" pages, it's difficult to crown one model over another because each system would have a long list of advantages that may cater better to a specific type of user. In this case, however, the Dell XPS 15 9575 is the superior Kaby Lake-G laptop by a wide margin over the HP Spectre x360 15. It's measurably quieter, cooler, lighter, thinner, brighter, and longer-lasting with deeper colors while suffering from far fewer throttling issues when under load. Power users who want the most that the Core i7-8705G SoC can offer should avoid the HP solution until the OEM can address the throttling problems, if ever.
To HP's credit, the Kaby Lake-G Spectre still offers a few notable advantages over Dell. Its more extensive range of integrated ports means owners won't have to rely on pricey adapters and its display response times are faster for less ghosting when gaming. Its internal speakers are louder and the dedicated NumPad is a boon for data entry. Unfortunately, the cons outweigh the short list of pros. The wider port options mean a larger chassis and the reduced ghosting means little when the system inevitably throttles whilst gaming. Its larger battery capacity is nothing but dead weight when even the smaller battery of the XPS 15 9575 is able to outlast it.
The best iteration of the Spectre x360 15 is still the Kaby Lake-R SKU with the more traditional Core i7-8550U CPU and GeForce MX150 graphics. For the best Kaby Lake-G experience on a laptop, look no further than the XPS 15 9575.
| HP Spectre x360 15 2018 | Dell XPS 15 9575 |
|---|---|
| + More ports + Less prone to fingerprints + Louder speakers + Faster display response times + Dedicated NumPad + Better webcam positioning | + Lighter, thinner, smaller + Brighter display + Wider color gamut + Easier serviceability + Longer battery life + Quieter fans + Cooler core temperatures + Steadier performance; no major throttling issues + Fingerprint-enabled Power button + Versatile USB Type-C charger |
| - Heavier, thicker, larger - M.2 SSD slot more difficult to reach - More acute throttling issues - Louder fans - Larger battery, but shorter battery life - Pulse-width modulation on almost all brightness levels - Dimmer display backlight - Narrower color gamut - Proprietary AC adapter | - Carbon fiber surfaces accumulate grease more easily - More ghosting - No integrated HDMI, USB Type-A, or full-size SD reader - No NumPad - Warmer WASD keys when gaming - Slightly slower charging |
