Notebookcheck Logo

Intel Celeron N4505 vs Intel Core i7-3635QM vs Intel Celeron N5095

Intel Celeron N4505

► remove from comparison Intel Celeron N4505

The Intel Celeron N4505 is a dual-core SoC of the Jasper Lake series that is primarily intended for inexpensive and small desktops and was announced in early 2021. The two Tremont CPU cores clock between 2 and 2.9 GHz (single core Burst) and offer no HyperThreading (SMT). The N4505 uses 1.5 MB L2 and 4 MB L3 cache. The chip is built with Intel's first-gen 10 nm process, just like Ice Lake family processors.

CPU Architecture

The processor architecture is called Tremont and a complete redesign compared to the old Golmont Plus cores in the predecessor. According to Intel, the single thread performance of a core could be improved by 30% on average (10 - 80% in all tests of SPECint and SPECfp).

Features

In addition to the dual-core CPU block, the SoC integrates a 16 EU Intel UHD Graphics GPU clocked from 450 - 750 MHz and a LPDDR4(x) dual channel memory controller (up to 16 GB and 2933 MHz). The chip now also partly integrates Wi-Fi 6 (Gig+), 8 PCIe 3.0 lanes, 14 USB 2.0/ 3.2 ports and two SATA 6.0 ports. The package got bigger and measures 35 x 24 mm (compared to 25 x 24 mm for the N5030 e.g.). The SoC is directly soldered to the mainboard (BGA) and can't be easily replaced.

Performance

The average N4505 in our database is just as fast as AMD's dual-core Athlon Silver 3050e and Intel's previous-gen Celeron N4100, as far as multi-thread benchmark scores are concerned. In other words, the Celeron is good for basic day-to-day activities but not much more than that, as of mid 2022.

Power consumption

This Celeron series SoC has a default TDP, also known as the long-term Power Limit, of 10 W, which is low enough to allow for passively cooled designs.

The N4505 is manufactured on the first-gen or the second-gen (no exact data available) 10 nm Intel process making for average, as of late 2022, energy efficiency.

Intel Core i7-3635QM

► remove from comparison Intel 3635QM

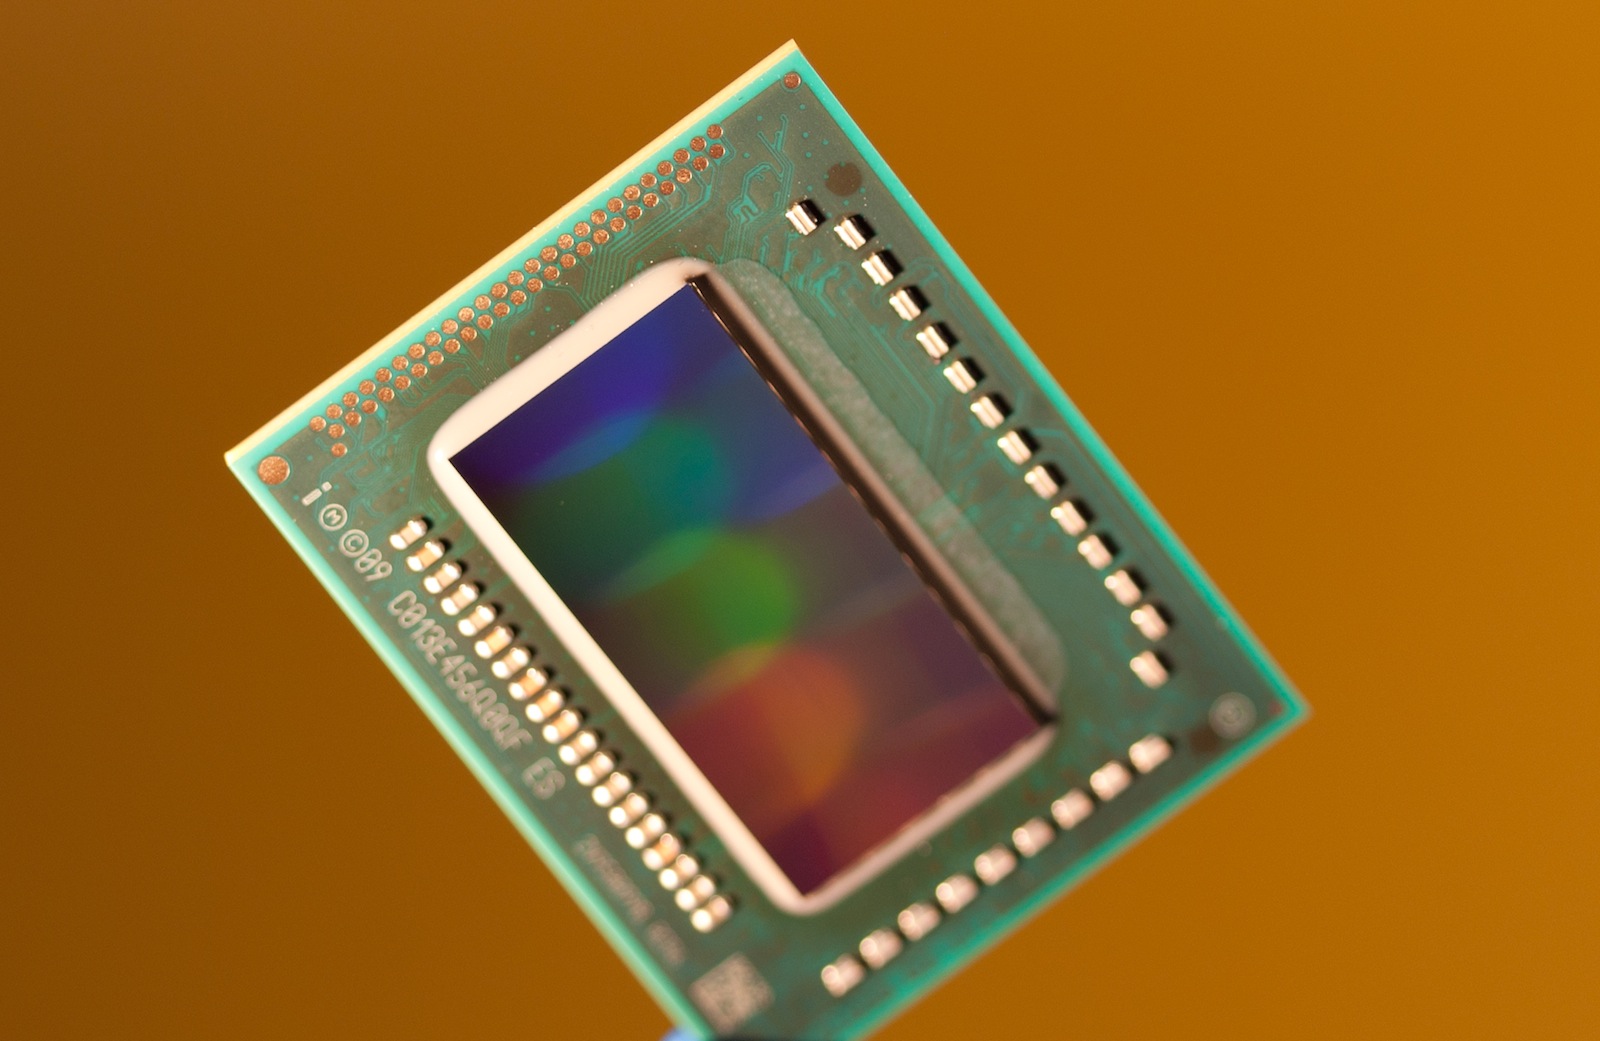
The Intel Core i7-3635QM is a fast quad-core processor for laptops based on the Ivy Bridge architecture. Due to Hyperthreading, the four cores can handle up to eight threads in parallel leading to better utilization of the CPU. Each core offers a base speed of 2.4 GHz but can dynamically increase clock rates with Turbo Boost up to 3.2 GHz (for 4 active cores), 3.3 GHz (for 2 active cores) and 3.4 GHz (for 1 active core). In contrast to the 3630QM, the 3635QM has a different package (BGA) and a slightly higher GPU clock.

Ivy Bridge is an enhanced die shrink of the Sandy Bridge architecture with improvements on both GPU and CPU performance. The CPUs are produced in 22nm (versus 32nm Sandy Bridge CPUs) and are the first to introduce 3D transistors for increased energy efficiency when compared to similarly clocked Sandy Bridge processors. Other new features are integrated PCI Express 3.0 and  DDR3(L)-1600 support.

The performance of the Core i7-3635QM is slightly above a similarly clocked Sandy Bridge processor due to slight architectural improvements. As a result, overall performance is similar to the fastest Sandy Bridge model, the Core i7-2960XM.

The integrated Intel HD Graphics 4000 offers 16 Execution Units (EUs) clocked at 650 MHz up to 1200 MHz with Turbo Boost, making it one of the faster variants.

As with most quad-core Ivy Bridge models, the Core i7-3635QM is specified at a TDP of 45 Watts including graphics card and memory controller. Therefore, the CPU is well-suited for laptops 15-inches or greater.

Intel Celeron N5095

► remove from comparison Intel Celeron N5095

The Celeron N5095 is an inexpensive quad-core SoC of the Jasper Lake product family designed for use in affordable SFF desktops and laptops. It features four Tremont CPU cores running at 2 GHz that Boost to up to 2.9 GHz with no thread-doubling Hyper-Threading technology in sight. A pretty basic iGPU is present as well.

The only difference between the N5095 and the N5095A is that the latter comes with support for more proprietary Intel technologies such as the Smart Sound DSP, Wake on Voice and HD Audio.

Architecture and Features

Tremont brings many improvements over Goldmont Plus, the architecture that we know from the N5030 and myriads of other N-class CPUs. An up to 30% boost in single-thread performance is to be expected thanks to smarter prefetchers, branch prediction improvements and other refinements, according to Intel. These new chips are physically larger than their immediate predecessors as a result. Either way, this is still a "small" core rather than a "big" one according to ChipsAndCheese.

The Celeron has 1.5 MB of L2 and 4 MB of L3 cache and is compatible with DDR4-2933 and LPDDR4x-2933 memory or slower. Support for Intel CNVi Wi-Fi 6 modules is baked into the chip, as are 8 PCIe 3.0 lanes for NVMe SSD speeds up to 3.9 GB/s. USB 4 or Thunderbolt aren't supported however.

Please also note that the Celeron gets soldered to the motherboard (BGA1338 socket interface) for good and is thus not user-replaceable.

Performance

The average N5095 in our database is about as fast as the Core i3-10110U, Core i3-1005G1, Celeron N5105 and also the Ryzen 3 3200U in multi-threaded workloads. Which is just enough for the most basic of tasks in late 2024.

Performance will get a significant hit if the power target is set to 10 W or 6 W instead of the Intel-recommended 15 W value.

Graphics

The DirectX 12.1-capable 16 EU UHD Graphics runs at up to 750 MHz and is in many respects similar to what Ice Lake CPUs come equipped with. This graphics adapter is capable of driving up to 3 SUHD displays simultaneously; HEVC, AVC, VP9, MPEG-2 and other popular video codecs can all be hardware-decoded. AV1 and VVC can't.

As far as gaming is concerned, it is reasonable to expect playable framerates in really old games (like Dota 2 Reborn) provided one sticks to lower resolutions such as HD 720p.

Power consumption

While most N-class chips have a 6 W long-term power target, the Celeron N5095 has a 15 W TDP to mimic much faster U-class Core processors. This isn't a great CPU for passively cooled designs.

The N5095 is built with the same 10 nm Intel process as Ice Lake-U processors for pretty unimpressive power efficiency, as of late 2024.

ModelIntel Celeron N4505Intel Core i7-3635QMIntel Celeron N5095
CodenameJasper LakeIvy BridgeJasper Lake
SeriesIntel Jasper LakeIntel Core i7Intel Jasper Lake
Series: Jasper Lake Jasper Lake
Intel Pentium Silver N60052 - 3.3 GHz4 / 4 cores4 MB L3
Intel Pentium Silver N60001.1 - 3.3 GHz4 / 4 cores4 MB L3
Intel Celeron N5095A2 - 2.9 GHz4 / 4 cores4 MB L3
Intel Celeron N50952 - 2.9 GHz4 / 4 cores4 MB L3
Intel Celeron N51052 - 2.9 GHz4 / 4 cores4 MB L3
Intel Celeron N51001.1 - 2.8 GHz4 / 4 cores4 MB L3
Intel Celeron N4505 « 2 - 2.9 GHz2 / 2 cores4 MB L3
Intel Celeron N45001.1 - 2.8 GHz2 / 2 cores4 MB L3
Intel Core i7-3940XM3 - 3.9 GHz4 / 8 cores8 MB L3
Intel Core i7-3920XM2.9 - 3.8 GHz4 / 8 cores8 MB L3
Intel Core i7-3840QM2.8 - 3.8 GHz4 / 8 cores8 MB L3
Intel Core i7-3820QM2.7 - 3.7 GHz4 / 8 cores8 MB L3
Intel Core i7-3740QM2.7 - 3.7 GHz4 / 8 cores6 MB L3
Intel Core i7-3720QM2.6 - 3.6 GHz4 / 8 cores6 MB L3
Intel Core i7-3635QM « 2.4 - 3.4 GHz4 / 8 cores6 MB L3
Intel Core i7-3630QM2.4 - 3.4 GHz4 / 8 cores6 MB L3
Intel Core i7-3615QM2.3 - 3.3 GHz4 / 8 cores6 MB L3
Intel Core i7-3610QM2.3 - 3.3 GHz4 / 8 cores6 MB L3
Intel Core i7-3632QM2.2 - 3.2 GHz4 / 8 cores6 MB L3
Intel Core i7-3612QM2.1 - 3.1 GHz4 / 8 cores6 MB L3
Intel Core i7-3540M3 - 3.7 GHz2 / 4 cores4 MB L3
Intel Core i7-3520M2.9 - 3.6 GHz2 / 4 cores4 MB L3
Intel Core i7-3687U2.1 - 3.3 GHz2 / 4 cores4 MB L3
Intel Core i7-3667U2 - 3.2 GHz2 / 4 cores4 MB L3
Intel Core i7-3537U2 - 3.1 GHz2 / 4 cores4 MB L3
Intel Core i7-3517U1.9 - 3 GHz2 / 4 cores4 MB L3
Intel Core i7-3689Y1.5 - 2.6 GHz2 / 4 cores4 MB L3
Intel Pentium Silver N60052 - 3.3 GHz4 / 4 cores4 MB L3
Intel Pentium Silver N60001.1 - 3.3 GHz4 / 4 cores4 MB L3
Intel Celeron N5095A2 - 2.9 GHz4 / 4 cores4 MB L3
Intel Celeron N5095 « 2 - 2.9 GHz4 / 4 cores4 MB L3
Intel Celeron N51052 - 2.9 GHz4 / 4 cores4 MB L3
Intel Celeron N51001.1 - 2.8 GHz4 / 4 cores4 MB L3
Intel Celeron N45052 - 2.9 GHz2 / 2 cores4 MB L3
Intel Celeron N45001.1 - 2.8 GHz2 / 2 cores4 MB L3
Clock2000 - 2900 MHz2400 - 3400 MHz2000 - 2900 MHz
L2 Cache1.5 MB1 MB1.5 MB
L3 Cache4 MB6 MB4 MB
Cores / Threads2 / 24 / 84 / 4
4 x 2.9 GHz Intel Tremont
TDP10 Watt45 Watt15 Watt
Technology10 nm22 nm10 nm
max. Temp.105 °C105 °C105 °C
SocketBGA1338BGABGA1338
FeaturesDDR4-2933/LPDDR4x-2933 RAM, PCIe 3, GNA, MMX, SSE, SSE2, SSE3, SSSE3, SSE4.1, SSE4.2, SMEP, SMAP, EIST, TM1, TM2, Turbo, SST, AES-NI, RDRAND, RDSEED, SHAHD Graphics 4000, DDR3(L)-1600 Memory Controller, HyperThreading, AVX, Quick Sync, VirtualizationDDR4-2933/LPDDR4x-2933 RAM, PCIe 3, GNA, MMX, SSE, SSE2, SSE3, SSSE3, SSE4.1, SSE4.2, VMX, SMEP, SMAP, EIST, TM1, TM2, Turbo, SST, AES-NI, RDRAND, RDSEED, SHA
iGPUIntel UHD Graphics (Jasper Lake 16 EU) (450 - 750 MHz)Intel HD Graphics 4000 (650 - 1200 MHz)Intel UHD Graphics (Jasper Lake 16 EU) (450 - 750 MHz)
Architecturex86x86x86
Announced
Manufacturerark.intel.comark.intel.comark.intel.com
L1 Cache256 KB
Transistors1400 Million
Die Size160 mm2

Benchmarks

Performance Rating - CB R15 + R20 + 7-Zip + X265 + Blender + 3DM11 CPU - Celeron N4505
19.2 pt (32%)
Restrict / Search: Model: Max. age: years
Performance Rating - CB R15 + R20 + 7-Zip + X265 + Blender + 3DM11 CPU - Celeron N5095
20.6 pt (34%)
Restrict / Search: Model: Max. age: years
Cinebench R23 - Cinebench R23 Multi Core
min: 1114     avg: 1149     median: 1148.5 (1%)     max: 1183 Points
min: 2150     avg: 2174     median: 2164 (2%)     max: 2219 Points
Cinebench R23 - Cinebench R23 Single Core
min: 592     avg: 604     median: 603.5 (25%)     max: 615 Points
min: 587     avg: 608     median: 611 (26%)     max: 621 Points
Cinebench R20 - Cinebench R20 CPU (Single Core)
min: 224     avg: 230     median: 230 (25%)     max: 236 Points
min: 228     avg: 234     median: 234 (25%)     max: 239 Points
Cinebench R20 - Cinebench R20 CPU (Multi Core)
min: 431     avg: 441.5     median: 441.5 (1%)     max: 452 Points
min: 804     avg: 825     median: 827 (2%)     max: 844 Points
Cinebench R15 - Cinebench R15 CPU Multi 64 Bit
min: 191     avg: 197.5     median: 197.5 (1%)     max: 204 Points
min: 221     avg: 343     median: 364 (2%)     max: 379 Points
Cinebench R15 - Cinebench R15 CPU Single 64 Bit
min: 104     avg: 106     median: 106 (29%)     max: 108 Points
min: 95.4     avg: 103.9     median: 106 (29%)     max: 109 Points
Cinebench R11.5 - Cinebench R11.5 CPU Multi 64 Bit
min: 2.46     avg: 2.5     median: 2.5 (3%)     max: 2.52 Points
min: 6.38     avg: 6.4     median: 6.4 (8%)     max: 6.47 Points
min: 4.65     avg: 4.7     median: 4.7 (6%)     max: 4.76 Points
Cinebench R11.5 - Cinebench R11.5 CPU Single 64 Bit
min: 1.27     avg: 1.3     median: 1.3 (30%)     max: 1.28 Points
min: 1.37     avg: 1.4     median: 1.4 (33%)     max: 1.39 Points
min: 1.25     avg: 1.3     median: 1.3 (30%)     max: 1.29 Points
Cinebench R10 - Cinebench R10 Rend. Single (32bit)
min: 3606     avg: 3622     median: 3621.5 (22%)     max: 3637 Points
min: 4600     avg: 4648     median: 4660 (28%)     max: 4685 Points
min: 3527     avg: 3545     median: 3544.5 (21%)     max: 3562 Points
Cinebench R10 - Cinebench R10 Rend. Multi (32bit)
min: 6831     avg: 6861     median: 6860.5 (5%)     max: 6890 Points
min: 17688     avg: 17855     median: 17865 (13%)     max: 18011 Points
min: 12218     avg: 12283     median: 12283 (9%)     max: 12348 Points
Cinebench R10 - Cinebench R10 Rend. Multi (64bit)
10063 Points (6%)
min: 21471     avg: 21961     median: 22047.5 (14%)     max: 22277 Points
min: 16442     avg: 16860     median: 16860 (11%)     max: 17278 Points
Cinebench R10 - Cinebench R10 Rend. Single (64bit)
5294 Points (6%)
min: 5819     avg: 5885     median: 5891 (7%)     max: 5937 Points
min: 5224     avg: 5338     median: 5337.5 (7%)     max: 5451 Points
wPrime 2.10 - wPrime 2.0 1024m *
min: 1120.44     avg: 1132     median: 1131.7 (13%)     max: 1143 s
min: 267.2     avg: 301.2     median: 276.5 (3%)     max: 359.9 s
min: 605.375     avg: 611     median: 611.4 (7%)     max: 617.326 s
wPrime 2.10 - wPrime 2.0 32m *
min: 35.481     avg: 35.8     median: 35.8 (7%)     max: 36.2 s
min: 8.4     avg: 9.6     median: 8.9 (2%)     max: 11.42 s
min: 19.202     avg: 19.5     median: 19.5 (4%)     max: 19.779 s
wPrime 1.55 - wPrime 1.55 32m *
36.1 s (19%)
WinRAR - WinRAR 4.0
min: 1000     avg: 1062     median: 1061.5 (2%)     max: 1123 Points
min: 3855     avg: 4200     median: 4199.5 (7%)     max: 4544 Points
min: 1630     avg: 1706     median: 1705.5 (3%)     max: 1781 Points
7-Zip 18.03 - 7-Zip 18.03 Multi Thread 4 runs
min: 5871     avg: 6004     median: 6003.5 (3%)     max: 6136 MIPS
min: 10924     avg: 11024     median: 11013 (6%)     max: 11168 MIPS
7-Zip 18.03 - 7-Zip 18.03 Single Thread 4 runs
min: 2971     avg: 3047     median: 3046.5 (36%)     max: 3122 MIPS
min: 2935     avg: 3074     median: 3100 (37%)     max: 3124 MIPS
X264 HD Benchmark 4.0 - x264 Pass 2
min: 13.5     avg: 13.7     median: 13.7 (5%)     max: 13.8 fps
min: 35.28     avg: 35.4     median: 35.4 (12%)     max: 35.6 fps
min: 24.75     avg: 25     median: 25 (8%)     max: 25.25 fps
X264 HD Benchmark 4.0 - x264 Pass 1
72.3 fps (17%)
min: 134.5     avg: 138.1     median: 138.1 (32%)     max: 141.6 fps
min: 112.75     avg: 116.5     median: 116.5 (27%)     max: 120.25 fps
HWBOT x265 Benchmark v2.2 - HWBOT x265 4k Preset
min: 1.16     avg: 1.2     median: 1.2 (2%)     max: 1.22 fps
min: 1.9     avg: 2     median: 2 (4%)     max: 2.05 fps
TrueCrypt - TrueCrypt Serpent
min: 0.099     avg: 0.1     median: 0.1 (3%)     max: 0.101 GB/s
min: 0.14     avg: 0.2     median: 0.2 (7%)     max: 0.327 GB/s
0.2 GB/s (6%)
TrueCrypt - TrueCrypt Twofish
min: 0.184     avg: 0.2     median: 0.2 (3%)     max: 0.192 GB/s
min: 0.454     avg: 0.5     median: 0.5 (9%)     max: 0.549 GB/s
0.4 GB/s (6%)
TrueCrypt - TrueCrypt AES
1.3 GB/s (3%)
min: 3     avg: 3.1     median: 3.1 (8%)     max: 3.1 GB/s
2.5 GB/s (7%)
Blender - Blender 3.3 Classroom CPU *
min: 5719     avg: 5742     median: 5741.5 (73%)     max: 5764 Seconds
2936 Seconds (37%)
Blender - Blender 2.79 BMW27 CPU *
min: 2845     avg: 2899     median: 2899 (20%)     max: 2953 Seconds
min: 1502     avg: 1548     median: 1547 (11%)     max: 1624 Seconds
R Benchmark 2.5 - R Benchmark 2.5 *
min: 1.162     avg: 1.2     median: 1.2 (26%)     max: 1.224 sec
min: 1.16     avg: 1.2     median: 1.2 (25%)     max: 1.2 sec
3DMark 06 - CPU - 3DMark 06 - CPU
min: 3165     avg: 3214     median: 3214 (7%)     max: 3263 Points
min: 6432     avg: 6483     median: 6492 (14%)     max: 6517 Points
min: 5266     avg: 5272     median: 5272 (11%)     max: 5278 Points
Super Pi mod 1.5 XS 1M - Super Pi mod 1.5 XS 1M *
min: 19.931     avg: 20.9     median: 20.9 (5%)     max: 21.9 s
min: 11.16     avg: 11.4     median: 11.2 (2%)     max: 11.7 s
20.5 s (4%)
Super Pi mod 1.5 XS 2M - Super Pi mod 1.5 XS 2M *
min: 44.275     avg: 45.7     median: 45.7 (2%)     max: 47.2 s
min: 25.83     avg: 26.1     median: 25.8 (1%)     max: 26.5 s
45.7 s (2%)
Super Pi Mod 1.5 XS 32M - Super Pi mod 1.5 XS 32M *
min: 997     avg: 1003     median: 1003.5 (4%)     max: 1009.94 s
min: 624     avg: 626     median: 625 (3%)     max: 629 s
1039 s (5%)
SiSoft Sandra Dhrystone (MIPS) - SiSoft Sandra Dhrystone (MIPS)
100%
1 3635QM +
min: 110140     avg: 118820     median: 118820 (56%)     max: 127500 MIPS
SiSoft Sandra Whetstone (MFLOPS) - SiSoft Sandra Whetstone (MFLOPS)
100%
1 3635QM +
min: 80710     avg: 80855     median: 80855 (62%)     max: 81000 MFLOPS
3DMark Vantage - 3DM Vant. Perf. CPU no Physx
6156 Points (5%)
361%
1 3635QM +
min: 20530     avg: 21871     median: 22225.5 (17%)     max: 22501 Points
3DMark 11 - 3DM11 Performance Physics
min: 2700     avg: 2720     median: 2719.5 (7%)     max: 2739 Points
min: 6023     avg: 6732     median: 7054 (17%)     max: 7235 Points
min: 4224     avg: 4309     median: 4287 (11%)     max: 4439 Points
3DMark - 3DMark Ice Storm Physics
24182 Points (20%)
min: 31200     avg: 33452     median: 34461 (28%)     max: 34696 Points
min: 41689     avg: 42092     median: 42091.5 (34%)     max: 42494 Points
3DMark - 3DMark Ice Storm Extreme Physics
min: 24027     avg: 24121     median: 24121 (20%)     max: 24215 Points
min: 41654     avg: 42066     median: 42065.5 (34%)     max: 42477 Points
3DMark - 3DMark Ice Storm Unlimited Physics
min: 25571     avg: 25808     median: 25808 (21%)     max: 26045 Points
min: 46730     avg: 47458     median: 47458 (39%)     max: 48186 Points
3DMark - 3DMark Cloud Gate Physics
min: 2130     avg: 2131     median: 2130.5 (5%)     max: 2131 Points
min: 5633     avg: 5722     median: 5740 (15%)     max: 5792 Points
min: 3720     avg: 3823     median: 3846 (10%)     max: 3888 Points
3DMark - 3DMark Fire Strike Standard Physics
min: 2979     avg: 2993     median: 2992.5 (5%)     max: 3006 Points
min: 7937     avg: 8037     median: 7965 (14%)     max: 8210 Points
min: 5400     avg: 5496     median: 5499 (10%)     max: 5572 Points
3DMark - 3DMark Time Spy CPU
894 Points (4%)
min: 1595     avg: 1649     median: 1656 (7%)     max: 1696 Points
Geekbench 6.0 - Geekbench 6.0 Single-Core
508 Points (16%)
Geekbench 6.0 - Geekbench 6.0 Multi-Core
852 Points (3%)
Geekbench 5.5 - Geekbench 5.1 - 5.5 64 Bit Single-Core
min: 647     avg: 654     median: 653.5 (26%)     max: 660 Points
min: 637     avg: 649     median: 650.5 (25%)     max: 659 Points
Geekbench 5.5 - Geekbench 5.1 - 5.5 64 Bit Multi-Core
min: 1225     avg: 1232     median: 1232 (2%)     max: 1239 Points
min: 1933     avg: 2010     median: 2028 (4%)     max: 2052 Points
Geekbench 5.0 - Geekbench 5.0 64 Bit Single-Core
min: 645     avg: 648     median: 648 (3%)     max: 651 Points
min: 628     avg: 644     median: 646.5 (3%)     max: 655 Points
Geekbench 5.0 - Geekbench 5.0 64 Bit Multi-Core
min: 1205     avg: 1215     median: 1214.5 (4%)     max: 1224 Points
min: 1985     avg: 2029     median: 2030.5 (6%)     max: 2070 Points
Geekbench 4.4 - Geekbench 4.1 - 4.4 64 Bit Single-Core
min: 2942     avg: 2946     median: 2945.5 (29%)     max: 2949 Points
min: 2858     avg: 2896     median: 2900 (29%)     max: 2929 Points
Geekbench 4.4 - Geekbench 4.1 - 4.4 64 Bit Multi-Core
min: 5078     avg: 5082     median: 5082 (5%)     max: 5086 Points
min: 7759     avg: 7856     median: 7842 (8%)     max: 7968 Points
Geekbench 2 - 32 Bit - Geekbench Stream
100%
1 3635QM +
8423 Points (68%)
Geekbench 2 - 32 Bit - Geekbench Memory
100%
1 3635QM +
7446 Points (68%)
Geekbench 2 - 32 Bit - Geekbench Floating Point
100%
1 3635QM +
11831 Points (23%)
Geekbench 2 - 32 Bit - Geekbench Integer
100%
1 3635QM +
10805 Points (22%)
Geekbench 2 - 32 Bit - Geekbench Total Score
100%
1 3635QM +
10254 Points (27%)
Mozilla Kraken 1.1 - Kraken 1.1 Total Score *
min: 1578     avg: 1688     median: 1688 (2%)     max: 1798 ms
min: 1557     avg: 1578     median: 1571.5 (2%)     max: 1619 ms
Sunspider - Sunspider 1.0 Total Score *
353.4 ms (4%)
Octane V2 - Octane V2 Total Score
24502 Points (19%)
WebXPRT 4 - WebXPRT 4 Score
min: 79.3     avg: 80.3     median: 80.3 (22%)     max: 81.2 Points
min: 94.2     avg: 95.2     median: 95.2 (26%)     max: 96.2 Points
WebXPRT 3 - WebXPRT 3 Score
min: 113.3     avg: 114.2     median: 114.2 (20%)     max: 115 Points
min: 114.3     avg: 123.4     median: 125.3 (22%)     max: 127.2 Points
CrossMark - CrossMark Overall
min: 442     avg: 444     median: 444 (17%)     max: 446 Points
min: 473     avg: 486     median: 490 (18%)     max: 495 Points
Power Consumption - Prime95 Power Consumption - external Monitor *
min: 18.3     avg: 19     median: 19 (3%)     max: 19.7 Watt
min: 24.1     avg: 24.4     median: 24.4 (4%)     max: 24.8 Watt
Power Consumption - Cinebench R15 Multi Power Consumption - external Monitor *
min: 15.4     avg: 16.5     median: 16.5 (3%)     max: 17.6 Watt
min: 20.7     avg: 22     median: 22.1 (4%)     max: 23 Watt
Power Consumption - Idle Power Consumption - external Monitor *
8 Watt (5%)
4.9 Watt (3%)
Power Consumption - Power Efficiency - Cinebench R15 Multi external Monitor
13.2 Points per Watt (10%)
min: 15.6     avg: 17     median: 17.2 (13%)     max: 18.3 Points per Watt

Average Benchmarks Intel Celeron N4505 → 100% n=22

Average Benchmarks Intel Core i7-3635QM → 234% n=22

Average Benchmarks Intel Celeron N5095 → 157% n=22

- Range of benchmark values for this graphics card
red legend - Average benchmark values for this graphics card
* Smaller numbers mean a higher performance
1 This benchmark is not used for the average calculation

v1.33
log 13. 21:09:13

#0 ran 0s before starting gpusingle class +0s ... 0s

#1 checking url part for id 13113 +0s ... 0s

#2 checking url part for id 3582 +0s ... 0s

#3 checking url part for id 13189 +0s ... 0s

#4 redirected to Ajax server, took 1752433753s time from redirect:0 +0s ... 0s

#5 did not recreate cache, as it is less than 5 days old! Created at Sun, 13 Jul 2025 05:20:07 +0200 +0s ... 0s

#6 composed specs +0.009s ... 0.009s

#7 did output specs +0s ... 0.009s

#8 getting avg benchmarks for device 13113 +0.004s ... 0.013s

#9 got single benchmarks 13113 +0.007s ... 0.02s

#10 getting avg benchmarks for device 3582 +0.001s ... 0.02s

#11 got single benchmarks 3582 +0.008s ... 0.029s

#12 getting avg benchmarks for device 13189 +0.004s ... 0.032s

#13 got single benchmarks 13189 +0.007s ... 0.04s

#14 got avg benchmarks for devices +0s ... 0.04s

#15 min, max, avg, median took s +0.061s ... 0.101s

#16 return log +0s ... 0.101s

Please share our article, every link counts!
Mail Logo
> Expert Reviews and News on Laptops, Smartphones and Tech Innovations > Benchmarks / Tech > Processor Comparison - Head 2 Head
Redaktion, 2017-09- 8 (Update: 2023-07- 1)