Notebookcheck Logo

Apple M3 Pro 11-Core vs Intel Core i5-13500T vs Intel Core i5-13600K

Apple M3 Pro 11-Core

► remove from comparison Apple Apple M3 Pro 11-Core

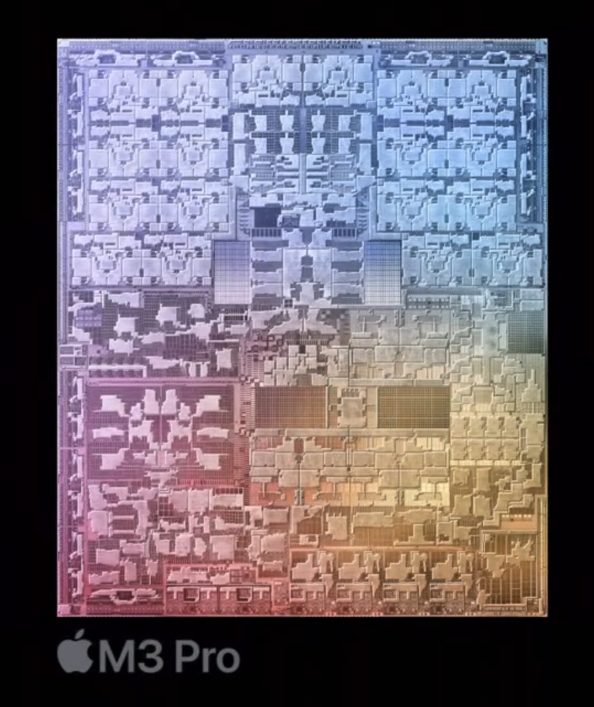
The Apple M3 Pro 11 Core is a system on a chip (SoC) from Apple for notebooks that was introduced late 2023. It integrates 11 of the 12 CPU cores with 5 of 6 performance cores with up to 4.06 GHz and 6 efficiency cores with 2.8 GHz.

Compared to the M2 Pro the M3 Pro has been slimmed down somewhat and swaps two performance cores for efficiency cores. This is due to the changed core configuration, as 6 cores are now used per cluster (the M2 Pro and M3 still have 4 cores per cluster). Furthermore, the memory bus has been reduced from 256 bits to 192 bits (150 GB/s vs. 200 GB/s). Thanks to the new architecture and higher clock rates, the new M3 Pro is still slightly faster.

The M3 Pro also integrates a new graphics card with dynamic caching, mesh shading and ray tracing acceleration via hardware. In the entry-level model, only 14 of the chip's 18 cores are used and support up to 3 displays simultaneously (internal and 2 external).

GPU and CPU can jointly access the shared memory on the package (unified memory). This is available in 18 or 36 GB variants and offers 150 GB/s maximum bandwidth (192 bit bus).

The integrated 16-core Neural Engine has also been revised and now offers 18 TOPS peak performance (compared to 15.8 TOPS in the M2 but 35 TOPS in the new A17 Pro). The video engine now also supports AV1 decoding in hardware. H.264, HEVC and ProRes (RAW) can still be decoded and encoded.

Unfortunately, the integrated WLAN only continues to support WiFi 6E (no WiFi 7), unlike the small M3 SoC thunderbolt 4 is also supported (max 40 Gbit/s).

The chip is manufactured in the current 3nm process (N3B) at TSMC and contains 37 billion transistors (-7.5% vs. Apple M2 Pro).

Intel Core i5-13500T

► remove from comparison

The Intel Core i5-13500T is a fast and very economical desktop processor based on the Raptor Lake architecture, which was introduced in October 2022. The processor offers a base clock of 1.6 GHz and reaches up to 4.6 GHz in Turbo. The hybrid CPU architecture, which was introduced with Alder Lake, also benefits the Raptor Lake processors. The suffix T stands for a particularly economical CPU model, and with a TDP of just 35 watts (PL1 = 35 watts), these processors are ideally suited for small, compact systems.

Performance

The low power consumption ultimately results in slightly lower performance compared to the Intel Core i5-13500. Depending on how the PL2 (92 watts) is defined, there may be noticeable differences in multi-core performance. Compared to the Intel Core i5-12500T, the Intel Core i5-13500T is superior due to the higher number of physical computing units.

Graphics unit

Like the Intel Core i5-12500T, the Intel Core i5-13500T offers an integrated graphics unit. The Intel Iris Xe architecture continues to serve as the basis. In terms of performance, however, not much has changed with the new Intel UHD Graphics 770. The iGPU of the Intel Core i5-13500T also clocks 100 MHz higher, but this does not make a noticeable difference in everyday use.

Power consumption

The TDP of the Intel Core i5-13500T is 35 watts, with the option to increase this to up to 92 watts in Turbo mode. Compared to the Intel Core i5-12500T (PL2 = 74 watts), the maximum possible energy requirement increases slightly.

Intel Core i5-13600K

► remove from comparison Intel i5-13600K

The Intel Core i5-13600K is a fast mid-range desktop processor of the Raptor Lake series. It includes a hybrid architecture for the CPU cores with combined 14 cores. Six fast Raptor Cove performance cores (P-cores) with HyperThreading and a clock speed of 3.5 - 5.1 GHz and eight Gracemont efficiency cores without HyperThreading and a clock speed of 2.6 - 3.9 GHz.

Thanks to the faster P-cores and more E-cores, the i5-13600K is significantly faster than the old i5-12600K (especially in multi-threaded workloads. 

The 13600K is rated at 125 Watt TDP base power (PL1) and 181 Watt Turbo Power (PL2) and therefore slightly higher than the old Core i5-12600K.

ModelApple M3 Pro 11-CoreIntel Core i5-13500TIntel Core i5-13600K
SeriesApple M3Intel Raptor Lake-SIntel Raptor Lake-S
Series: Raptor Lake-S Raptor Lake
Apple M3 Max 16-Core2.75 - 4.06 GHz16 / 16 cores
Apple M3 Max 14-Core2.75 - 4.06 GHz14 / 14 cores
Apple M3 Pro 12-Core2.75 - 4.06 GHz12 / 12 cores
Apple M3 Pro 11-Core « 2.75 - 4.06 GHz11 / 11 cores
Apple M32.75 - 4.06 GHz8 / 8 cores
Intel Core i9-13900K3 - 5.8 GHz24 / 32 cores36 MB L3
Intel Core i7-13700K3.4 - 5.4 GHz16 / 24 cores30 MB L3
Intel Core i5-13600K3.5 - 5.1 GHz14 / 20 cores24 MB L3
Intel Core i7-14701TE2.1 - 5.2 GHz8 / 16 cores33 MB L3
Intel Core i5-135002.5 - 4.8 GHz14 / 20 cores24 MB L3
Intel Core i5-14501TE2.2 - 5.1 GHz6 / 12 cores12 MB L3
Intel Core i5-14501E3.3 - 5.2 GHz6 / 12 cores24 MB L3
Intel Core i5-14401E2.5 - 4.7 GHz6 / 12 cores12 MB L3
Intel Core i5-14401TE2 - 4.5 GHz6 / 12 cores12 MB L3
Intel Core i5-13500T « 1.6 - 4.6 GHz14 / 20 cores24 MB L3
Intel Core i9-13900K3 - 5.8 GHz24 / 32 cores36 MB L3
Intel Core i7-13700K3.4 - 5.4 GHz16 / 24 cores30 MB L3
Intel Core i5-13600K « 3.5 - 5.1 GHz14 / 20 cores24 MB L3
Intel Core i7-14701TE2.1 - 5.2 GHz8 / 16 cores33 MB L3
Intel Core i5-135002.5 - 4.8 GHz14 / 20 cores24 MB L3
Intel Core i5-14501TE2.2 - 5.1 GHz6 / 12 cores12 MB L3
Intel Core i5-14501E3.3 - 5.2 GHz6 / 12 cores24 MB L3
Intel Core i5-14401E2.5 - 4.7 GHz6 / 12 cores12 MB L3
Intel Core i5-14401TE2 - 4.5 GHz6 / 12 cores12 MB L3
Intel Core i5-13500T1.6 - 4.6 GHz14 / 20 cores24 MB L3
Clock2748 - 4056 MHz1600 - 4600 MHz3500 - 5100 MHz
Cores / Threads11 / 11
5 x 4.1 GHz Apple M3 P-Core
6 x 2.7 GHz Apple M3 E-Core
14 / 20
6 x 4.6 GHz Intel Golden Cove P-Core
8 x 3.2 GHz Intel Gracemont E-Core
14 / 20
6 x 5.1 GHz Intel Raptor Cove P-Core
8 x 3.9 GHz Intel Gracemont E-Core
TDP27 Watt35 Watt125 Watt
Transistors37000 Million
Technology3 nm10 nm10 nm
FeaturesARMv8 Instruction SetIntel UHD Graphics 770, DDR5 4800 MT/s, DDR4 3200 MT/sIntel UHD Graphics 770, DDR5 5600 MT/s, DDR4 3200 MT/s
iGPUApple M3 Pro 14-Core GPUIntel UHD Graphics 770 (300 - 1550 MHz)Intel UHD Graphics 770 (300 - 1500 MHz)
NPU / AI18 TOPS INT8
ArchitectureARMx86x86
Announced
Manufacturerwww.apple.comwww.intel.com
CodenameRaptor LakeRaptor Lake
L2 Cache11.5 MB20 MB
L3 Cache24 MB24 MB
TDP Turbo PL292 Watt
Die Size215 mm2257 mm2
max. Temp.100 °C100 °C
SocketLGA 1700LGA 1700
$319 U.S.

Benchmarks

Performance Rating - CB R15 + R20 + 7-Zip + X265 + Blender + 3DM11 CPU - i5-13500T
37 pt (62%)
Restrict / Search: Model: Max. age: years
Performance Rating - CB R15 + R20 + 7-Zip + X265 + Blender + 3DM11 CPU - i5-13600K
42.9 pt (71%)
Restrict / Search: Model: Max. age: years
Cinebench 2024 - Cinebench 2024 CPU Single Core
144 Points (81%)
104 Points (58%)
Cinebench 2024 - Cinebench 2024 CPU Multi Core
908 Points (17%)
577 Points (11%)
Cinebench R23 - Cinebench R23 Multi Core
13315 Points (12%)
11028 Points (10%)
min: 24174     avg: 24221     median: 24221 (22%)     max: 24268 Points
Cinebench R23 - Cinebench R23 Single Core
1942 Points (82%)
1754 Points (74%)
min: 1991     avg: 2001     median: 2000.5 (84%)     max: 2010 Points
Cinebench R20 - Cinebench R20 CPU (Single Core)
502 Points (55%)
669 Points (73%)
min: 766     avg: 771     median: 770.5 (84%)     max: 775 Points
Cinebench R20 - Cinebench R20 CPU (Multi Core)
3529 Points (9%)
4246 Points (10%)
min: 9217     avg: 9241     median: 9241 (23%)     max: 9265 Points
Cinebench R15 - Cinebench R15 CPU Multi 64 Bit
1913 Points (12%)
1945 Points (12%)
min: 3641     avg: 3642     median: 3642 (23%)     max: 3643 Points
Cinebench R15 - Cinebench R15 CPU Single 64 Bit
281 Points (78%)
247 Points (68%)
min: 286     avg: 287.5     median: 287.5 (80%)     max: 289 Points
Cinebench R11.5 - Cinebench R11.5 CPU Multi 64 Bit
21.3 Points (28%)
min: 42.2     avg: 42.3     median: 42.3 (55%)     max: 42.38 Points
Cinebench R11.5 - Cinebench R11.5 CPU Single 64 Bit
3.1 Points (72%)
min: 3.45     avg: 3.5     median: 3.5 (82%)     max: 3.48 Points
Cinebench R10 - Cinebench R10 Rend. Single (32bit)
8693 Points (53%)
min: 10710     avg: 10755     median: 10754.5 (65%)     max: 10799 Points
Cinebench R10 - Cinebench R10 Rend. Multi (32bit)
40528 Points (29%)
min: 67973     avg: 68880     median: 68879.5 (50%)     max: 69786 Points
Cinebench R10 - Cinebench R10 Rend. Multi (64bit)
62808 Points (40%)
min: 110412     avg: 110969     median: 110969 (71%)     max: 111526 Points
Cinebench R10 - Cinebench R10 Rend. Single (64bit)
14147 Points (17%)
min: 16074     avg: 16155     median: 16154.5 (20%)     max: 16235 Points
wPrime 2.10 - wPrime 2.0 1024m *
133.3 s (2%)
min: 172.189     avg: 174.9     median: 174.9 (2%)     max: 177.592 s
wPrime 2.10 - wPrime 2.0 32m *
4.8 s (1%)
min: 2.518     avg: 2.5     median: 2.5 (1%)     max: 2.527 s
WinRAR - WinRAR 4.0
6683 Points (11%)
min: 10937     avg: 10967     median: 10967 (17%)     max: 10997 Points
7-Zip 18.03 - 7-Zip 18.03 Multi Thread 4 runs
40034 MIPS (23%)
min: 89527     avg: 89587     median: 89587 (51%)     max: 89647 MIPS
7-Zip 18.03 - 7-Zip 18.03 Single Thread 4 runs
5840 MIPS (69%)
min: 6253     avg: 6378     median: 6377.5 (75%)     max: 6502 MIPS
X264 HD Benchmark 4.0 - x264 Pass 2
100.5 fps (3%)
min: 198.6     avg: 198.8     median: 198.8 (5%)     max: 199 fps
X264 HD Benchmark 4.0 - x264 Pass 1
259.5 fps (7%)
min: 387     avg: 387.5     median: 387.5 (10%)     max: 388 fps
HWBOT x265 Benchmark v2.2 - HWBOT x265 4k Preset
12.1 fps (21%)
min: 27.5     avg: 27.6     median: 27.6 (48%)     max: 27.6 fps
TrueCrypt - TrueCrypt Serpent
1 GB/s (29%)
1.7 GB/s (50%)
TrueCrypt - TrueCrypt Twofish
1.8 GB/s (31%)
min: 3.1     avg: 3.2     median: 3.2 (54%)     max: 3.2 GB/s
TrueCrypt - TrueCrypt AES
8.2 GB/s (21%)
min: 18.8     avg: 19.1     median: 19.1 (50%)     max: 19.4 GB/s
Blender - Blender 3.3 Classroom CPU *
355 Seconds (5%)
533 Seconds (7%)
224 Seconds (3%)
Blender - Blender 2.79 BMW27 CPU *
365 Seconds (3%)
291 Seconds (2%)
135 Seconds (1%)
R Benchmark 2.5 - R Benchmark 2.5 *
0.5 sec (10%)
min: 0.4048     avg: 0.4     median: 0.4 (9%)     max: 0.405 sec
3DMark 06 - CPU - 3DMark 06 - CPU
12818 Points (27%)
17627 Points (38%)
Super Pi mod 1.5 XS 1M - Super Pi mod 1.5 XS 1M *
8 s (2%)
min: 6.471     avg: 6.5     median: 6.5 (1%)     max: 6.58 s
Super Pi mod 1.5 XS 2M - Super Pi mod 1.5 XS 2M *
17.9 s (1%)
min: 14.876     avg: 14.9     median: 14.9 (1%)     max: 14.993 s
Super Pi Mod 1.5 XS 32M - Super Pi mod 1.5 XS 32M *
430.1 s (2%)
min: 328.929     avg: 331.4     median: 331.4 (1%)     max: 333.798 s
3DMark Vantage - 3DM Vant. Perf. CPU no Physx
54029 Points (42%)
97718 Points (75%)
3DMark 11 - 3DM11 Performance Physics
12162 Points (30%)
min: 30358     avg: 30419     median: 30419 (75%)     max: 30480 Points
3DMark - 3DMark Ice Storm Physics
70975 Points (58%)
min: 86734     avg: 86952     median: 86952 (71%)     max: 87170 Points
3DMark - 3DMark Ice Storm Extreme Physics
69547 Points (56%)
min: 87784     avg: 87861     median: 87860.5 (71%)     max: 87937 Points
3DMark - 3DMark Ice Storm Unlimited Physics
77848 Points (63%)
min: 88547     avg: 89321     median: 89321 (72%)     max: 90095 Points
3DMark - 3DMark Cloud Gate Physics
13665 Points (35%)
min: 26359     avg: 26394     median: 26394 (67%)     max: 26429 Points
3DMark - 3DMark Fire Strike Standard Physics
18673 Points (33%)
min: 35386     avg: 35395     median: 35395 (63%)     max: 35404 Points
3DMark - 3DMark Time Spy CPU
6210 Points (26%)
min: 17079     avg: 17102     median: 17101.5 (72%)     max: 17124 Points
Geekbench 6.5 - Geekbench 6.5 Single-Core
3113 Points (75%)
2393 Points (58%)
2750 Points (67%)
Geekbench 6.5 - Geekbench 6.5 Multi-Core
14412 Points (56%)
7327 Points (28%)
15890 Points (62%)
Geekbench 5.5 - Geekbench 5.1 - 5.5 64 Bit Single-Core
2331 Points (88%)
1716 Points (65%)
min: 1967     avg: 1973     median: 1973 (75%)     max: 1979 Points
Geekbench 5.5 - Geekbench 5.1 - 5.5 64 Bit Multi-Core
13312 Points (24%)
7377 Points (13%)
min: 16651     avg: 16671     median: 16670.5 (30%)     max: 16690 Points
Geekbench 5.0 - Geekbench 5.0 64 Bit Single-Core
1685 Points (7%)
min: 1931     avg: 1948     median: 1947.5 (8%)     max: 1964 Points
Geekbench 5.0 - Geekbench 5.0 64 Bit Multi-Core
7316 Points (23%)
min: 16497     avg: 16566     median: 16566 (52%)     max: 16635 Points
Geekbench 4.4 - Geekbench 4.1 - 4.4 64 Bit Single-Core
7069 Points (71%)
min: 8618     avg: 8625     median: 8624.5 (86%)     max: 8631 Points
Geekbench 4.4 - Geekbench 4.1 - 4.4 64 Bit Multi-Core
29164 Points (29%)
min: 60407     avg: 61014     median: 61014 (60%)     max: 61621 Points
Mozilla Kraken 1.1 - Kraken 1.1 Total Score *
374.1 ms (0%)
562 ms (1%)
min: 467     avg: 468     median: 468 (1%)     max: 469 ms
Octane V2 - Octane V2 Total Score
98732 Points (72%)
WebXPRT 4 - WebXPRT 4 Score
288 Points (79%)
WebXPRT 3 - WebXPRT 3 Score
431 Points (77%)
254 Points (46%)
min: 329     avg: 331     median: 331 (59%)     max: 333 Points
CrossMark - CrossMark Overall
1966 Points (74%)
1324 Points (50%)
min: 2237     avg: 2254     median: 2254 (84%)     max: 2271 Points
Power Consumption - Prime95 Power Consumption - external Monitor *
55.6 Watt (10%)
min: 278     avg: 313     median: 313 (54%)     max: 348 Watt
Power Consumption - Cinebench R15 Multi Power Consumption - external Monitor *
40.1 Watt (7%)
79.3 Watt (14%)
min: 245     avg: 265.5     median: 265.5 (48%)     max: 286 Watt
Power Consumption - Idle Power Consumption - external Monitor *
2.1 Watt (1%)
8.6 Watt (6%)
min: 69.3     avg: 73.3     median: 73.3 (48%)     max: 77.3 Watt
Power Consumption - Idle Power Consumption 150cd 1min *
4.8 Watt (6%)
Power Consumption - Power Efficiency - Cinebench R15 Multi external Monitor
47.7 Points per Watt (36%)
21.9 Points per Watt (16%)
min: 12.7     avg: 13.8     median: 13.8 (10%)     max: 14.9 Points per Watt

Average Benchmarks Apple M3 Pro 11-Core → 100% n=15

Average Benchmarks Intel Core i5-13500T → 84% n=15

Average Benchmarks Intel Core i5-13600K → 140% n=15

- Range of benchmark values for this graphics card
red legend - Average benchmark values for this graphics card
* Smaller numbers mean a higher performance
1 This benchmark is not used for the average calculation

v1.34
log 05. 07:36:43

#0 ran 0s before starting gpusingle class +0s ... 0s

#1 checking url part for id 16354 +0s ... 0s

#2 checking url part for id 17902 +0s ... 0s

#3 checking url part for id 14626 +0s ... 0s

#4 redirected to Ajax server, took 1759642603s time from redirect:0 +0s ... 0s

#5 did not recreate cache, as it is less than 5 days old! Created at Sat, 04 Oct 2025 05:18:30 +0200 +0s ... 0s

#6 composed specs +0.006s ... 0.006s

#7 did output specs +0s ... 0.006s

#8 getting avg benchmarks for device 16354 +0.001s ... 0.007s

#9 got single benchmarks 16354 +0.005s ... 0.011s

#10 getting avg benchmarks for device 17902 +0.004s ... 0.015s

#11 got single benchmarks 17902 +0.004s ... 0.019s

#12 getting avg benchmarks for device 14626 +0.004s ... 0.023s

#13 got single benchmarks 14626 +0.005s ... 0.029s

#14 got avg benchmarks for devices +0s ... 0.029s

#15 min, max, avg, median took s +0.058s ... 0.087s

#16 return log +0s ... 0.087s

Please share our article, every link counts!
Mail Logo
> Expert Reviews and News on Laptops, Smartphones and Tech Innovations > Benchmarks / Tech > Processor Comparison - Head 2 Head
Redaktion, 2017-09- 8 (Update: 2023-07- 1)